INFOGRAPHICS: January 2021 REBGV Greater Vancouver Market Reports

Home buyer demand remains elevated across Metro Vancouver
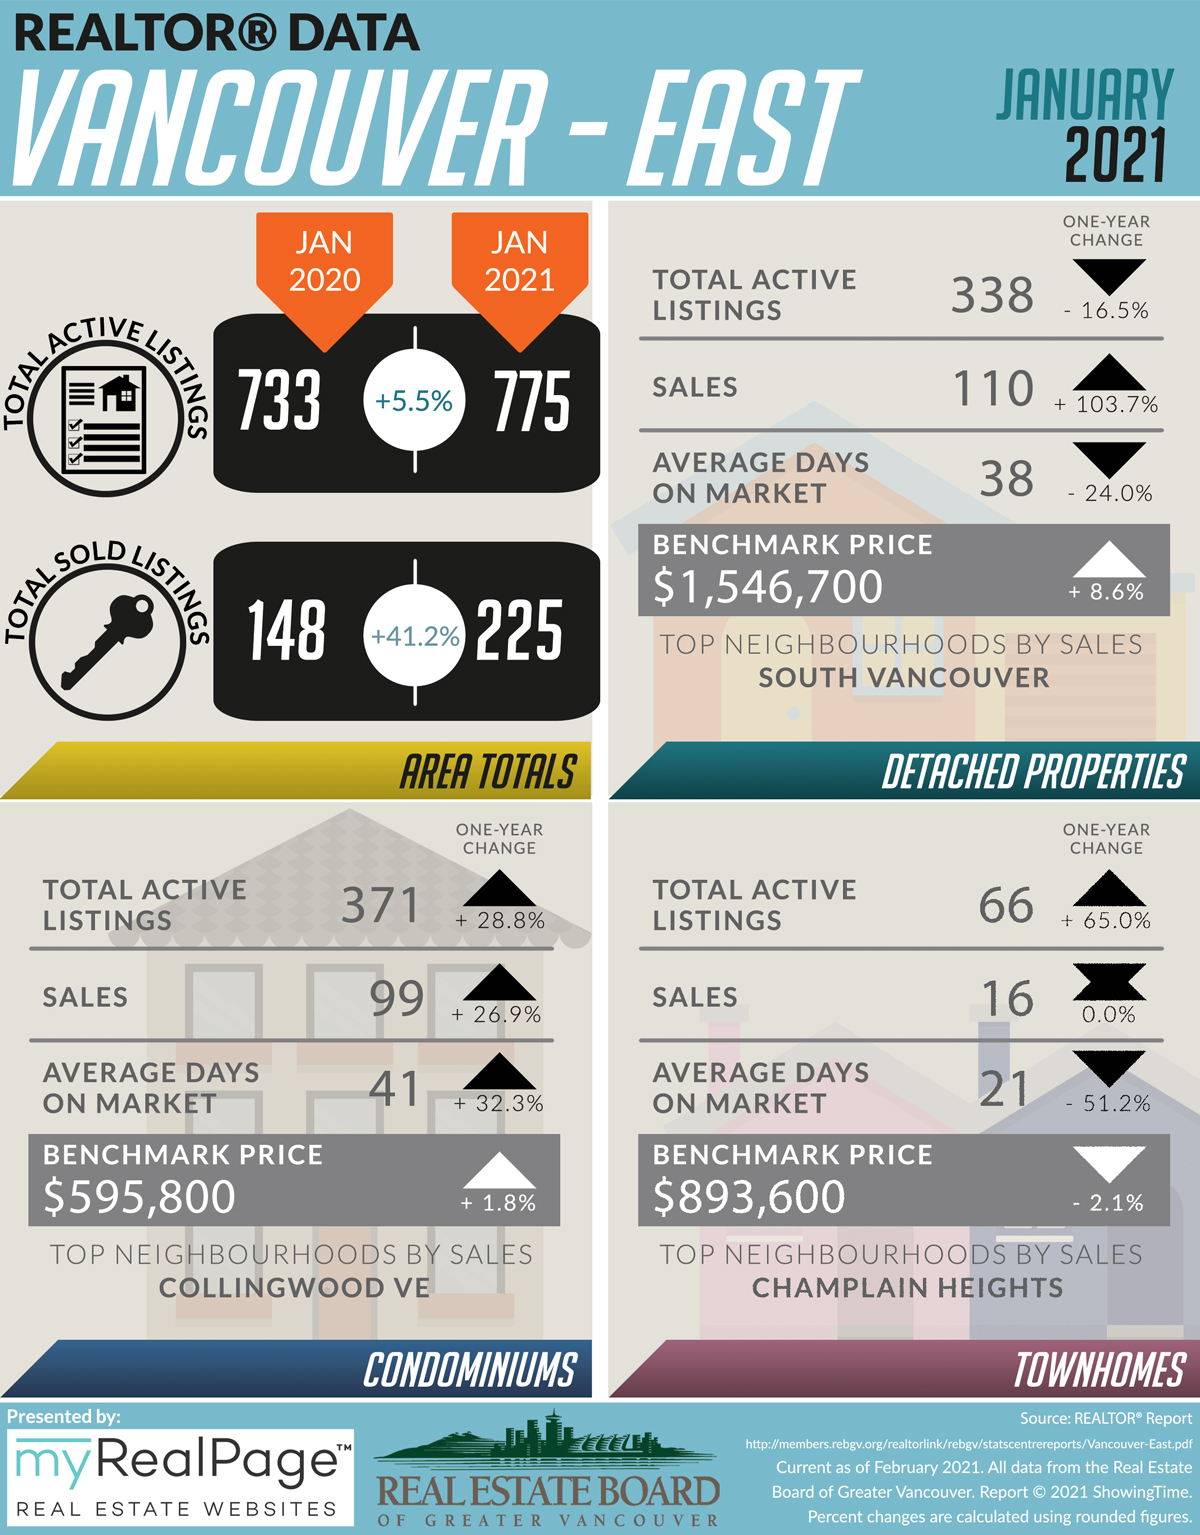
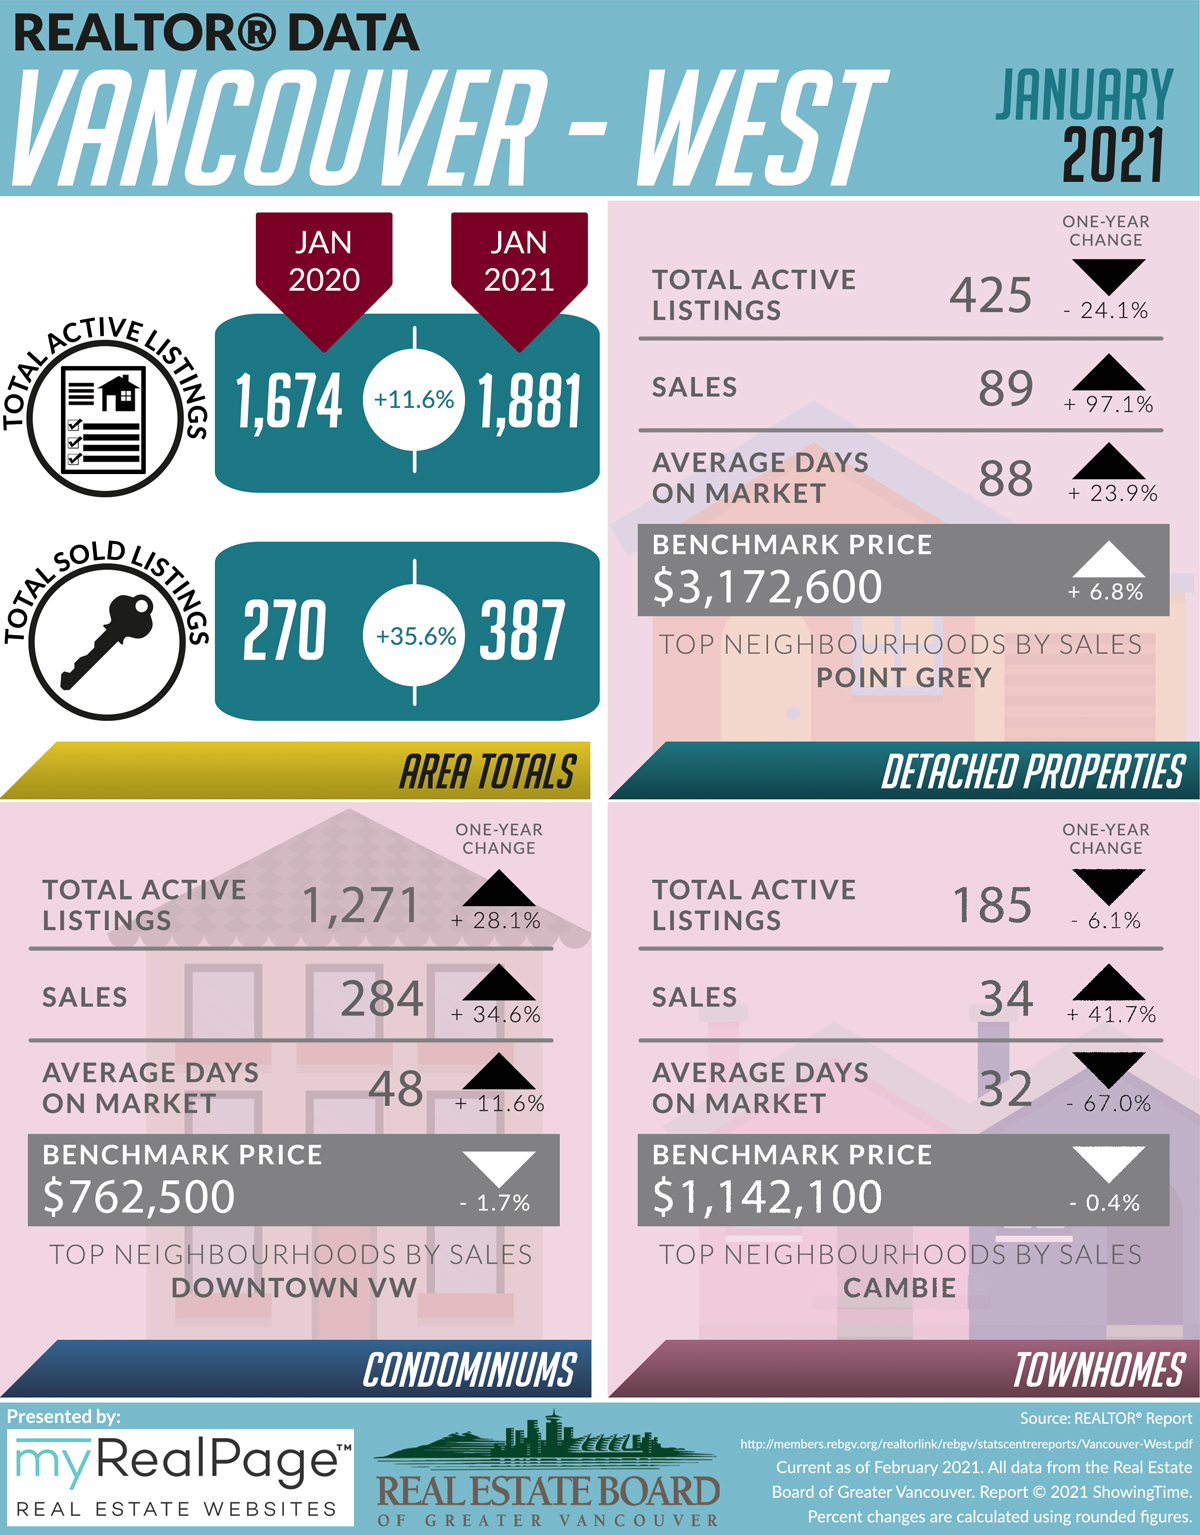
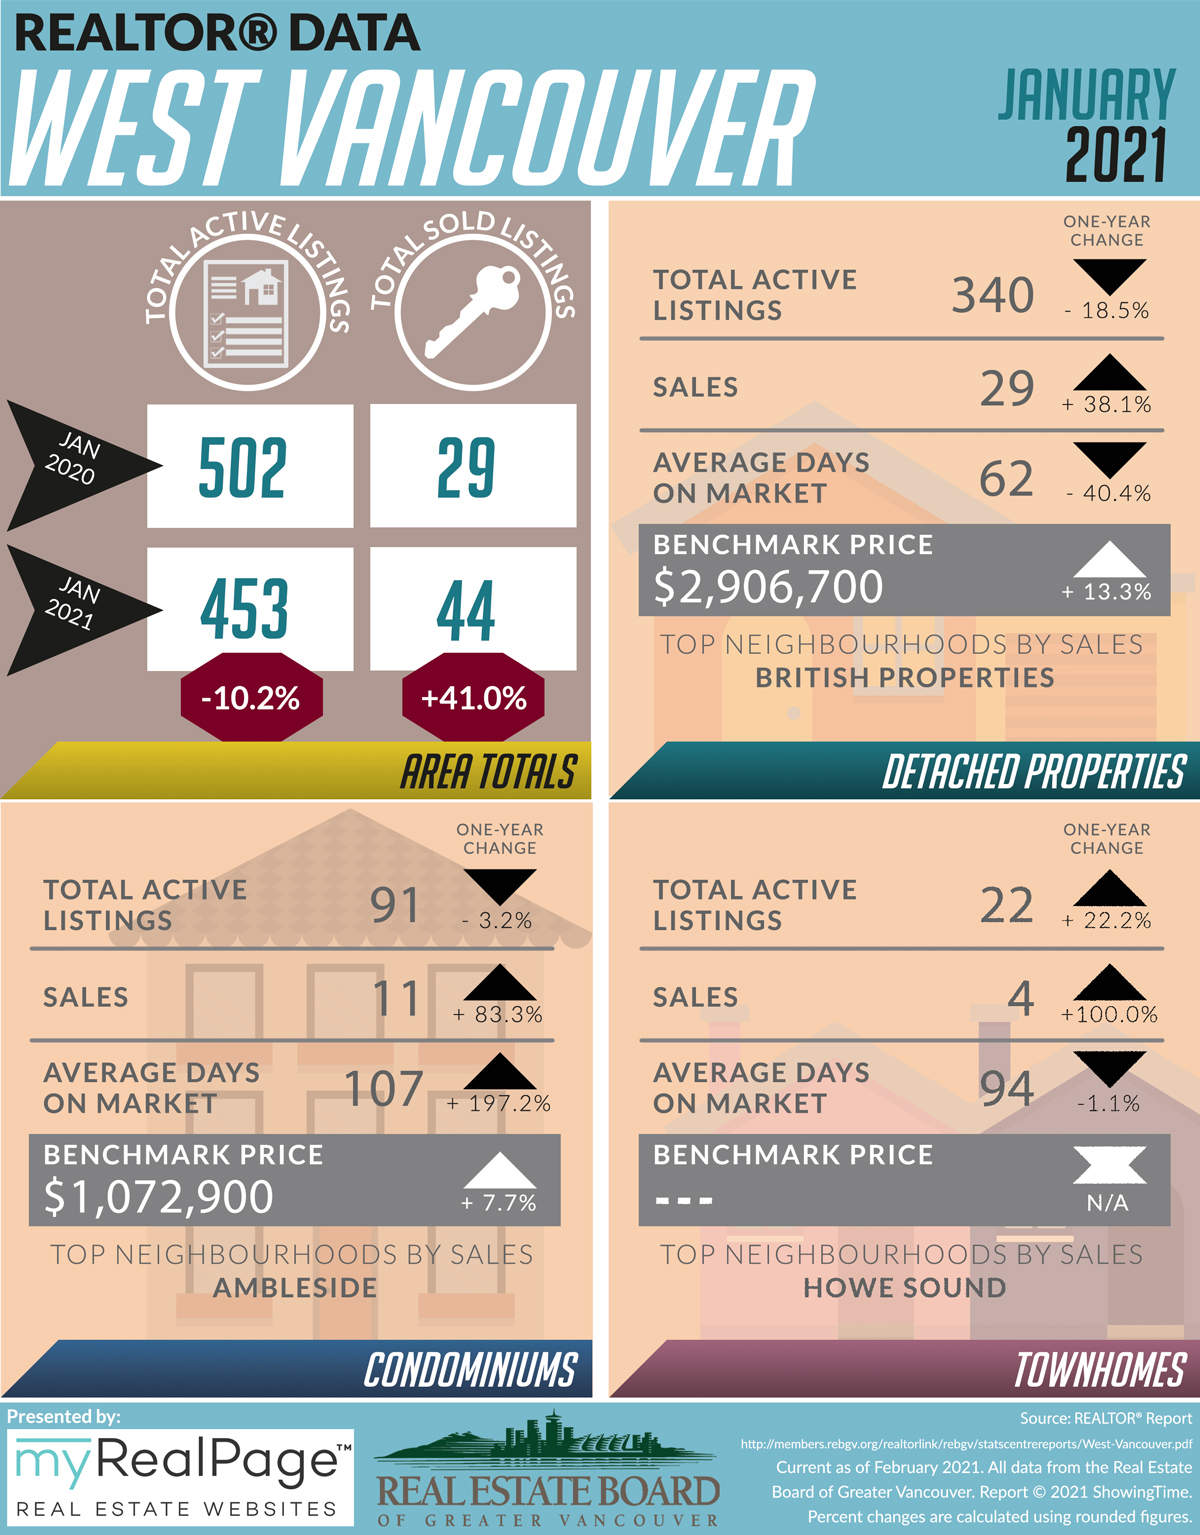
In the first month of 2021, Metro Vancouver’s* housing market continued the pattern set at the end of last year with home sale activity outpacing the supply of homes listed for sale. The Real Estate Board of Greater Vancouver (REBGV) reports that residential home sales in the region totaled 2,389 in January 2021, a 52.1 per cent increase from the 1,571 sales recorded in January 2020, and a 22.8 per cent decrease from the 3,093 homes sold in December 2020.
Read the full report on the REBGV website.
The following data is a comparison between January 2021 and January 2020 numbers, and is current as of February 2021. For last month’s update, you can check out our previous post for December 2020 data.
Or follow this link for all our REBGV Infographics!
These infographics cover current trends in North Vancouver, West Vancouver, Vancouver East, and Vancouver West. Click on the images for a larger view!
Download Printable Version – REBGV January 2021 West Vancouver Data Infographics
Download Printable Version – REBGV January 2021 Vancouver West Data Infographics
Download Printable Version – REBGV January 2021 Vancouver East Data Infographics
Download Printable Version – REBGV January 2021 North Vancouver Data Infographics

Last Updated on July 25, 2022 by myRealPage
