INFOGRAPHICS: January 2022 REBGV Greater Vancouver Market Reports

Low supply keeps upward pressure on home prices across Metro Vancouver
The first month of 2022 saw home sales come down from last year’s record-setting pace, while low supply continued to cause home prices to edge higher across Metro Vancouver*.
The Real Estate Board of Greater Vancouver (REBGV) reports that residential home sales in the region totalled 2,285 in January 2022, a 4.4 per cent decrease from the 2,389 sales recorded in January 2021, and a 15 per cent decrease from the 2,688 homes sold in December 2021.
Last month’s sales were 25.3 per cent above the 10-year January sales average.
Read the full report on the REBGV website!
The following data is a comparison between January 2022 and January 2021 numbers, and is current as of February 2022. For last month’s update, you can check out our previous post!
Or follow this link for all our REBGV Infographics!
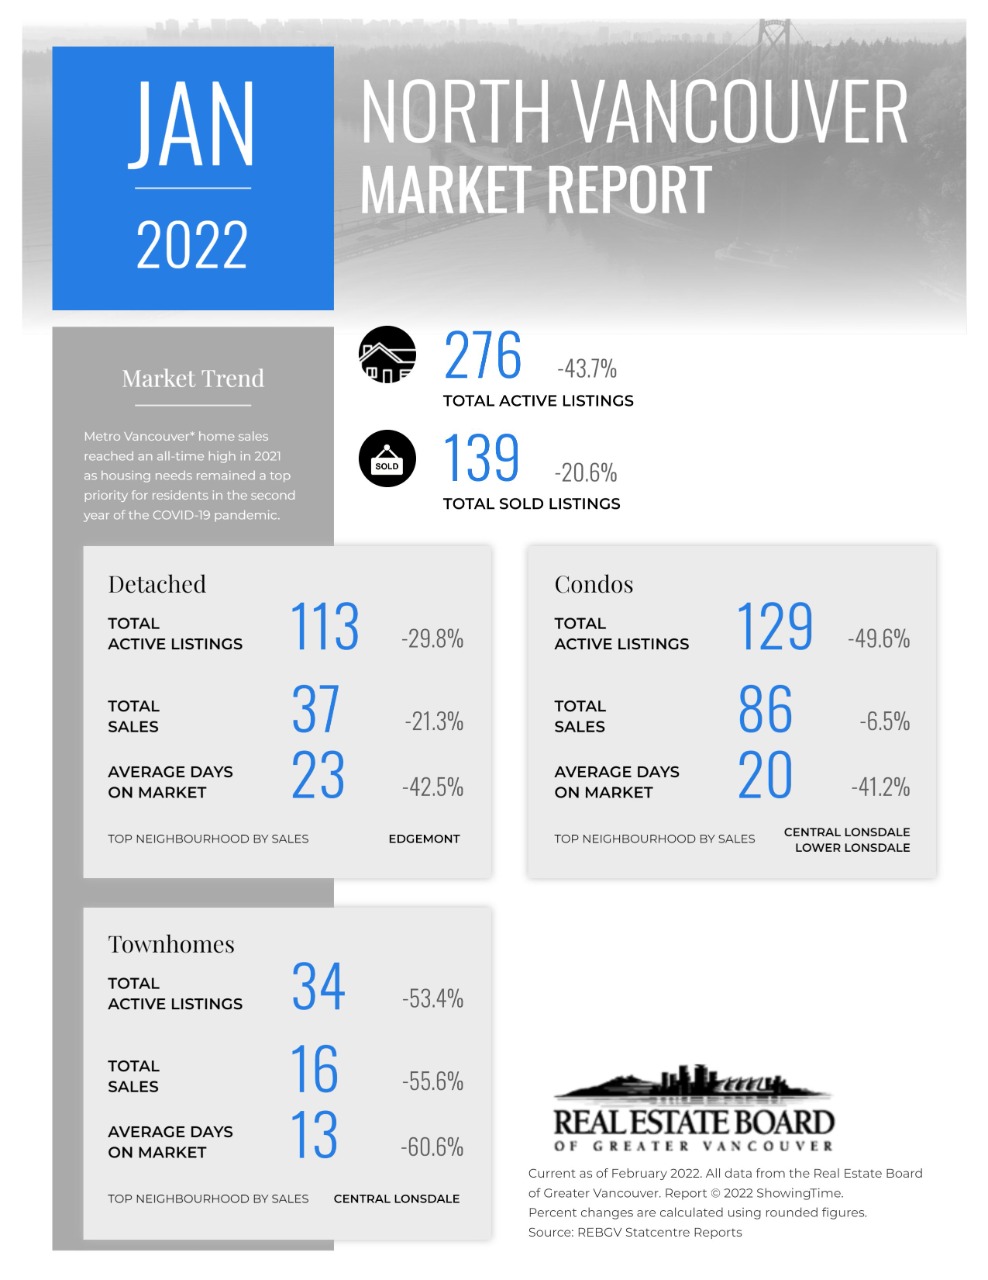
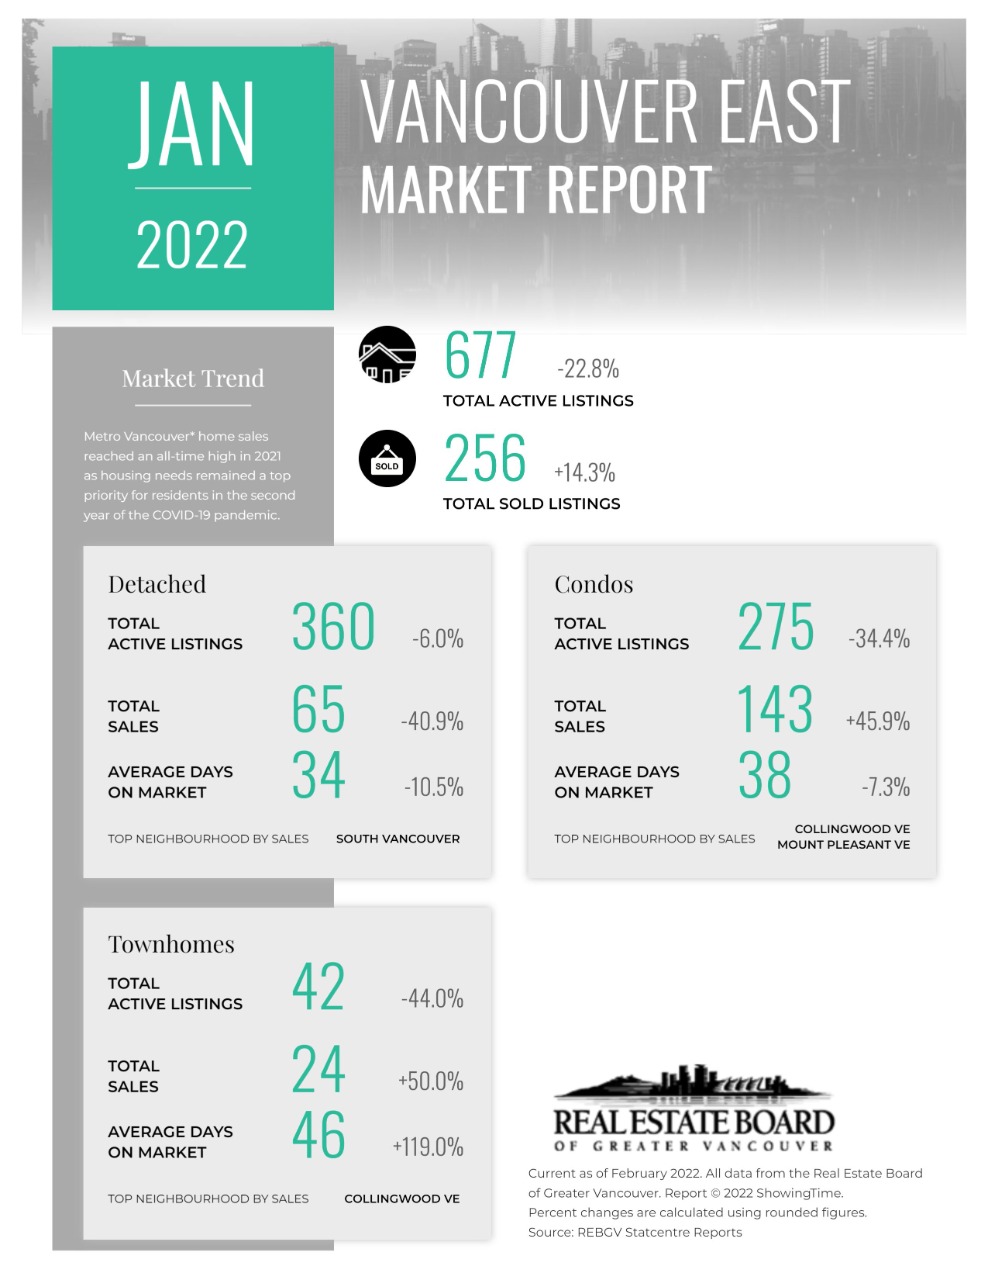
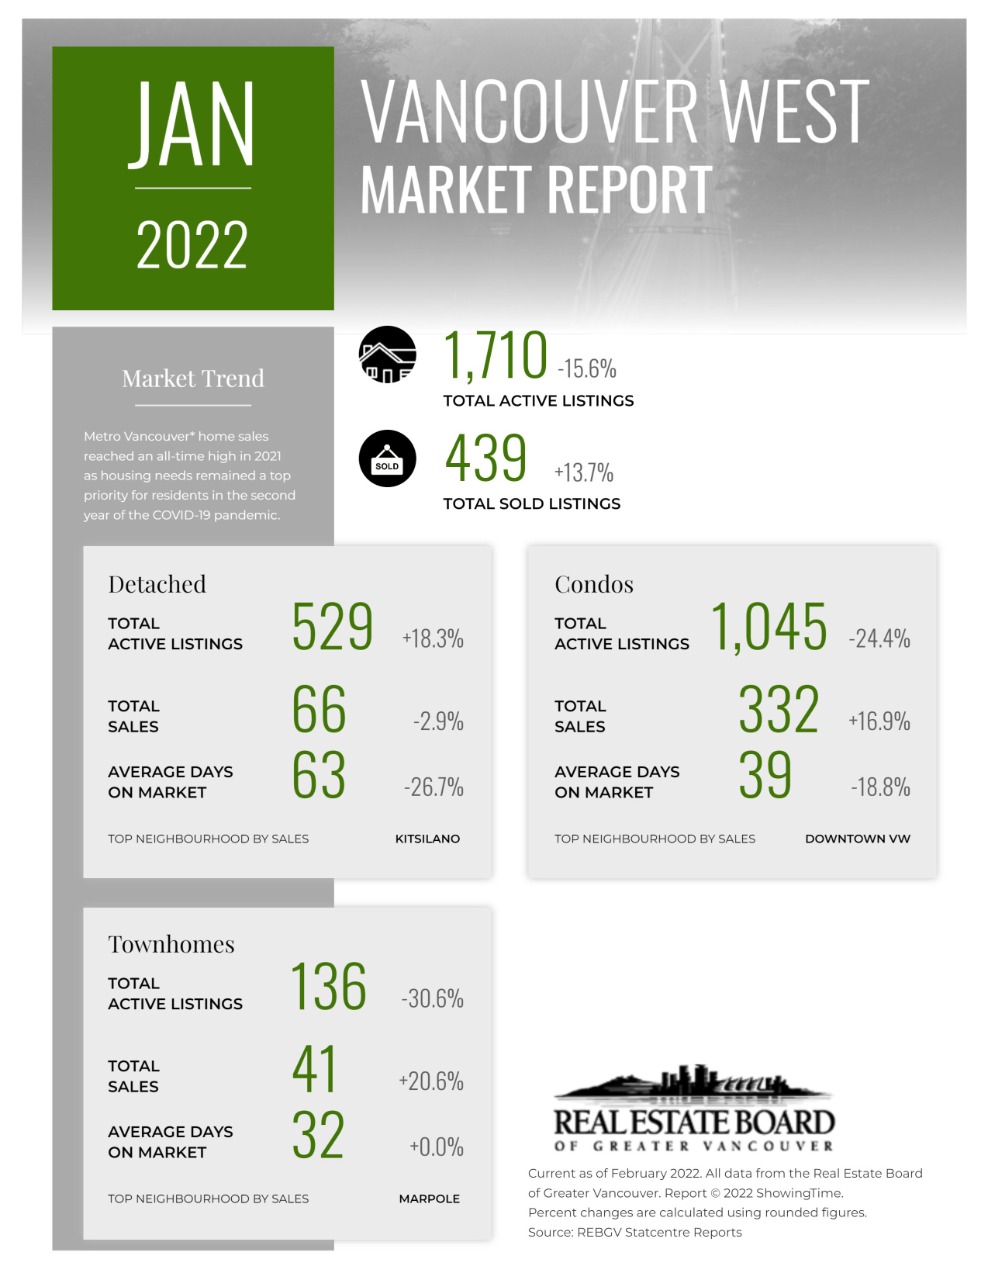
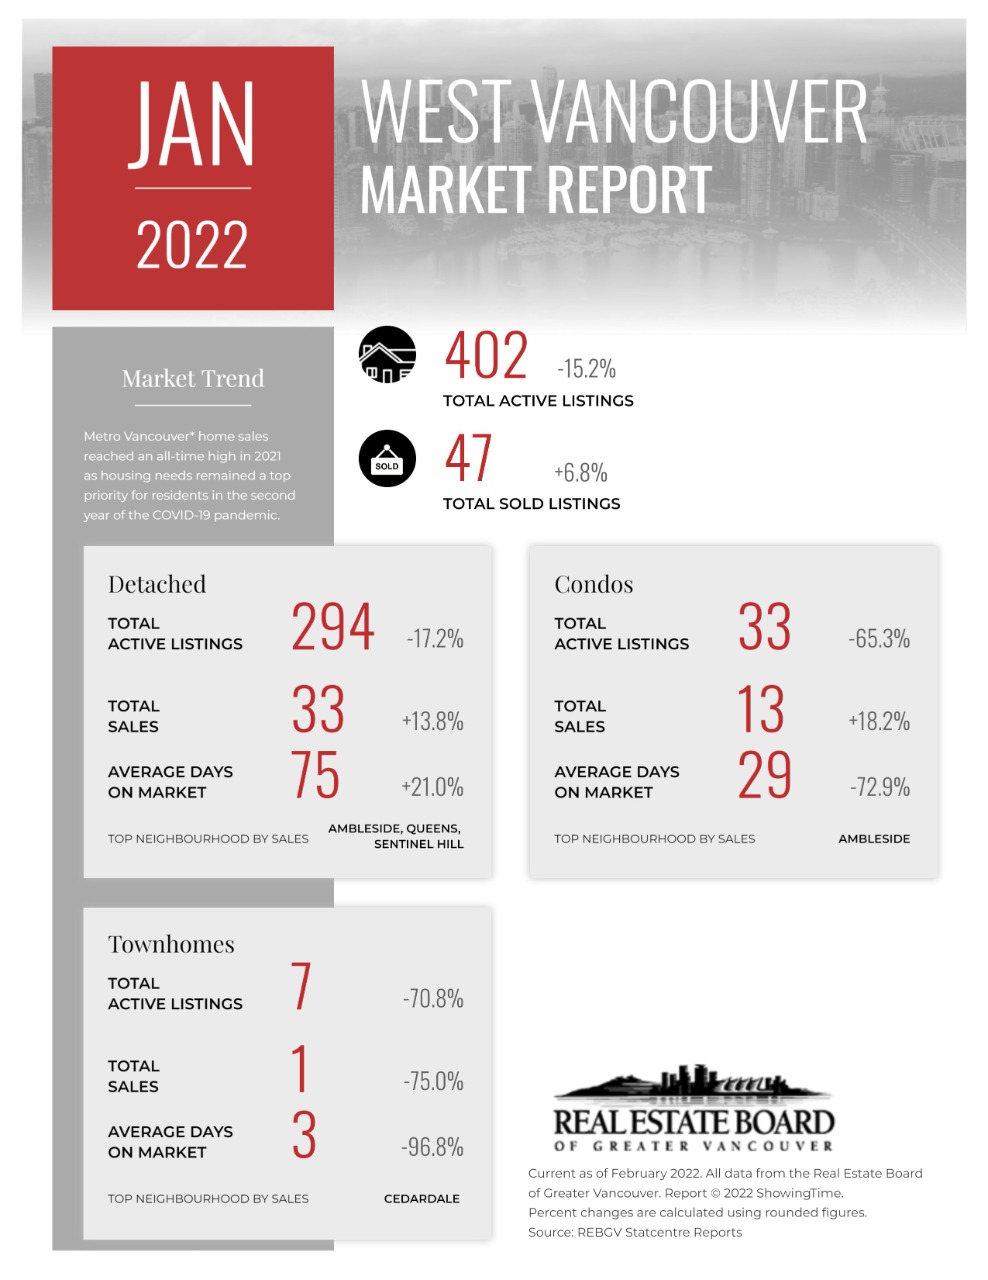
These infographics cover current trends in North Vancouver, West Vancouver, Vancouver East, and Vancouver West. Click on the images for a larger view!
Download Printable Version – REBGV January 2022 Data Infographic Report North Vancouver
Download Printable Version – REBGV January 2022 Data Infographics Report West Vancouver
Download Printable Version – REBGV January 2022 Data Infographics Report Vancouver West
Download Printable Version – REBGV January 2022 Data Infographics Report Vancouver East
Last Updated on July 25, 2022 by myRealPage
