INFOGRAPHICS: July 2022 REBGV Greater Vancouver Market Reports

Home buyer demand continues to ease across Metro Vancouver
Metro Vancouver’s housing market has entered a new cycle marked by quieter home buyer demand and a gradual rise in the supply of homes for sale.
The Real Estate Board of Greater Vancouver (REBGV) reports that residential home sales in the region totalled 1,887 in July 2022, a 43.3 per cent decrease from the 3,326 sales recorded in July 2021, and a 22.8 per cent decrease from the 2,444 homes sold in June 2022.
Last month’s sales were 35.2 per cent below the 10-year July sales average.
Read the full report on the REBGV website!
The following data is a comparison between July 2022 and July 2021 numbers, and is current as of August 2022. For last month’s update, you can check out our previous post!
Or follow this link for all our REBGV Infographics!
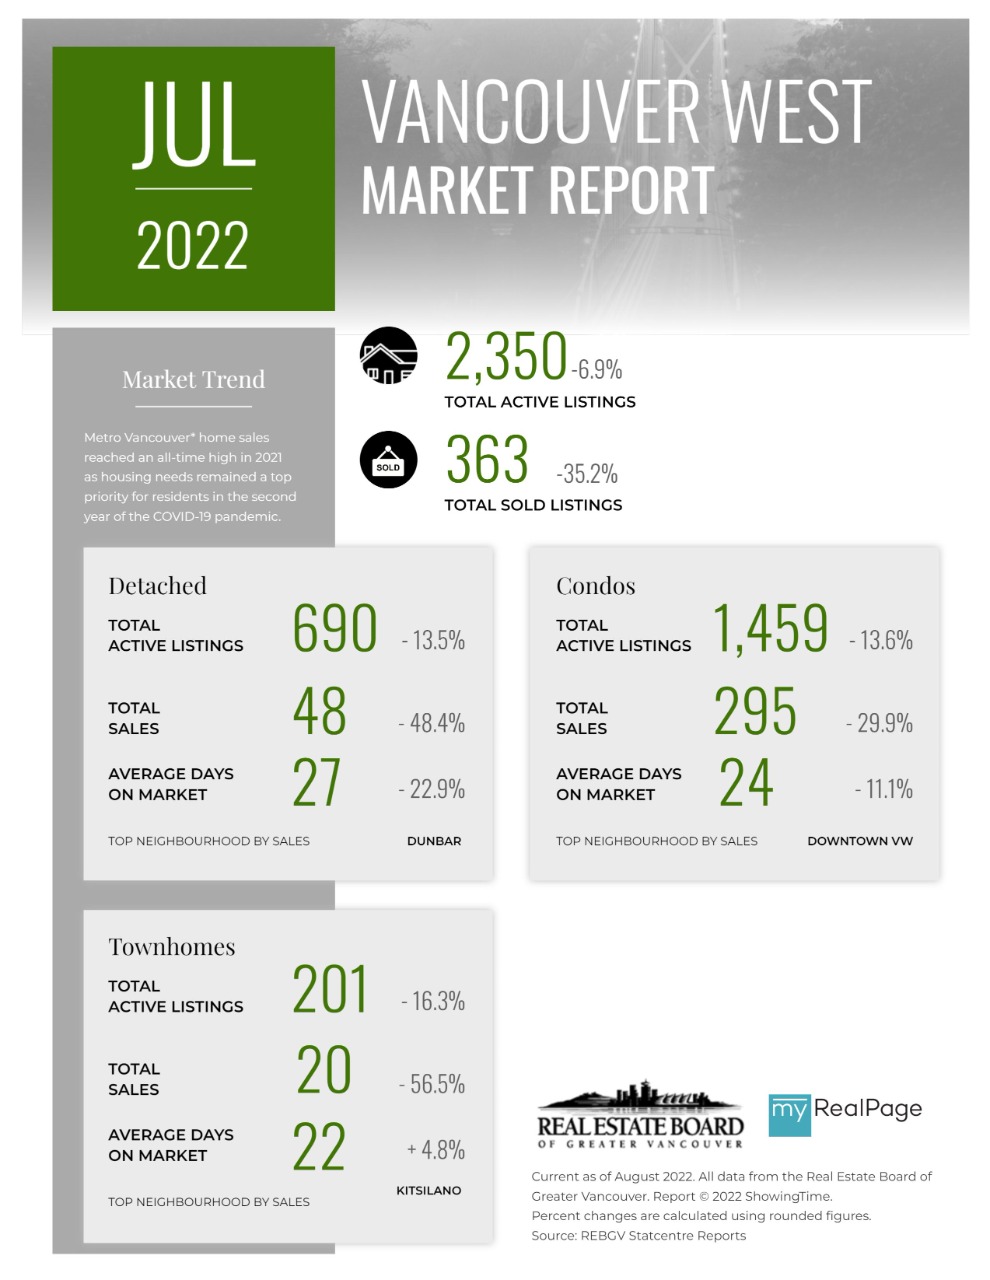
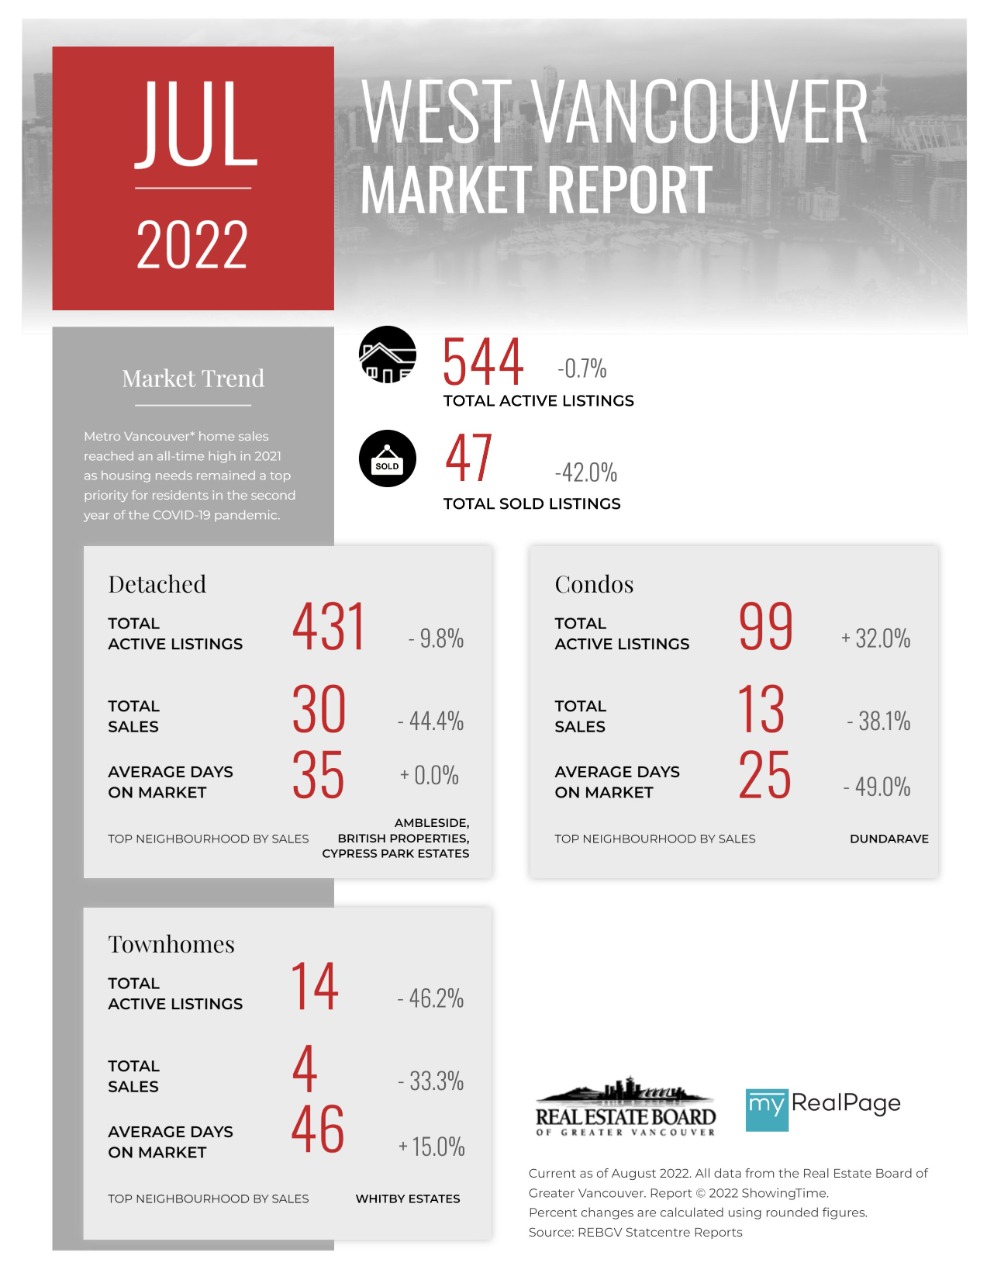
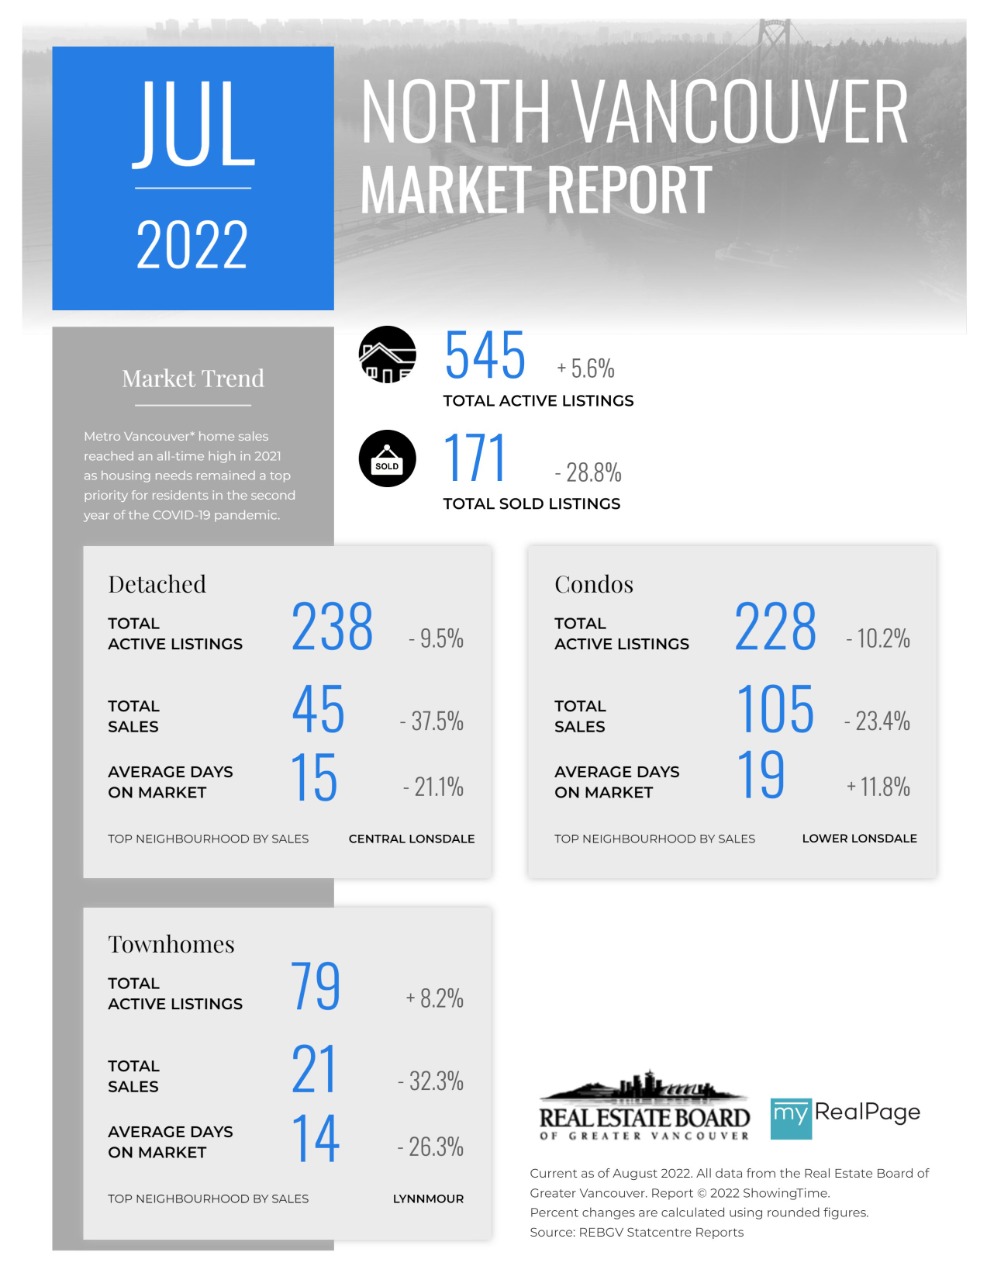
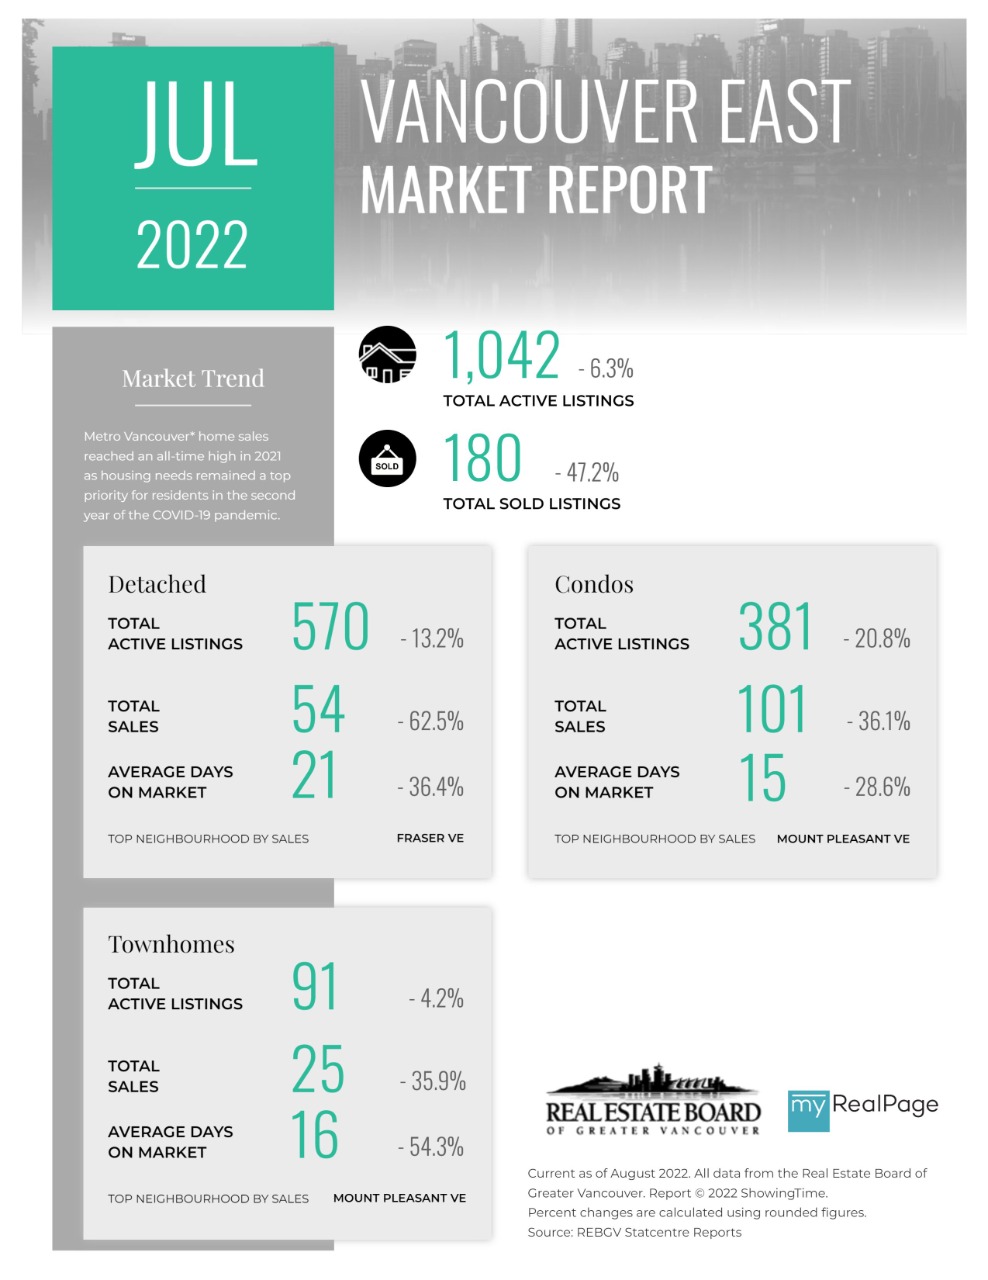
These infographics cover current trends in North Vancouver, West Vancouver, Vancouver East, and Vancouver West. Click on the images for a larger view!
Download Printable Version – REBGV July 2022 Data Infographic Report North Vancouver
Download Printable Version – REBGV July 2022 Data Infographics Report West Vancouver
Download Printable Version – REBGV July 2022 Data Infographics Report Vancouver West
Download Printable Version – REBGV July 2022 Data Infographics Report Vancouver East
Last Updated on August 8, 2022 by myRealPage
