INFOGRAPHICS: June 2022 REBGV Greater Vancouver Market Reports

Home listings up, sales down and prices starting to decrease
With interest rates and housing supply increasing, Metro Vancouver* home buyers are operating in a changing marketplace to begin the summer season.
The Real Estate Board of Greater Vancouver (REBGV) reports that residential home sales in the region totalled 2,444 in June 2022, a 35 per cent decrease from the 3,762 sales recorded in June 2021, and a 16.2 per cent decrease from the 2,918 homes sold in May 2022.
Last month’s sales were 23.3 per cent below the 10-year June sales average.
Read the full report on the REBGV website!
The following data is a comparison between June 2022 and June 2021 numbers, and is current as of July 2022. For last month’s update, you can check out our previous post!
Or follow this link for all our REBGV Infographics!
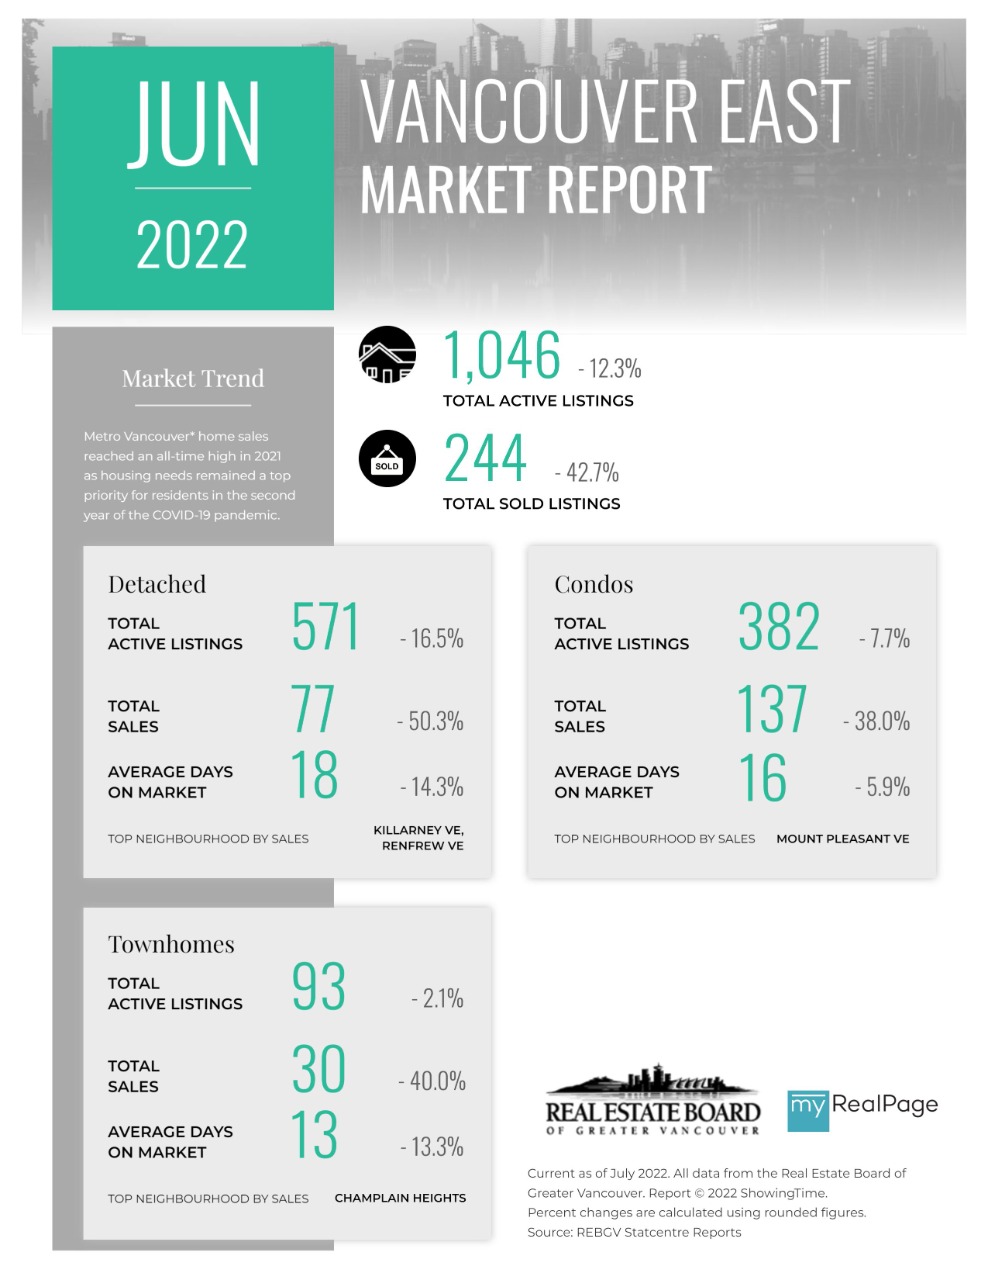
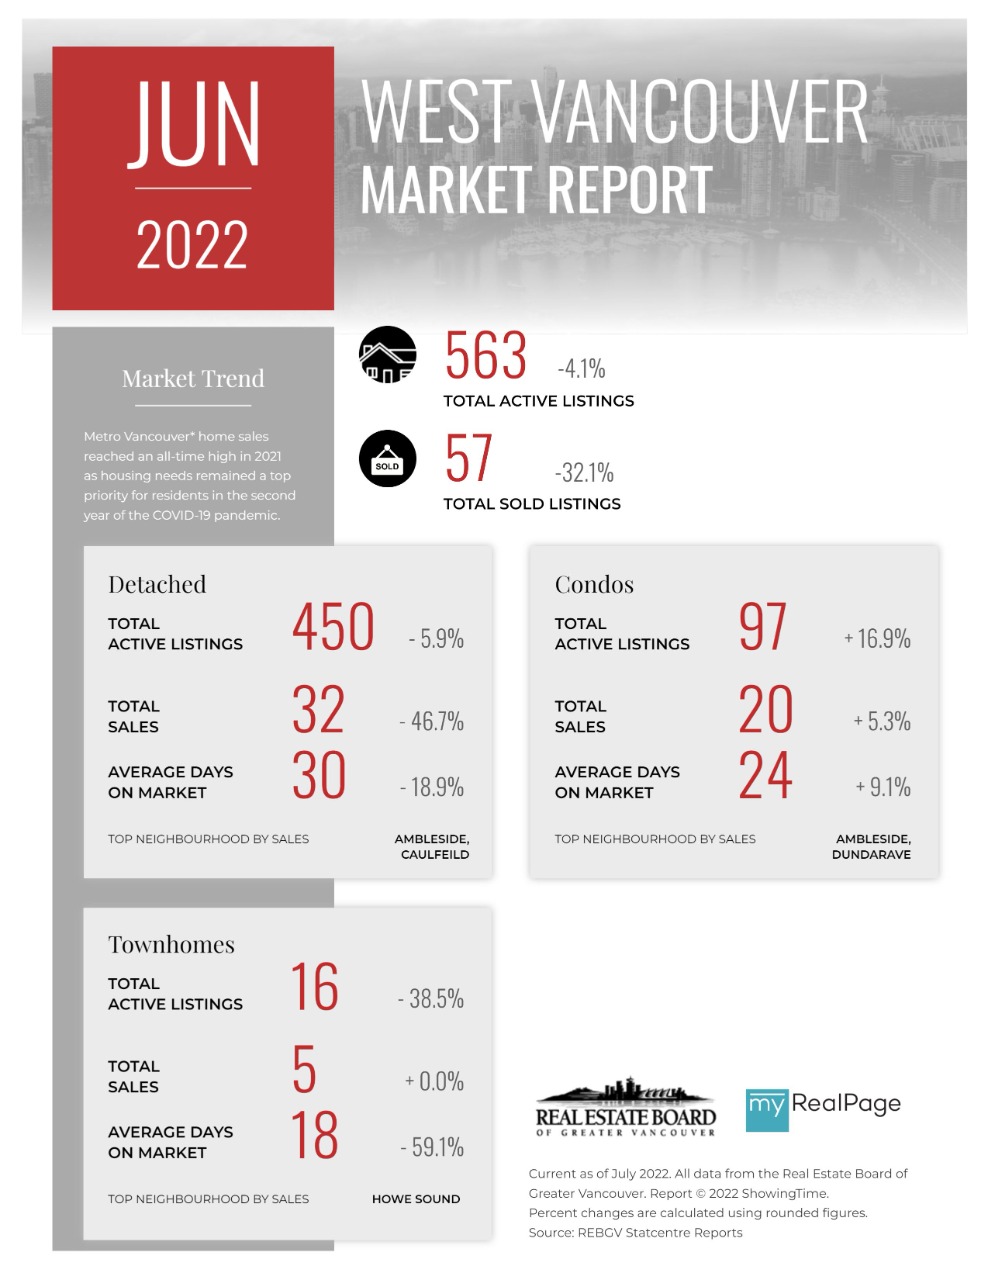
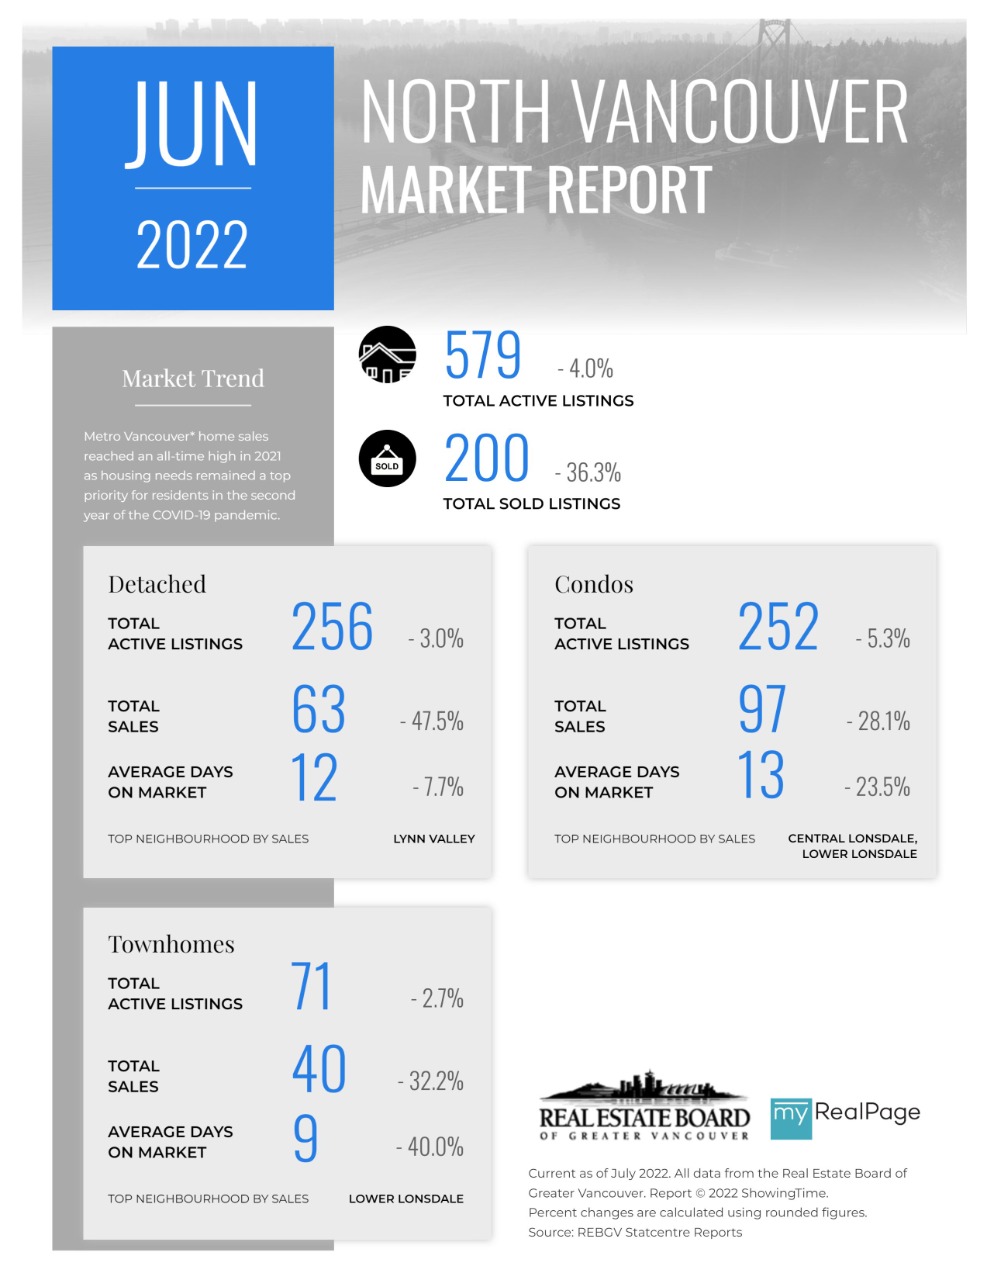
These infographics cover current trends in North Vancouver, West Vancouver, Vancouver East, and Vancouver West. Click on the images for a larger view!
Download Printable Version – REBGV June 2022 Data Infographic Report North Vancouver
Download Printable Version – REBGV June 2022 Data Infographics Report West Vancouver
Download Printable Version – REBGV June 2022 Data Infographics Report Vancouver West
Download Printable Version – REBGV June 2022 Data Infographics Report Vancouver East

Last Updated on July 25, 2022 by myRealPage
