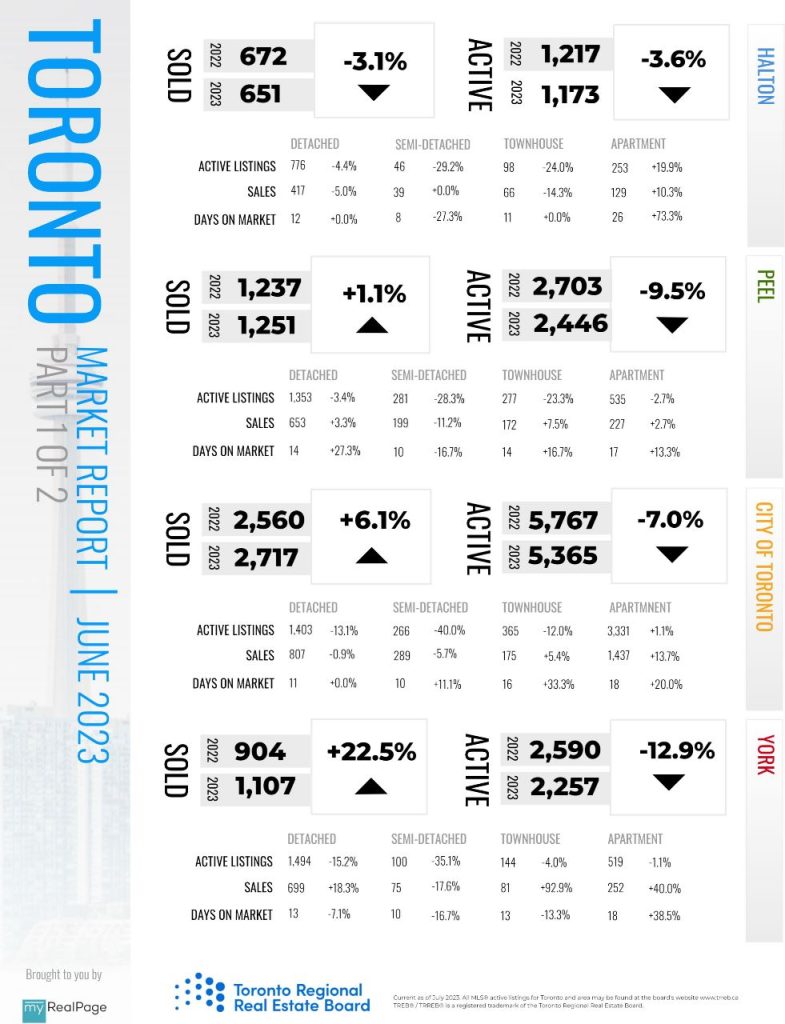
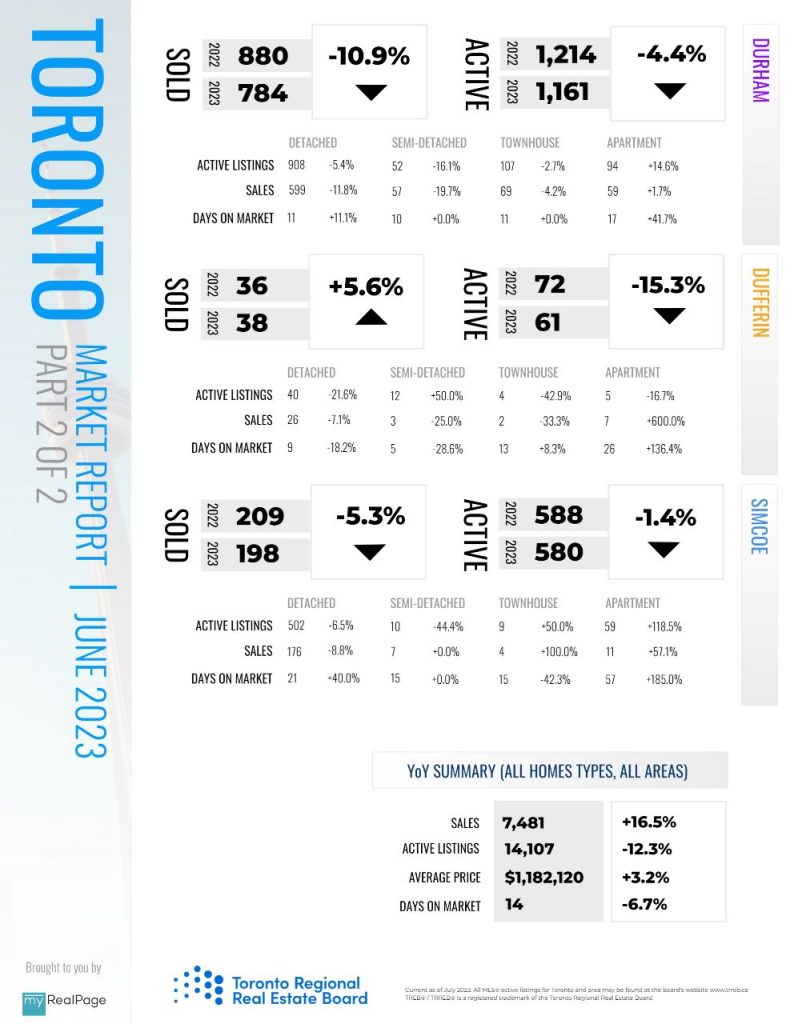
INFOGRAPHICS: June 2023 TRREB Toronto Market Reports

GTA REALTORS® Release June Stats
Home sales and the average selling price in the Greater Toronto Area (GTA) in June 2023 remained above last year’s levels. Seasonally adjusted sales dipped on a month-over-month basis. The seasonally adjusted average selling price and the MLS® Home Price Index (HPI) Composite benchmark were up compared to the previous month.
“The demand for ownership housing is stronger than last year, despite higher borrowing costs. With this said, home sales were hampered last month by uncertainty surrounding the Bank of Canada’s outlook on inflation and interest rates. Furthermore, a persistent lack of inventory likely sidelined some willing buyers because they couldn’t find a home meeting their needs. Simply put, you can’t buy what is not available,” said Toronto Regional Real Estate Board (TRREB) President Paul Baron.
GTA REALTORS® reported 7,481 sales through TRREB’s MLS® System in June 2023 – up 16.5 per cent compared to June 2022. The number of listings was down by three per cent over the same period.
Read the full report on TRREB website!
The following data is a comparison between June 2023 and June 2022 numbers, and is current as of July 2023. For last month’s numbers, check out our previous infographic!
Or follow this link for all our TREB / TRREB Infographics!


