INFOGRAPHICS: May 2022 REBGV Greater Vancouver Market Reports

Spring ushers in calmer housing market trends in Metro Vancouver
“With interest rates rising, home buyers are taking more time to make their decisions in today’s housing market. Home buyers have been operating in a frenzied environment for much of the past two years. This spring is providing a calmer environment, with fewer multiple offer situations, which is allowing buyers to explore their housing options, understand the changing mortgage market, and do their due diligence.” said Daniel John, chairman of the REBGV.
“Upward pressure on home prices has begun to ease in the housing market over the last two months,” John said. “Where home prices go next will depend on housing supply. While we’re beginning to see modest increases in home listings, we still need housing supply totals to more than double to bring the market close to balanced territory.”
Read the full report on the REBGV website!
The following data is a comparison between May 2022 and May 2021 numbers, and is current as of June 2022. For last month’s update, you can check out our previous post!
Or follow this link for all our REBGV Infographics!
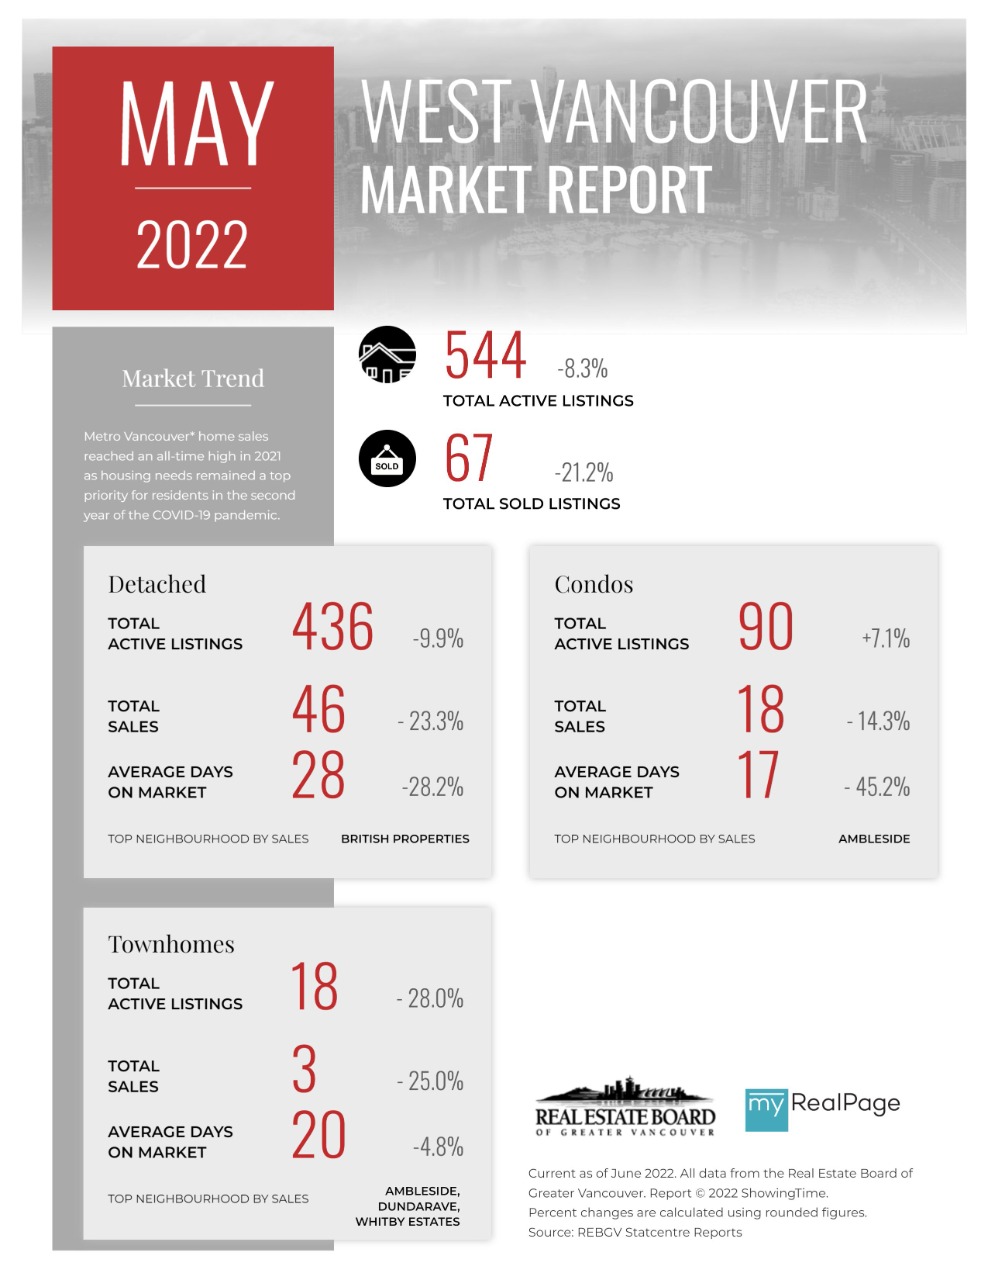
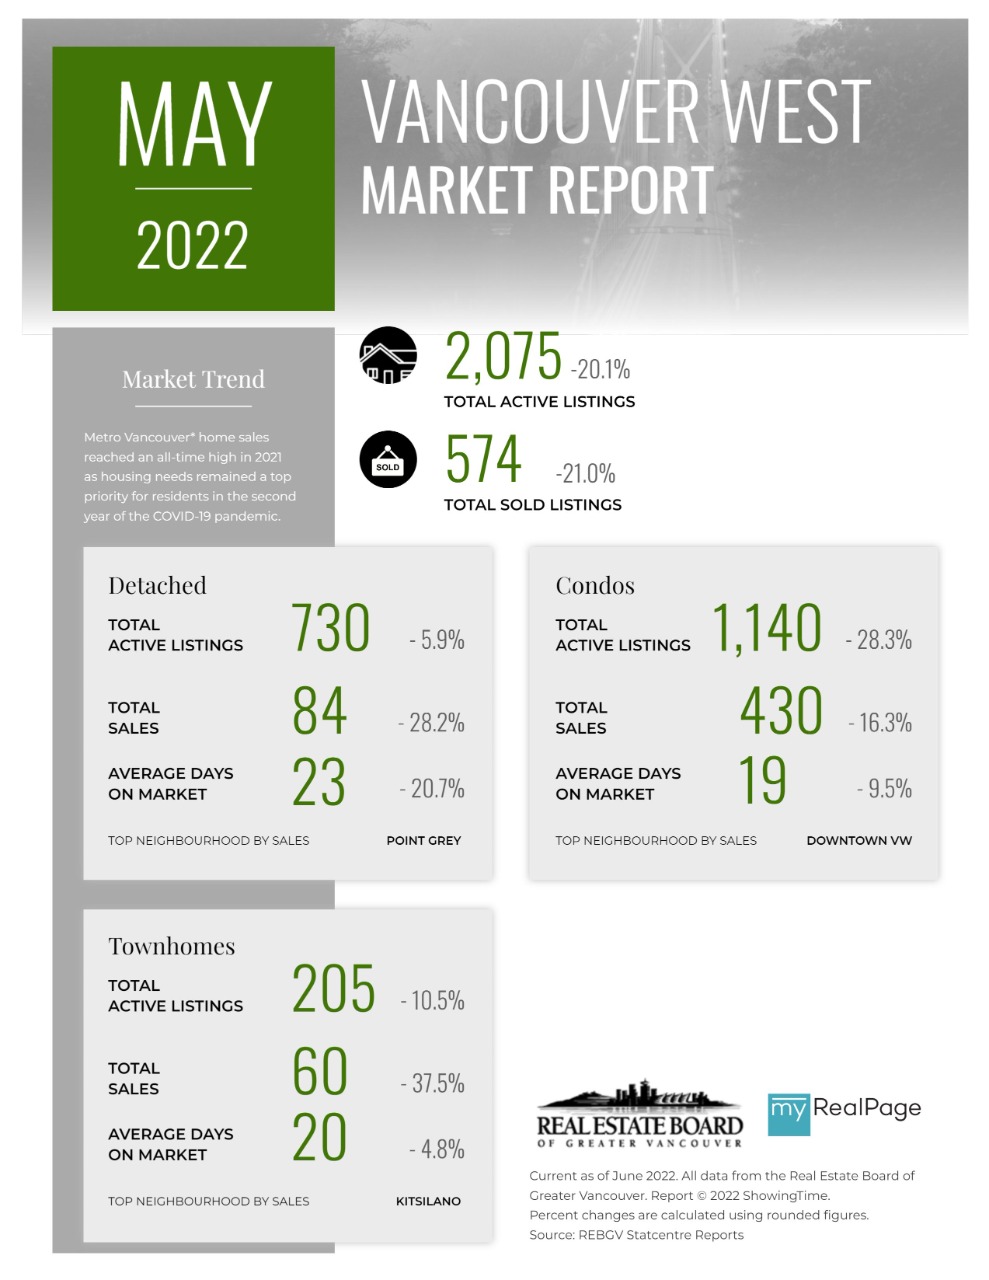
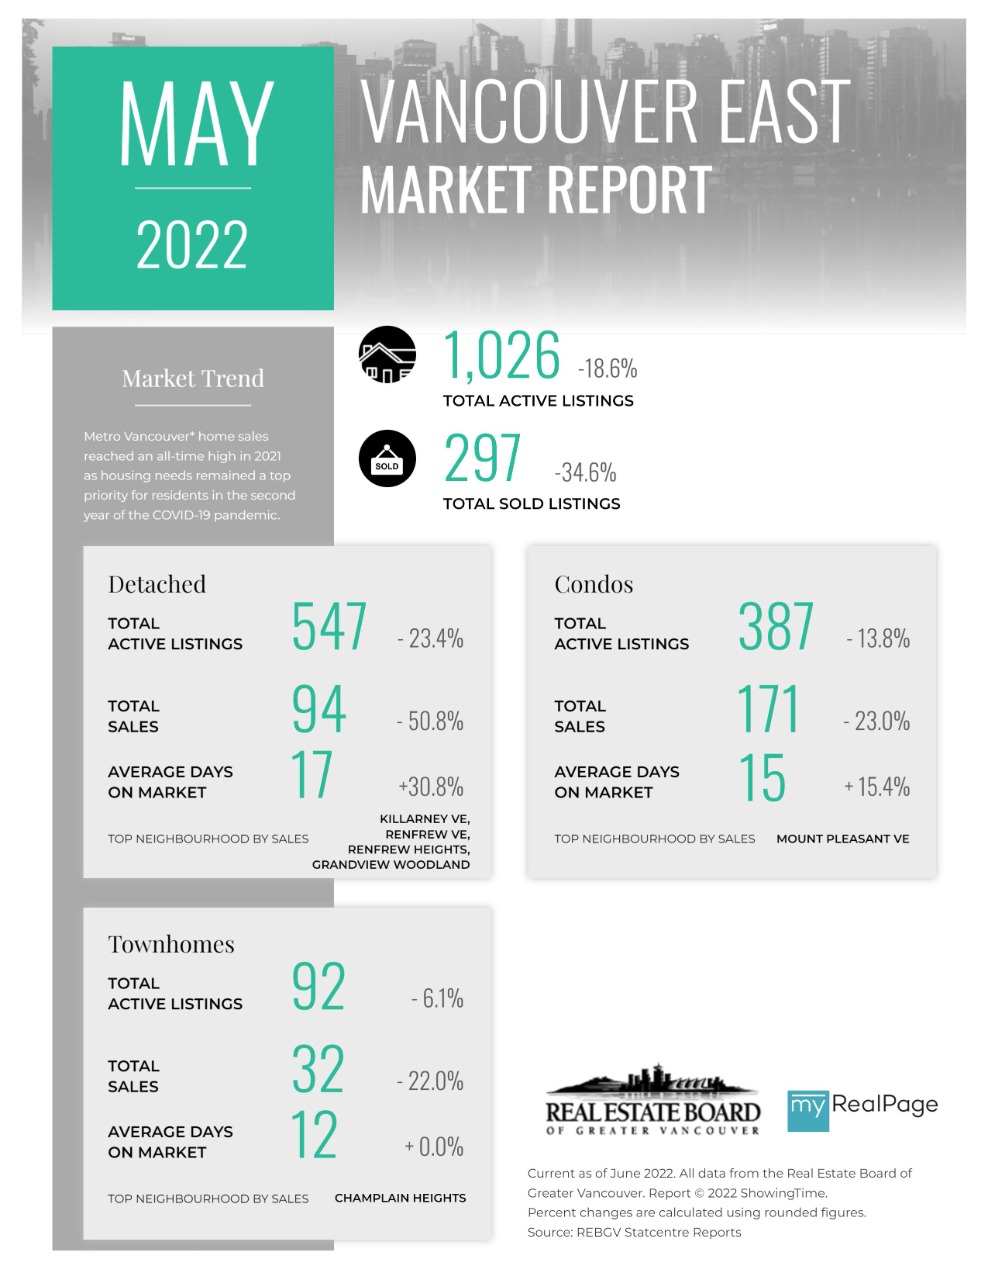
These infographics cover current trends in North Vancouver, West Vancouver, Vancouver East, and Vancouver West. Click on the images for a larger view!
Download Printable Version – REBGV May 2022 Data Infographic Report North Vancouver
Download Printable Version – REBGV May 2022 Data Infographics Report West Vancouver
Download Printable Version – REBGV May 2022 Data Infographics Report Vancouver West
Download Printable Version – REBGV May 2022 Data Infographics Report Vancouver East

Last Updated on July 25, 2022 by myRealPage
