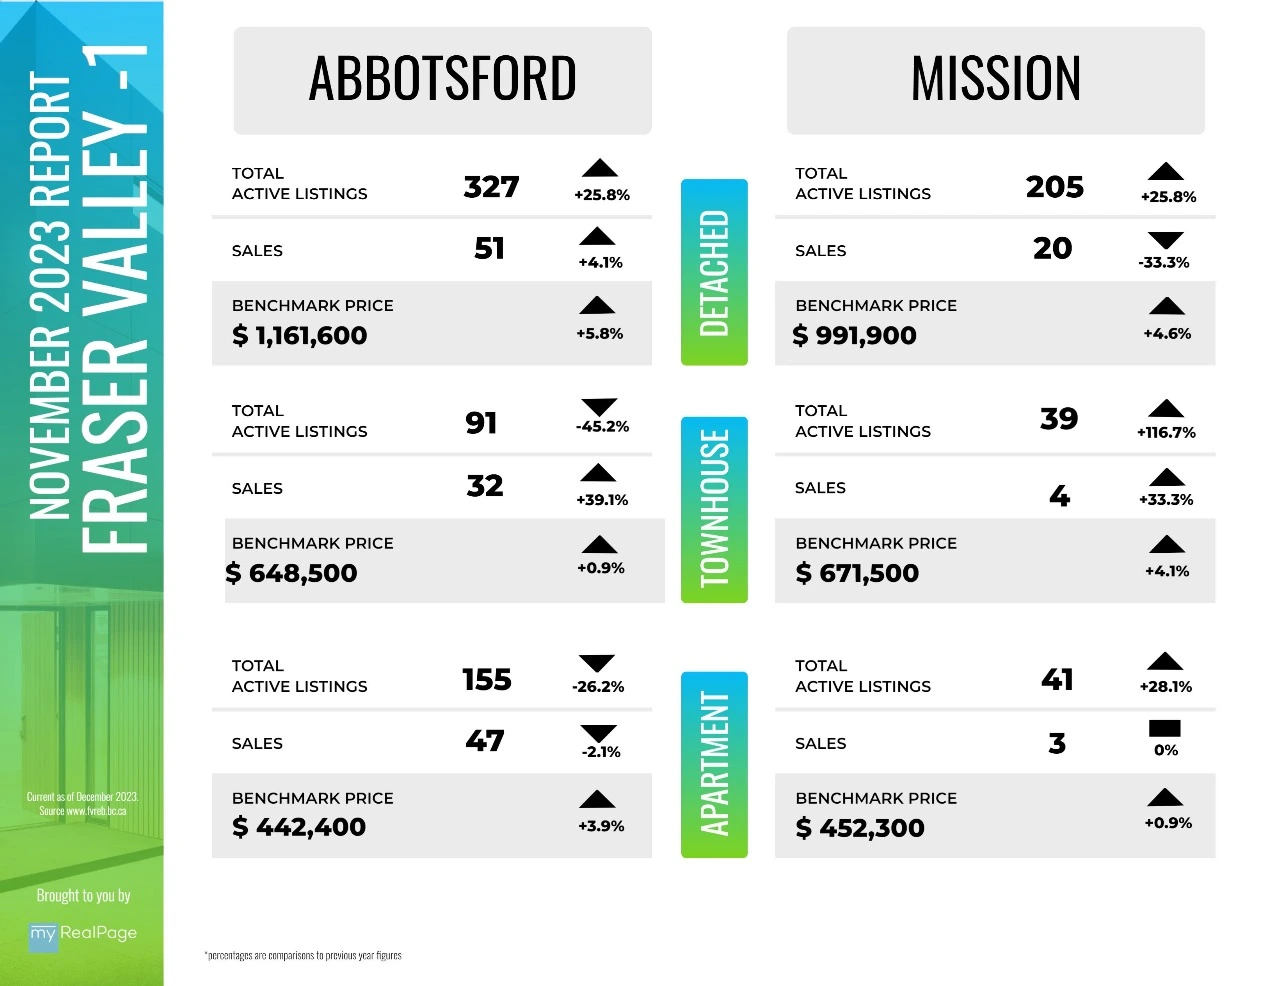
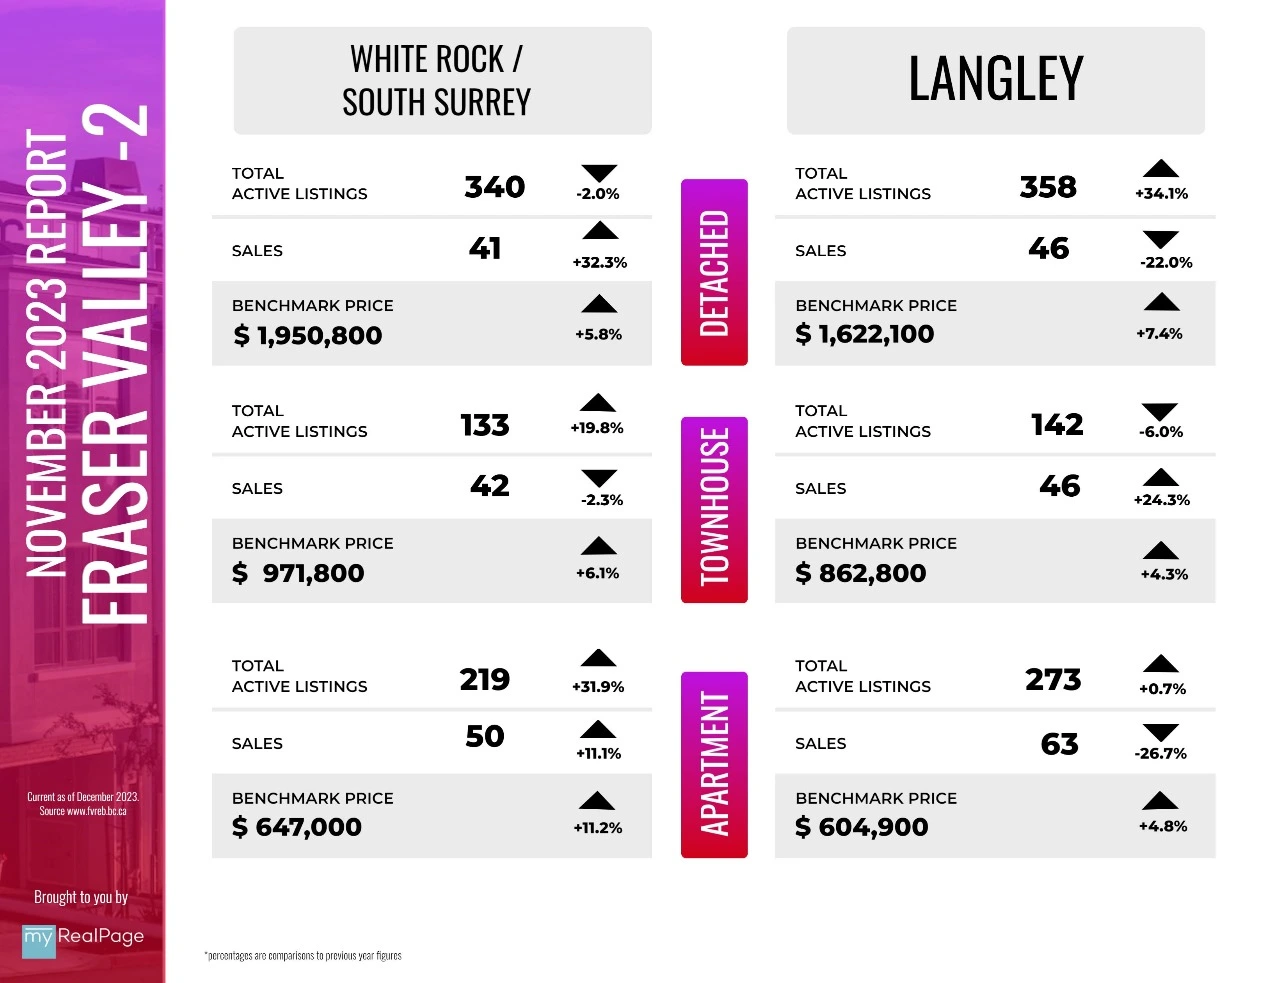
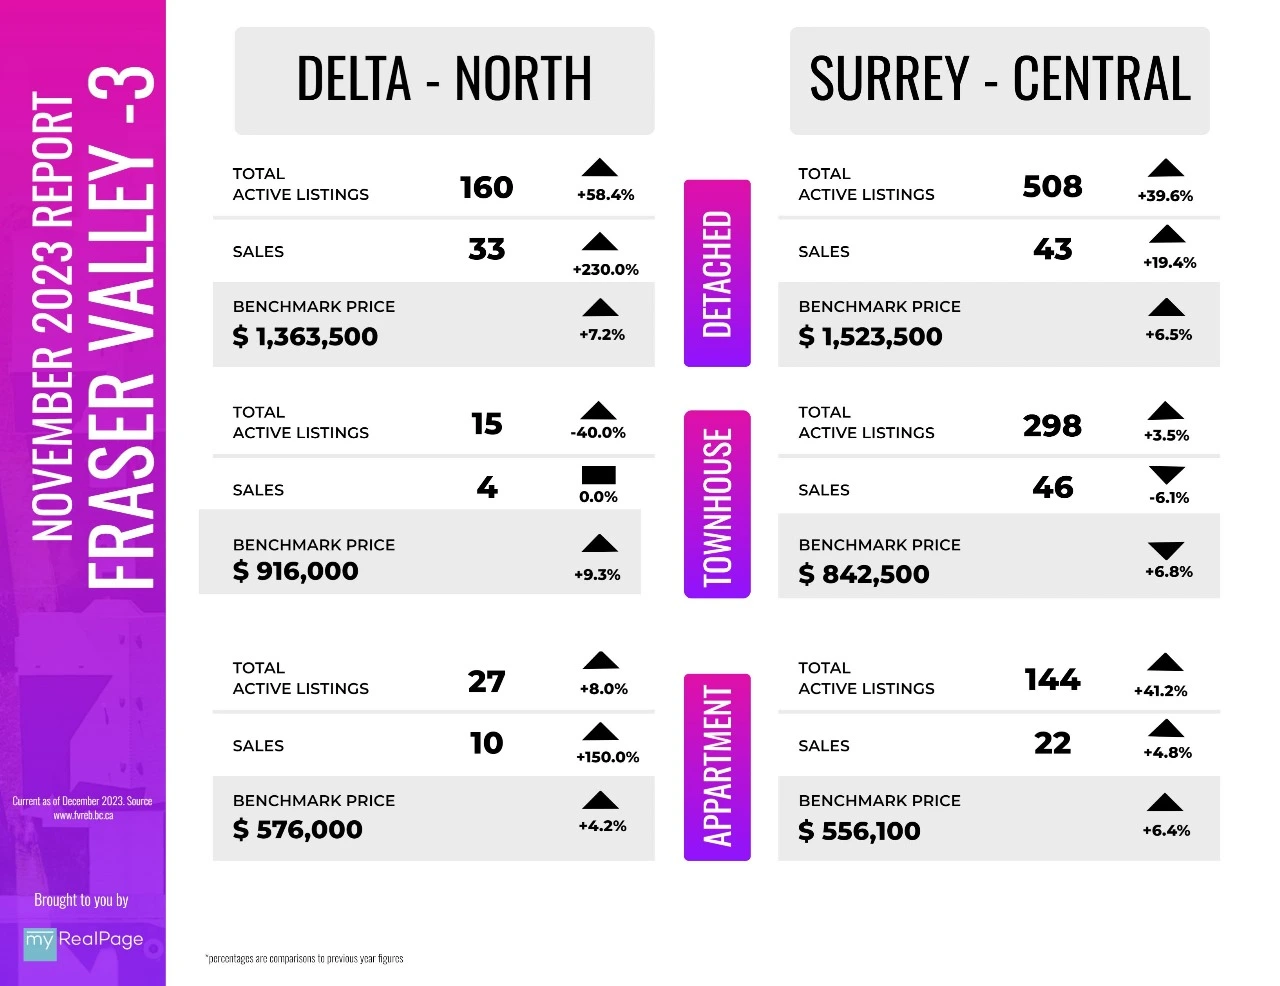
INFOGRAPHICS: November 2023 FVREB Fraser Valley Market Reports
Home sales fall for fifth straight month in the Fraser Valley
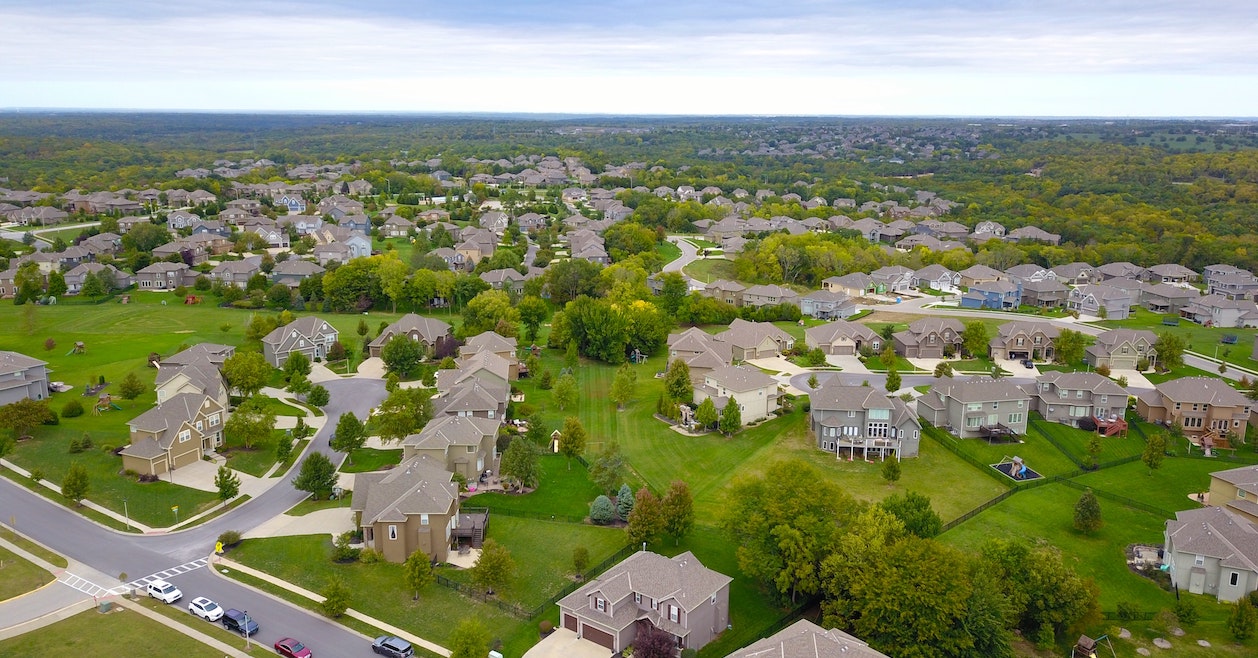
The Fraser Valley real estate market continues to cool heading into the holiday season as buyers and sellers maintain the holding pattern seen over the latter half of this year.
The Fraser Valley Real Estate Board recorded 891 transactions on its Multiple Listing Service® (MLS®) in November, a drop of 8 per cent from the previous month, representing the 9th slowest November in a decade.
At 2,030 new listings also fell again, decreasing by 20 per cent from October and by 43 per cent since peaking in May at 3,533.
“As we head into the holiday season, buyers and sellers are busy with other priorities and will most likely continue to wait on the sidelines,” said Narinder Bains, Chair of the Fraser Valley Real Estate Board. “We anticipate this holding pattern, defined by slow sales and declining new listings, will continue through the winter months until we see some downward movement in interest rates.”
Active listings in November were 6,254, down by 5 per cent over last month and up by 17 per cent over November 2022. The sales-to-active listings ratio was 14 per cent, creating balanced conditions in the overall market. Detached houses are in balanced market territory at 12 per cent, while both townhomes and apartments remain in seller’s market territory. The market is considered balanced when the ratio is between 12 per cent and 20 per cent.
“With seasonality and high interest rates continuing to dampen sales activity, we expect to see sales slow further into early 2024,” said FVREB CEO Baldev Gill. “However, even a slow market can present opportunities, and buyers would be well-advised to work with a knowledgeable, professional REALTOR® who can provide expert advice and guidance.”
Read the full report on the FVREB website!
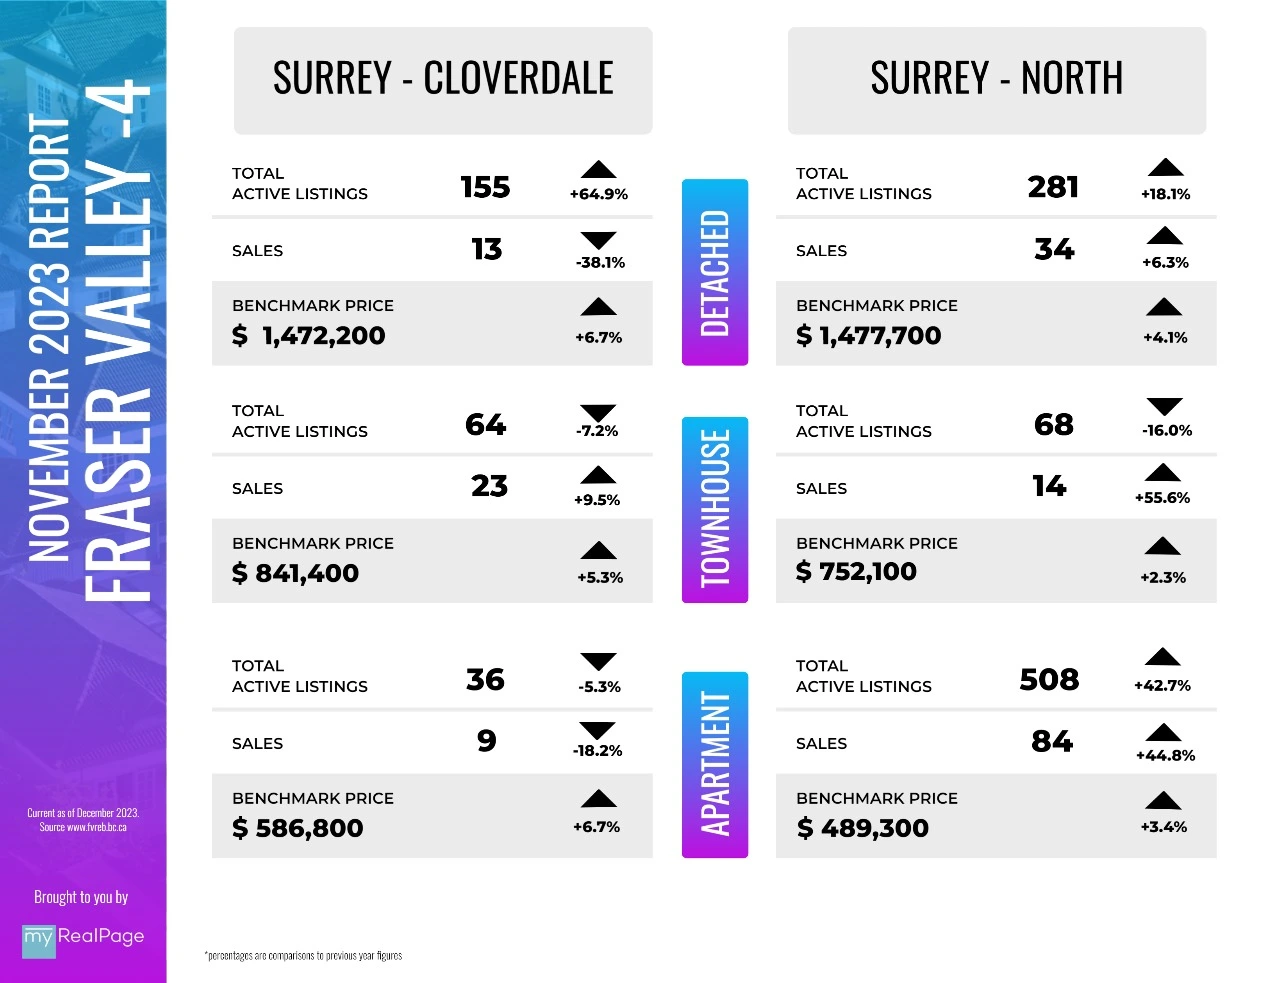
The following data is a comparison between November 2023 and November 2022 numbers, and is current as of December 2023. For last month’s report, check out our previous infographic!
Or follow this link for all our FVREB Infographics!
These infographics cover current trends in Fraser Valley neighbourhoods that are within the FVREB. Click on the images for a larger view!
Download Printable Version – FVREB November 2023 Market Report 1
Download Printable Version – FVREB November 2023 Market Report 2
Download Printable Version – FVREB November 2023 Market Report 3
Download Printable Version – FVREB November 2023 Market Report 4
Last Updated on May 9, 2024 by myRealPage
