INFOGRAPHICS: October 2021 TRREB Toronto Market Reports

Near Record Home Sales, Low Inventory Sustain Strong Price Growth
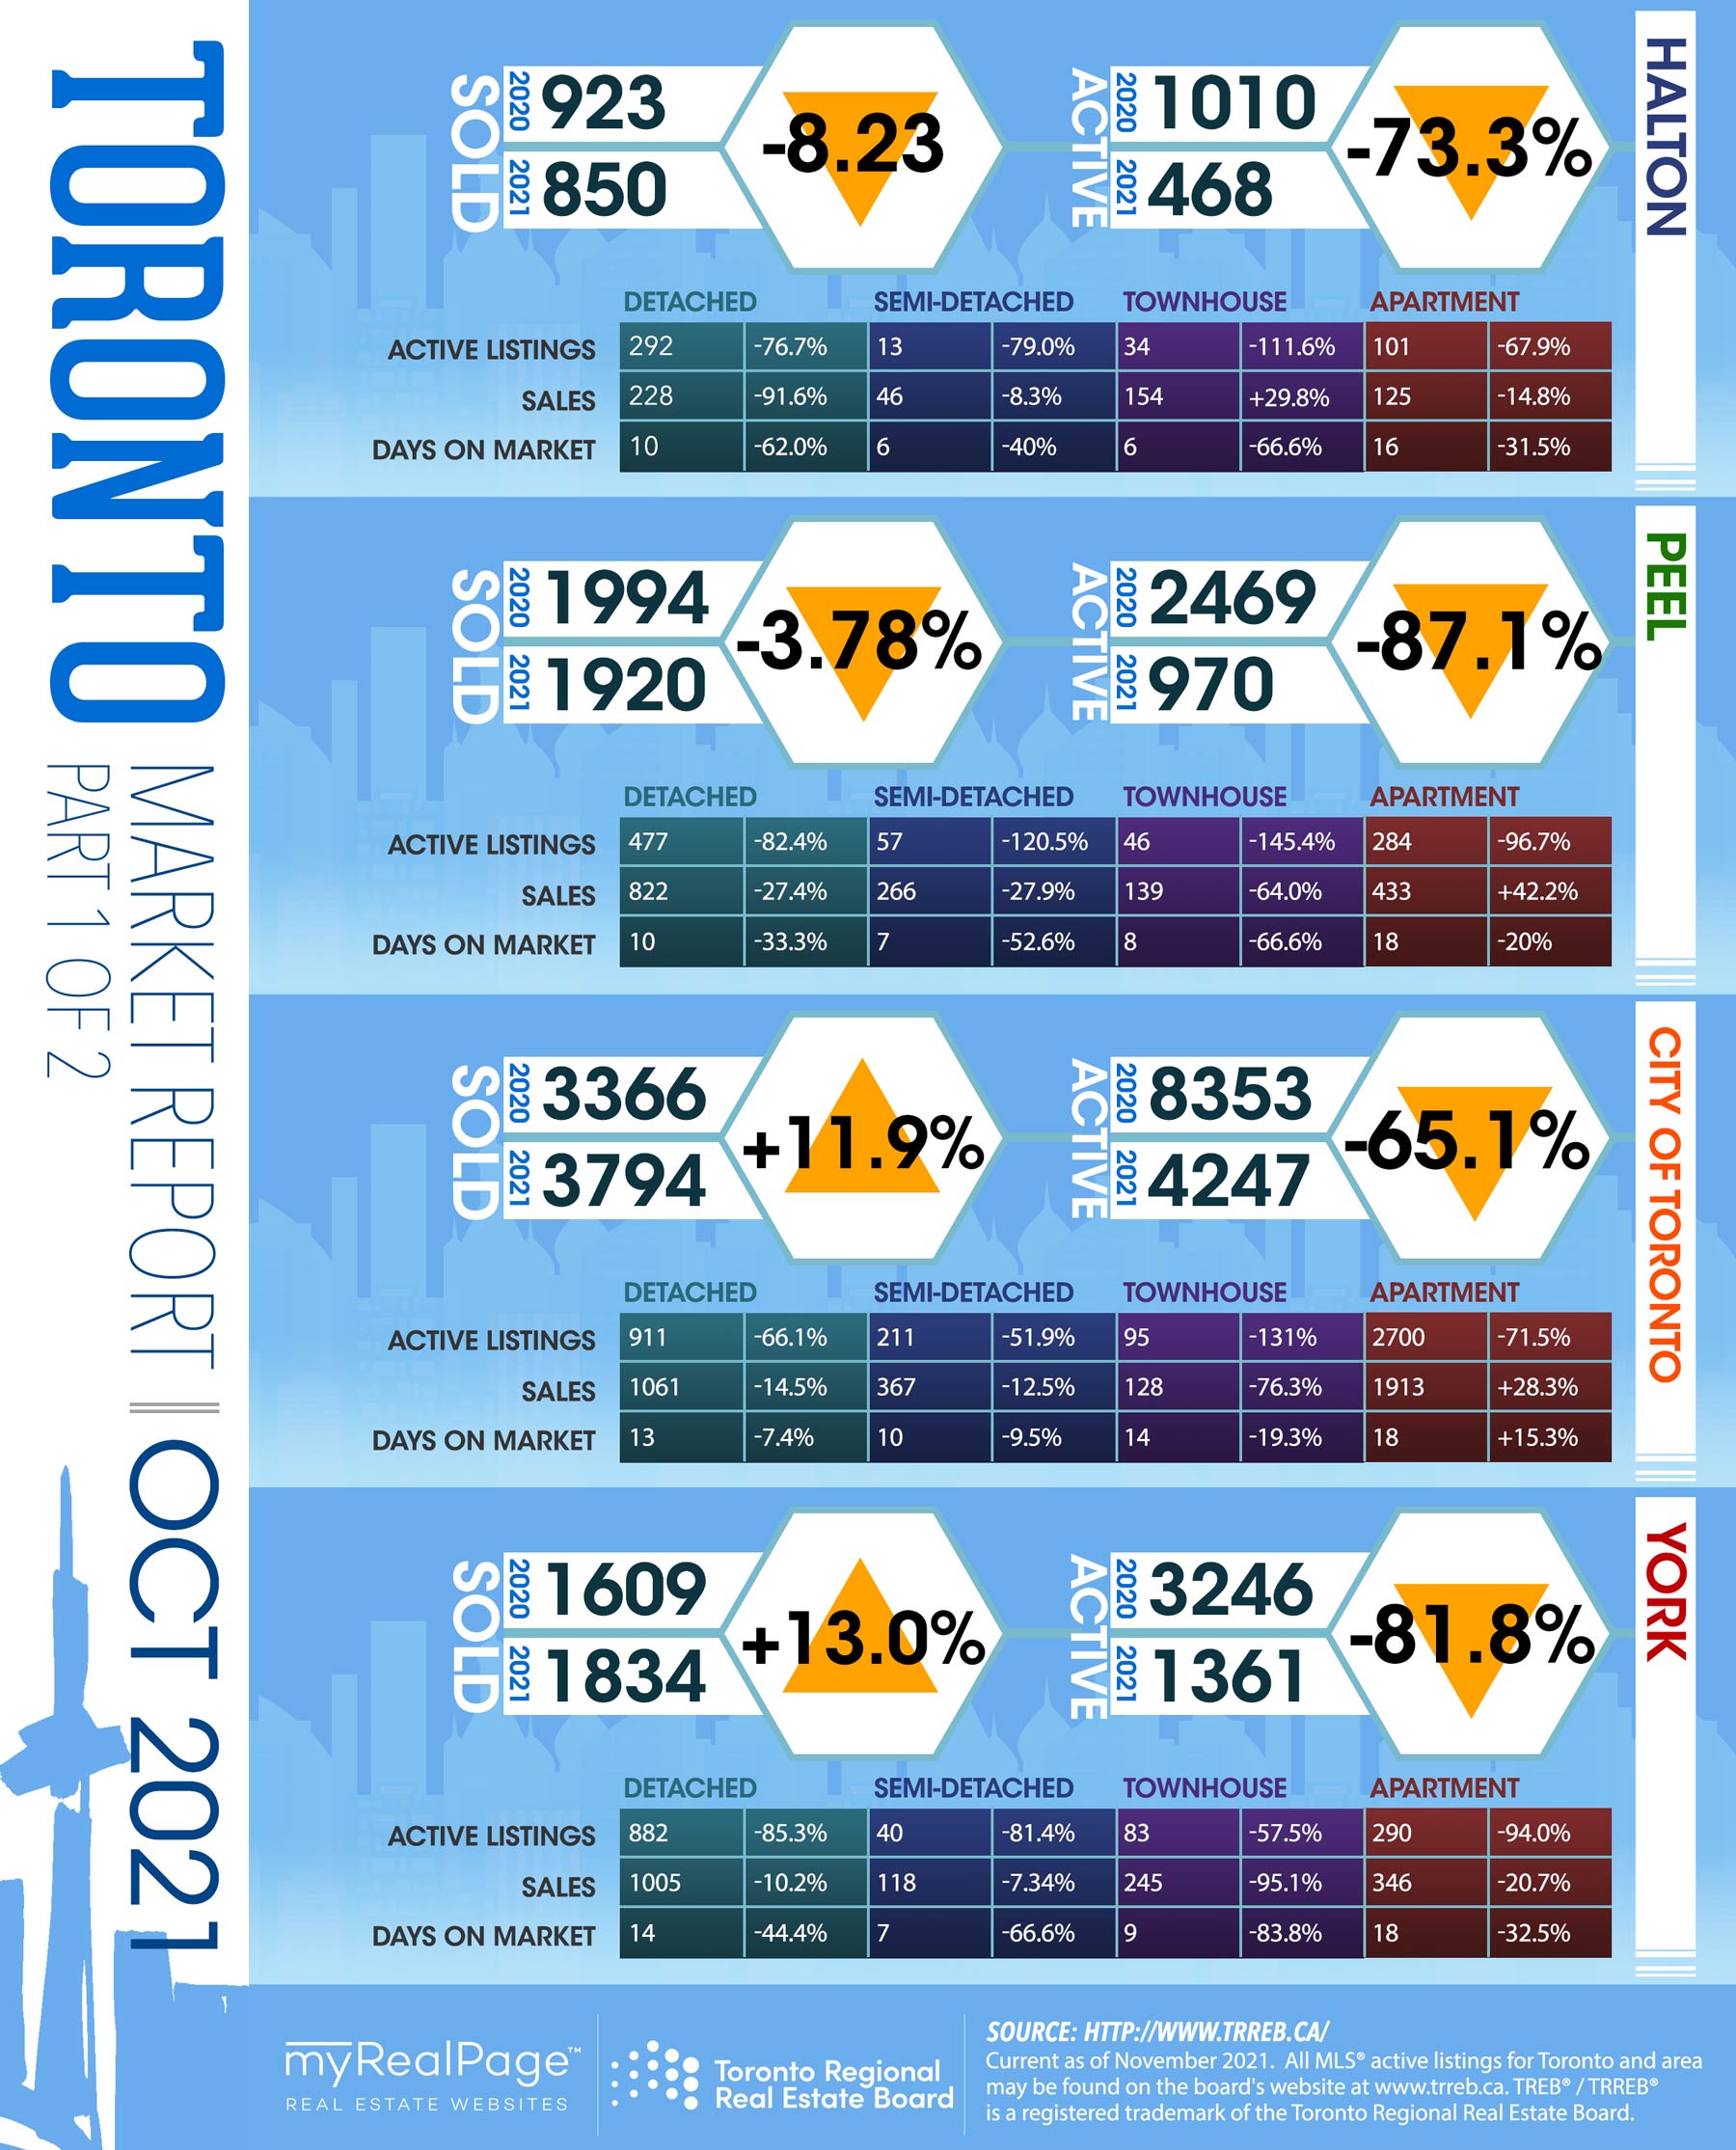
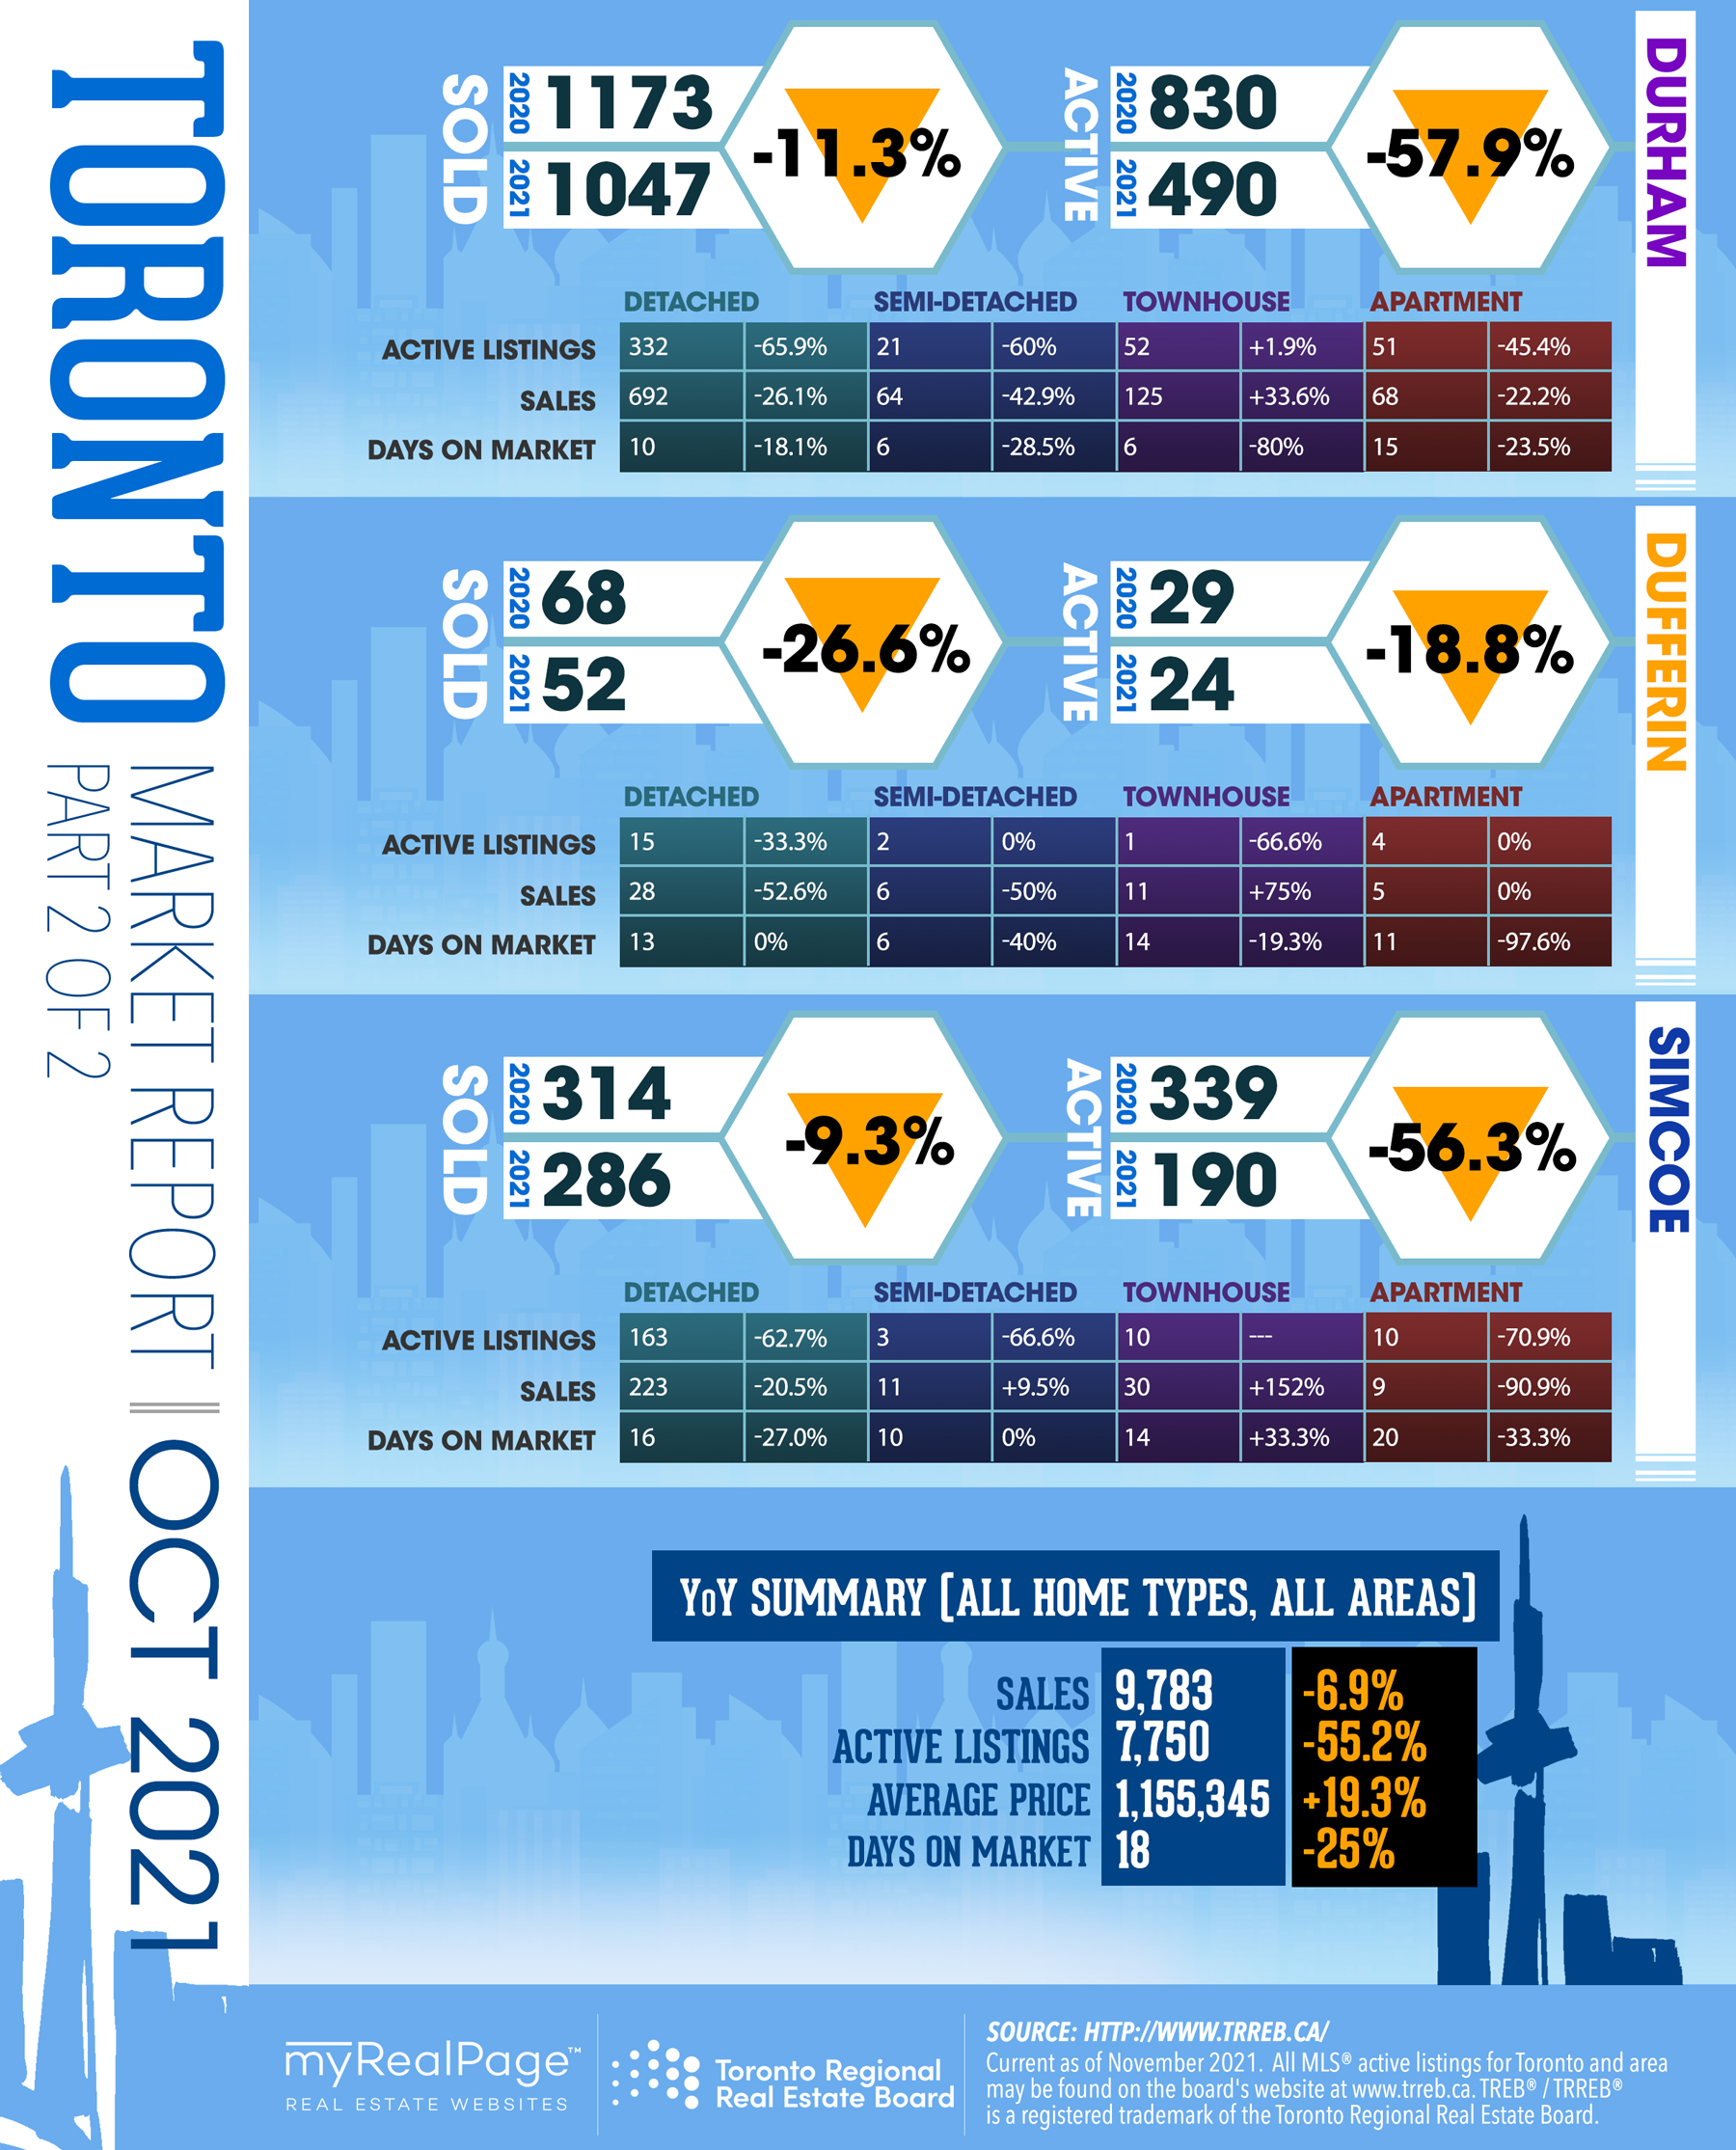
Home sales in the Greater Toronto Area (GTA) reached the second-highest level on record for the month of October. However, the inventory of homes for sale did not keep up with demand. The number of new listings was down by approximately one-third compared to October 2020. Market conditions tightened across all major home types compared to last year, and the annual rate of average price growth remained in the double digits, including for the resurgent condominium apartment segment.
“The only sustainable way to address housing affordability in the GTA is to deal with the persistent mismatch between demand and supply. Demand isn’t going away. And that’s why all three levels of government need to focus on supply. The federal government has stated that collaboration with provinces and municipalities is required. This collaboration could be spearheaded, at least in part, with housing-related incentives tied to federal infrastructure investment,” said TRREB President Kevin Crigger.
Read the full report on TRREB website!
The following data is a comparison between October 2020 and October 2021 numbers, and is current as of November 2021. For last month’s numbers, check out our previous infographic!
Or follow this link for all our TREB / TRREB Infographics!
Download Printable Version – September 2021 TRREB, Toronto Market Report Part 1
Download Printable Version – September 2021 TRREB, Toronto Market Report Part 2
Last Updated on July 25, 2022 by myRealPage
