INFOGRAPHICS: February 2024 FVREB Fraser Valley Market Reports
Sales, listings continue to pick up heading into spring
Home sales in the Fraser Valley posted a second consecutive bump in February as new listings continue to rise and trend slightly above the 10-year seasonal average.
The Fraser Valley Real Estate Board recorded 1,235 transactions on its Multiple Listing Service® (MLS®) in February, a 32 per cent increase over January but still 21 per cent below the 10-year average for sales in the region. New listings increased to 2,797 in February, up 18 per cent from January and 4 per cent above the 10-year average.
“There is somewhat of a buzz in the market right now,” said Narinder Bains, Chair of the Fraser Valley Real Estate Board.
“We are seeing new listings come onto the market and REALTORS® continue to see more traffic at open houses, however buyers are still exercising caution. We aren’t out of the woods just yet, but the signs are pointing to a further increase in activity as we head into spring.”
Read the full report on the FVREB website!
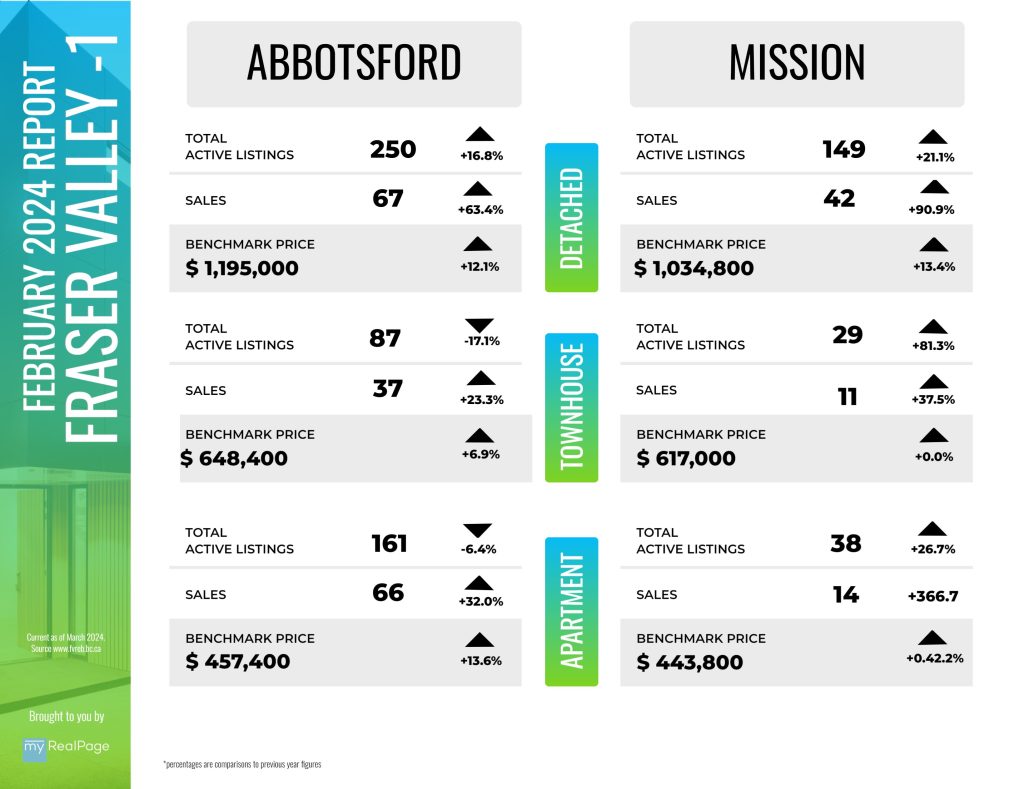
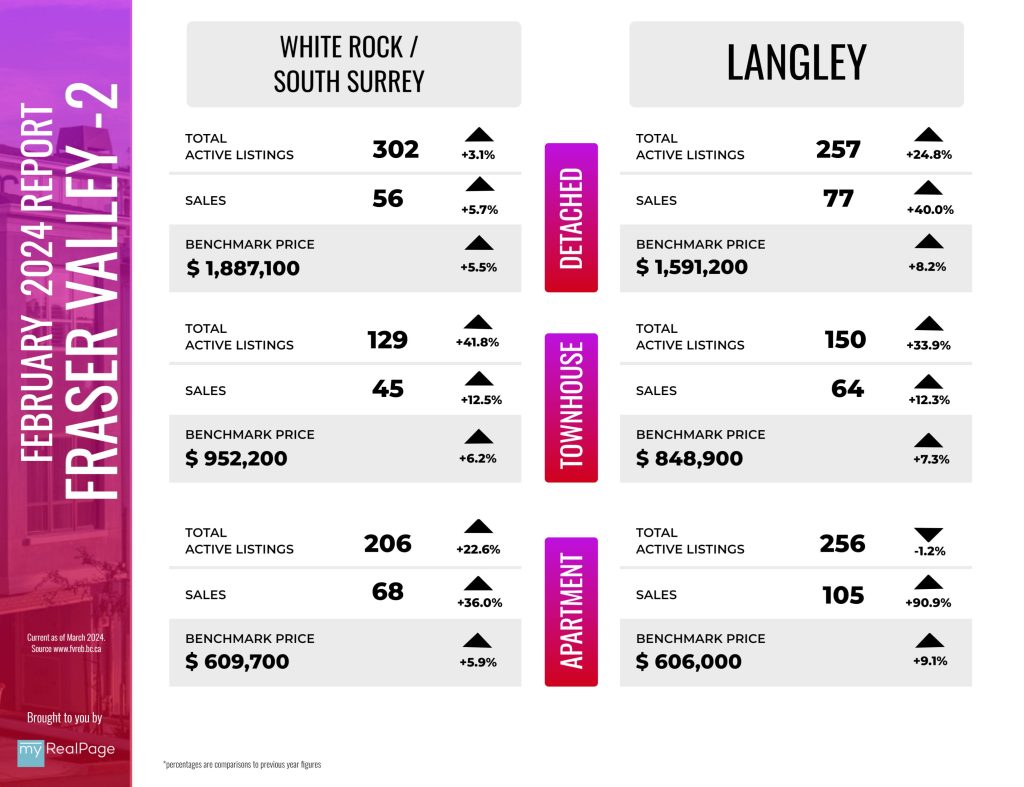
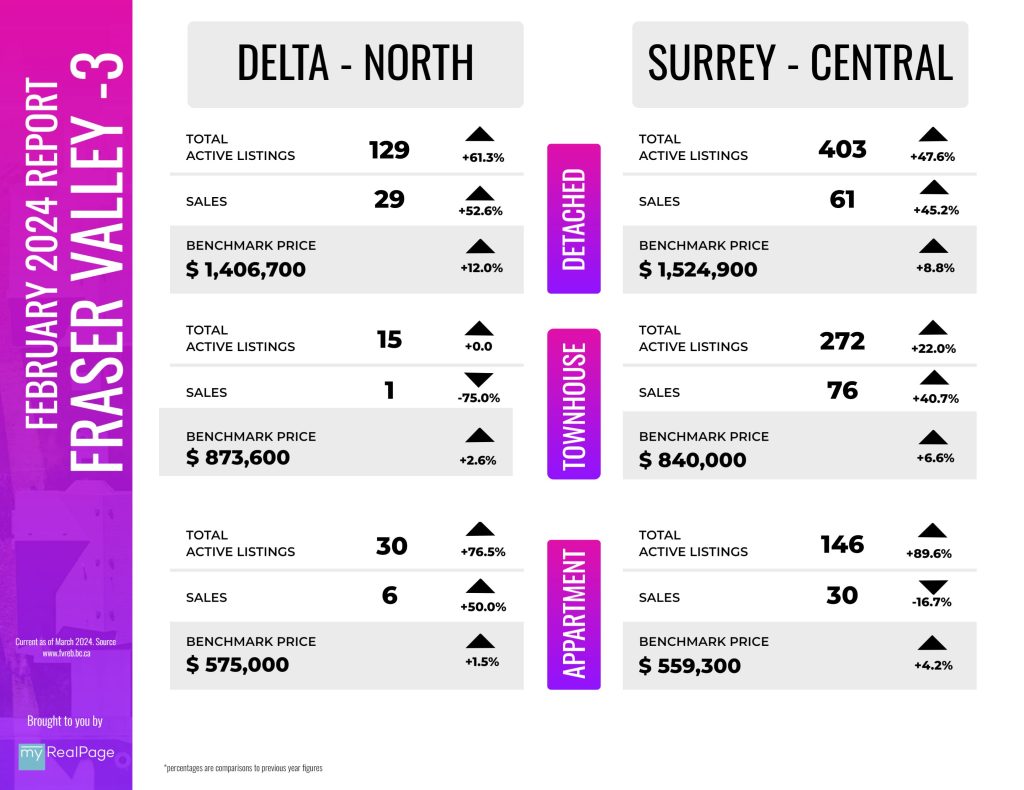
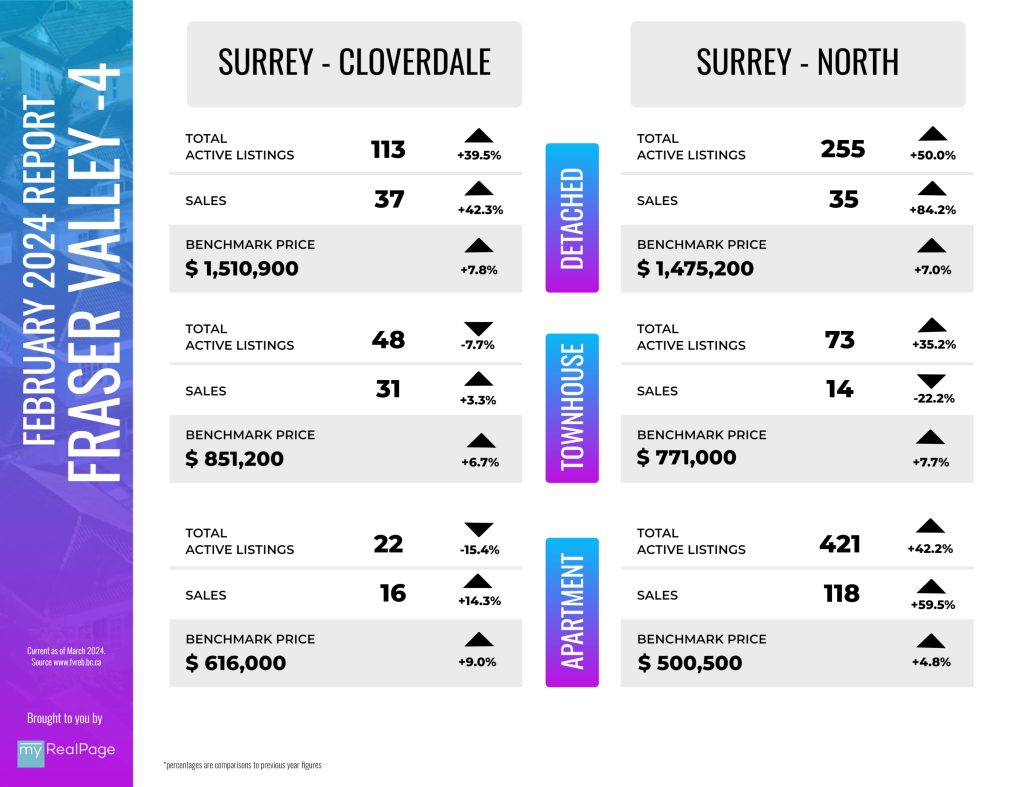
The following data is a comparison between February 2024 and February 2023 numbers, and is current as of March 2024. For last month’s report, check out our previous infographic!
Or follow this link for all our FVREB Infographics!
These infographics cover current trends in Fraser Valley neighbourhoods that are within the FVREB. Click on the images for a larger view!
Download Printable Version – FVREB February 2024 Market Report 1
Download Printable Version – FVREB February 2024 Market Report 2
Download Printable Version – FVREB February 2024 Market Report 3
Download Printable Version – FVREB February 2024 Market Report 4
Last Updated on May 9, 2024 by myRealPage


