INFOGRAPHICS: November 2021 FVREB Fraser Valley, South Surrey, Etc. Market Reports
Fraser Valley home sales continued to soar in November further depleting supply
Robust demand for Fraser Valley real estate continued in November, with the Fraser Valley Real Estate Board (FVREB) recording the region’s second-highest volume of sales of all property types for the month – second only to November 2020.
In November, the FVREB processed 1,972 sales of all property types on its Multiple Listing Service® (MLS®), a decrease of 9.2 per cent compared to the 2,173 sales in November of last year, and a 1.8 per cent increase month-over-month compared to the 1,938 sales in October.
Read the full report on the FVREB website!
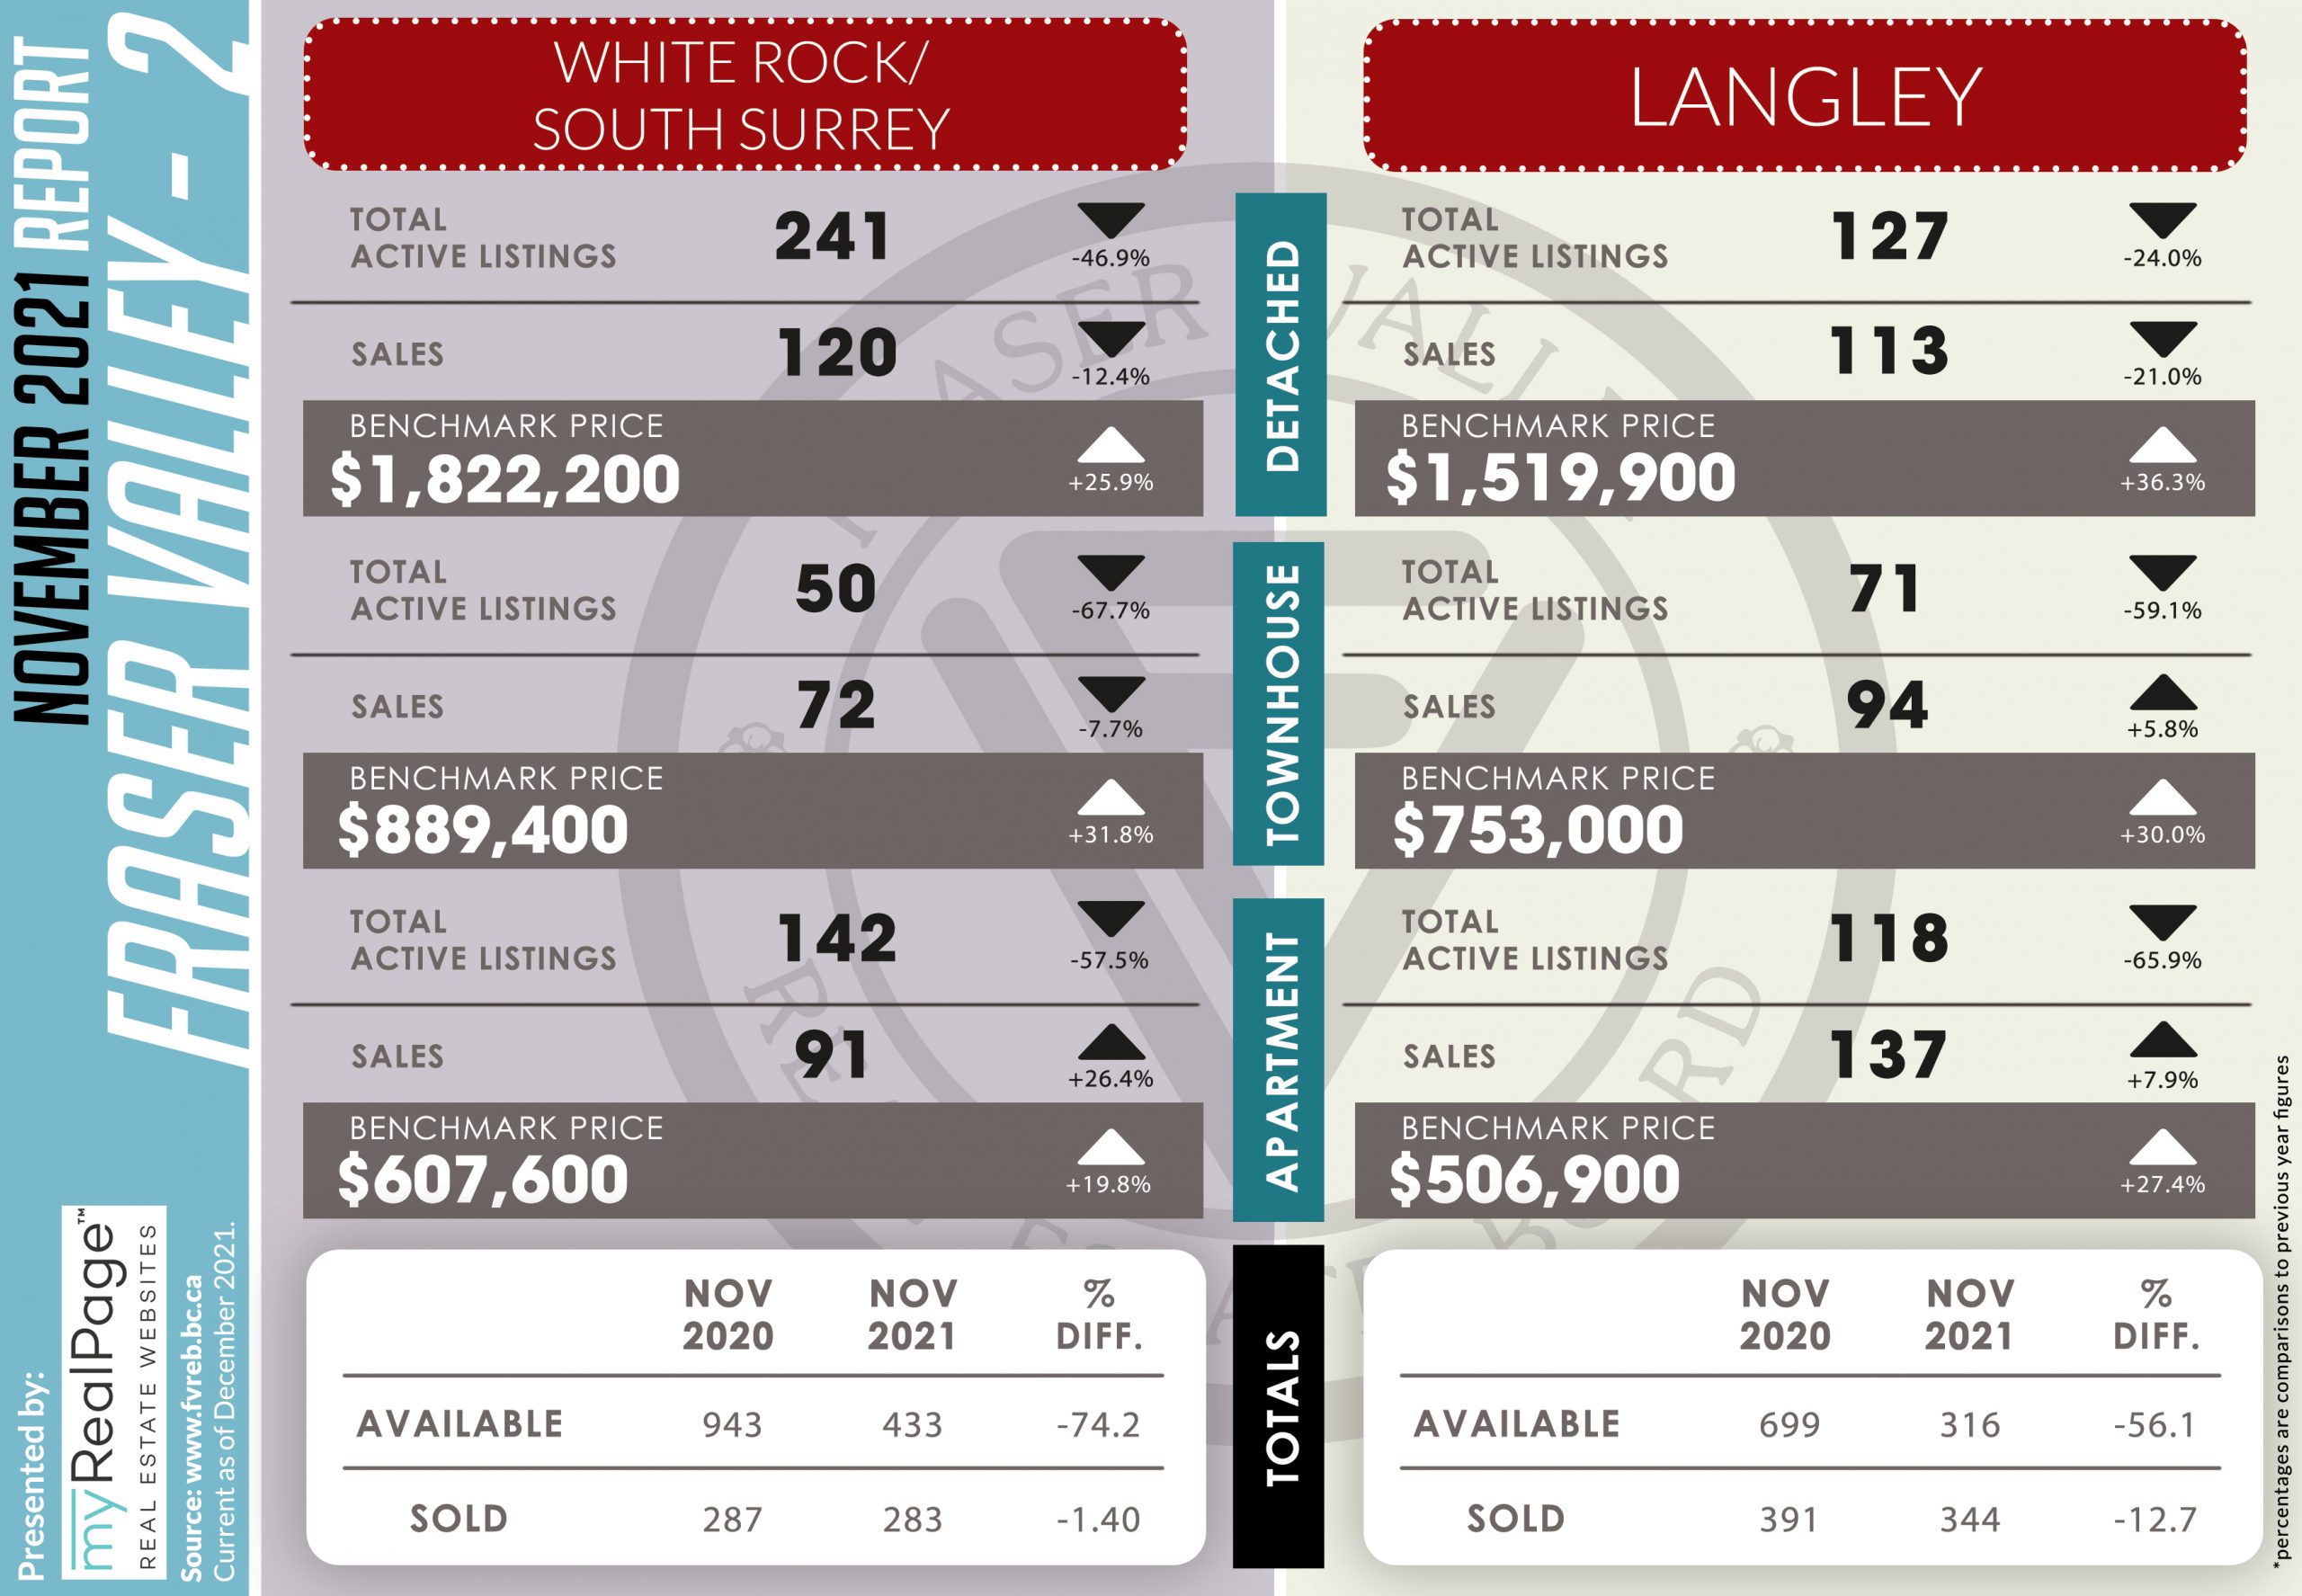
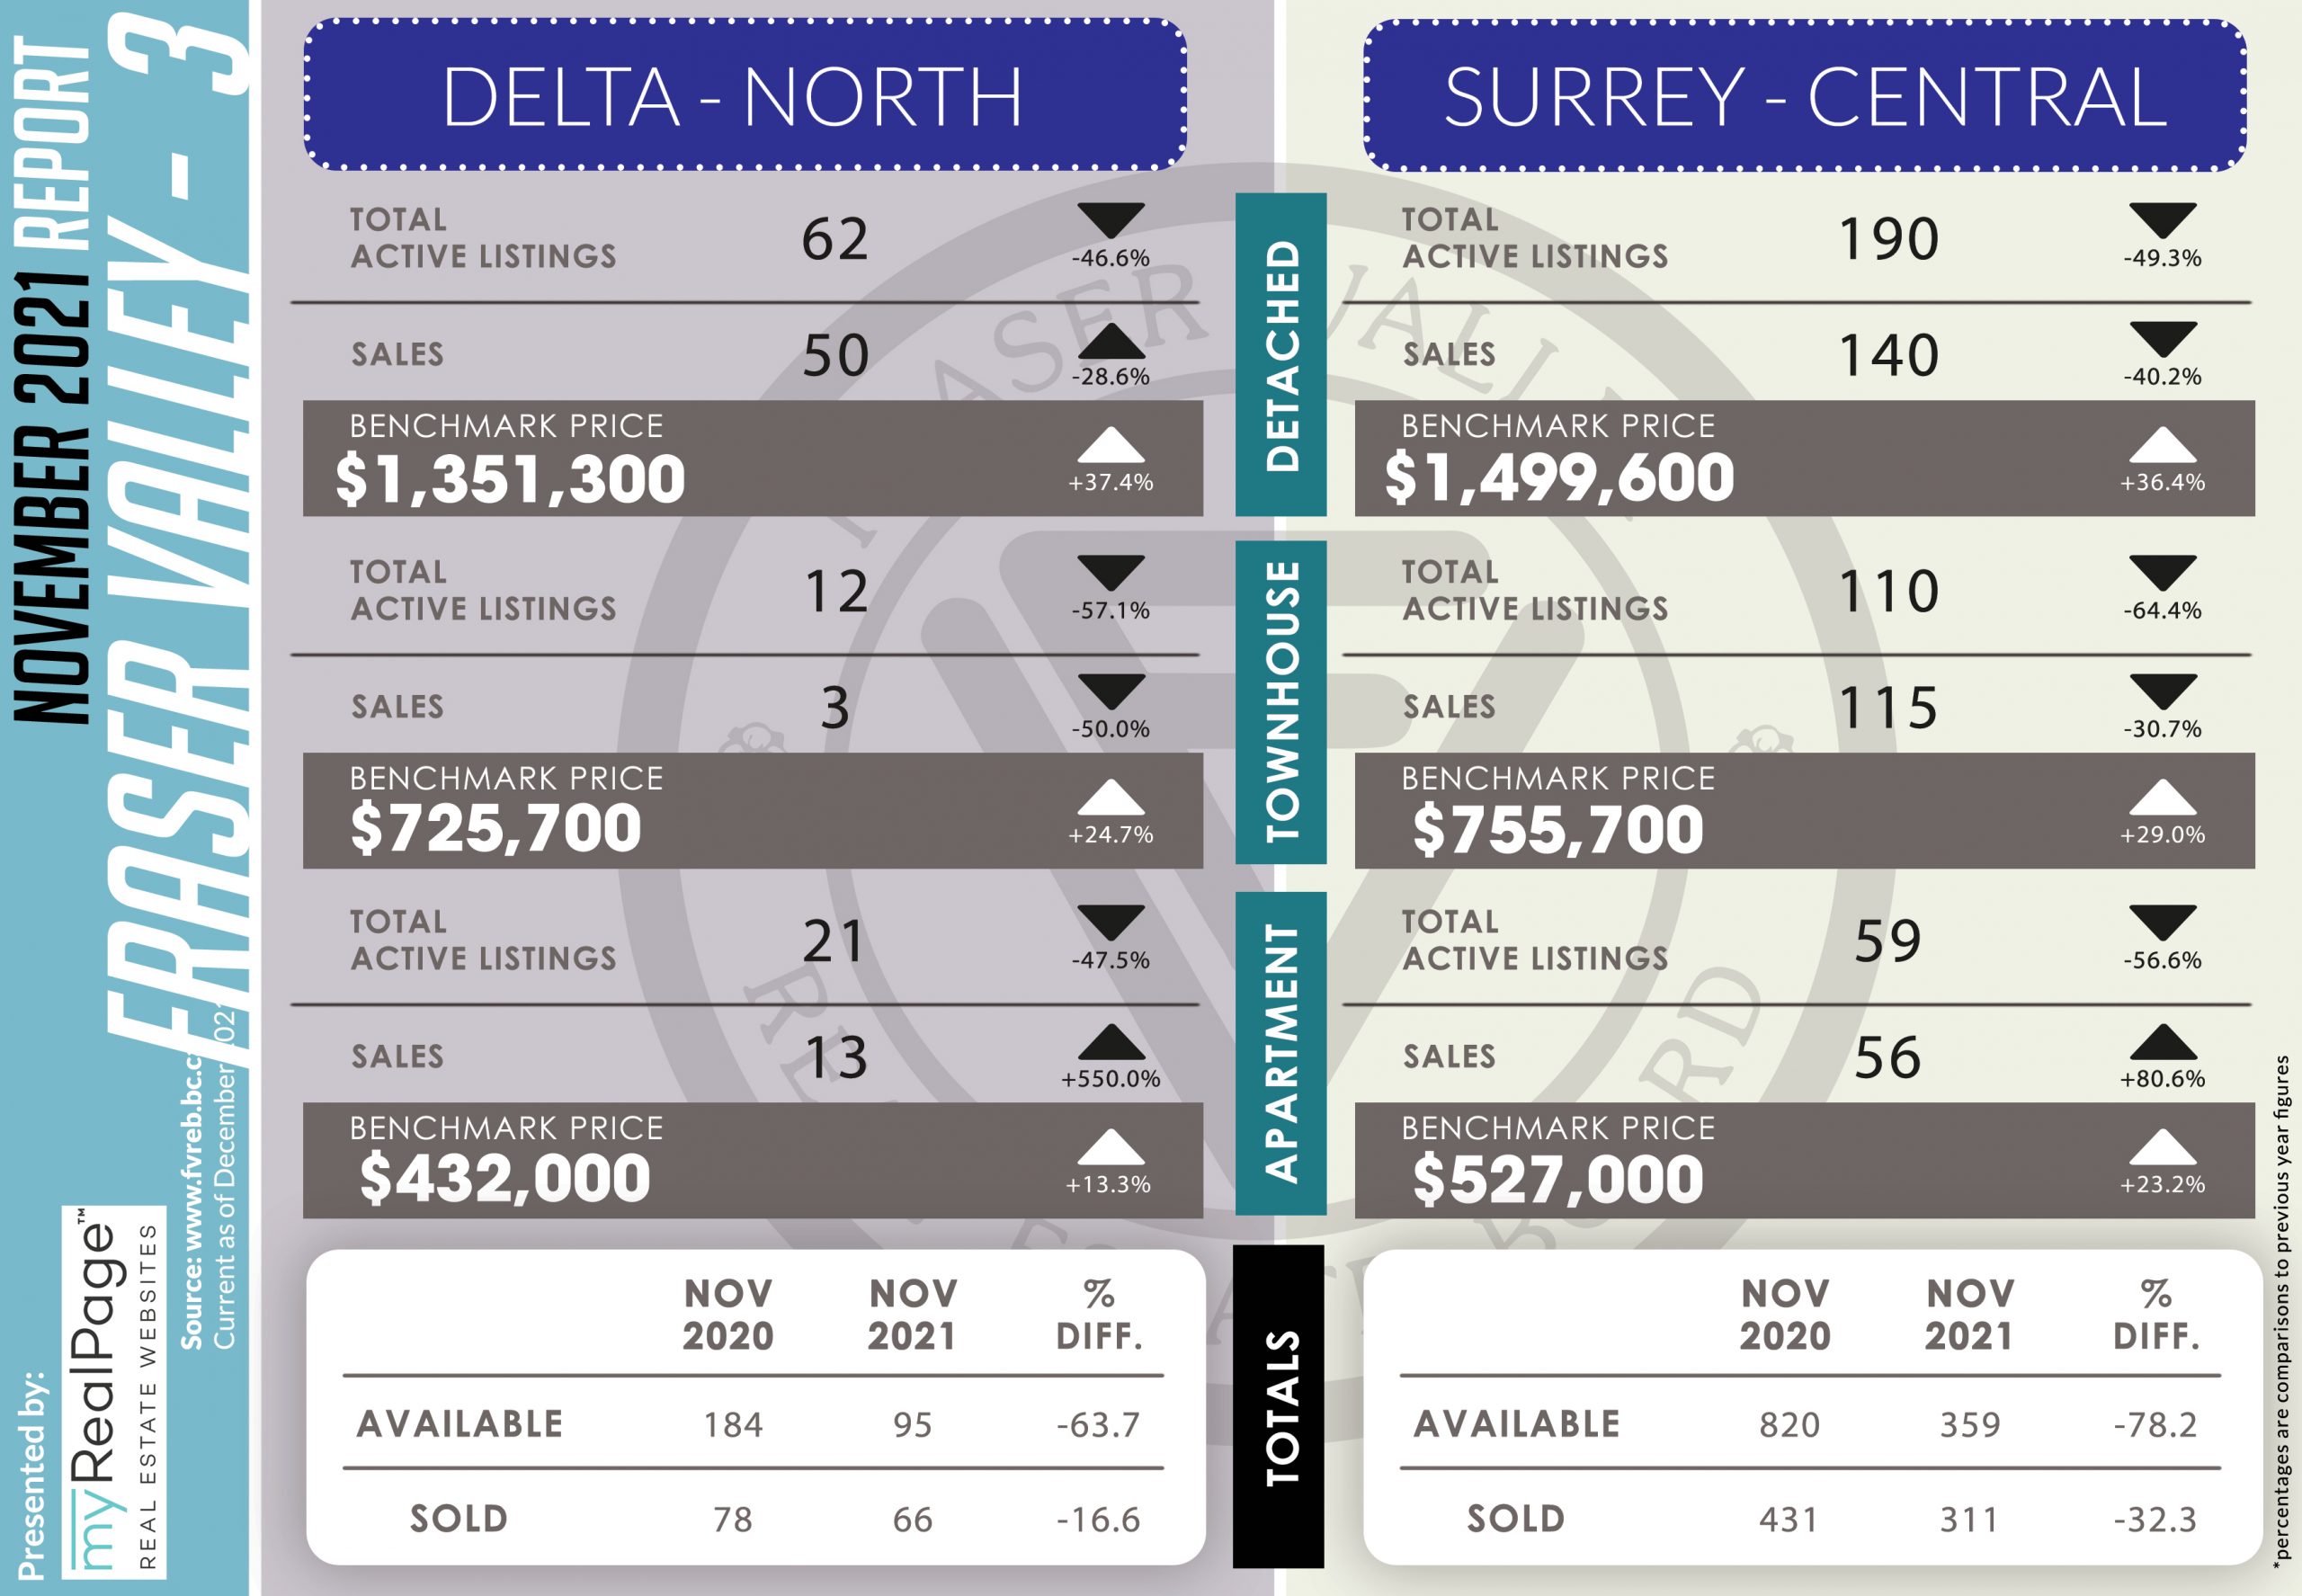
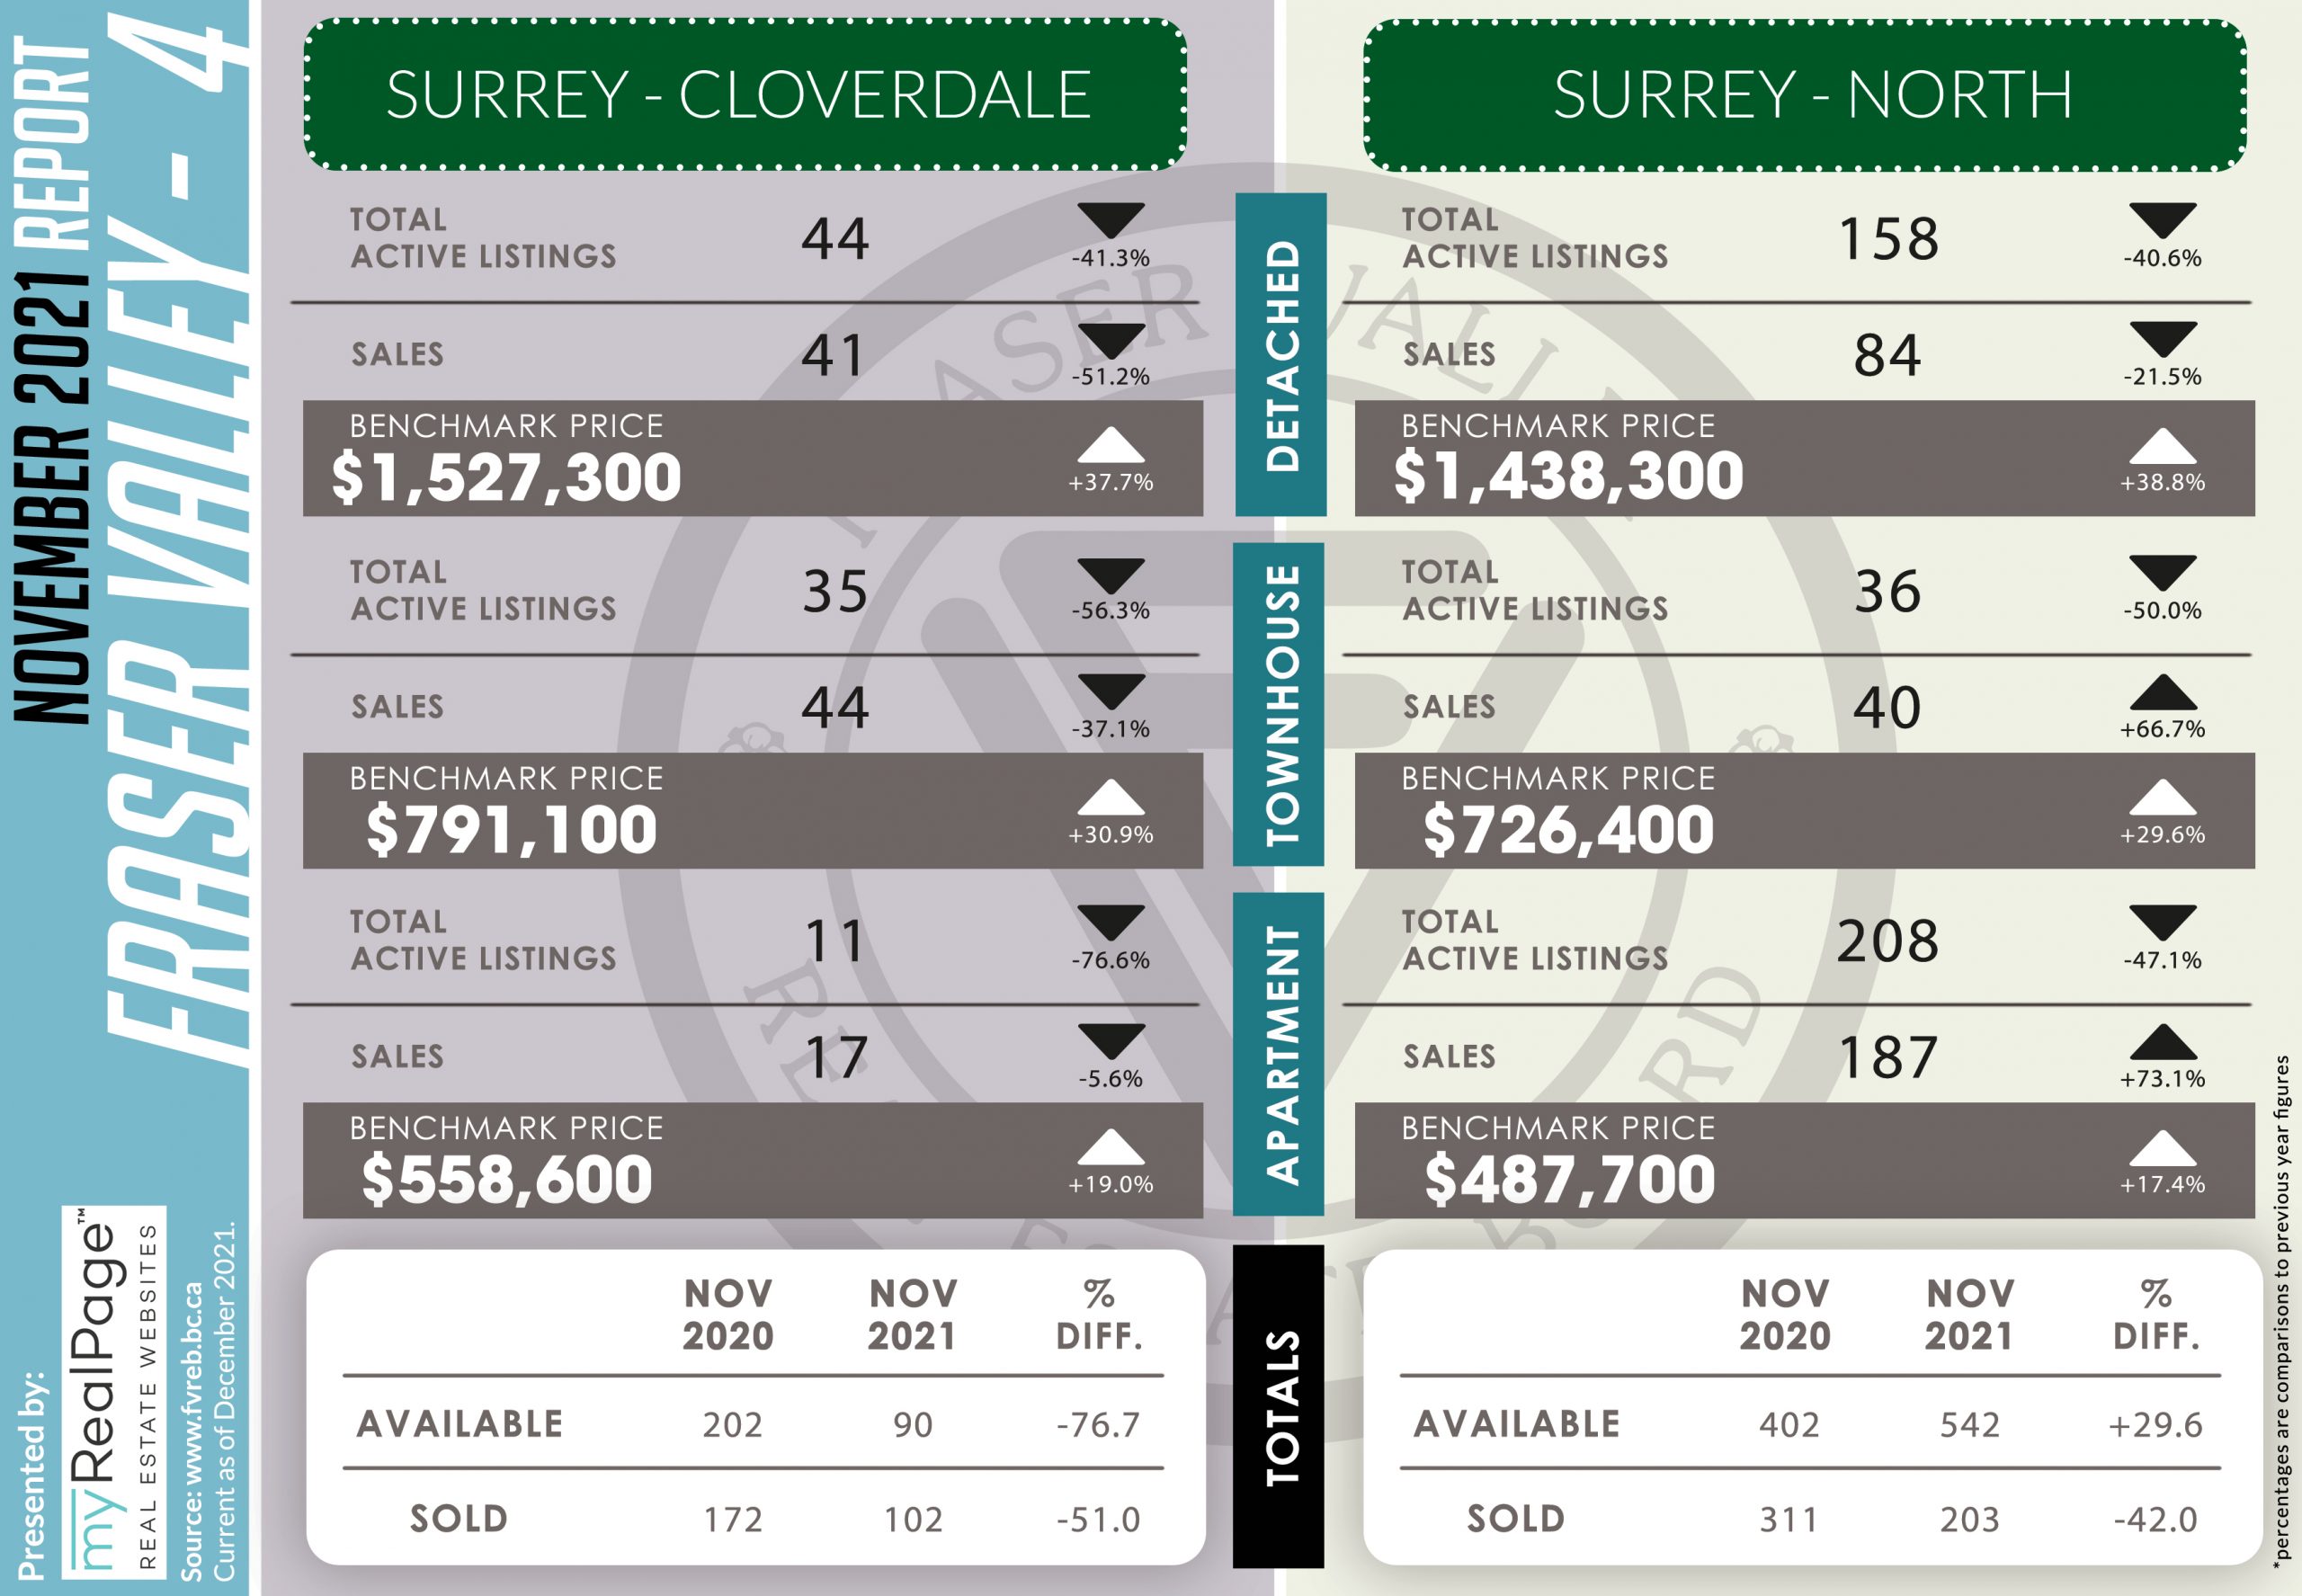
The following data is a comparison between November 2020 and November 2021 numbers, and is current as of December 2021. For last month’s report, check out our previous infographic!
Or follow this link for all our FVREB Infographics!
These infographics cover current trends in Fraser Valley neighbourhoods that are within the FVREB. Click on the images for a larger view!
Download Printable Version – FVREB September 2021 Market Report 1
Download Printable Version – FVREB September 2021 Market Report 2
Download Printable Version – FVREB September 2021 Market Report 3
Download Printable Version – FVREB September 2021 Market Report 4

Last Updated on July 13, 2022 by myRealPage
