INFOGRAPHICS: October 2021 FVREB Fraser Valley, South Surrey, Etc. Market Reports

MLS® sales in the Fraser Valley remained strong in October while supply continued to diminish
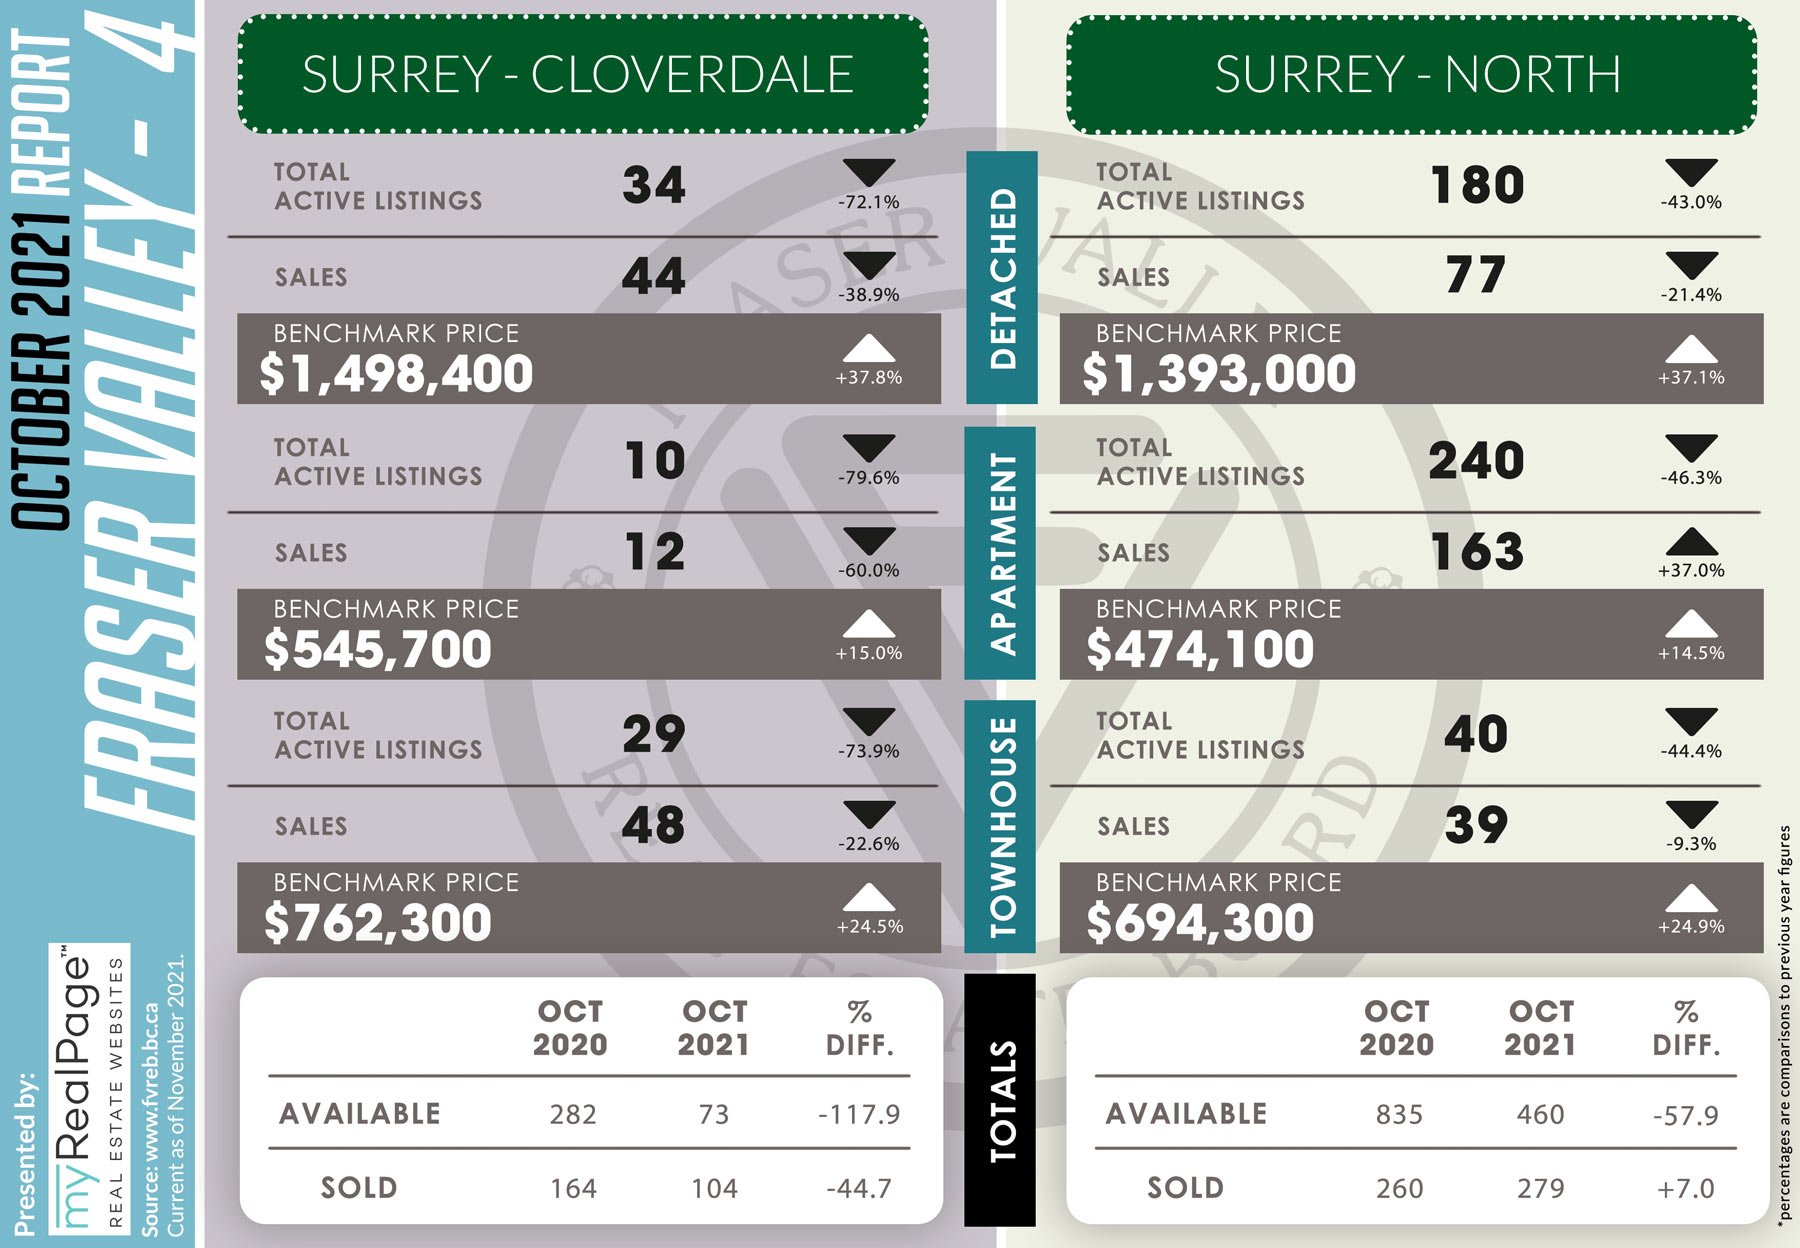
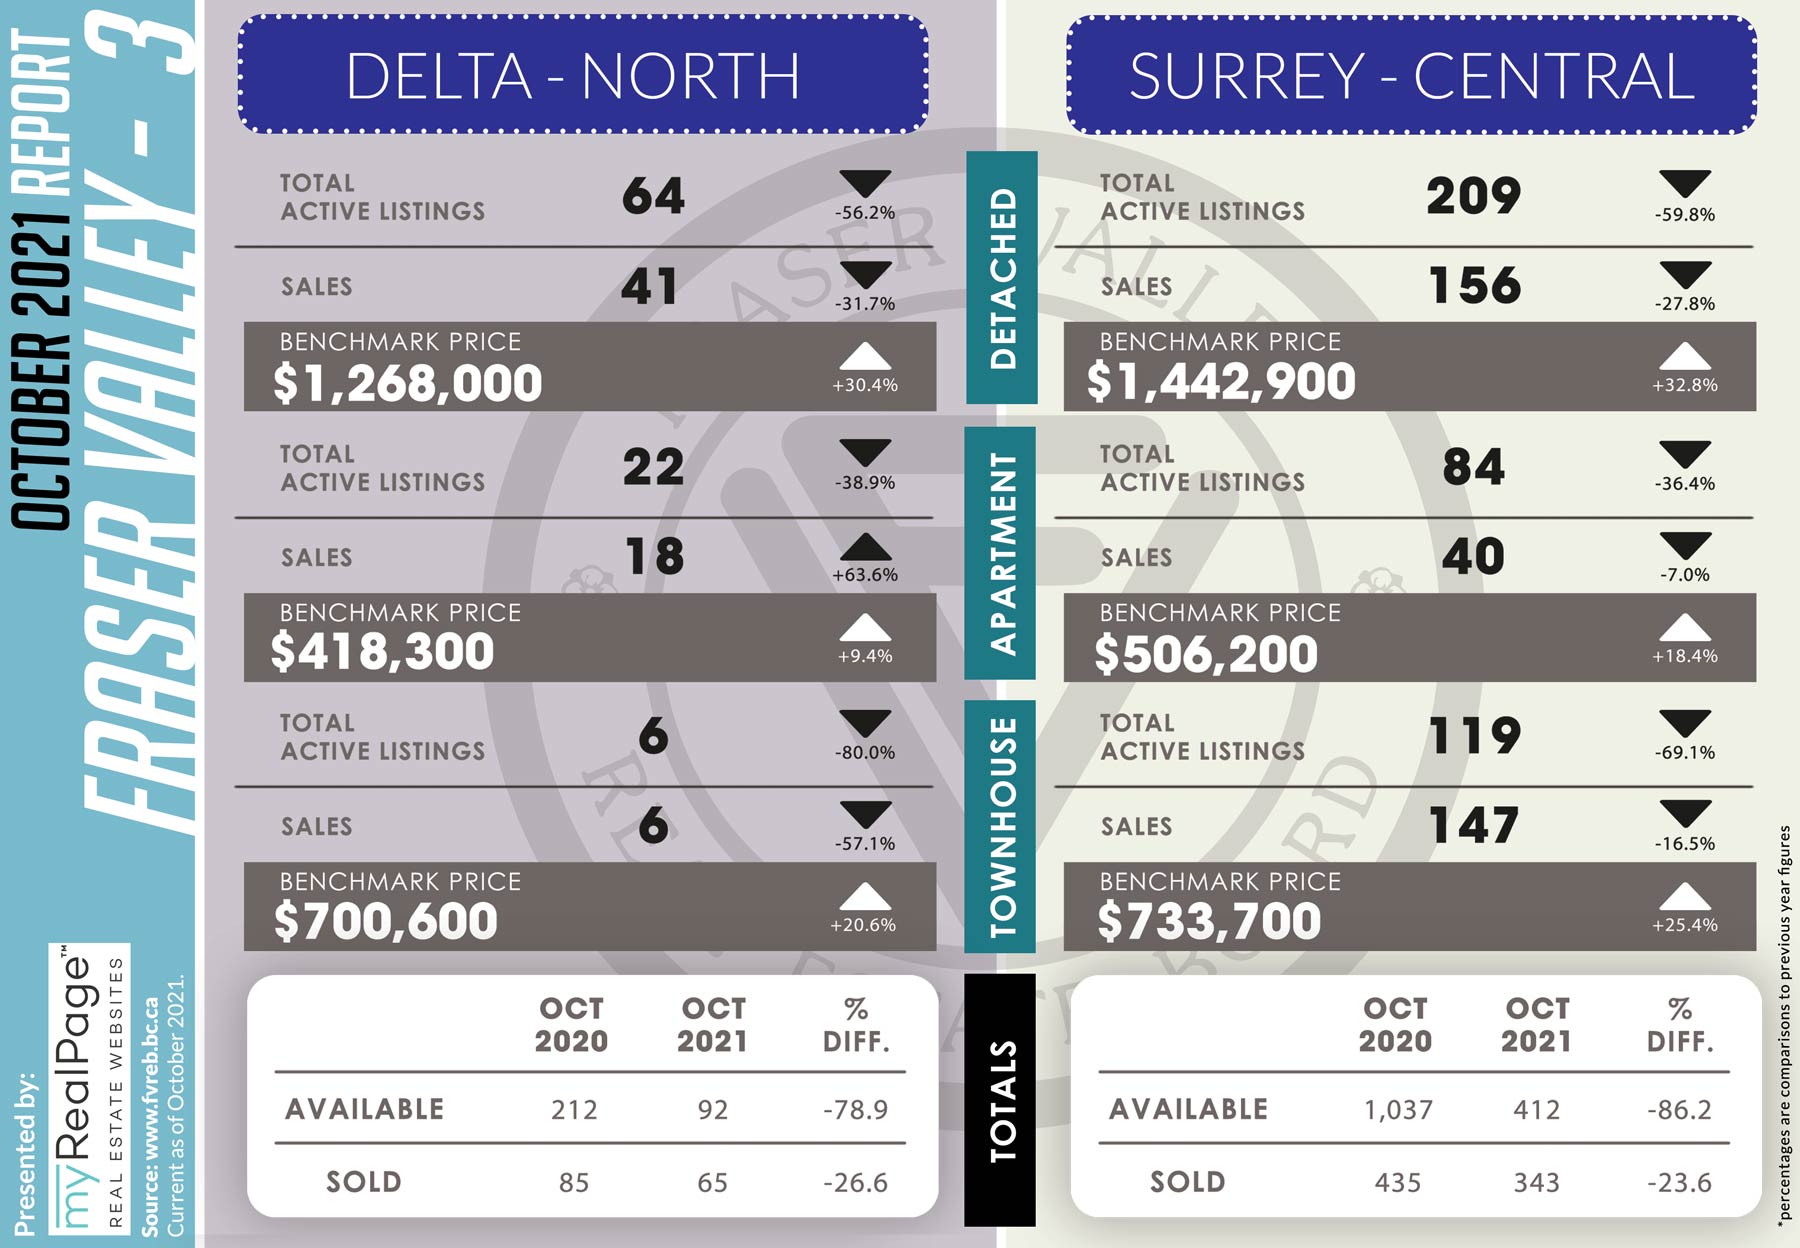
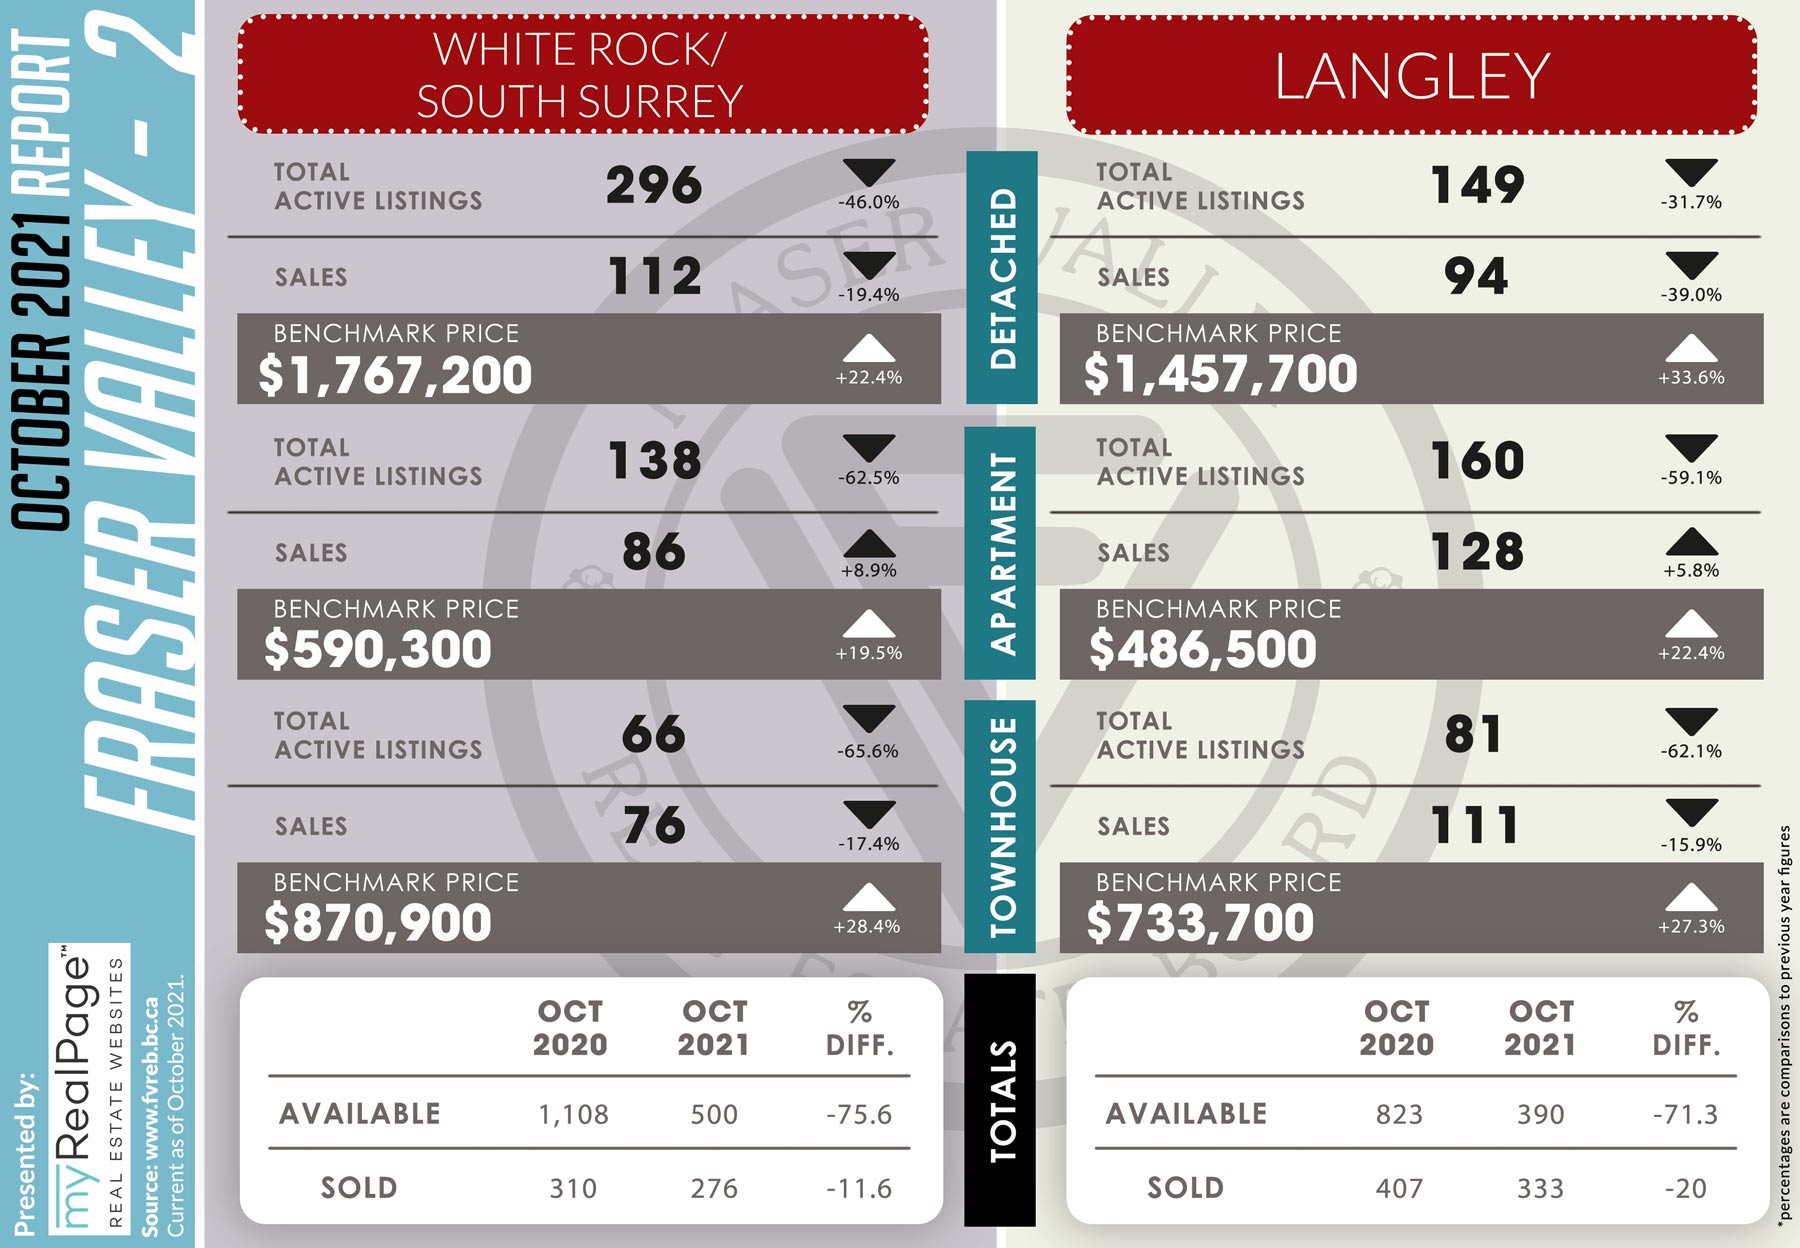
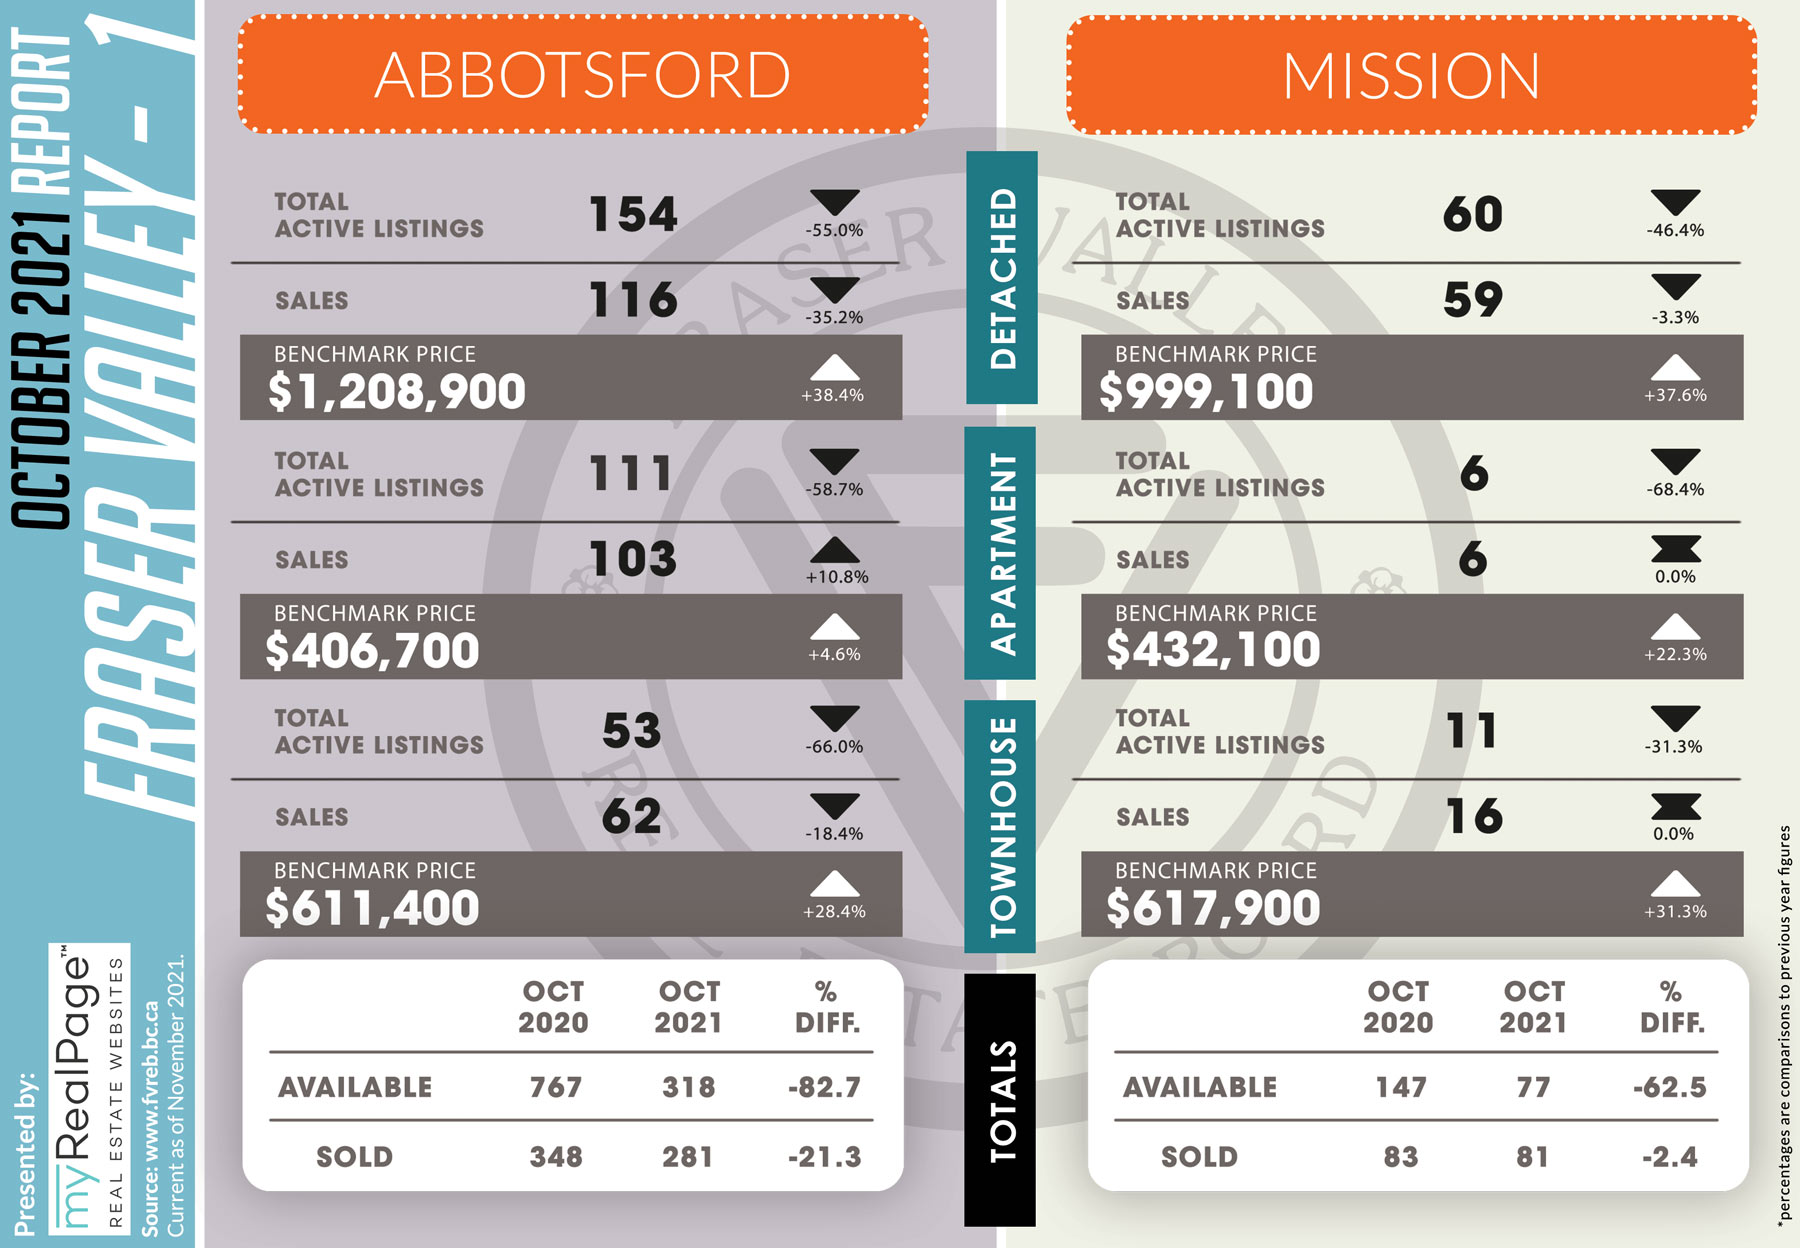
Demand for Fraser Valley real estate remained solid in October with overall sales the third highest on record.
The Board processed a total of 1,938 property sales on its Multiple Listing Service® (MLS®) in October, an increase of 3.9 per cent compared to September and a decrease of 18.2 per cent compared to the same month last year.
Larry Anderson, President of the Board, said, “What we’re seeing is a combination of above‐average sales with below‐average new listings which is placing strong upward pressure on home prices, for all residential categories, month‐over‐month.
Read the full report on the FVREB website!
The following data is a comparison between October 2020 and October 2021 numbers, and is current as of November 2021. For last month’s report, check out our previous infographic!
Or follow this link for all our FVREB Infographics!
These infographics cover current trends in Fraser Valley neighbourhoods that are within the FVREB. Click on the images for a larger view!
Download Printable Version – FVREB September 2021 Market Report 1
Download Printable Version – FVREB September 2021 Market Report 2
Download Printable Version – FVREB September 2021 Market Report 3
Download Printable Version – FVREB September 2021 Market Report 4
Last Updated on July 25, 2022 by myRealPage
