INFOGRAPHICS: October 2023 FVREB Fraser Valley Market Reports
Fraser Valley real estate market weakens as sales and prices continue to edge downward
Property sales and new listings in the Fraser Valley fell again in October as consumers continued to put home buying and selling decisions on hold in the face of elevated interest rates.
The Fraser Valley Real Estate Board recorded 970 transactions on its Multiple Listing Service® (MLS®) in October, a drop of 12 per cent from the previous month and the fourth consecutive decrease since the 12- month high of 1,935 sales recorded in June.
At 2,535, new listings also fell again, decreasing by 11 per cent from September and by 28 per cent since peaking in May at 3,533.
“What we’re seeing in the Fraser Valley and indeed across the province is the impact of sustained high interest rates on the overall market,” said Narinder Bains, Chair of the Fraser Valley Real Estate Board. “This has been the case since the latter half of the year so far, and we anticipate the trend will continue until we start to see some downward movement in the policy rate.”
Read the full report on the FVREB website!
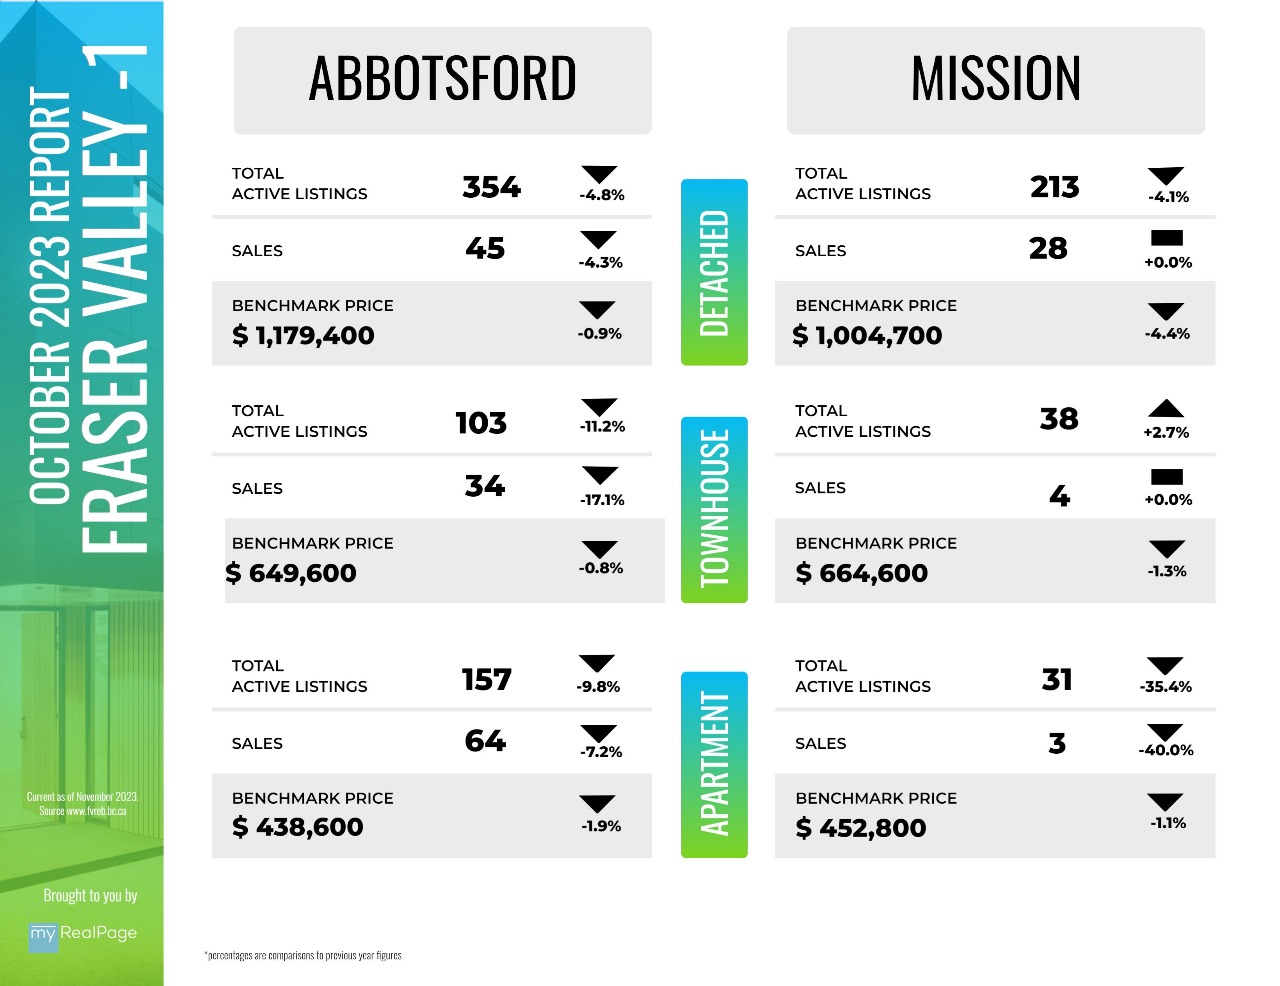
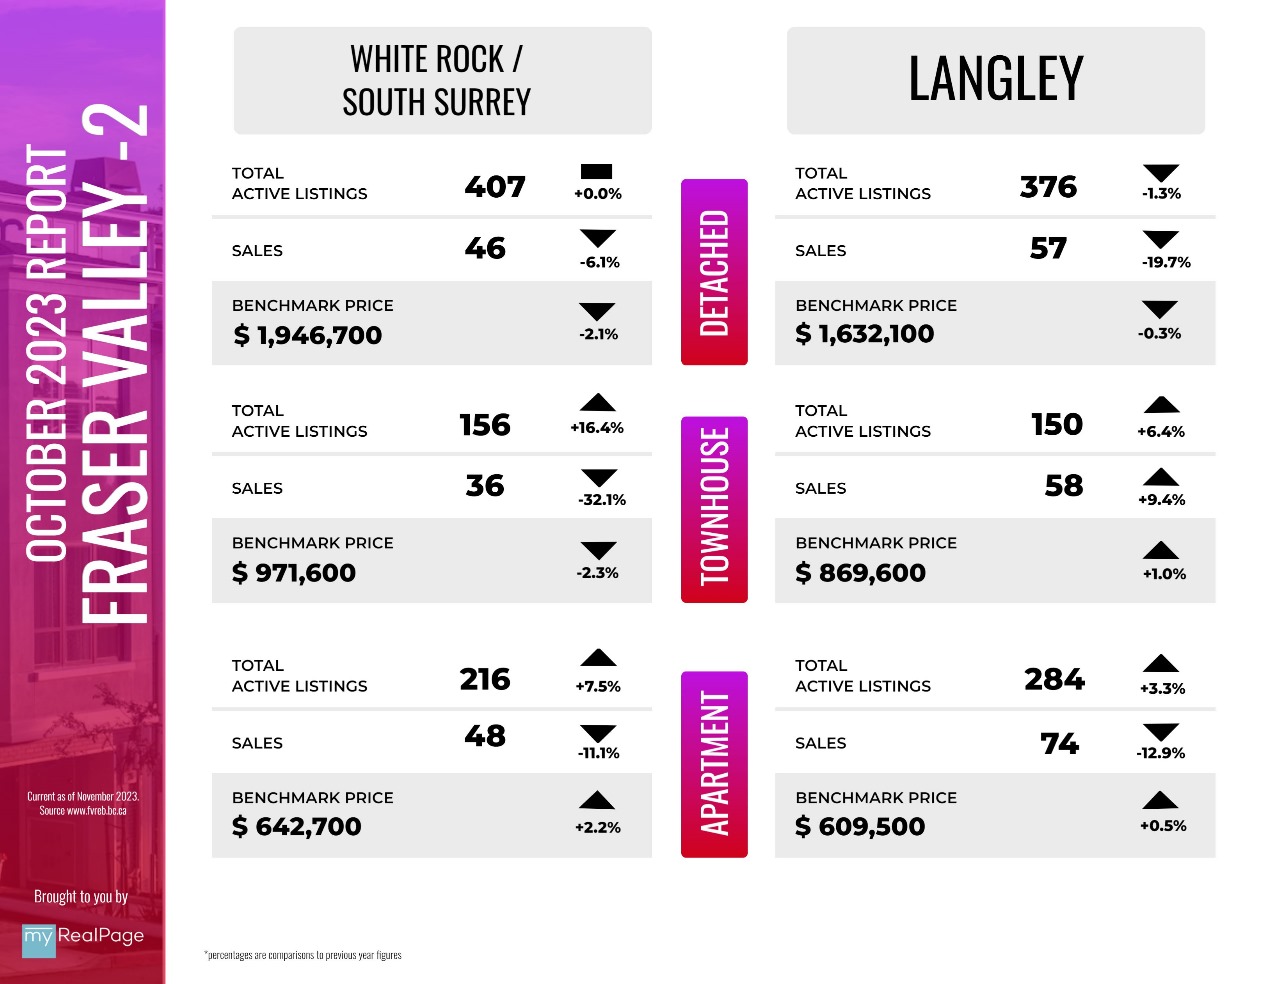
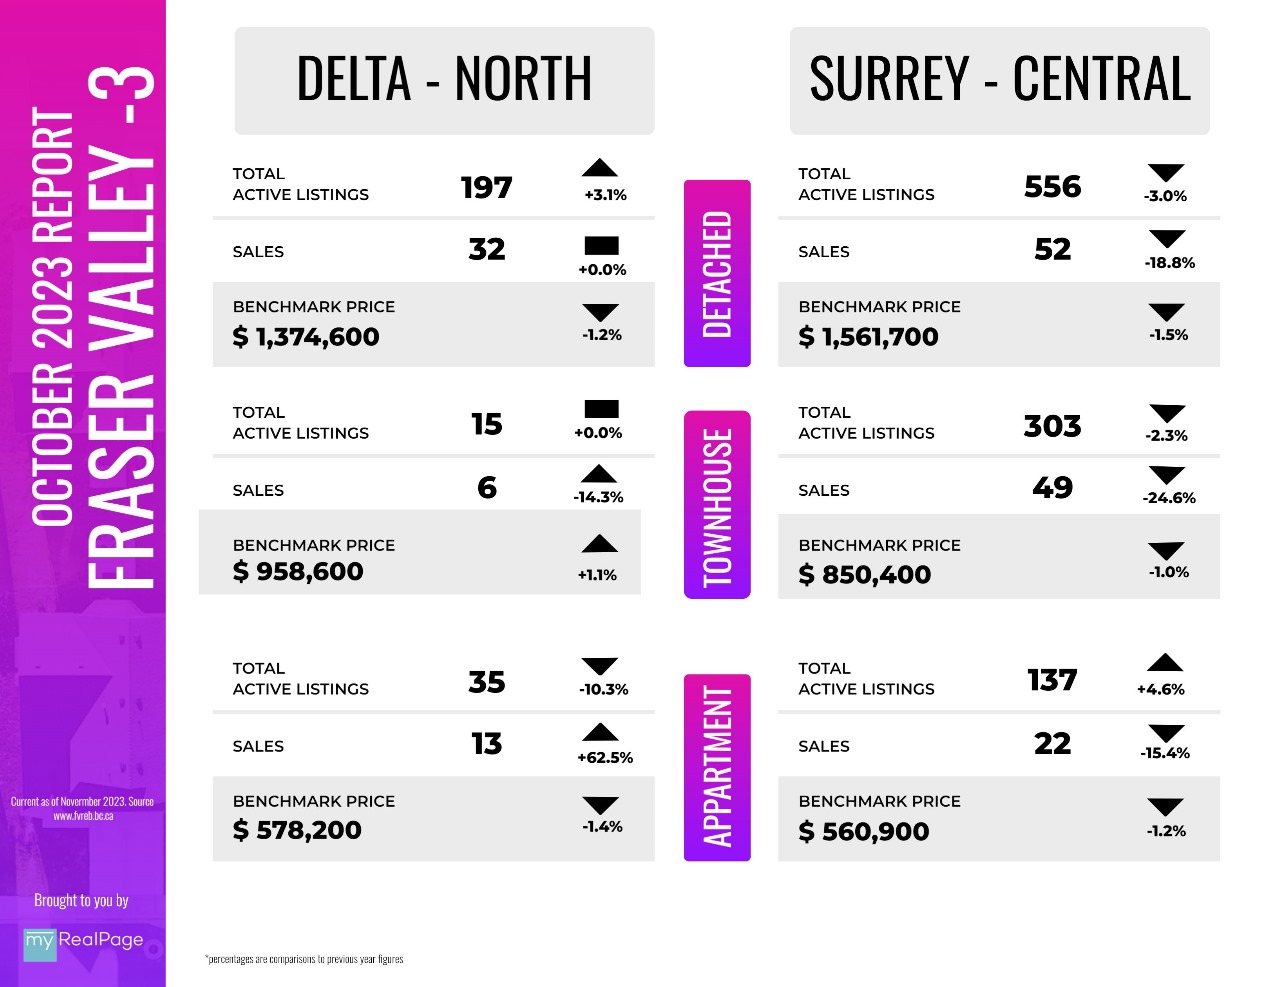
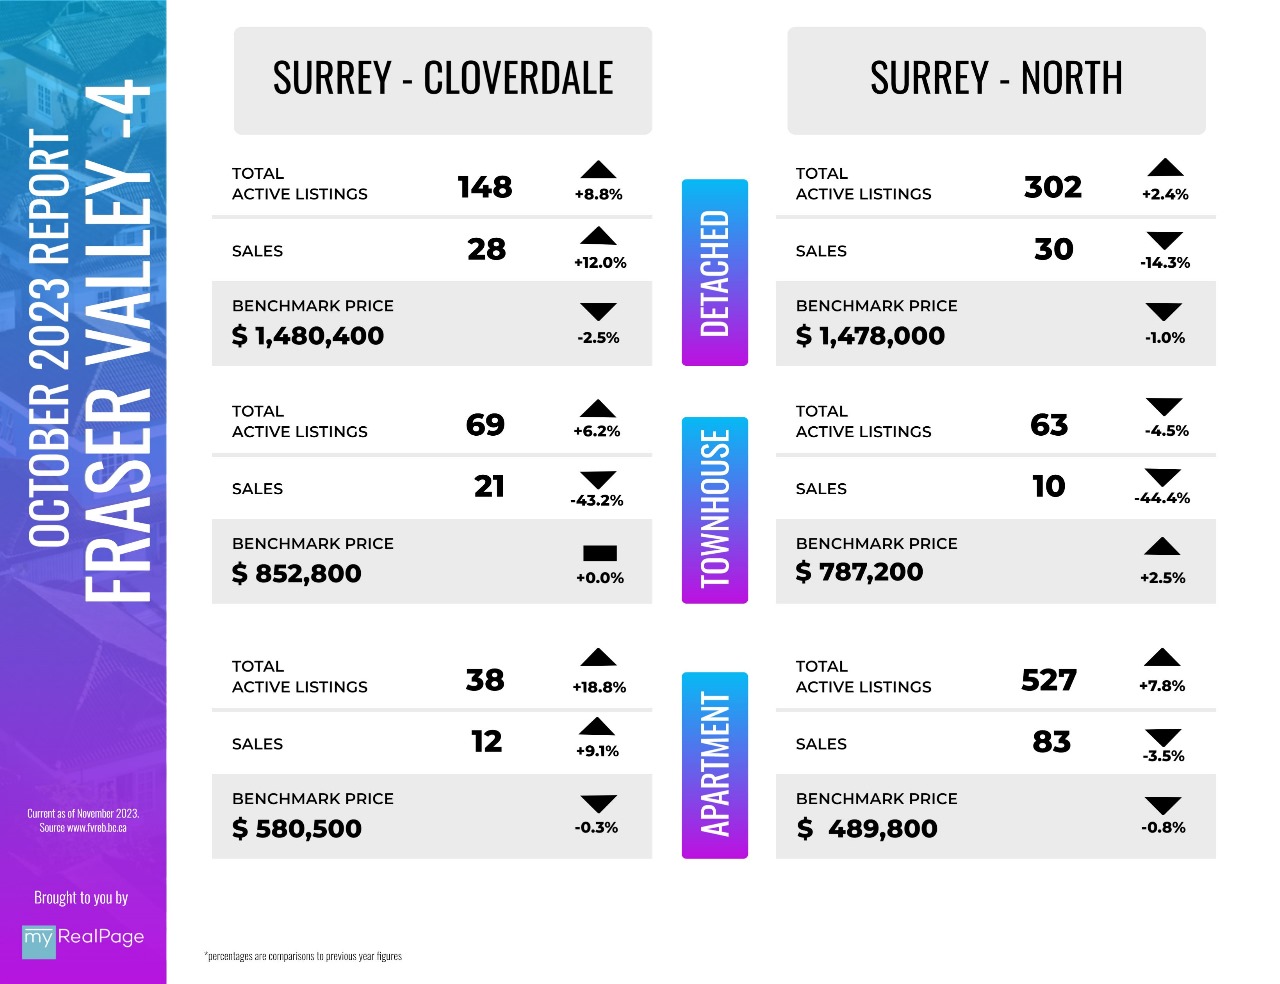
The following data is a comparison between October 2023 and October 2022 numbers, and is current as of November 2023. For last month’s report, check out our previous infographic!
Or follow this link for all our FVREB Infographics!
These infographics cover current trends in Fraser Valley neighbourhoods that are within the FVREB. Click on the images for a larger view!
Download Printable Version – FVREB October 2023 Market Report 1
Download Printable Version – FVREB October 2023 Market Report 2
Download Printable Version – FVREB October 2023 Market Report 3
Download Printable Version – FVREB October 2023 Market Report 4
Last Updated on May 9, 2024 by myRealPage
