INFOGRAPHICS: July 2023 TRREB Toronto Market Reports

GTA REALTORS® Release July Stats
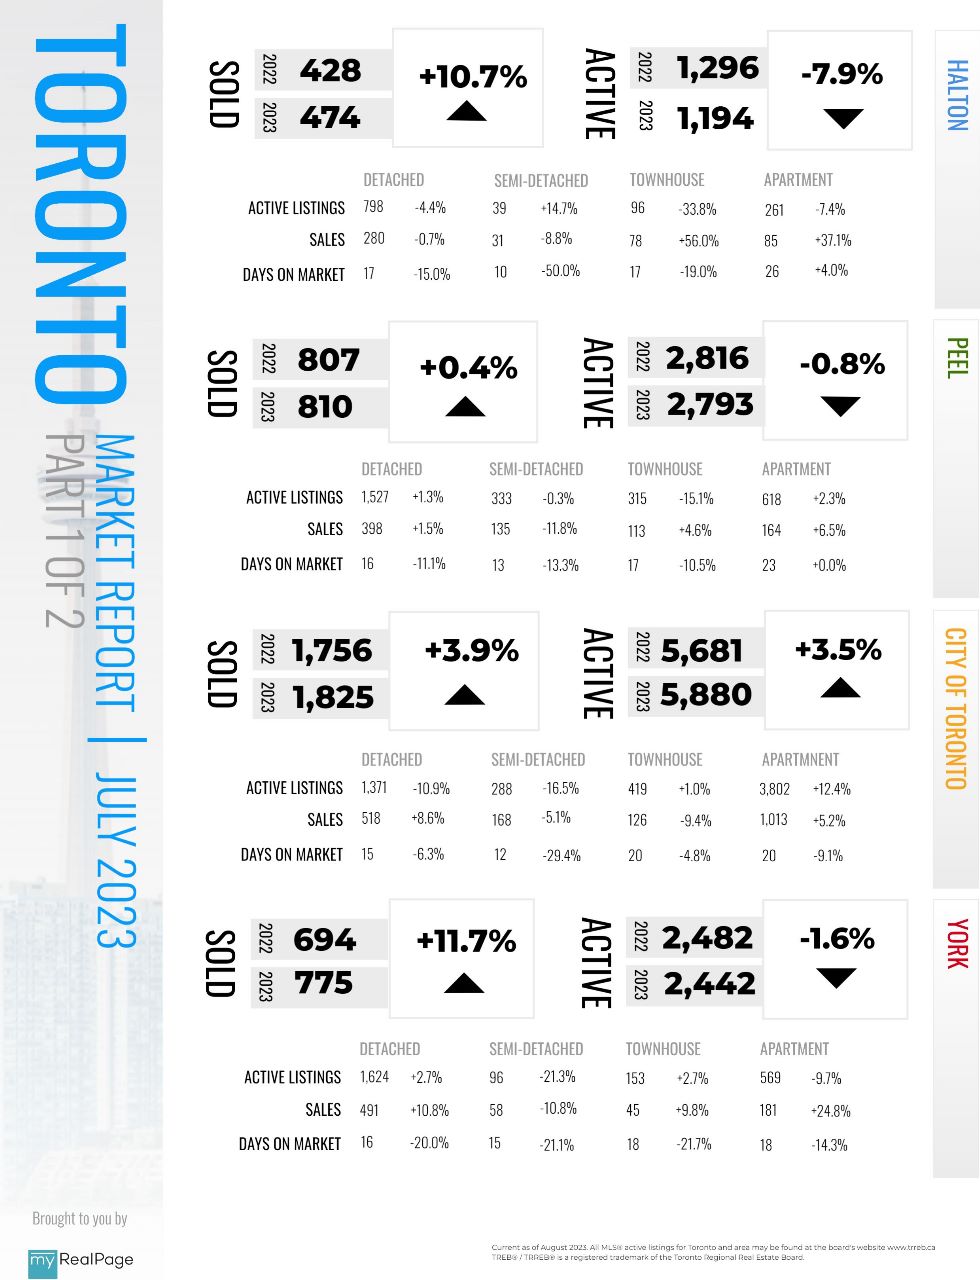
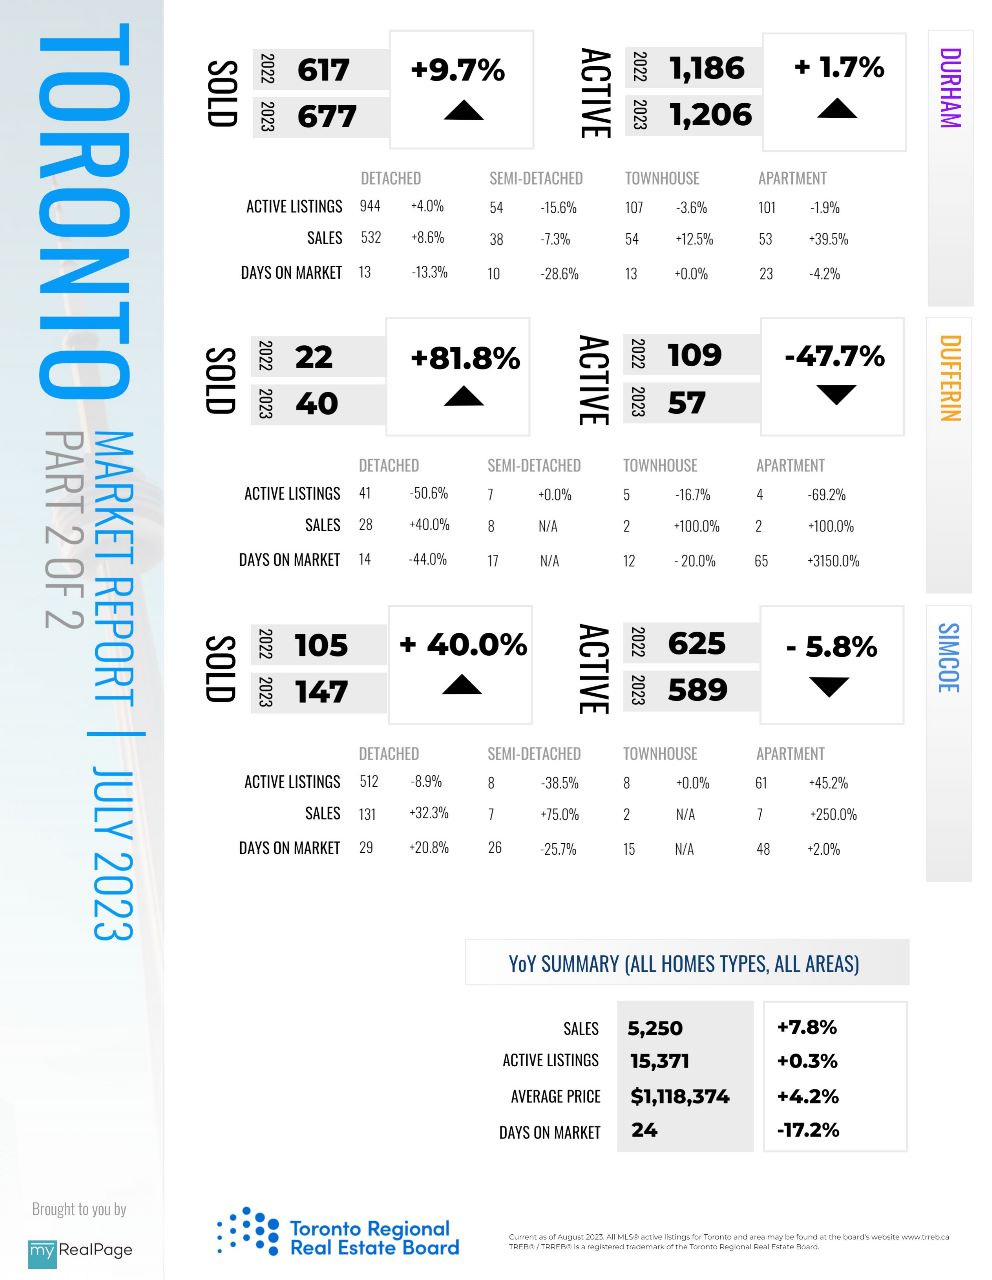
Greater Toronto Area (GTA) home sales, new listings and home prices were up in July 2023 in comparison to July 2022. On a seasonally adjusted basis, the market experienced more balance in July compared to June, with sales trending lower while new listings were up.
“Home sales continued to be above last year’s levels in July, which suggests that many households have adjusted to higher borrowing costs. With that being said, it does appear that the sales momentum that we experienced earlier in the spring has stalled somewhat since the Bank of Canada restarted its rate tightening cycle in June. Compounding the impact of higher rates has been the persistent lack of listings for people to purchase compared to previous years,” said Toronto Regional Real Estate Board (TRREB) President Paul Baron.
GTA REALTORS® reported 5,250 sales through TRREB’s MLS® System in July 2023, representing a 7.8 per cent increase compared to July 2022. Over the same period, new listings were also up, but by a greater annual rate of 11.5 per cent. The MLS® Home Price Index Composite benchmark was up by 1.3 per cent year- over-year. The average selling price was also up by 4.2 per cent to $1,118,374 over the same timeframe.
Read the full report on TRREB website!
The following data is a comparison between July 2023 and July 2022 numbers, and is current as of August 2023. For last month’s numbers, check out our previous infographic!
Or follow this link for all our TREB / TRREB Infographics!
Download Printable Version – July 2023 TRREB, Toronto Market Report Part 1
Download Printable Version – July 2023 TRREB, Toronto Market Report Part 2
Last Updated on November 28, 2023 by myRealPage
