INFOGRAPHICS: March 2024 CREB City And Region Market Reports

March reflects strong seller’s market and price increases
March sales rose to 2,664 units, a 10 per cent year-over-year gain and much higher than long-term trends. While new listings did pick up over last month, the 3,172 units were still below what we typically see in March and not enough relative to sales to drive any change in the supply situation. In March, the sales-to-new listings ratio rose to 84 per cent, and the months of supply fell below one month.
“We have not seen March conditions this tight since 2006, which is also the last time we reported high levels of interprovincial migration and a months-of-supply below one month,” said Ann-Marie Lurie, Chief Economist at CREB®. “Moreover, we are entering the third consecutive year of a market favouring the seller as the two-year spike in migration has driven up demand and contributed to the drop in re-sale and rental supply. Given supply adjustments take time, it is not a surprise that we continue to see upward pressure on home prices.”
Read the full report on the CREB website!
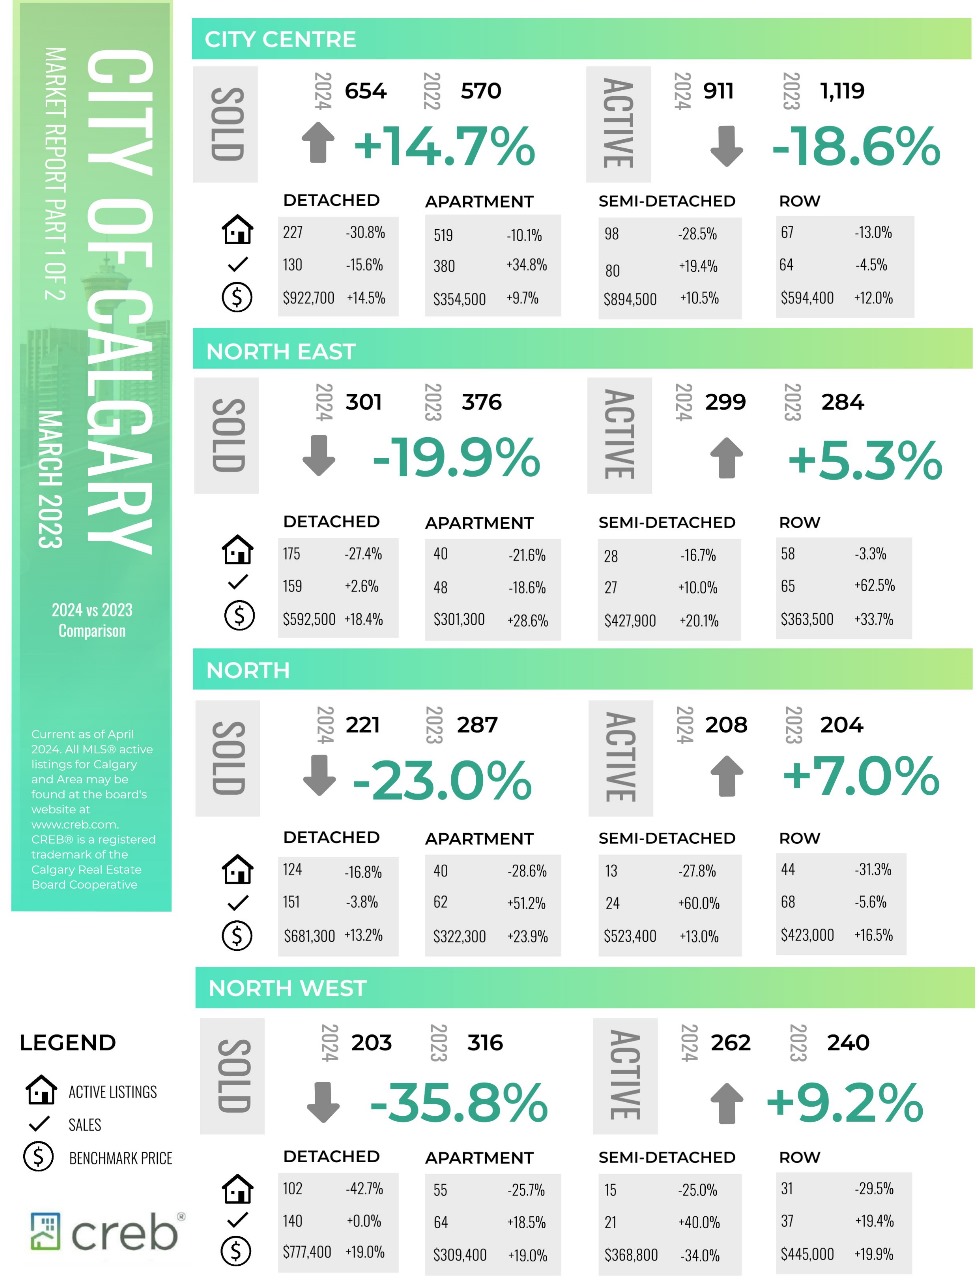
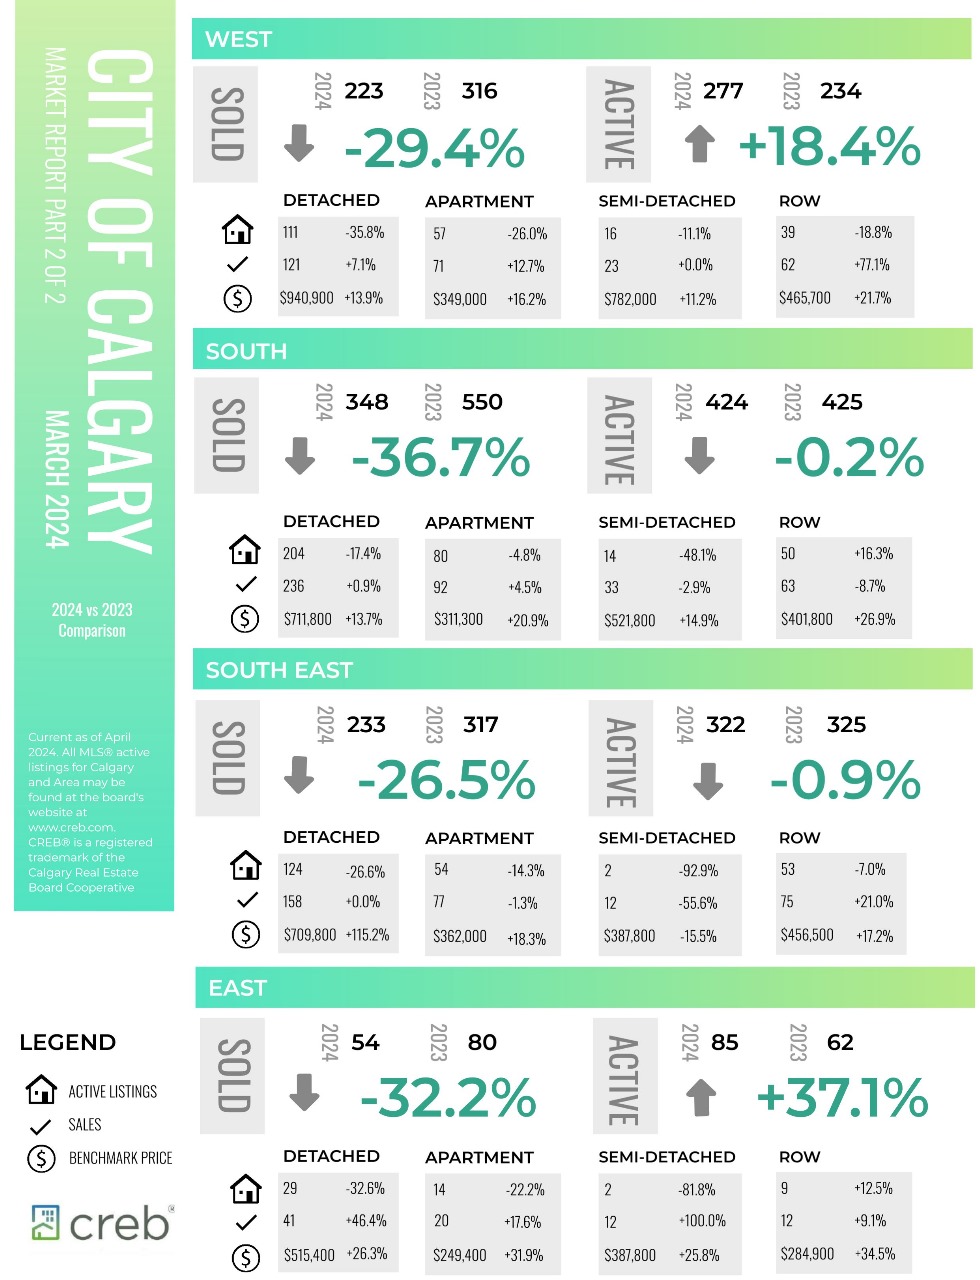
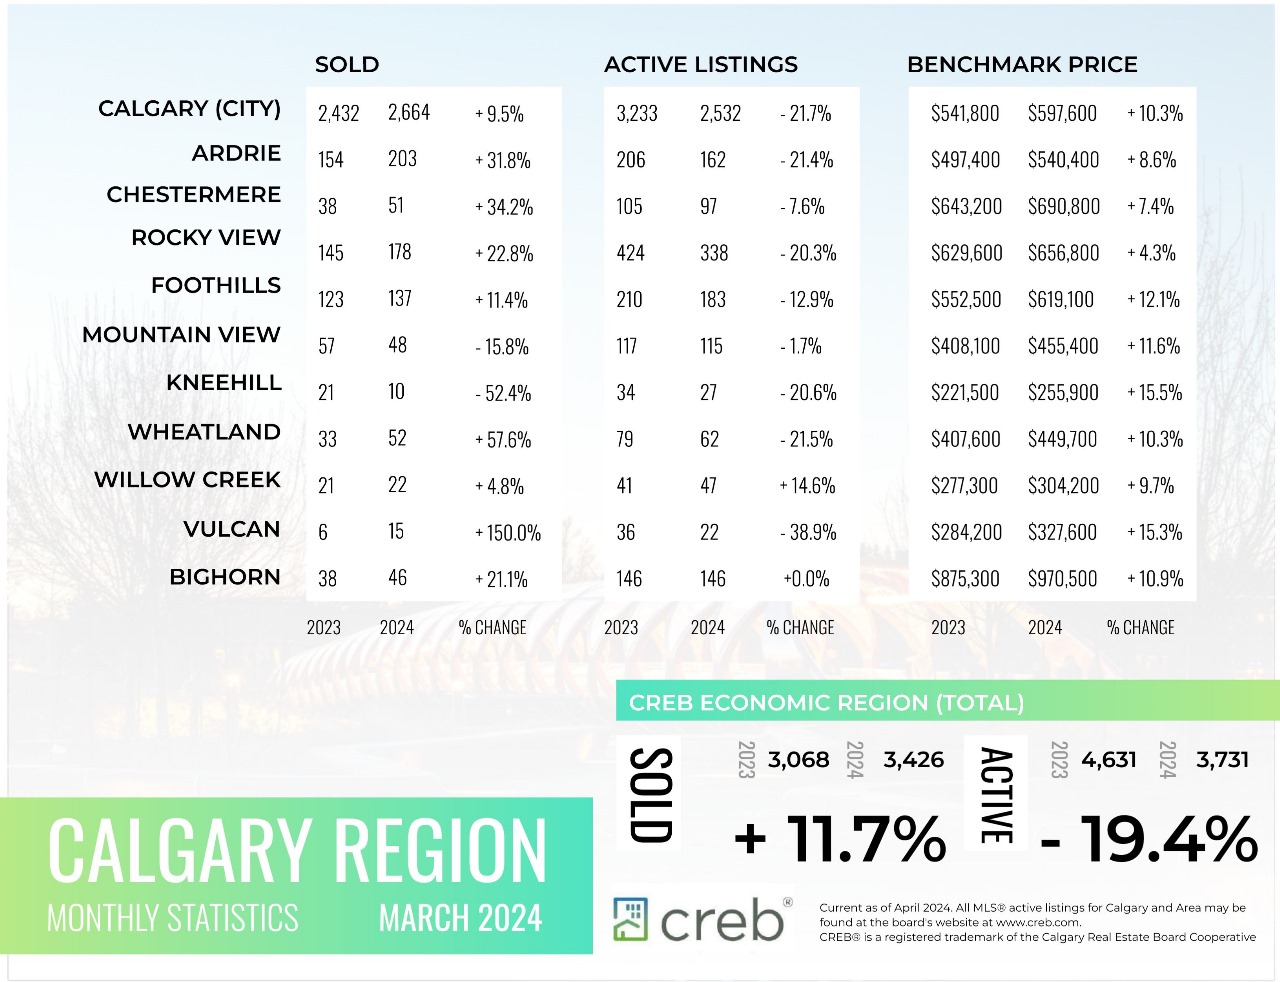
The following data is a comparison between March 2024 and March 2023 numbers, and is current as of April 2024. For last month’s numbers, check out our previous infographic.
Or follow this link for all our CREB Infographics!
Click on the images for a larger view!
Download Printable Version – March 2024 CREB, City of Calgary Report Part 1
Download Printable Version – March 2024 CREB, City of Calgary Report Part 2
Download Printable Version – March 2024 CREB, Calgary Region Report
Last Updated on April 5, 2024 by myRealPage
