INFOGRAPHICS: November 2023 CREB City And Region Market Reports

I ncreased listings, strong sales, and price growth
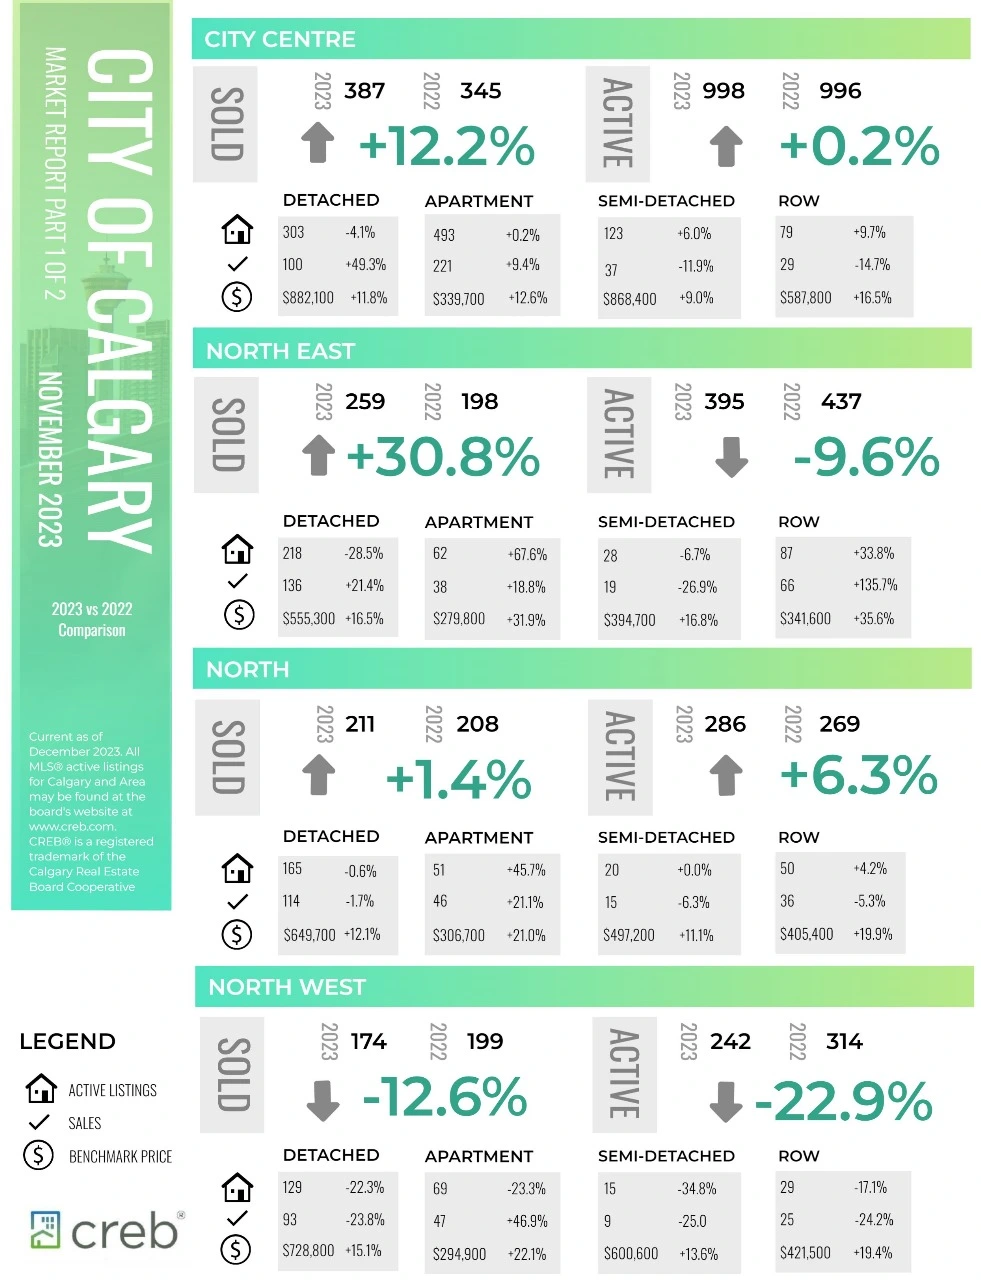
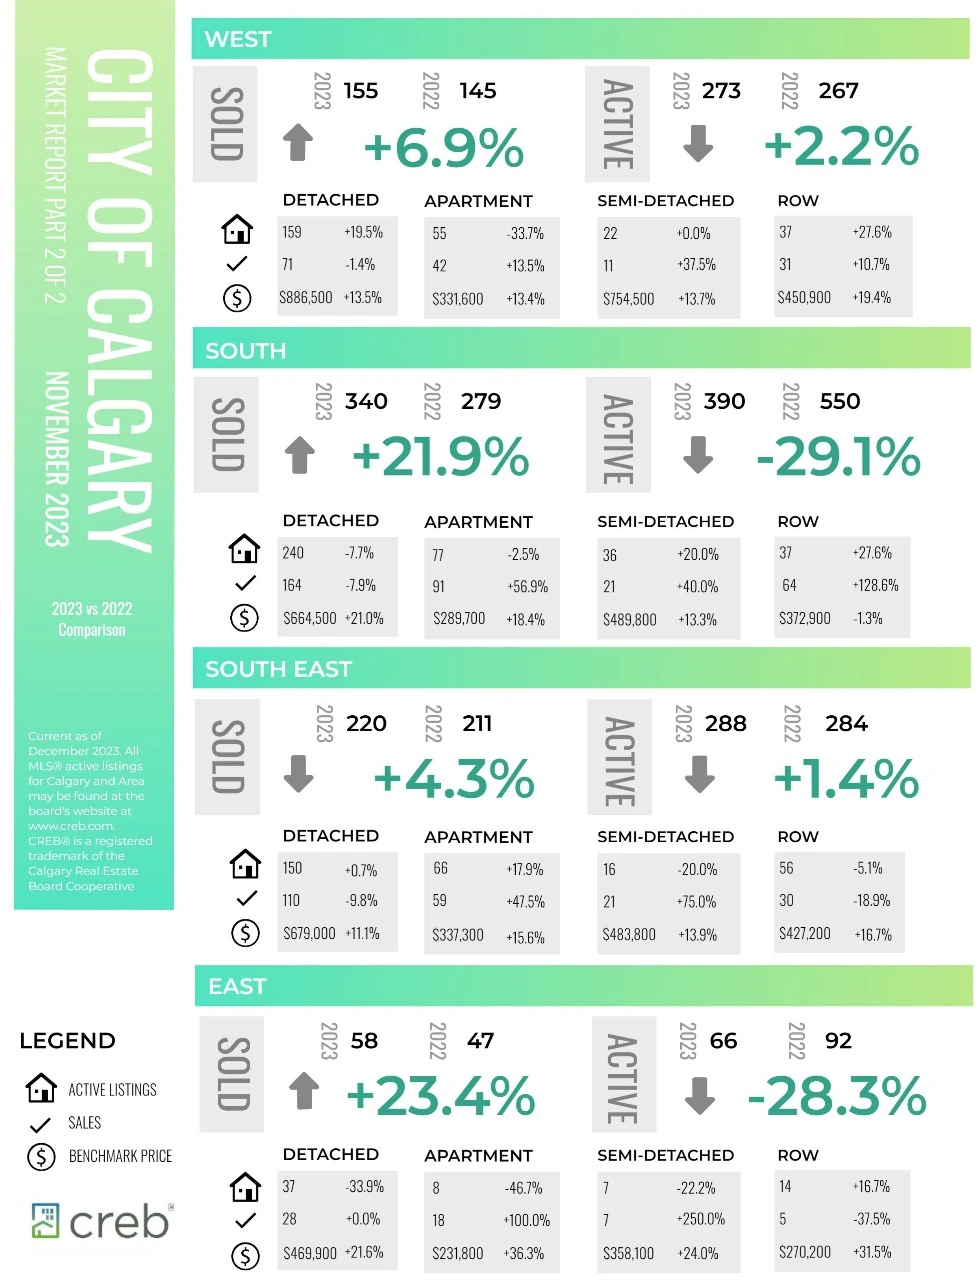
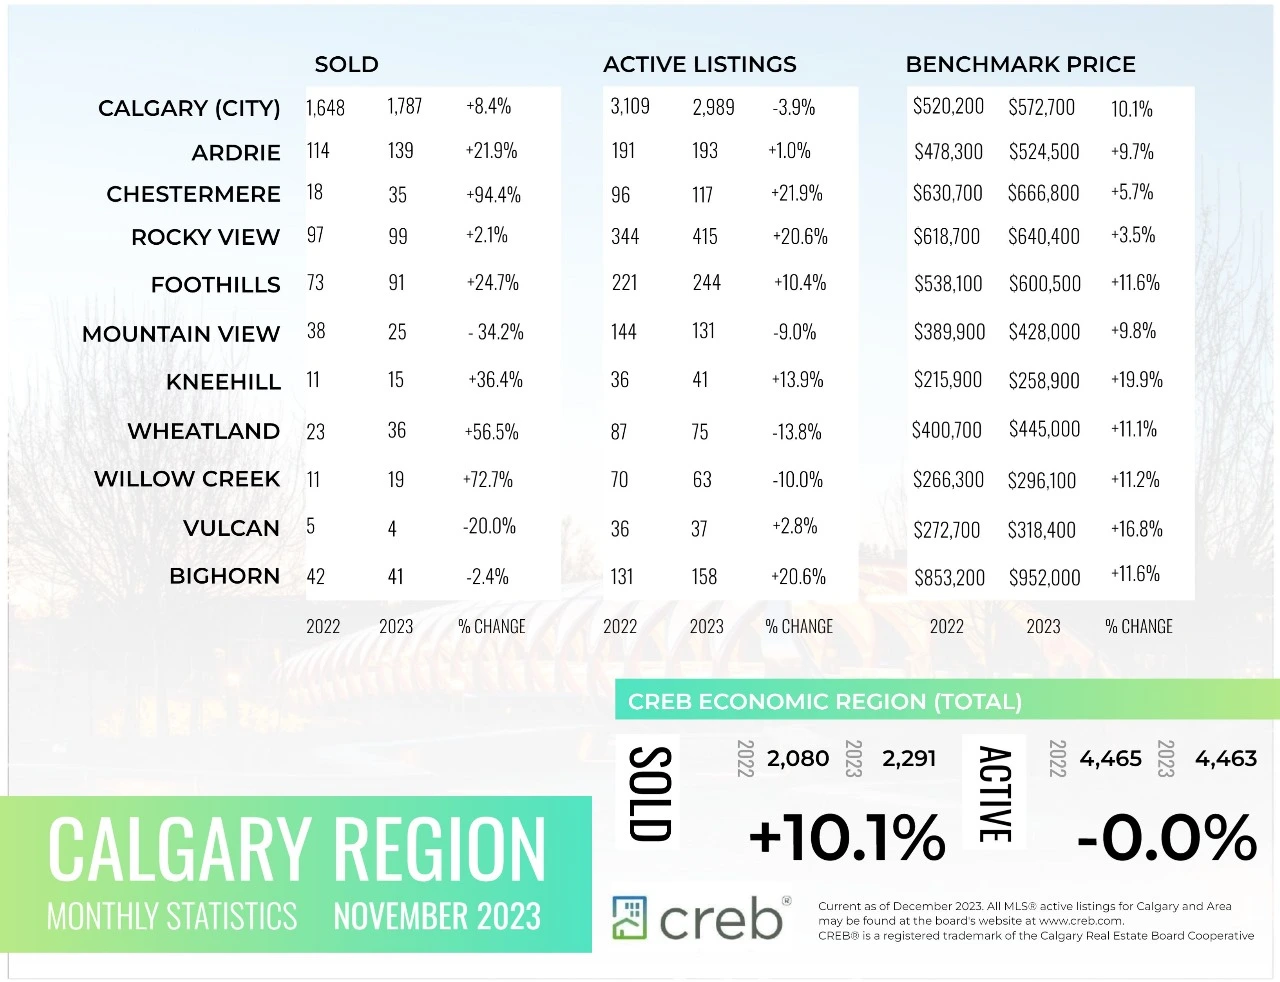
New listings in November reached 2,227 units, nearly 40 per cent higher than the exceptionally low levels reported last year at this time. Gains in new listings occurred across most price ranges, but the most significant gains occurred from homes priced over $600,000.
Despite the year-over-year jump in new listings, inventory levels remained low thanks to relatively strong sales. With 1,787 sales in November, the sales to new listings ratio remained high at 80 per cent, and the months of supply remained below two months.
“Like other large cities, new listings have been increasing,” said CREB® Chief Economist Ann-Marie Lurie. “However, in Calgary, the gains have not been enough to change the low inventory situation thanks to strong demand. Our market continues to favour the seller, driving further price growth.”
Read the full report on the CREB website!
The following data is a comparison between November 2023 and November 2022 numbers, and is current as of December 2023. For last month’s numbers, check out our previous infographic.
Or follow this link for all our CREB Infographics!
Click on the images for a larger view!
Download Printable Version – November 2023 CREB, City of Calgary Report Part 1
Download Printable Version – November 2023 CREB, City of Calgary Report Part 2
Download Printable Version – November 2023 CREB, Calgary Region Report
Last Updated on December 5, 2023 by myRealPage
