INFOGRAPHICS: December 2020 FVREB Fraser Valley, South Surrey, Etc. Market Reports

In a year when the real estate market was at a standstill for months due to COVID‐19, total annual sales in the Fraser Valley still finished 12.4 per cent above the 10‐year average due to unrelenting, pent‐up consumer demand during the second half of 2020.
In December, the Board’s Multiple Listing Service® (MLS®) processed a staggering 2,086 sales, the strongest December on record and 81.2 per cent above normal for the month. New listings in December, were the second highest on record at 1,502. By month’s end, active inventory finished below typical levels, at 3,949 units
Read the full report on the FVREB website!
The following data is a comparison between December 2019 and December 2020 numbers, and is current as of January 2021. For last month’s report, check out our previous infographic!
Or follow this link for all our FVREB Infographics!
These infographics cover current trends in Fraser Valley neighbourhoods that are within the FVREB. Click on the images for a larger view! (Protip: Make sure to grab the printable PDF version, too! It fits best when printed on A4-sized sheets, AND we’ve added an area on the sheet where you can attach your business card! 🙂 )
Download Printable Version Abbotsford / Mission – FVREB December 2020 Market Report
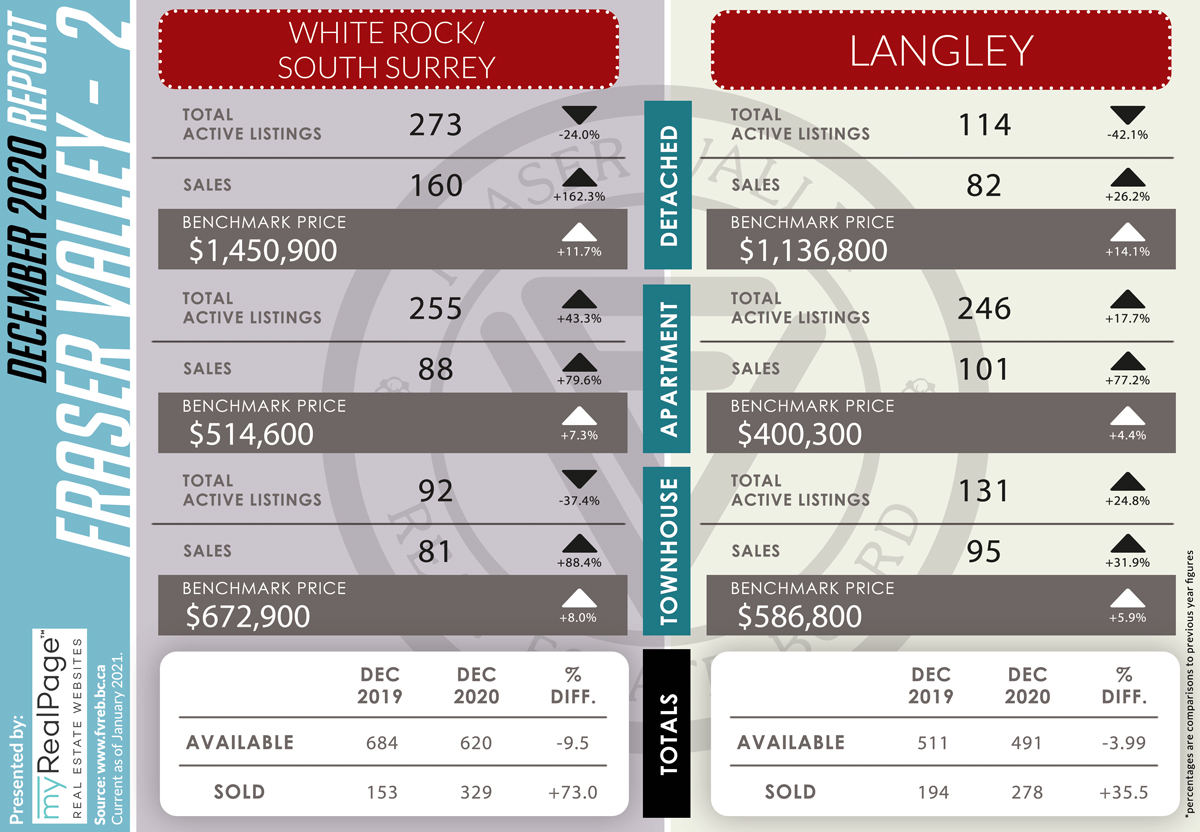
Download Printable Version White Rock Langley – FVREB December 2020 Market Report
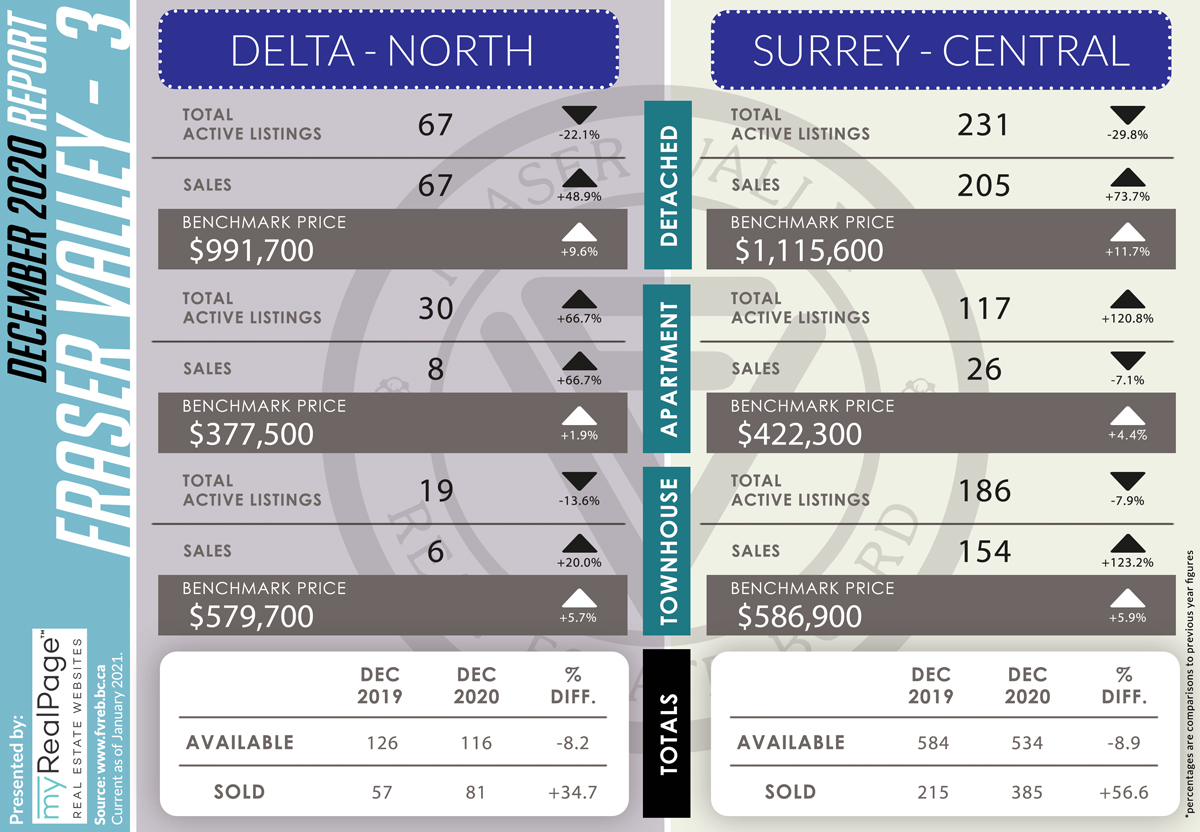
Download Printable Version Delta Surrey – FVREB December 2020 Market Report
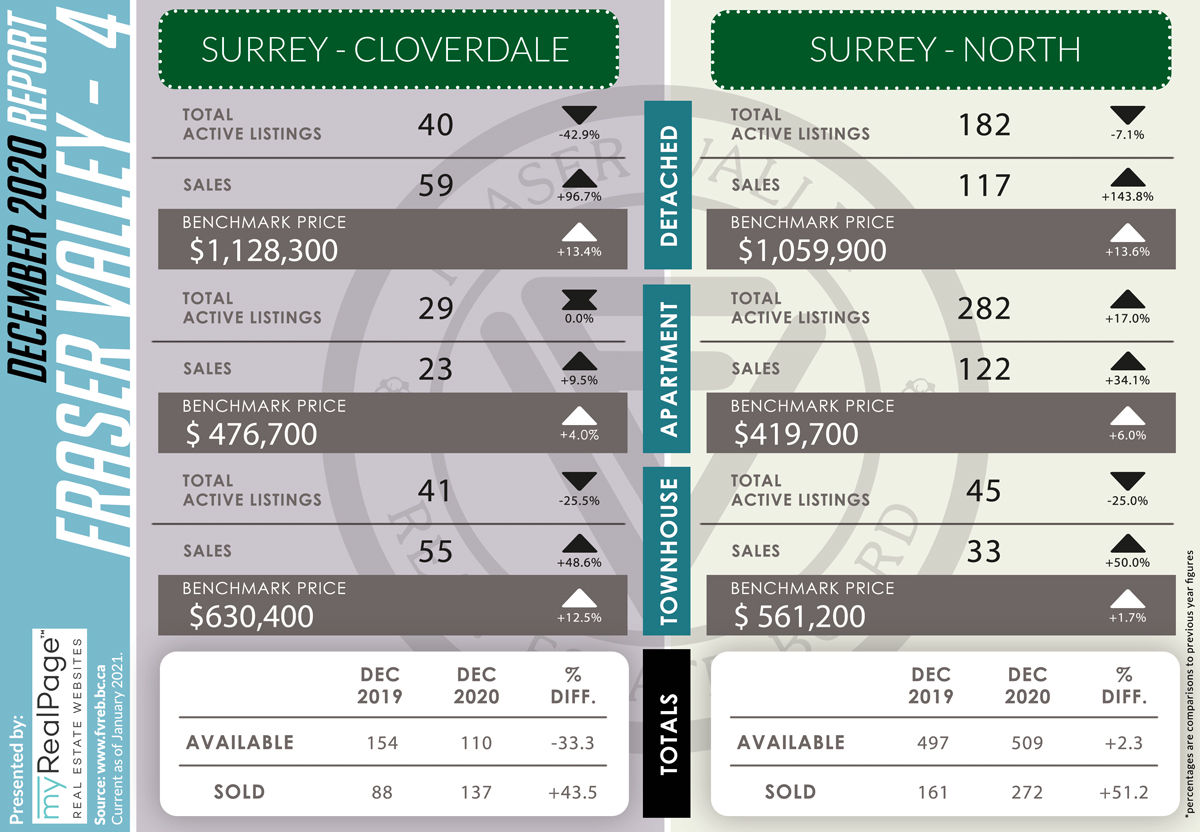
Download Printable Version Cloverdale / Surrey North – FVREB December 2020 Market Report

Last Updated on July 25, 2022 by myRealPage
