INFOGRAPHICS: February 2022 REBGV Greater Vancouver Market Reports

Listings inch up, demand remains steady and price gains continue
The Metro Vancouver housing market saw steady home sales activity, modest increases in home listings and continued upward trends in pricing in February.
The Real Estate Board of Greater Vancouver (REBGV) reports that residential home sales in the region totalled 3,424 in February 2022, an 8.1 per cent decrease from the 3,727 sales recorded in February 2021, and a 49.8 per cent increase from the 2,285 homes sold in January 2022.
Last month’s sales were 26.9 per cent above the 10-year February sales average.
Read the full report on the REBGV website!
The following data is a comparison between February 2022 and February 2021 numbers, and is current as of March 2022. For last month’s update, you can check out our previous post!
Or follow this link for all our REBGV Infographics!
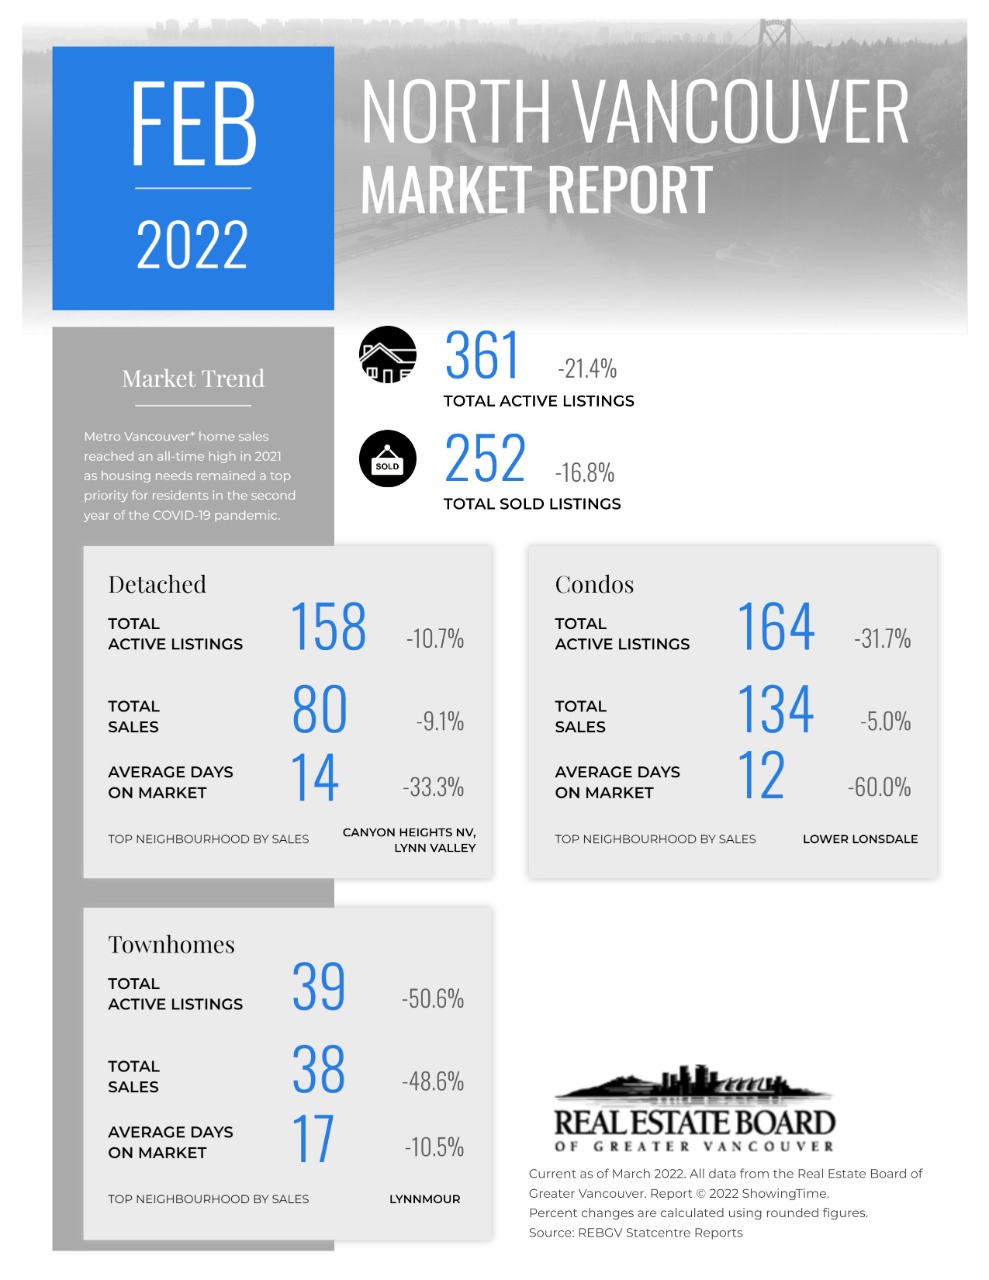
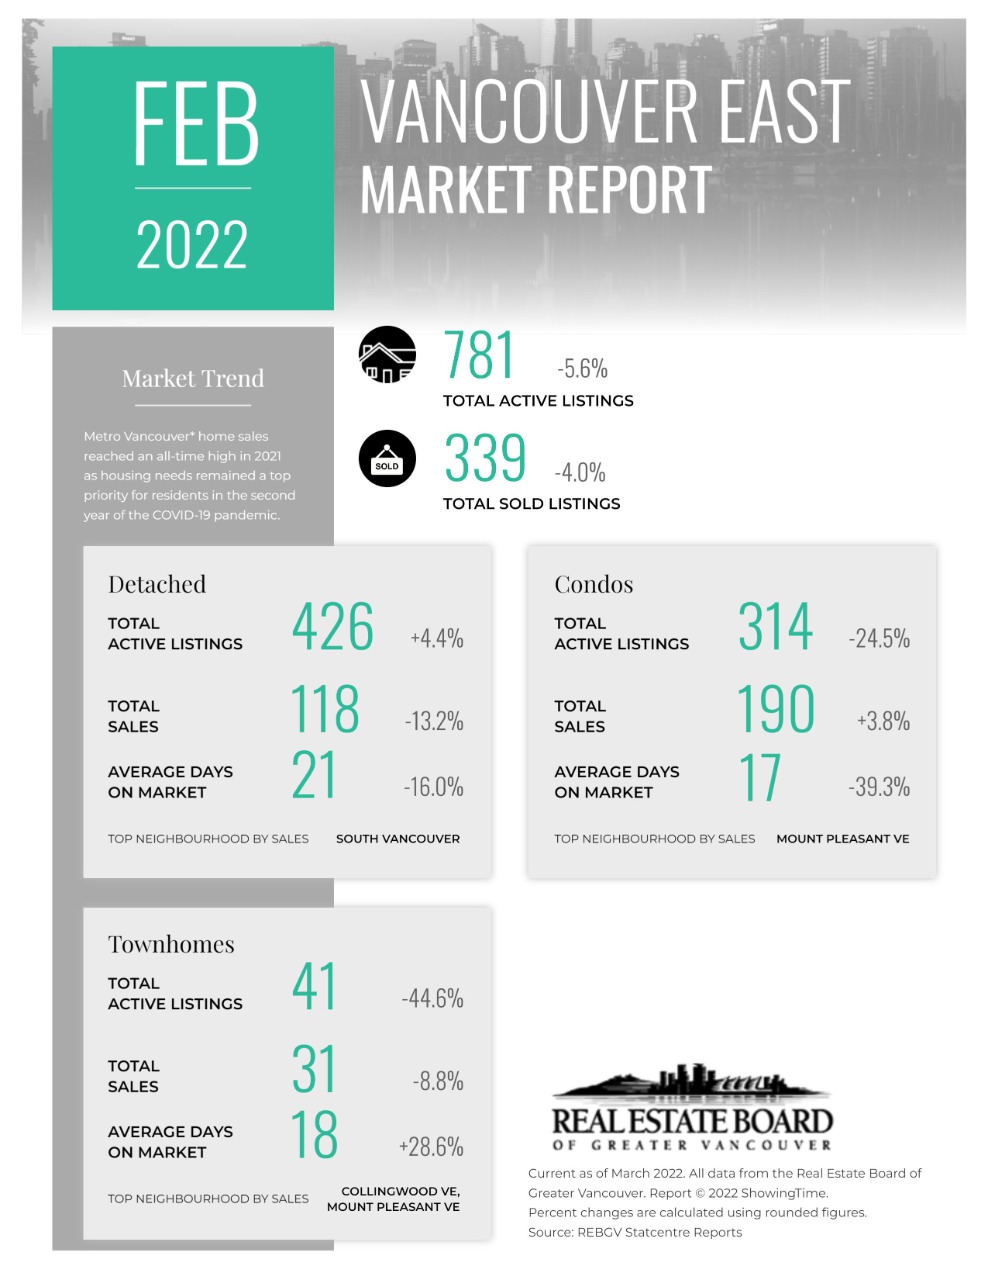
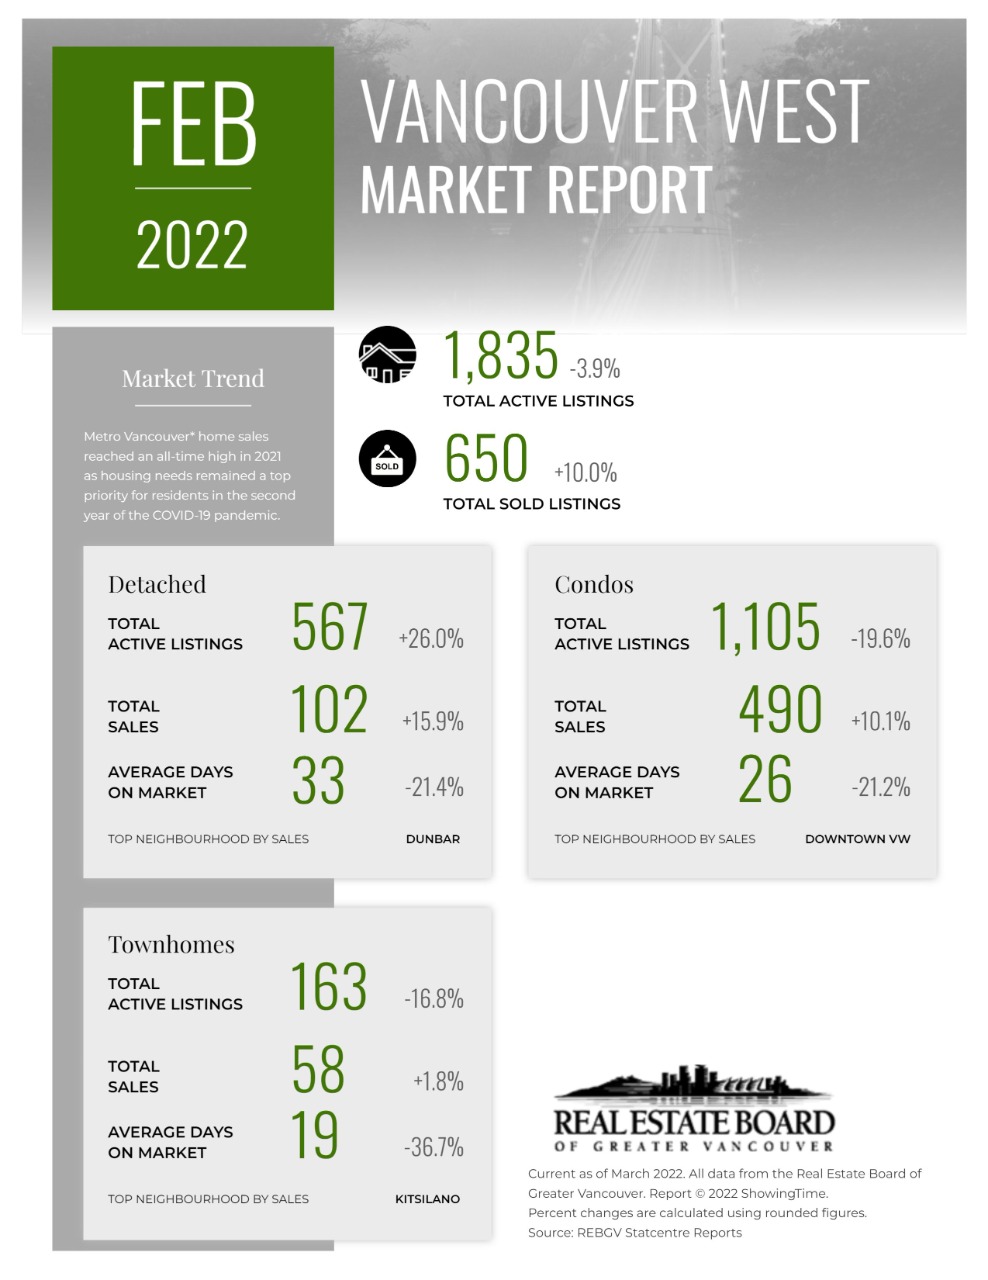
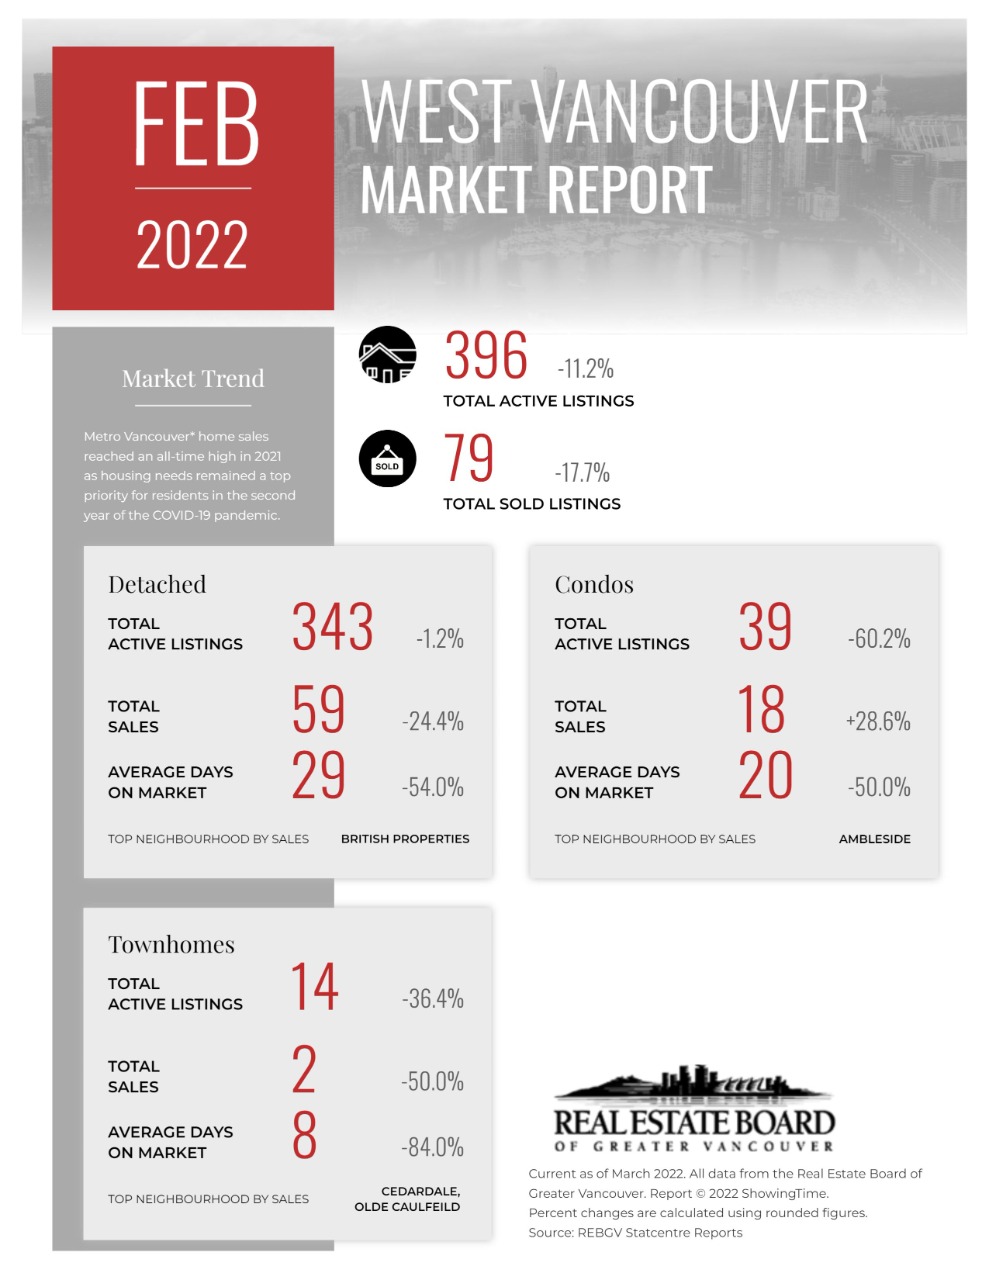
These infographics cover current trends in North Vancouver, West Vancouver, Vancouver East, and Vancouver West. Click on the images for a larger view!
Download Printable Version – REBGV February 2022 Data Infographic Report North Vancouver
Download Printable Version – REBGV February 2022 Data Infographics Report West Vancouver
Download Printable Version – REBGV February 2022 Data Infographics Report Vancouver West
Download Printable Version – REBGV February 2022 Data Infographics Report Vancouver East
Last Updated on July 25, 2022 by myRealPage
