INFOGRAPHICS: August 2023 FVREB Fraser Valley Market Reports

Fraser Valley real estate sales dip in August; prices hold steady
A combination of seasonal trends and cautious anticipation of the next rate announcement saw the Fraser Valley real estate market slow in August as sales fell slightly for the second month, after reaching a 15-month high in June.
The Fraser Valley Real Estate Board recorded 1,273 sales on its Multiple Listing Service (MLS®) in August 2023, a decrease of 6.9 per cent compared to July. Sales were up 25.2 per cent compared to August 2022.
New listings dropped to 2,622 in August, a decrease of 8.2 per cent over last month, but 28.2 per cent above this time last year. Active listings have been rising since last December and grew again in August by 1.5 per cent to 6,291, just 7 per cent off the ten-year average.
Read the full report on the FVREB website!
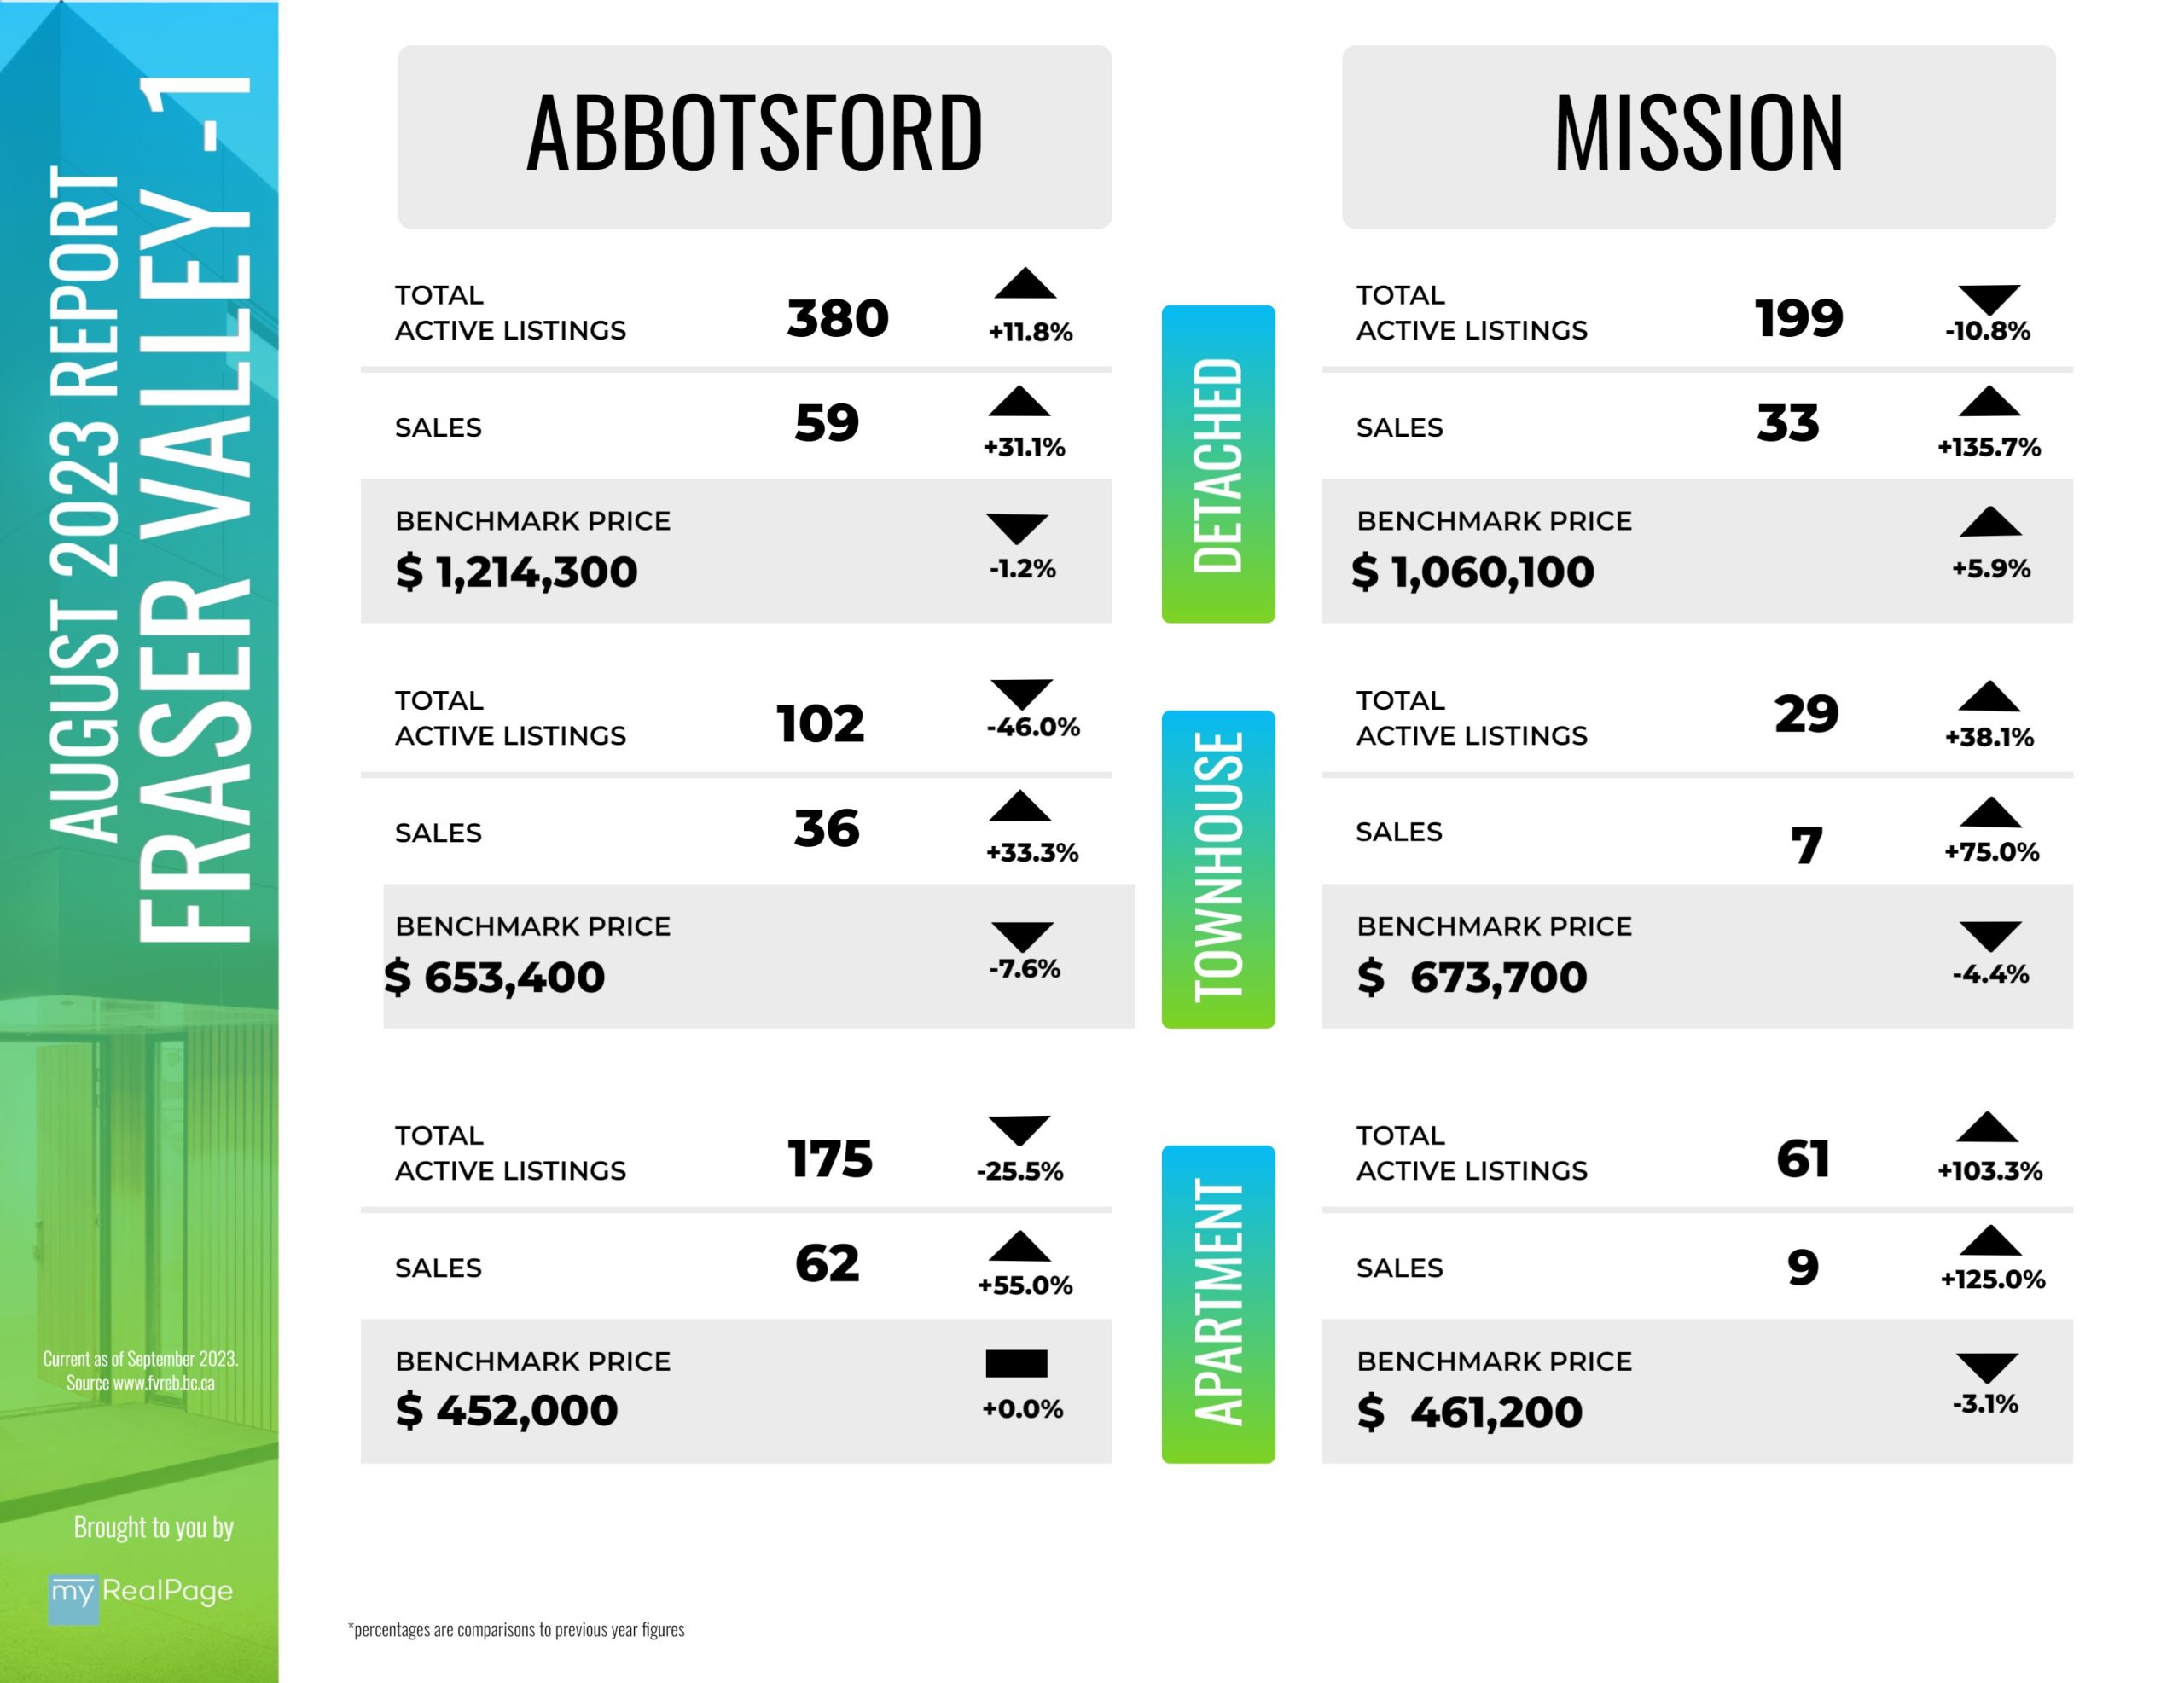
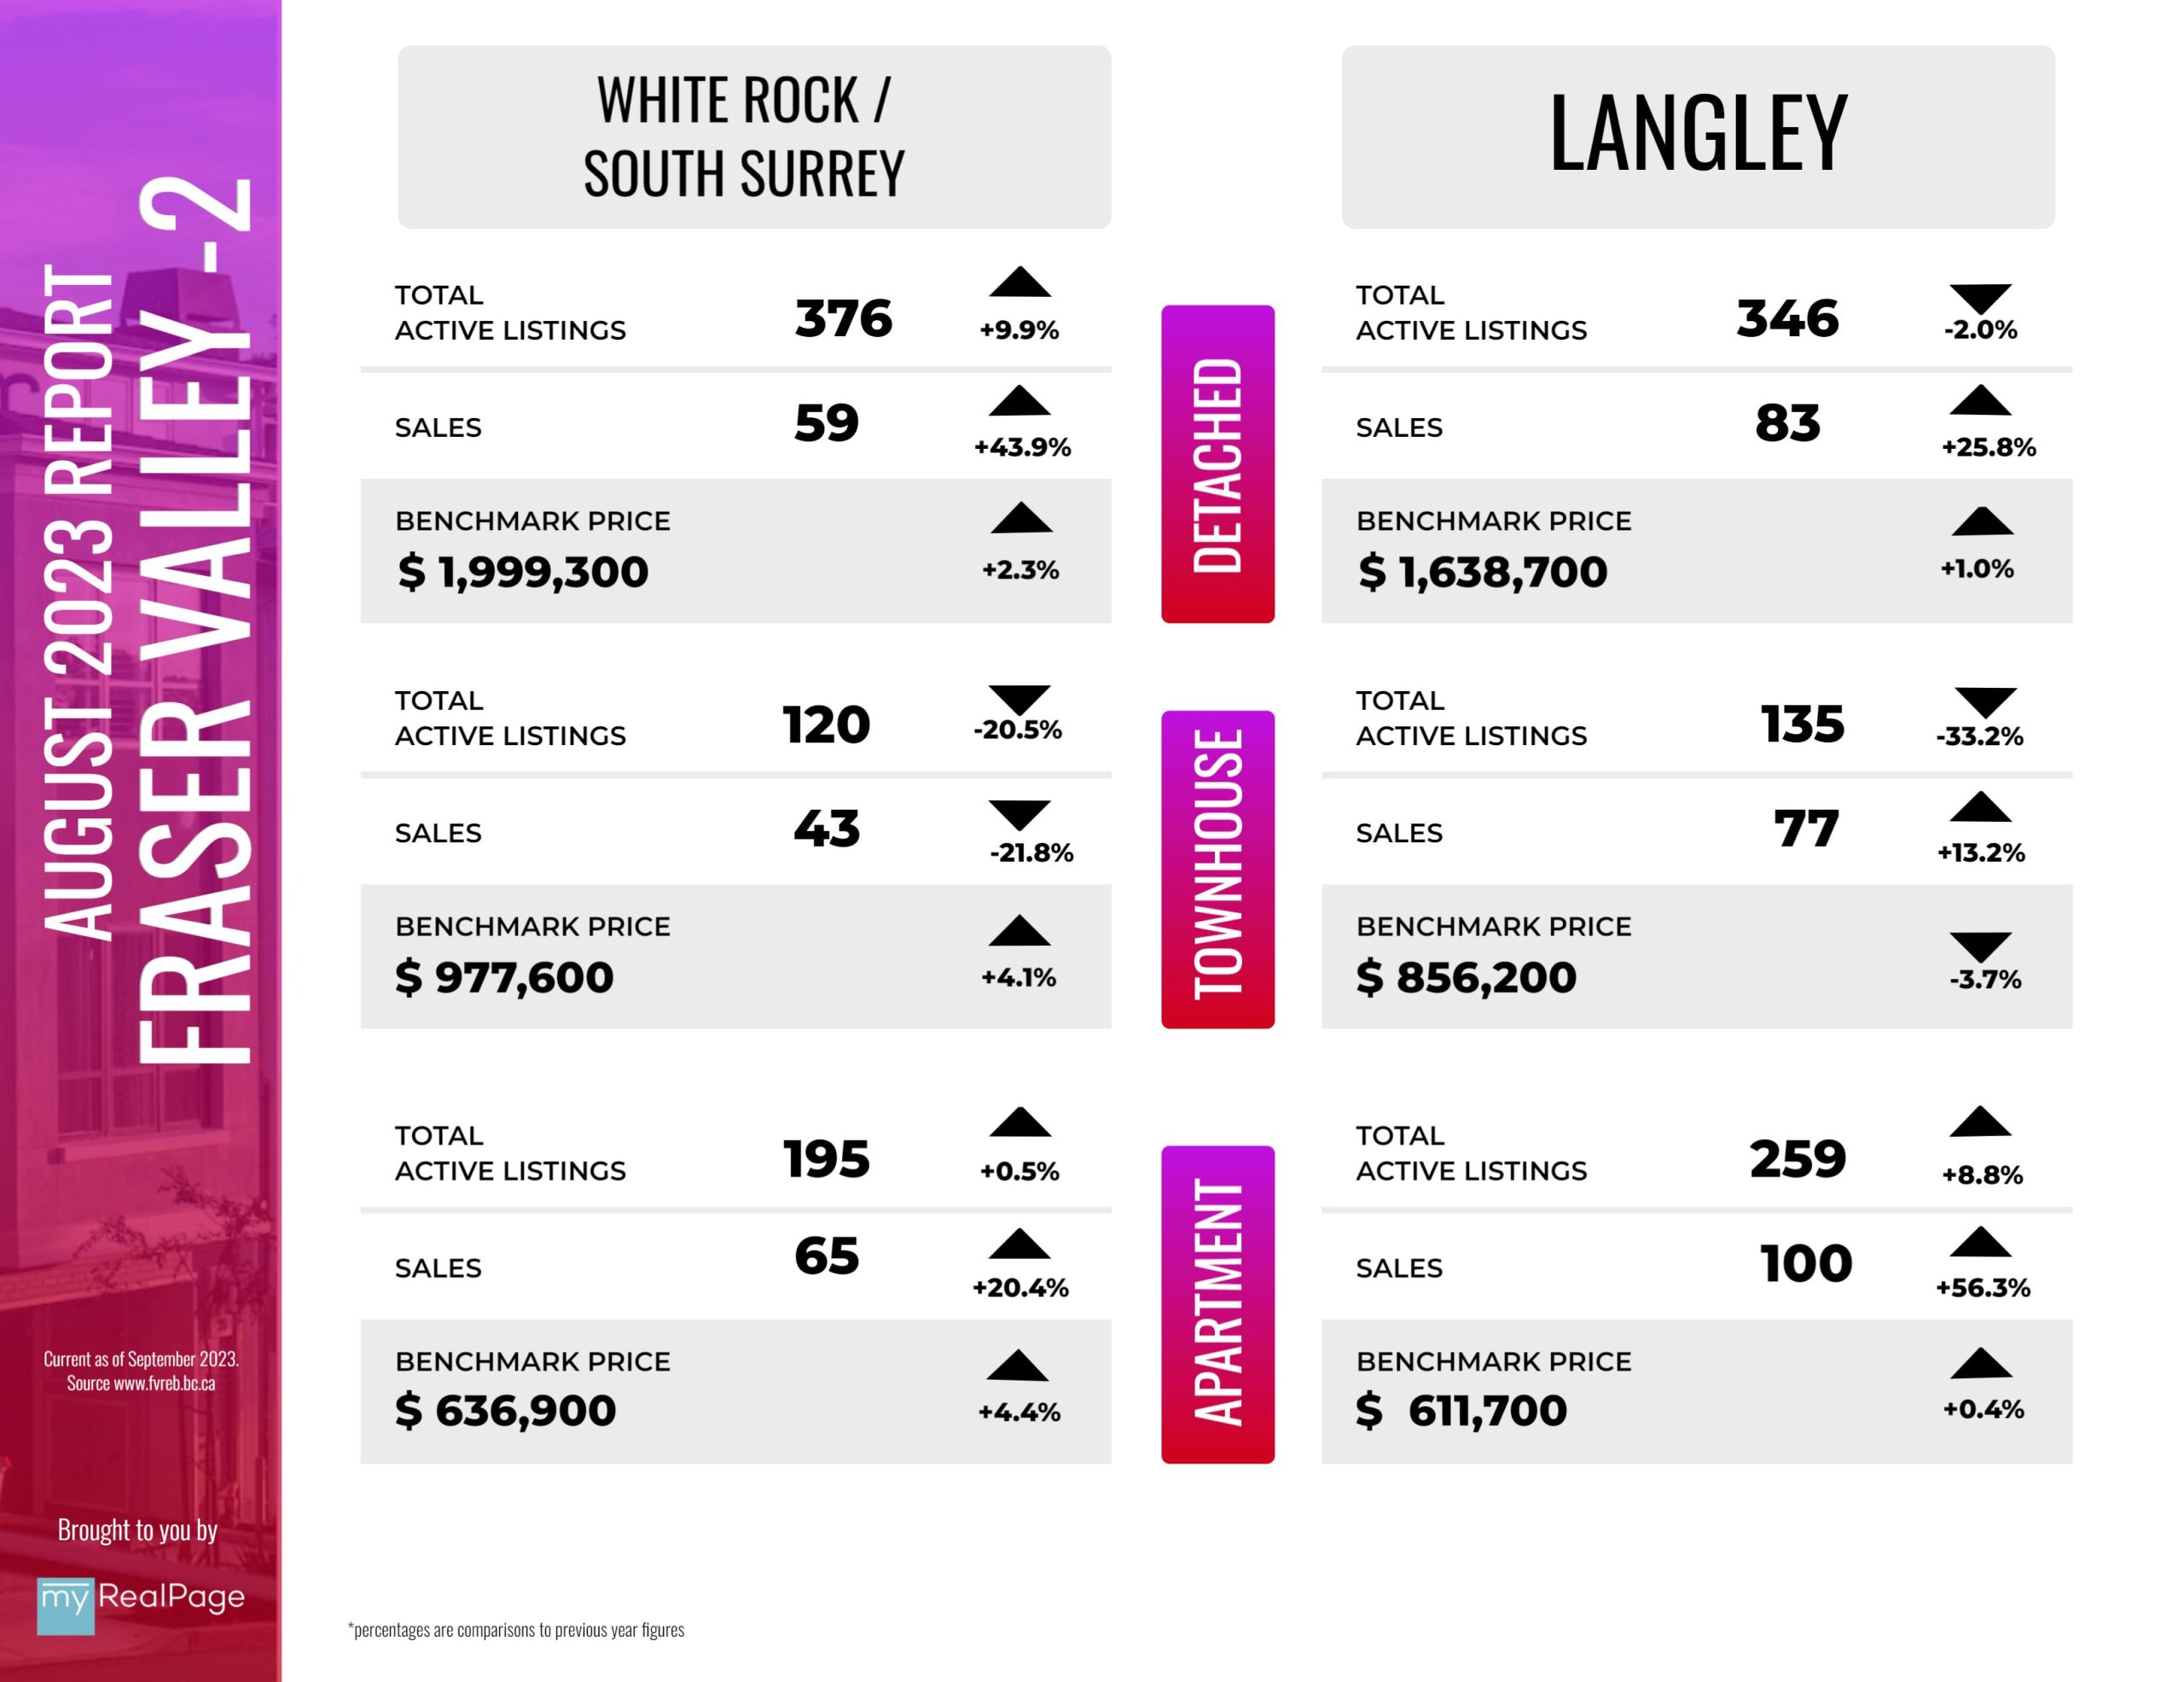
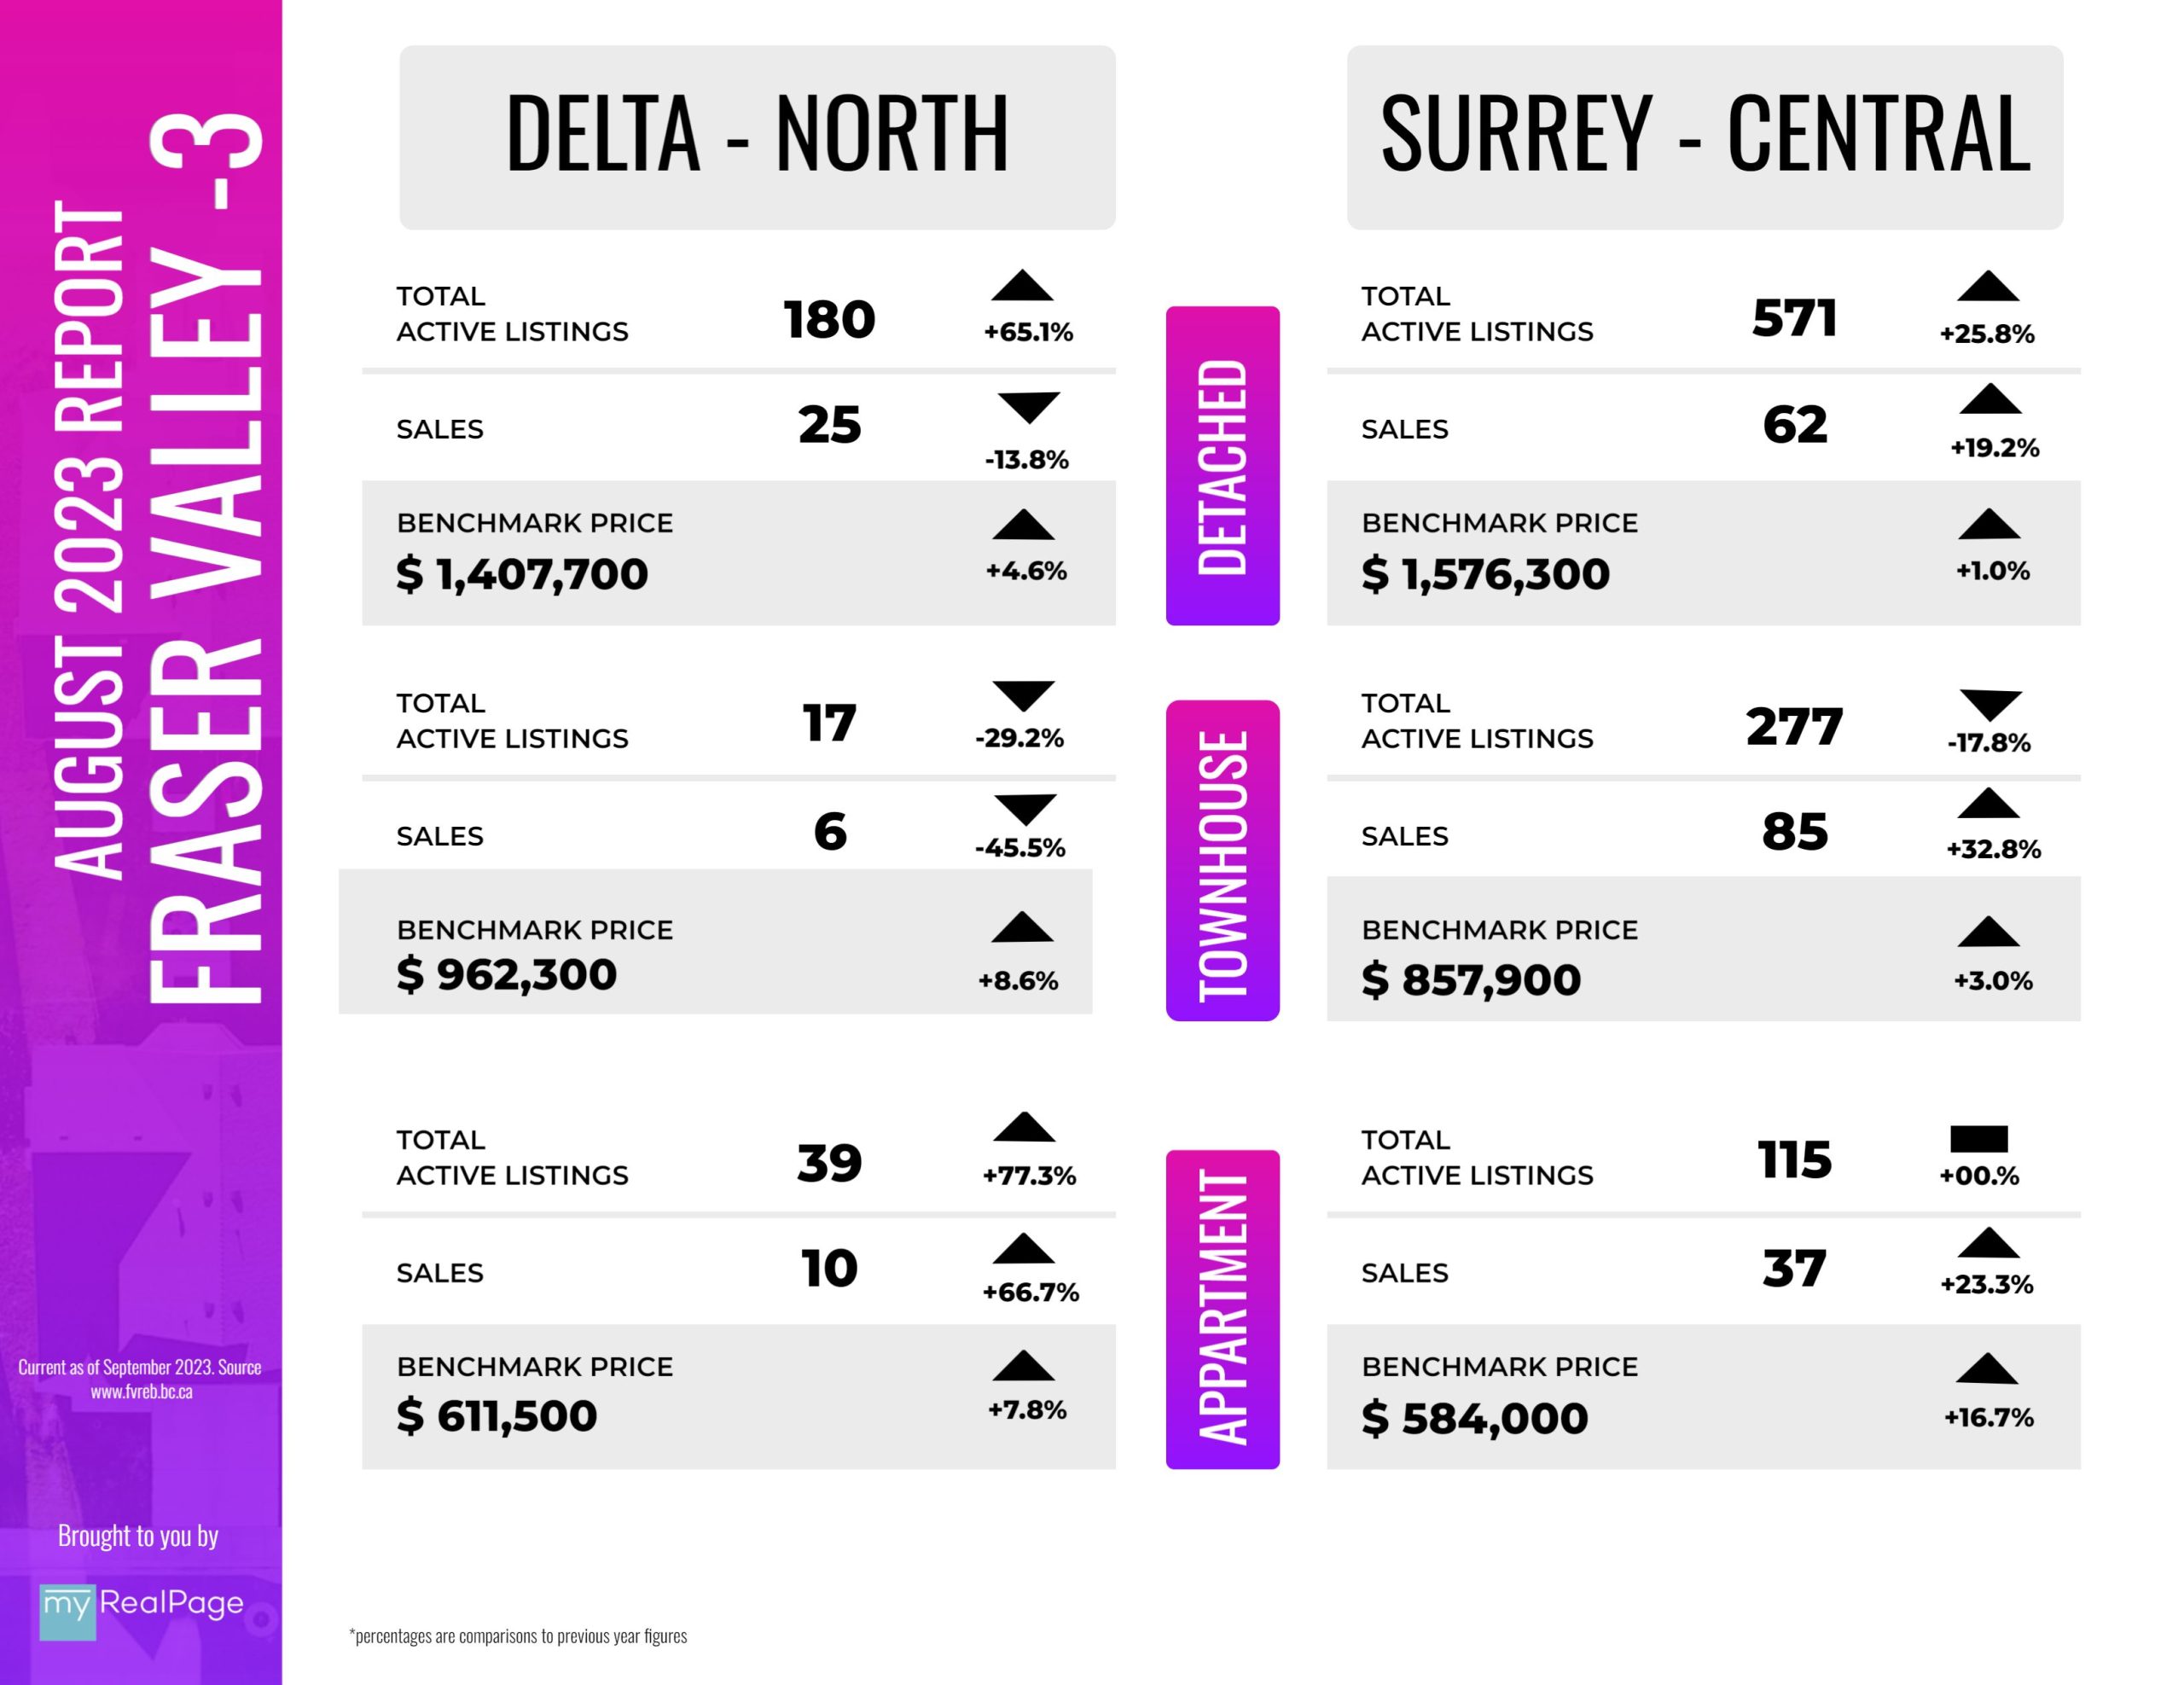
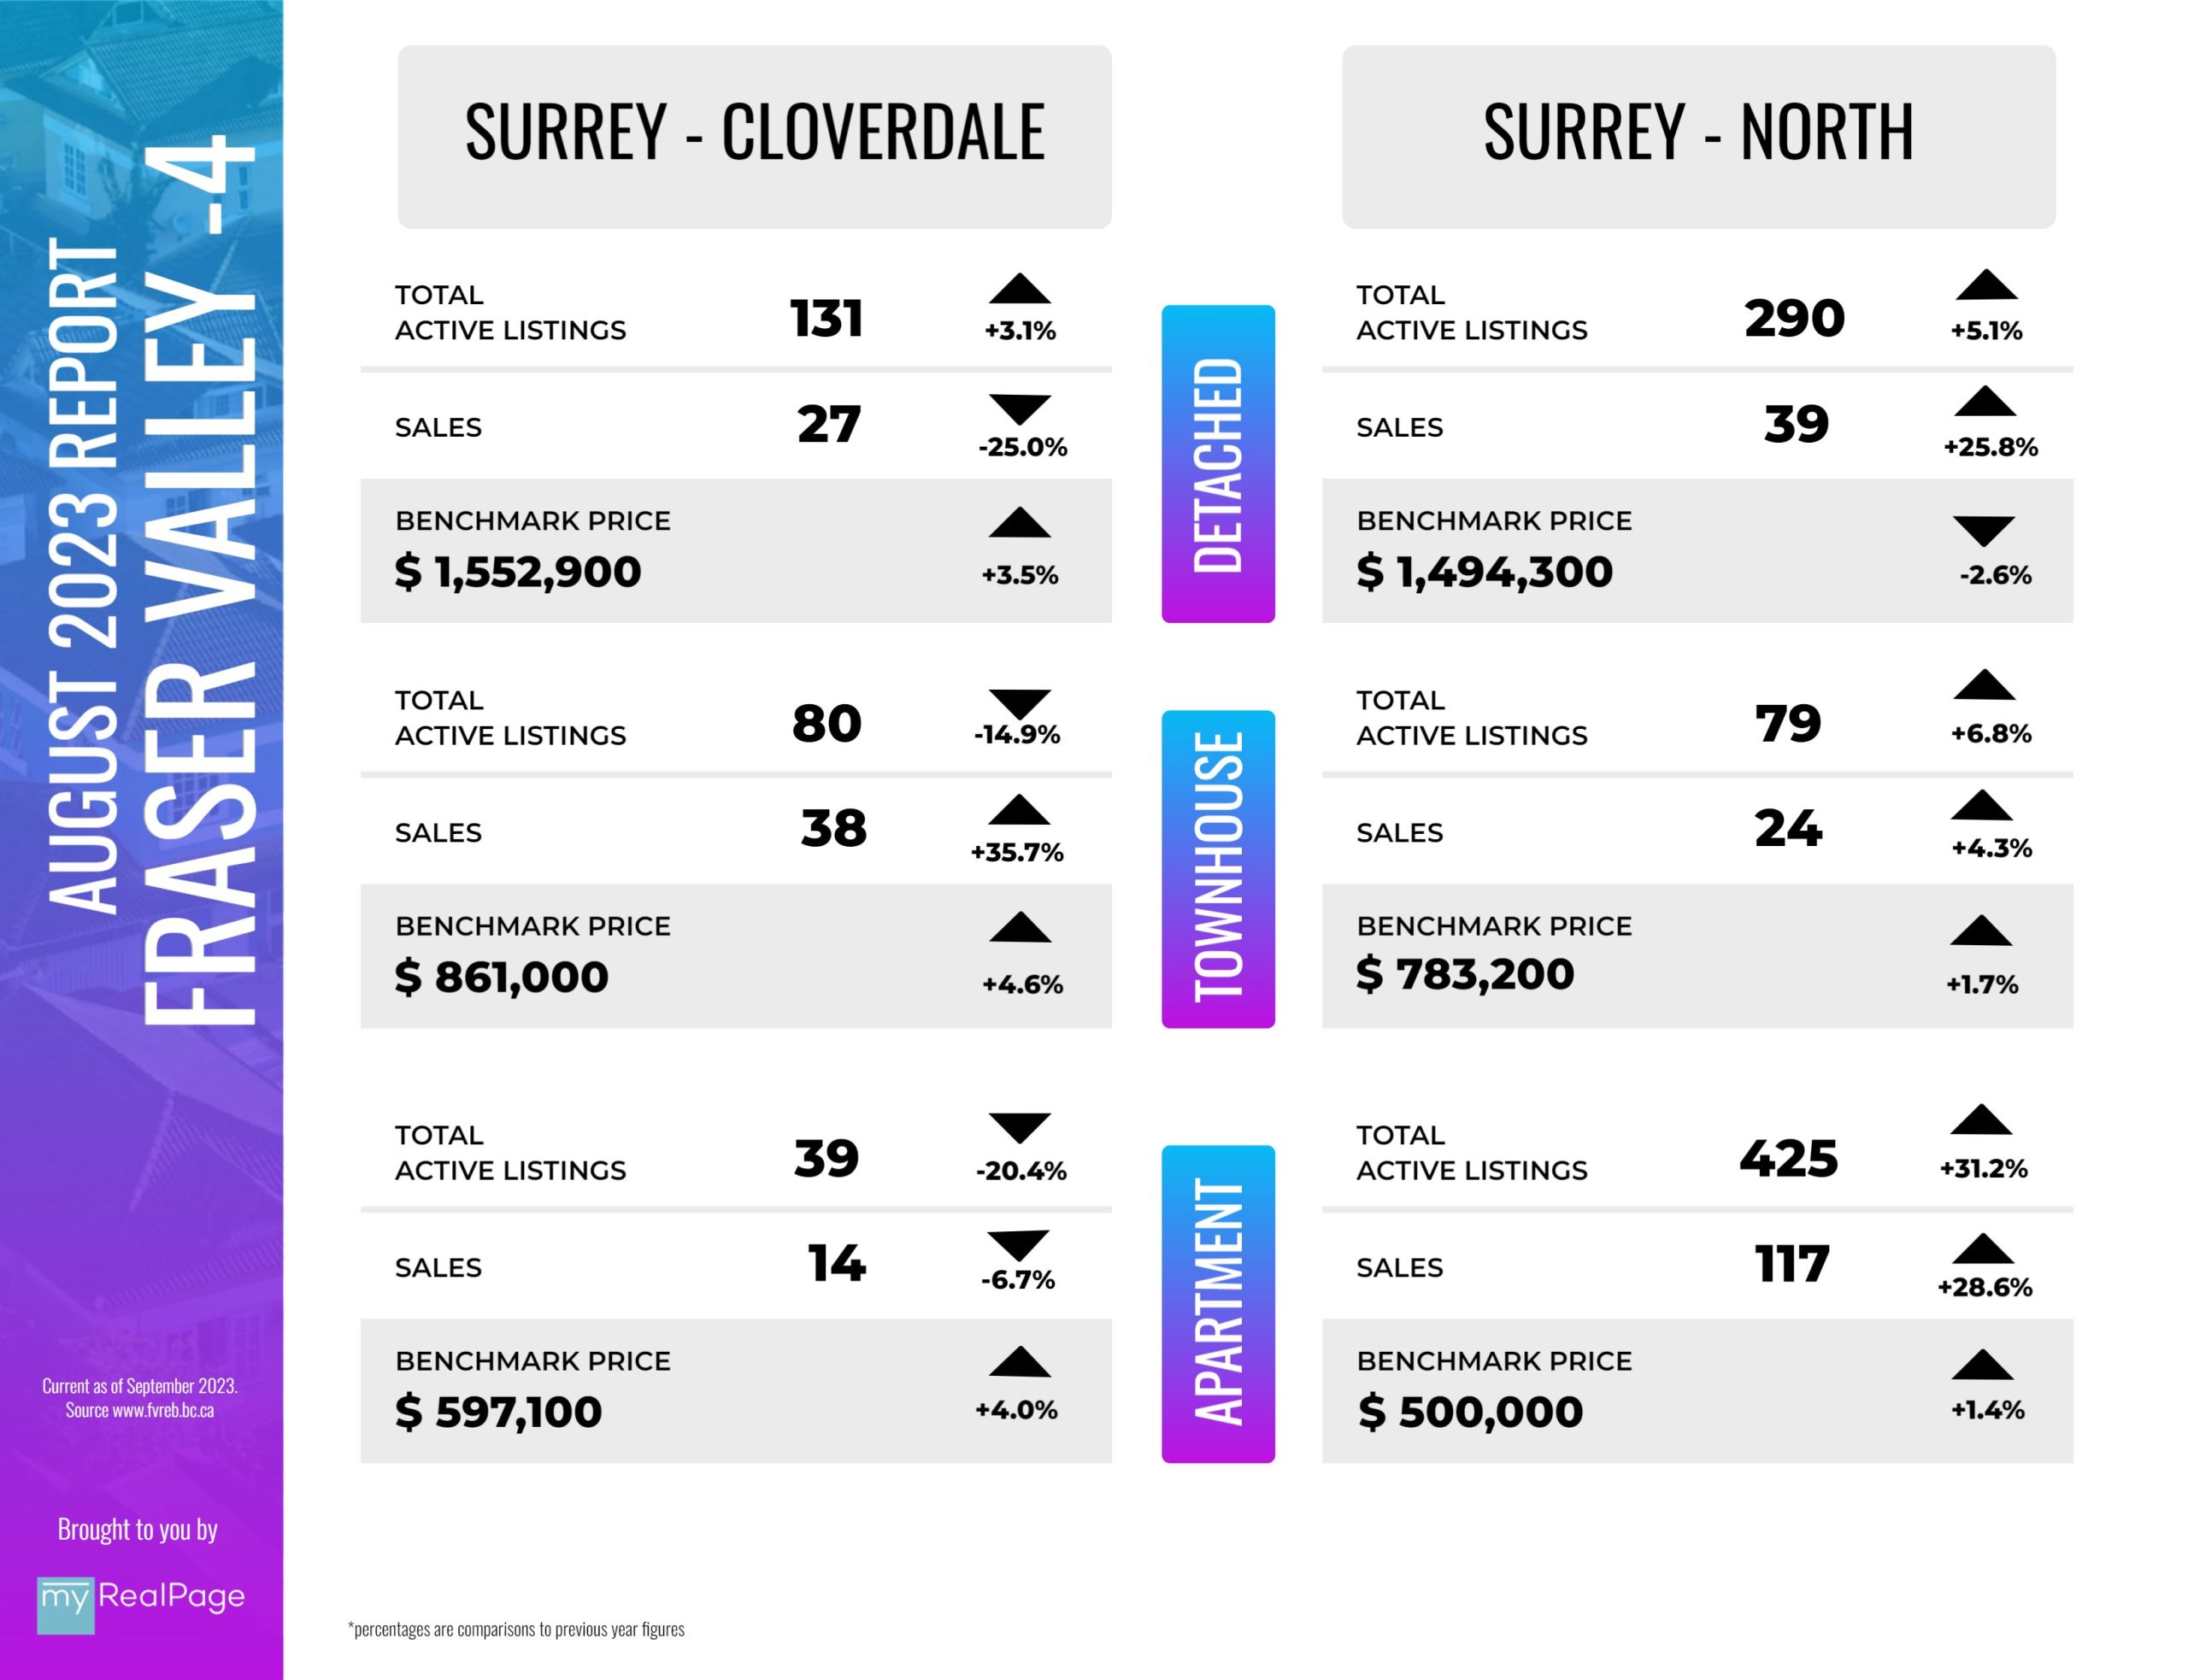
The following data is a comparison between August 2023 and August 2022 numbers, and is current as of September 2023. For last month’s report, check out our previous infographic!
Or follow this link for all our FVREB Infographics!
These infographics cover current trends in Fraser Valley neighbourhoods that are within the FVREB. Click on the images for a larger view!
Download Printable Version – FVREB August 2023 Market Report 1
Download Printable Version – FVREB August 2023 Market Report 2
Download Printable Version – FVREB August 2023 Market Report 3
Download Printable Version – FVREB August 2023 Market Report 4
Last Updated on May 9, 2024 by myRealPage
