INFOGRAPHICS: January 2021 FVREB Fraser Valley, South Surrey, Etc. Market Reports

Fraser Valley real estate market full steam ahead in January; another record-setter for property sales
In a month that is usually one of the quietest in real estate, Fraser Valley’s market continued at a breakneck pace, producing the strongest January sales on record as well as a modest uptick in new listings.
The Fraser Valley Real Estate Board processed a total of 1,718 sales of all property types on its Multiple Listing Service® (MLS®) in January 2021, an increase of 76 per cent compared to January 2020 and 18 per cent fewer then were processed in December 2020. Sales in January set a new, record high for the month; 72 per cent above the 10-year average, and 28 per cent higher than the previous record of 1,338 sales set in January 2016.
Read the full report on the FVREB website!
The following data is a comparison between January 2021 and January 2020 numbers, and is current as of February 2021. For last month’s report, check out our previous infographic!
Or follow this link for all our FVREB Infographics!
These infographics cover current trends in Fraser Valley neighbourhoods that are within the FVREB. Click on the images for a larger view! (Protip: Make sure to grab the printable PDF version, too! It fits best when printed on A4-sized sheets, AND we’ve added an area on the sheet where you can attach your business card! 🙂 )
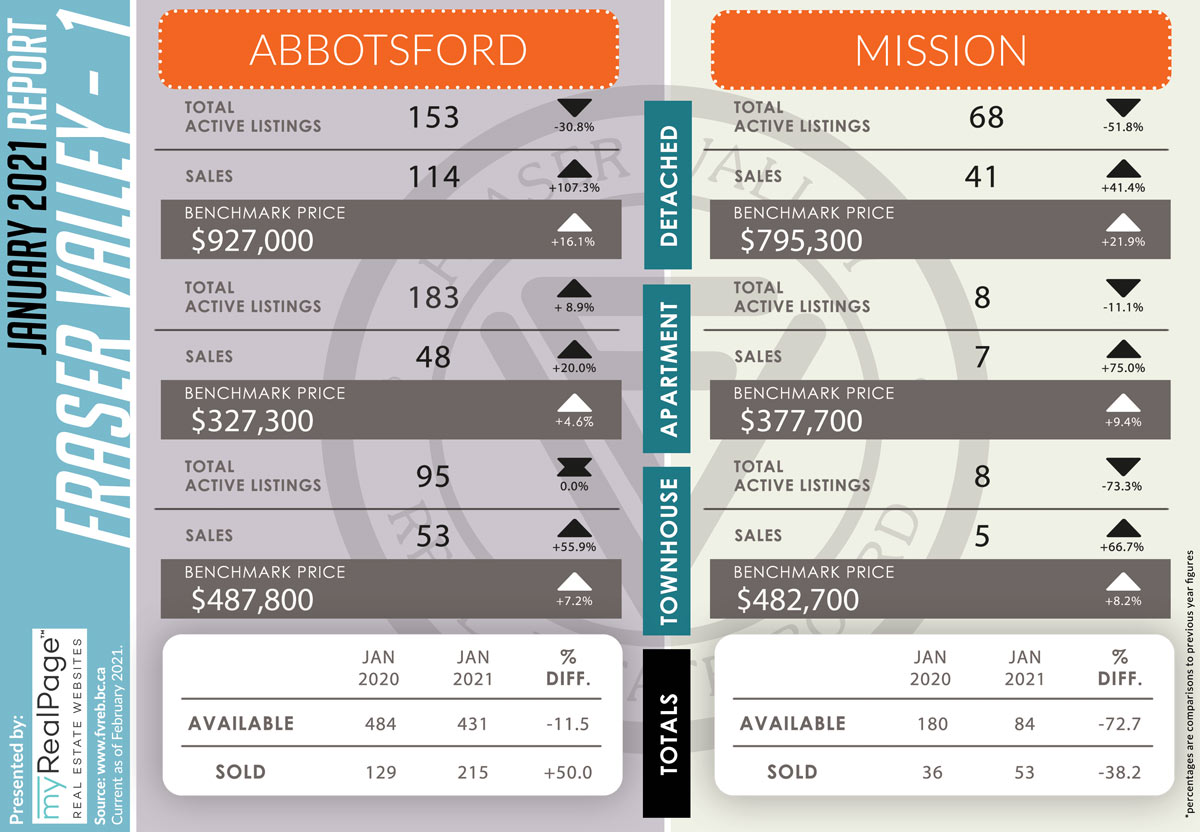
Download Printable Version Abbotsford / Mission – FVREB January 2021 Market Report
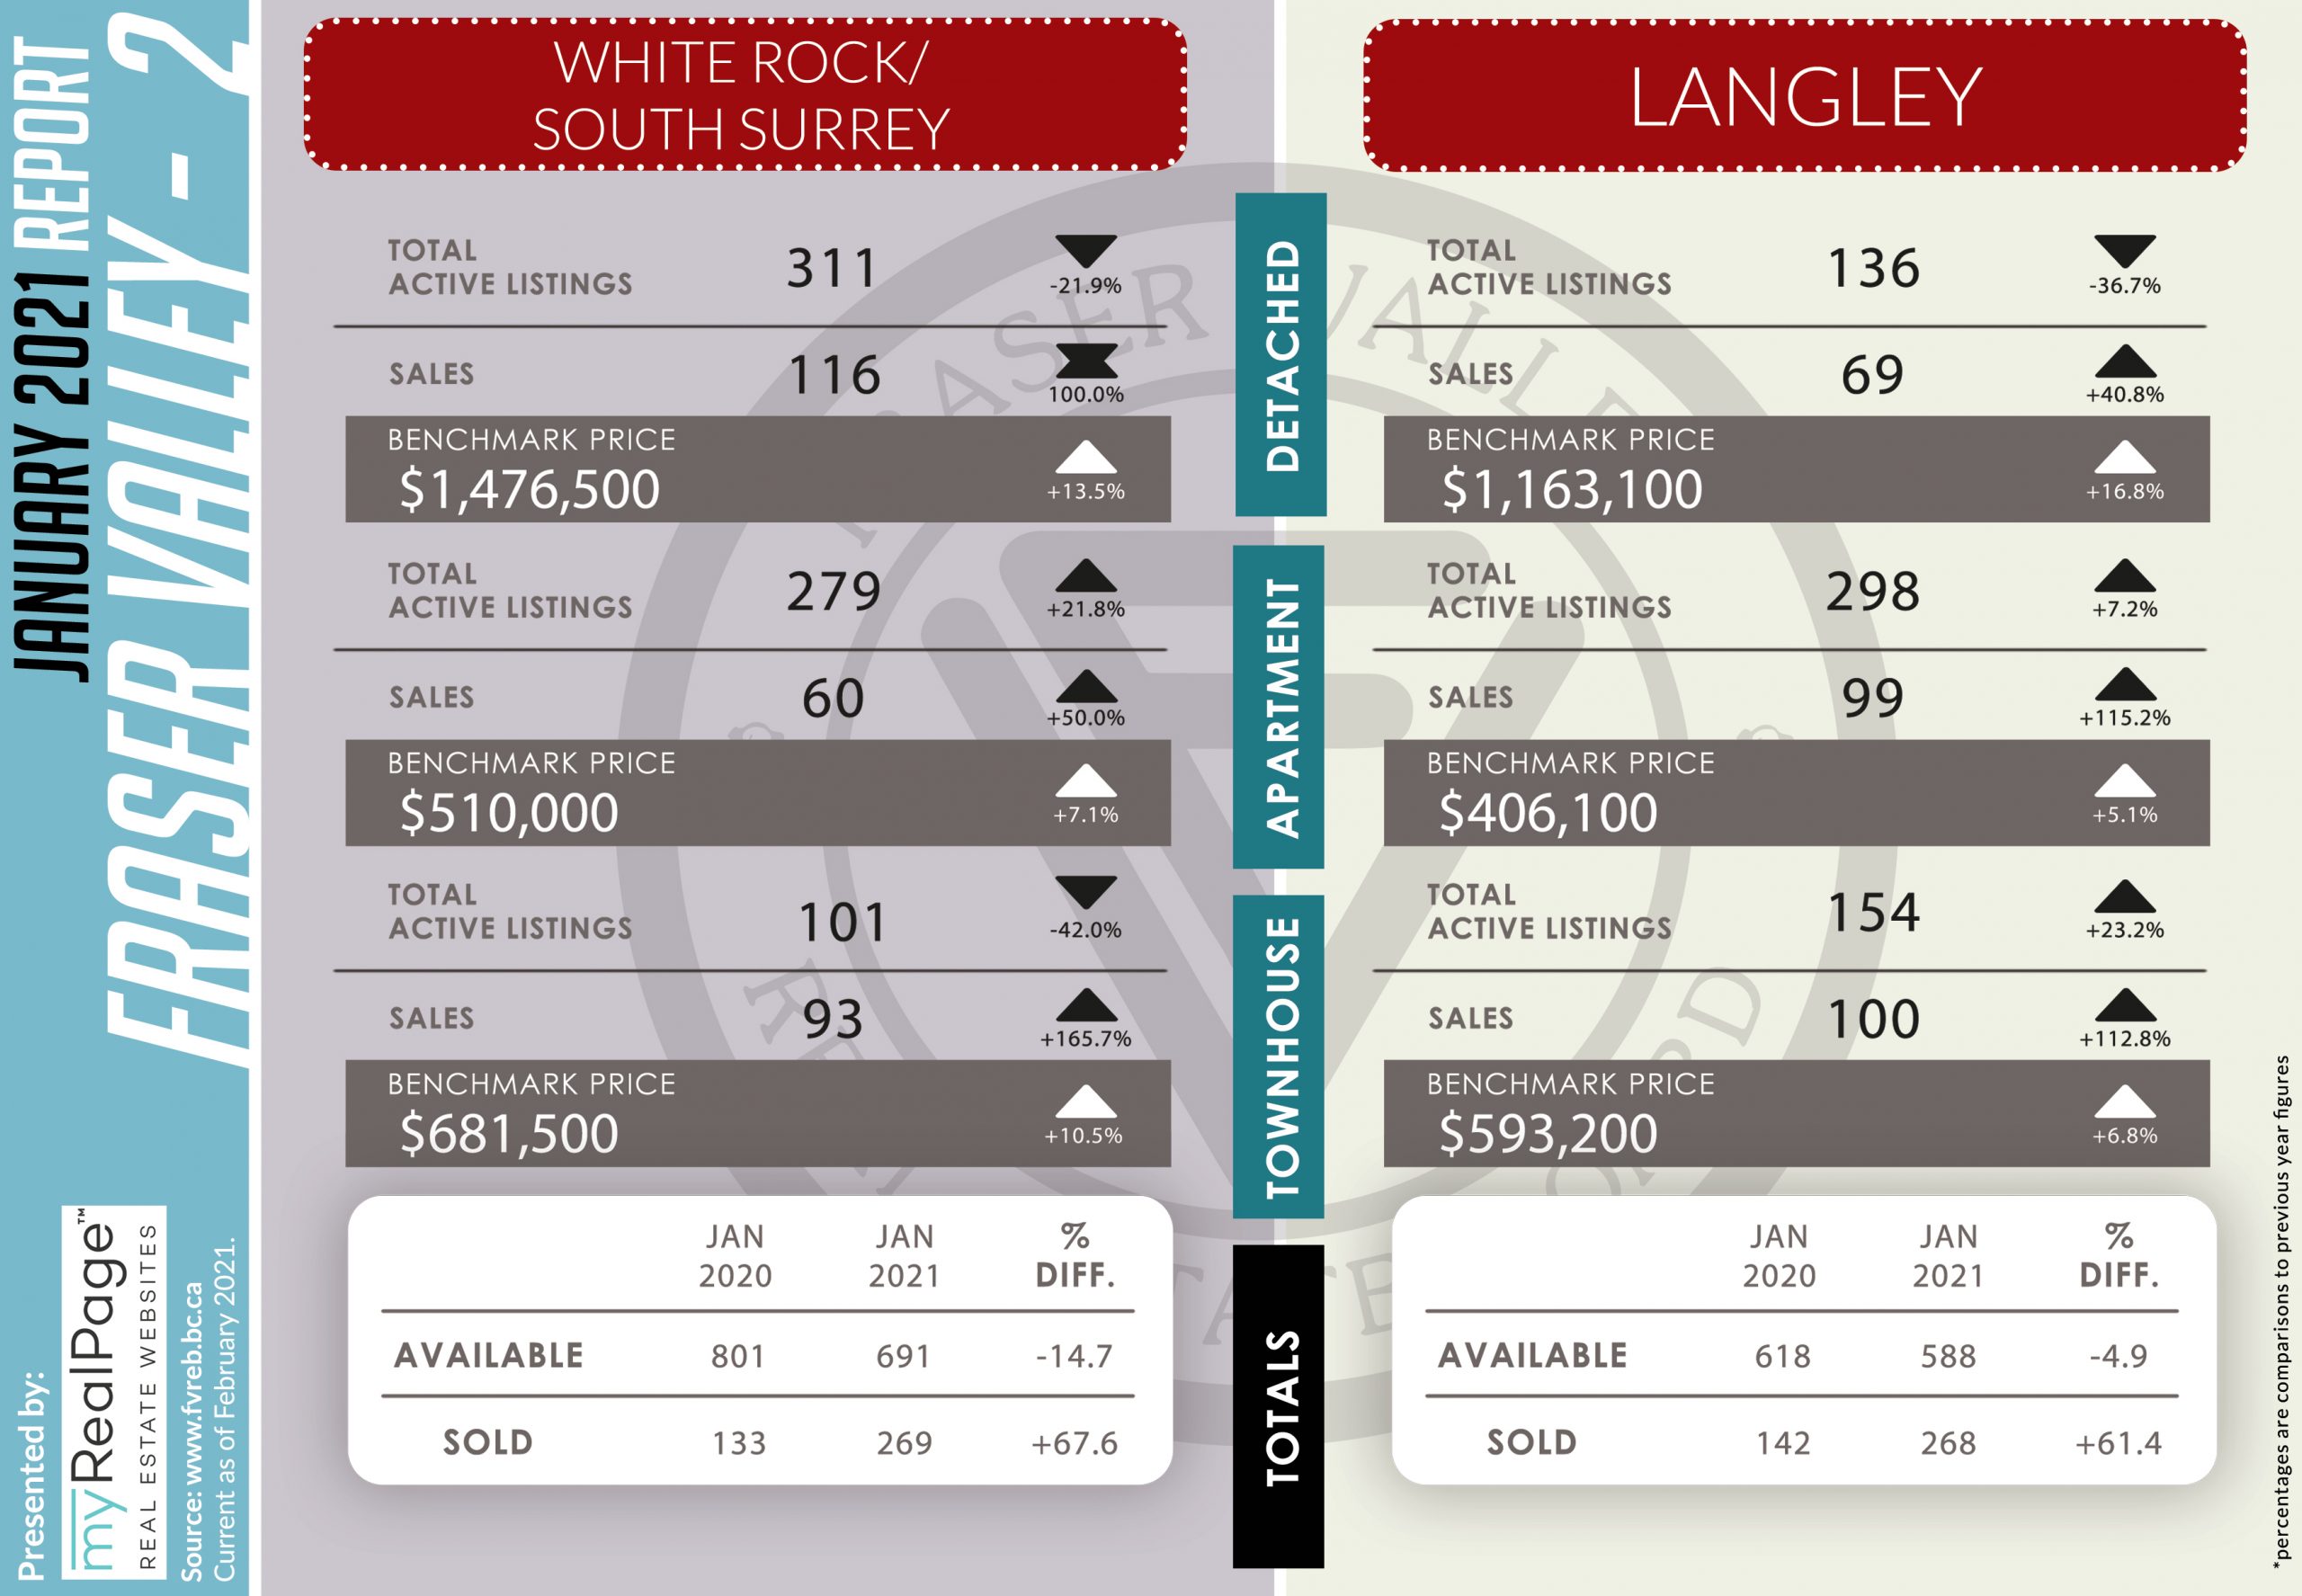
Download Printable Version White Rock Langley – FVREB January 2021 Market Report
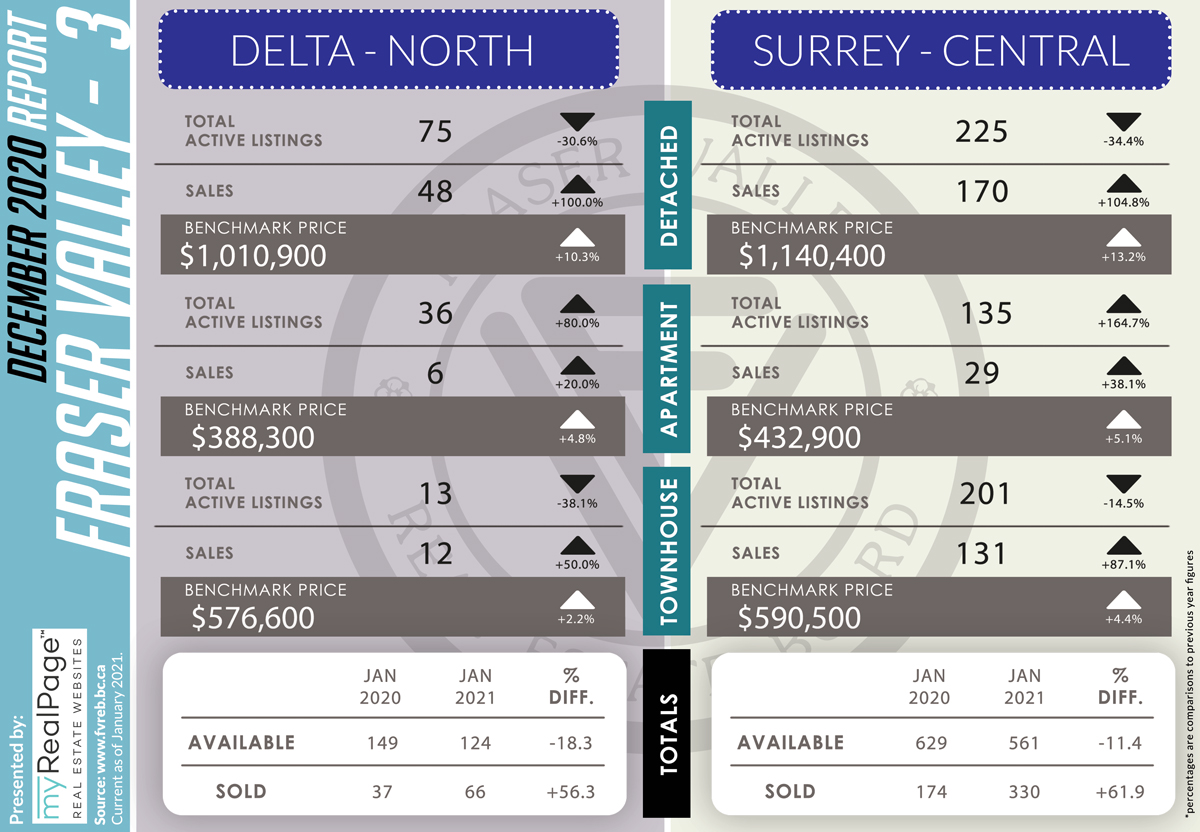
Download Printable Version Delta Surrey – FVREB January 2021 Market Report
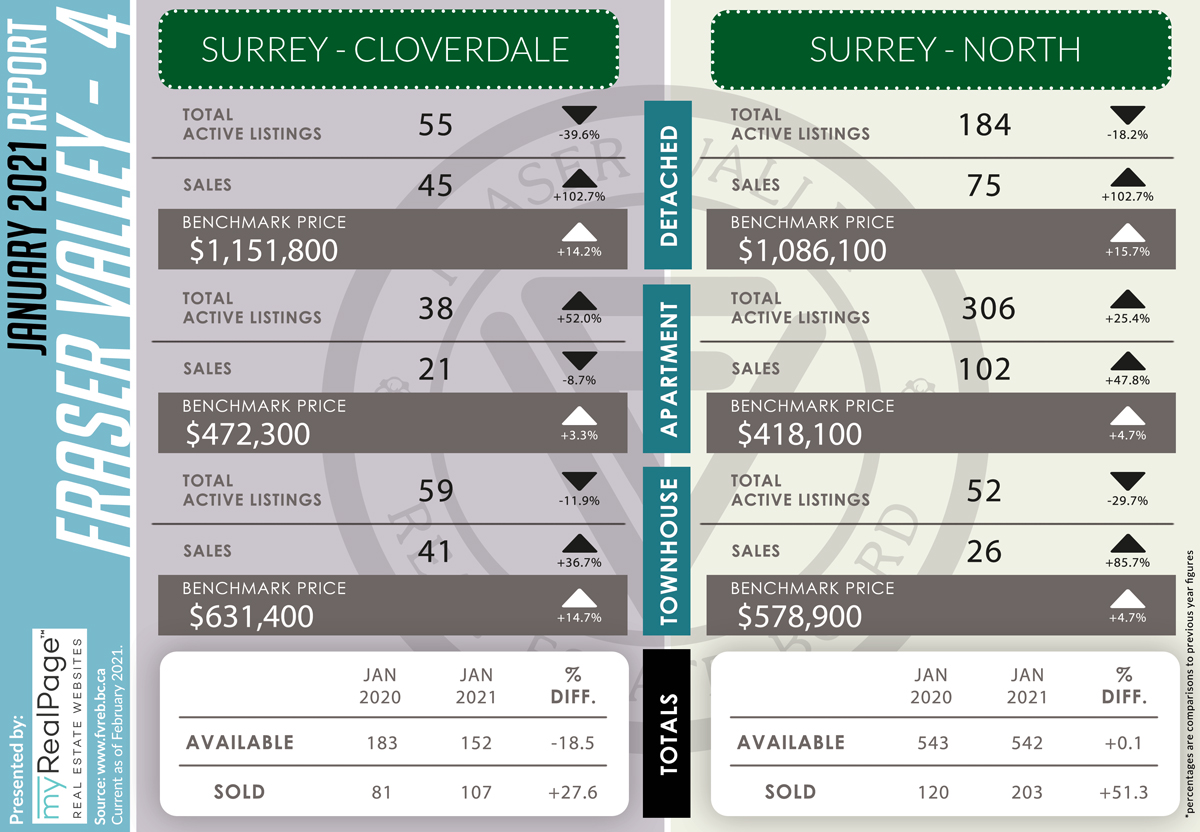
Download Printable Version Cloverdale / Surrey North – FVREB January 2021 Market Report
Last Updated on July 25, 2022 by myRealPage
