INFOGRAPHICS: September 2023 REBGV Greater Vancouver Market Reports

As inventory increases, price gains relent to begin the fall season
The month-over-month price gains seen earlier this year abated in the Metro Vancouver housing market in September due to a seasonal decline in sales and a modest increase in inventory levels across the region.
The Real Estate Board of Greater Vancouver (REBGV) reports that residential home sales in the region totalled 1,926 in September 2023, a 13.2 per cent increase from the 1,701 sales recorded in September 2022. This was 26.3 per cent below the 10-year seasonal average (2,614).
“A key dynamic we’ve been watching this year has been the reluctance of some homeowners to list their homes given that mortgage rates are the highest they’ve been in over ten years. With fewer listings coming to the market earlier this year than usual, inventory levels remained very low, which led prices to increase throughout the spring and summer months.”
Andrew Lis, REBGV director of economics and data analytics
Read the full report on the REBGV website!
The following data is a comparison between September 2023 and September 2022 numbers, and is current as of October 2023. For last month’s update, you can check out our previous post!
Or follow this link for all our REBGV Infographics!
These infographics cover current trends in several areas within the Greater Vancouver region. Click on the images for a larger view!
Printable Version – REBGV September 2023 Data Infographic Report North Vancouver
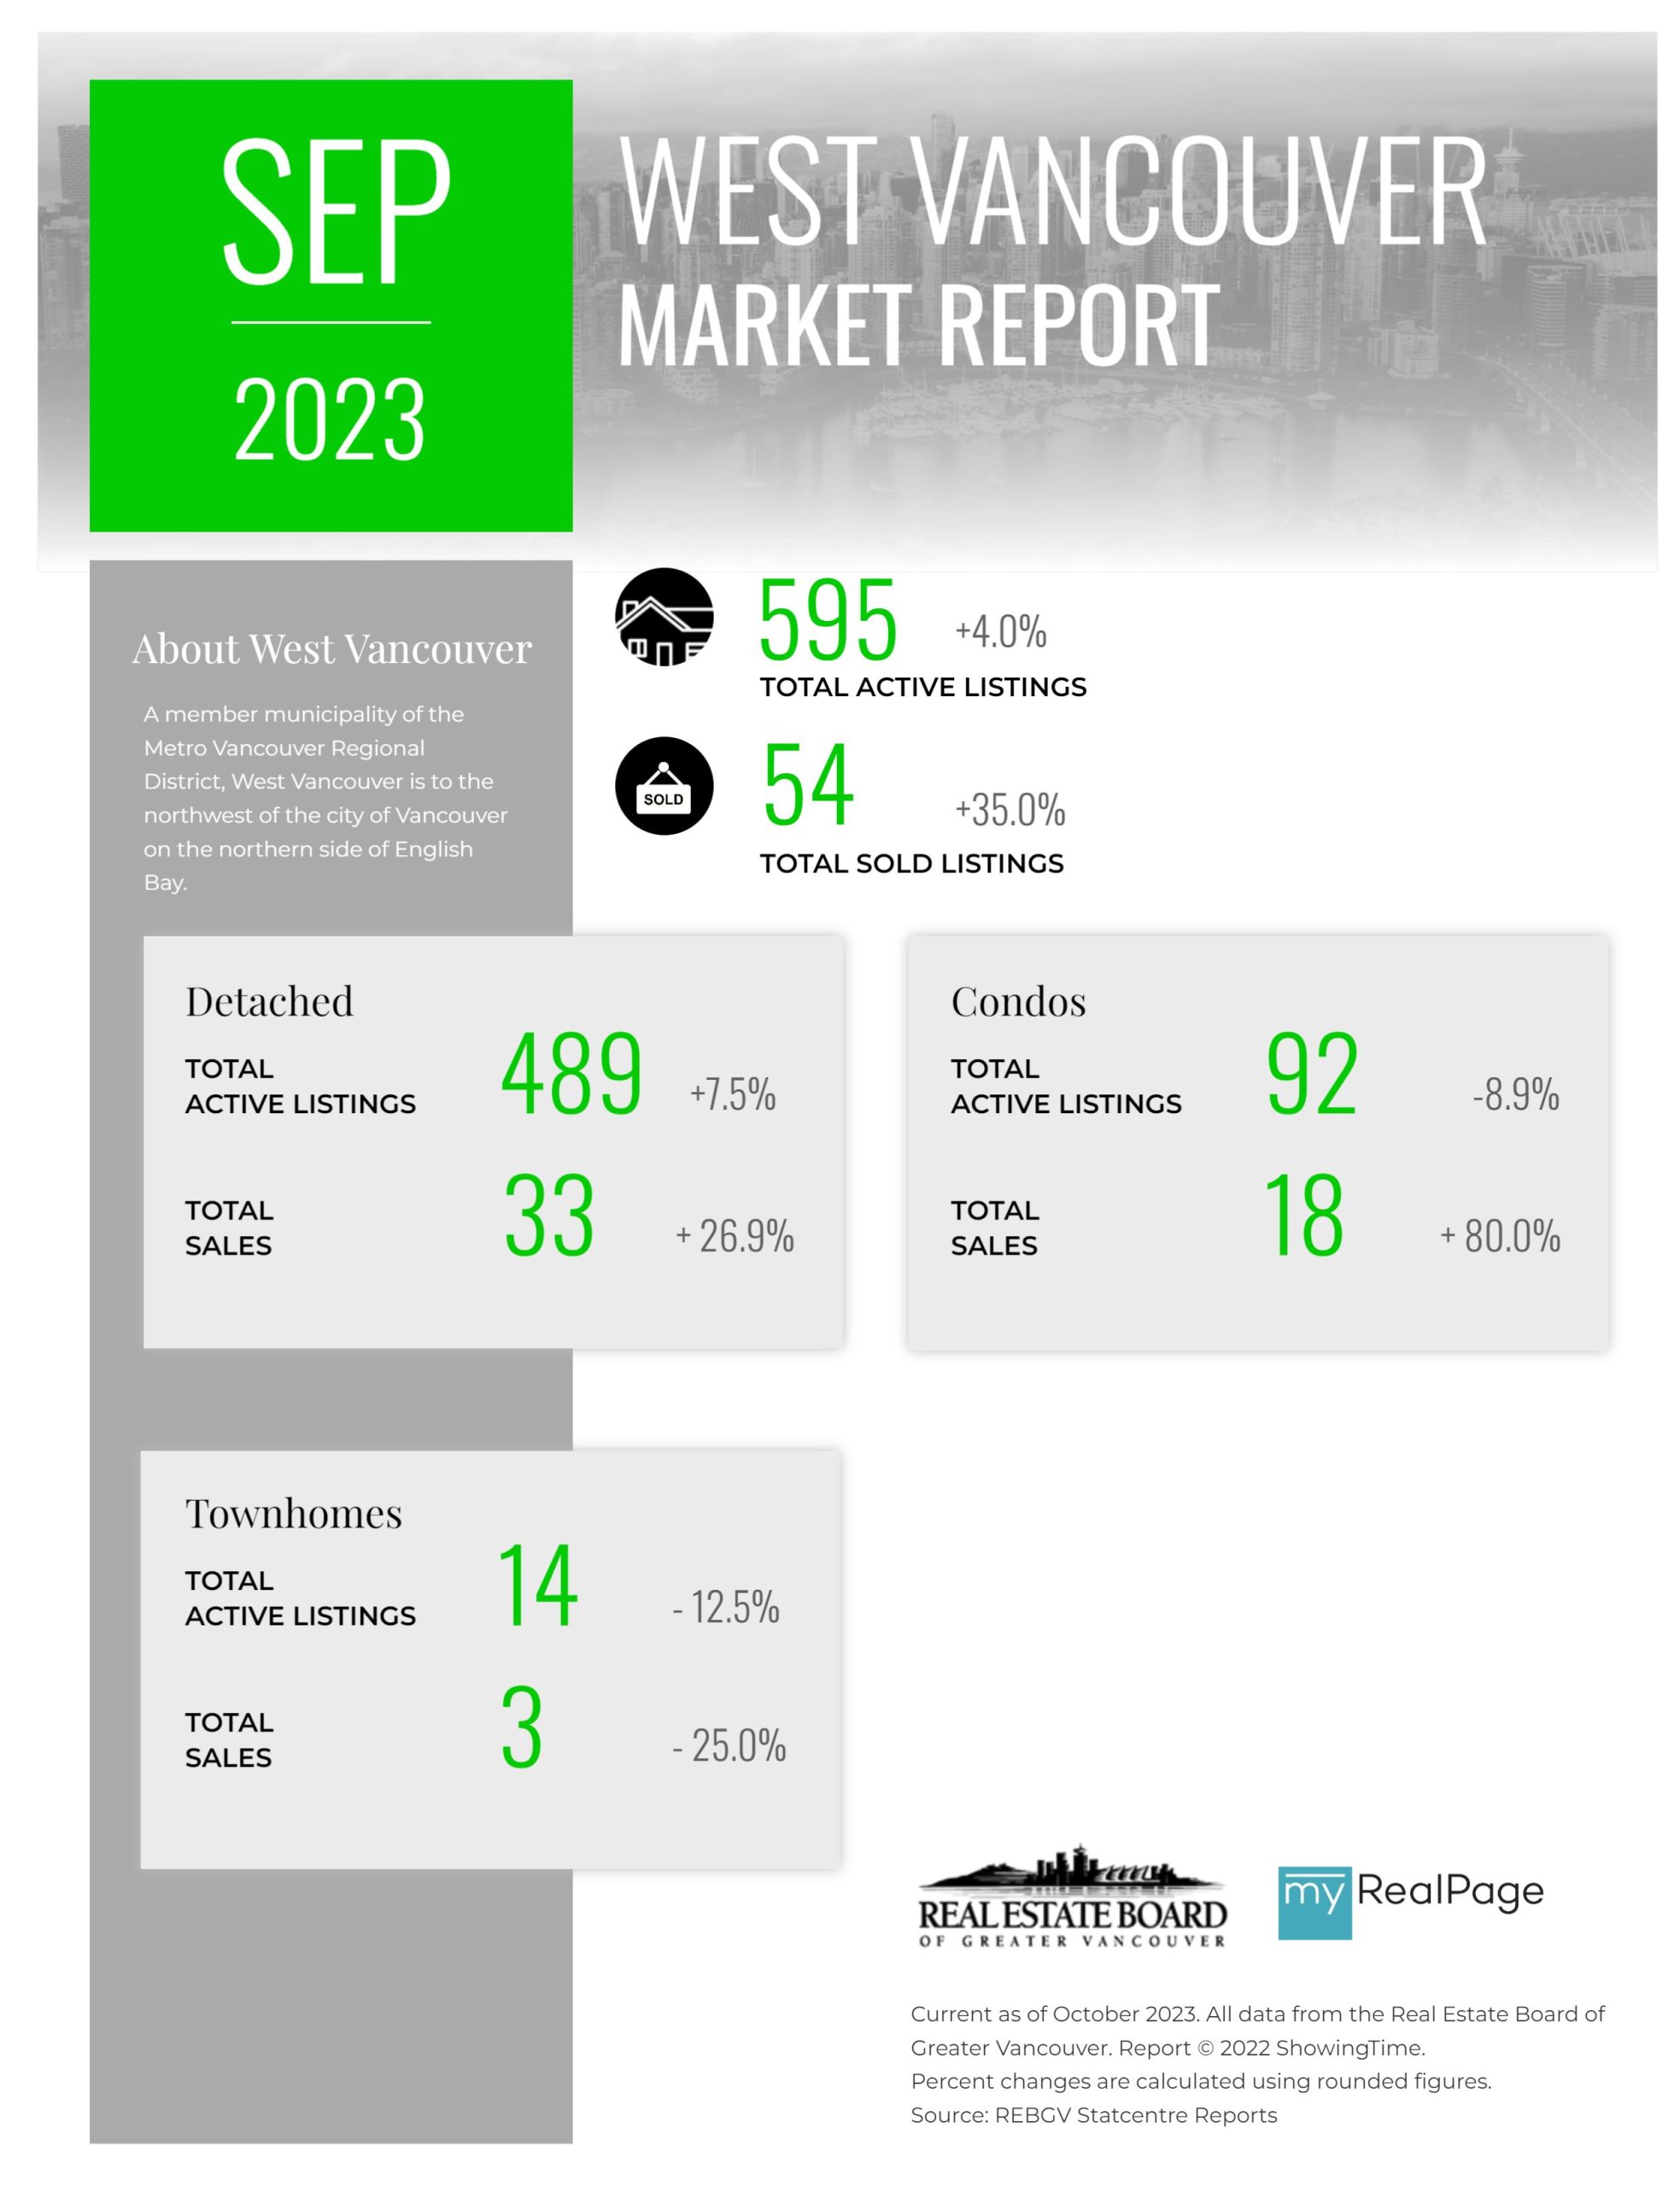
Printable Version – REBGV September 2023 Data Infographics Report West Vancouver
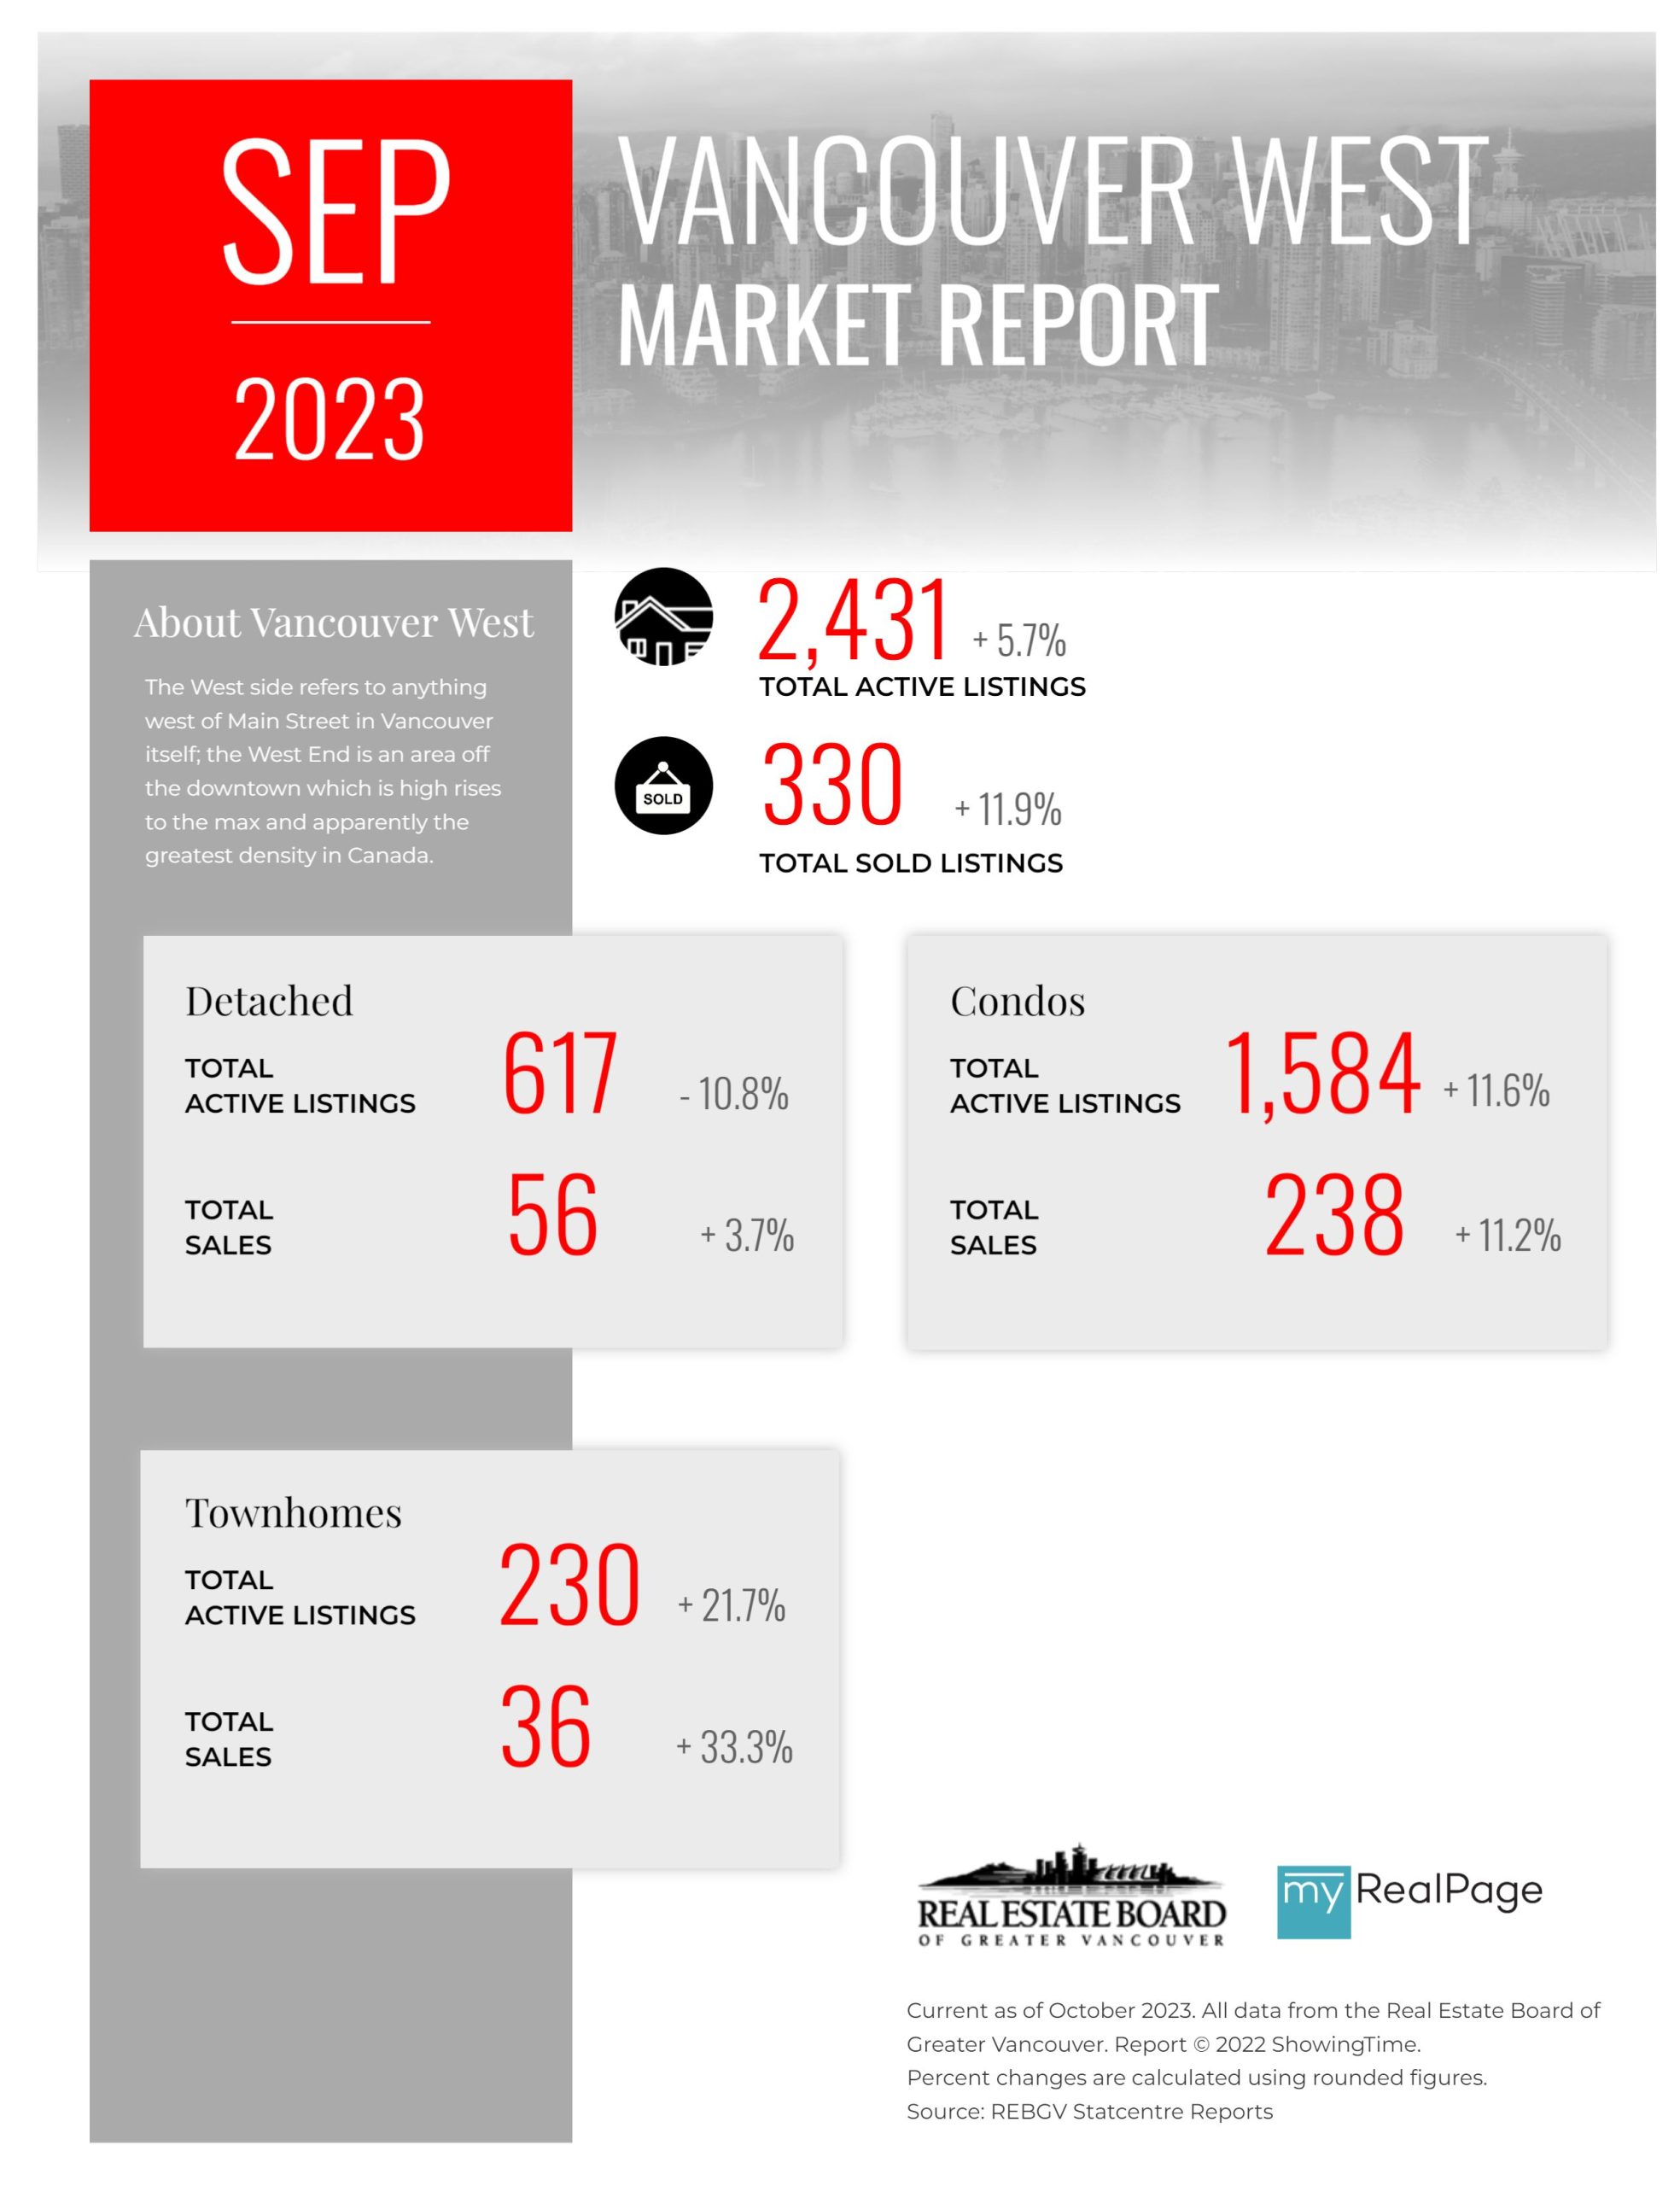
Printable Version – REBGV September 2023 Data Infographics Report Vancouver West
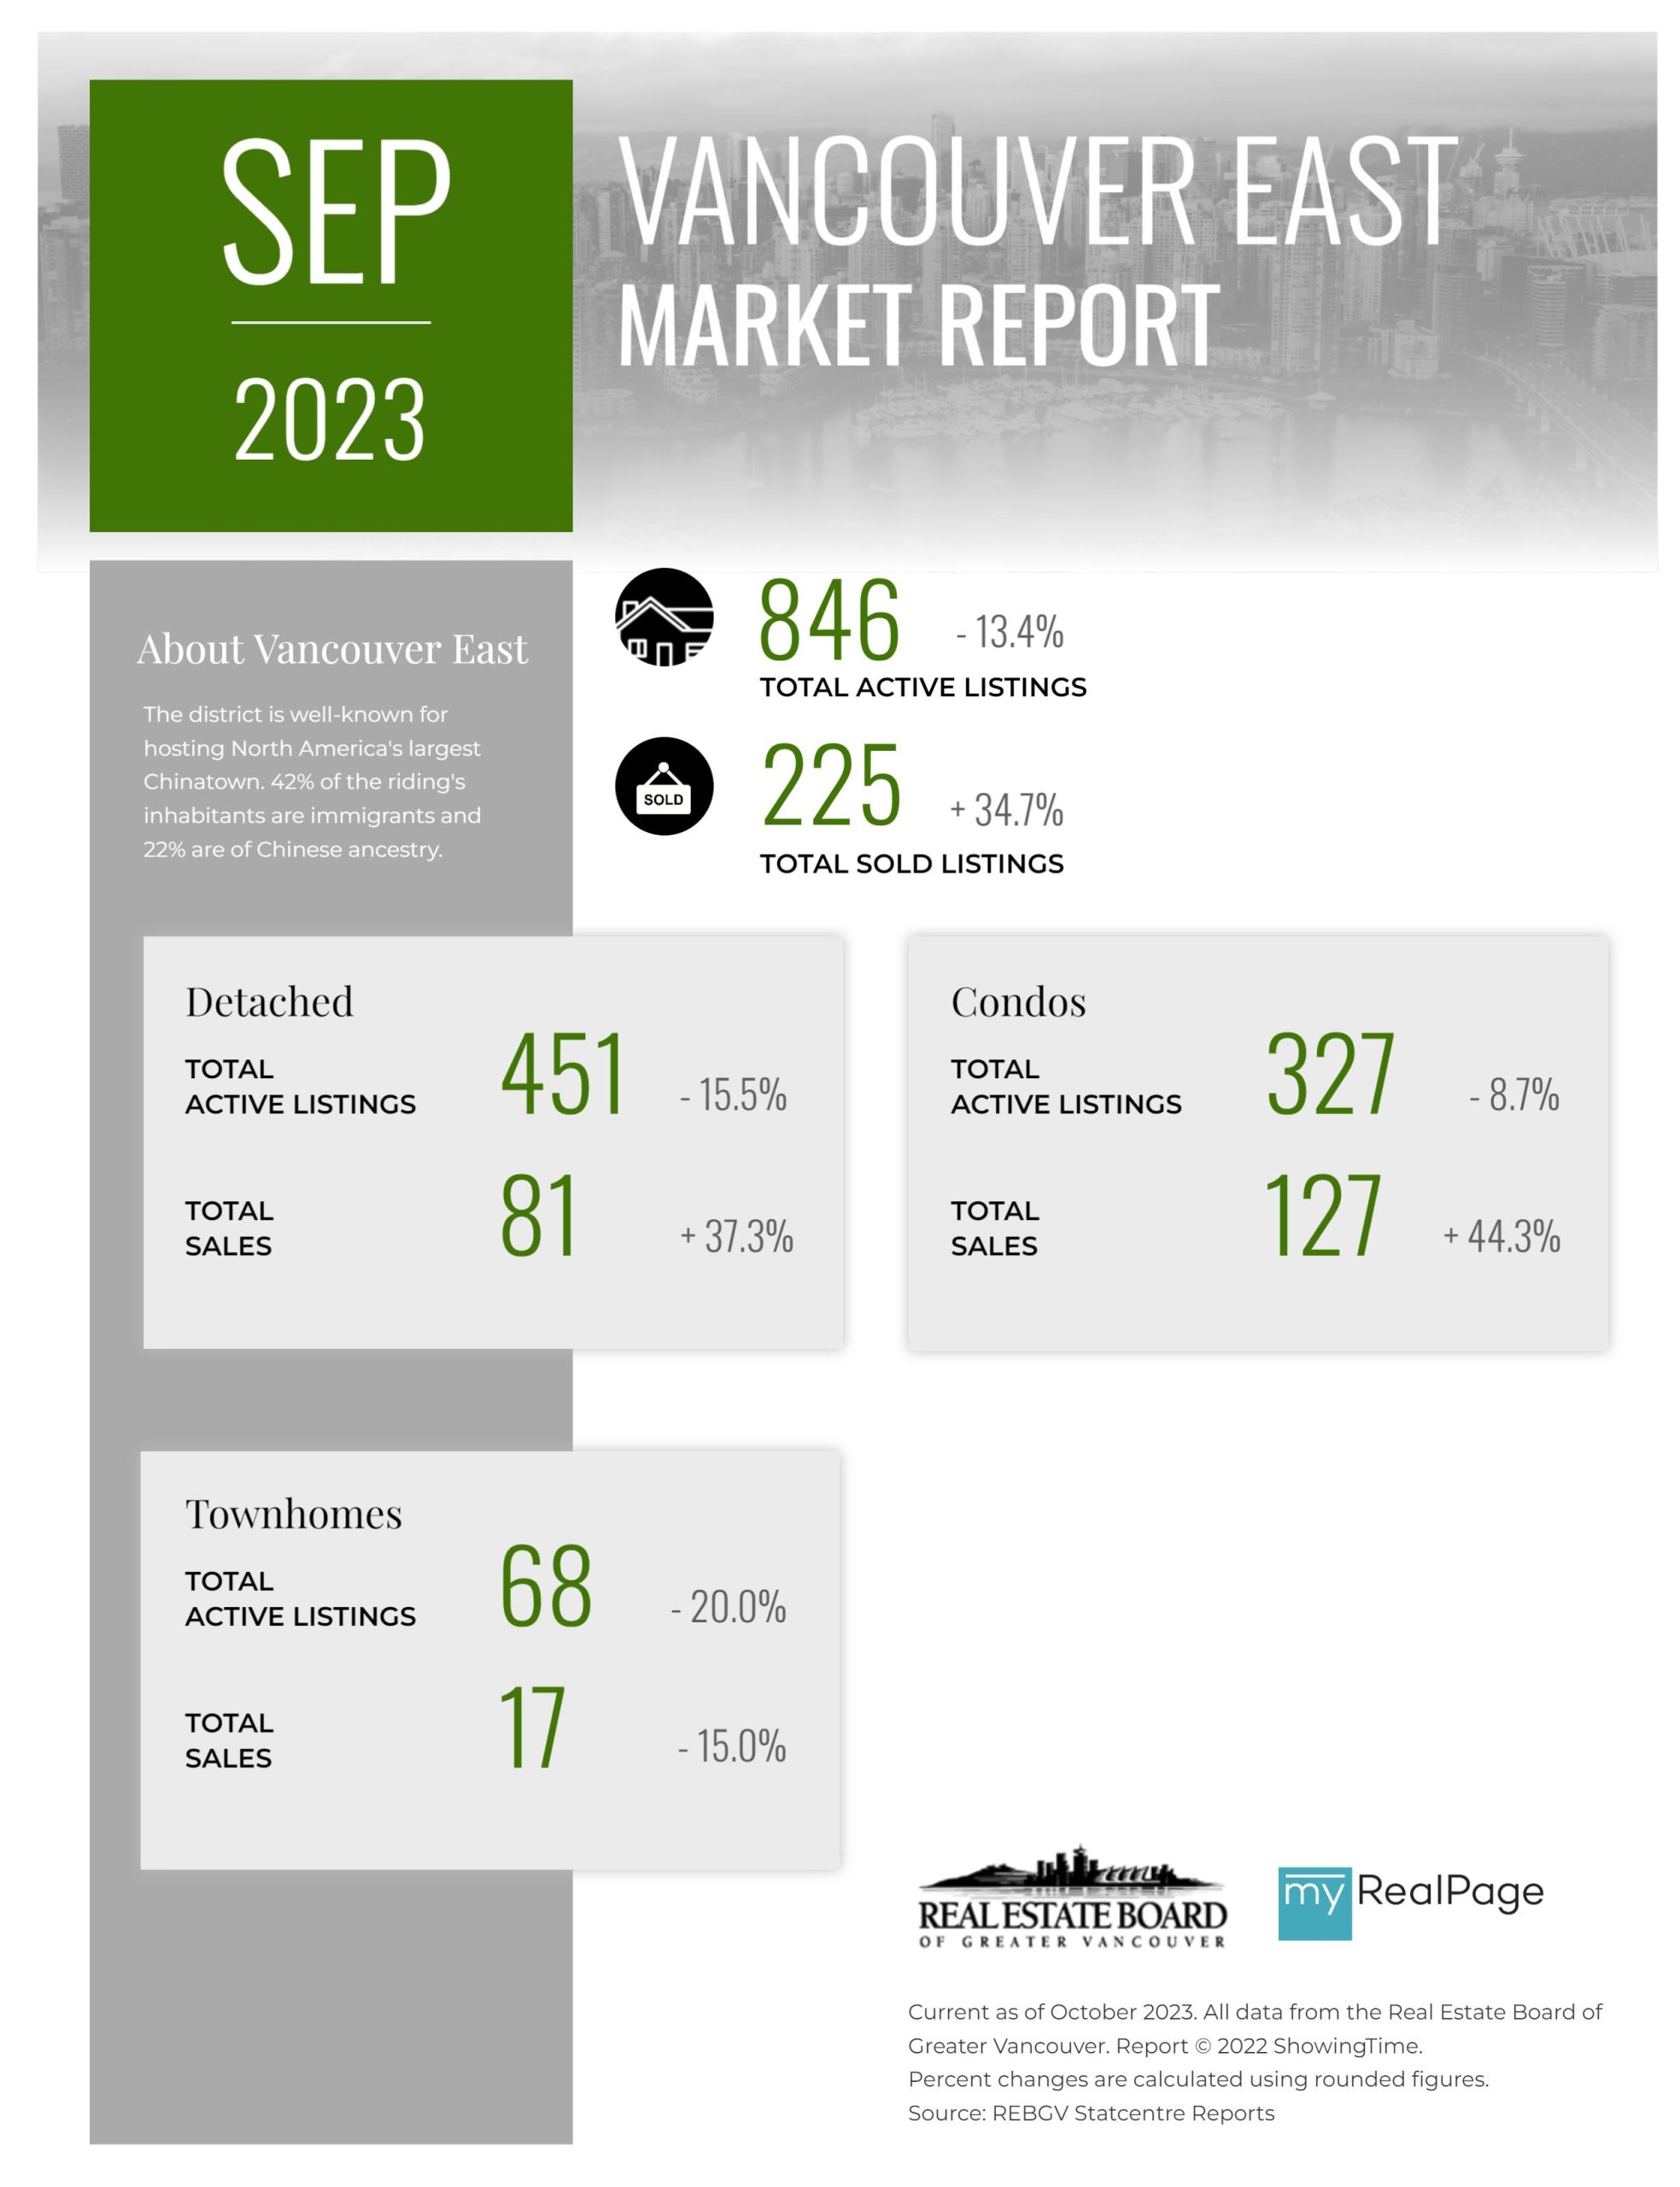
Printable Version – REBGV September 2023 Data Infographics Report Vancouver East
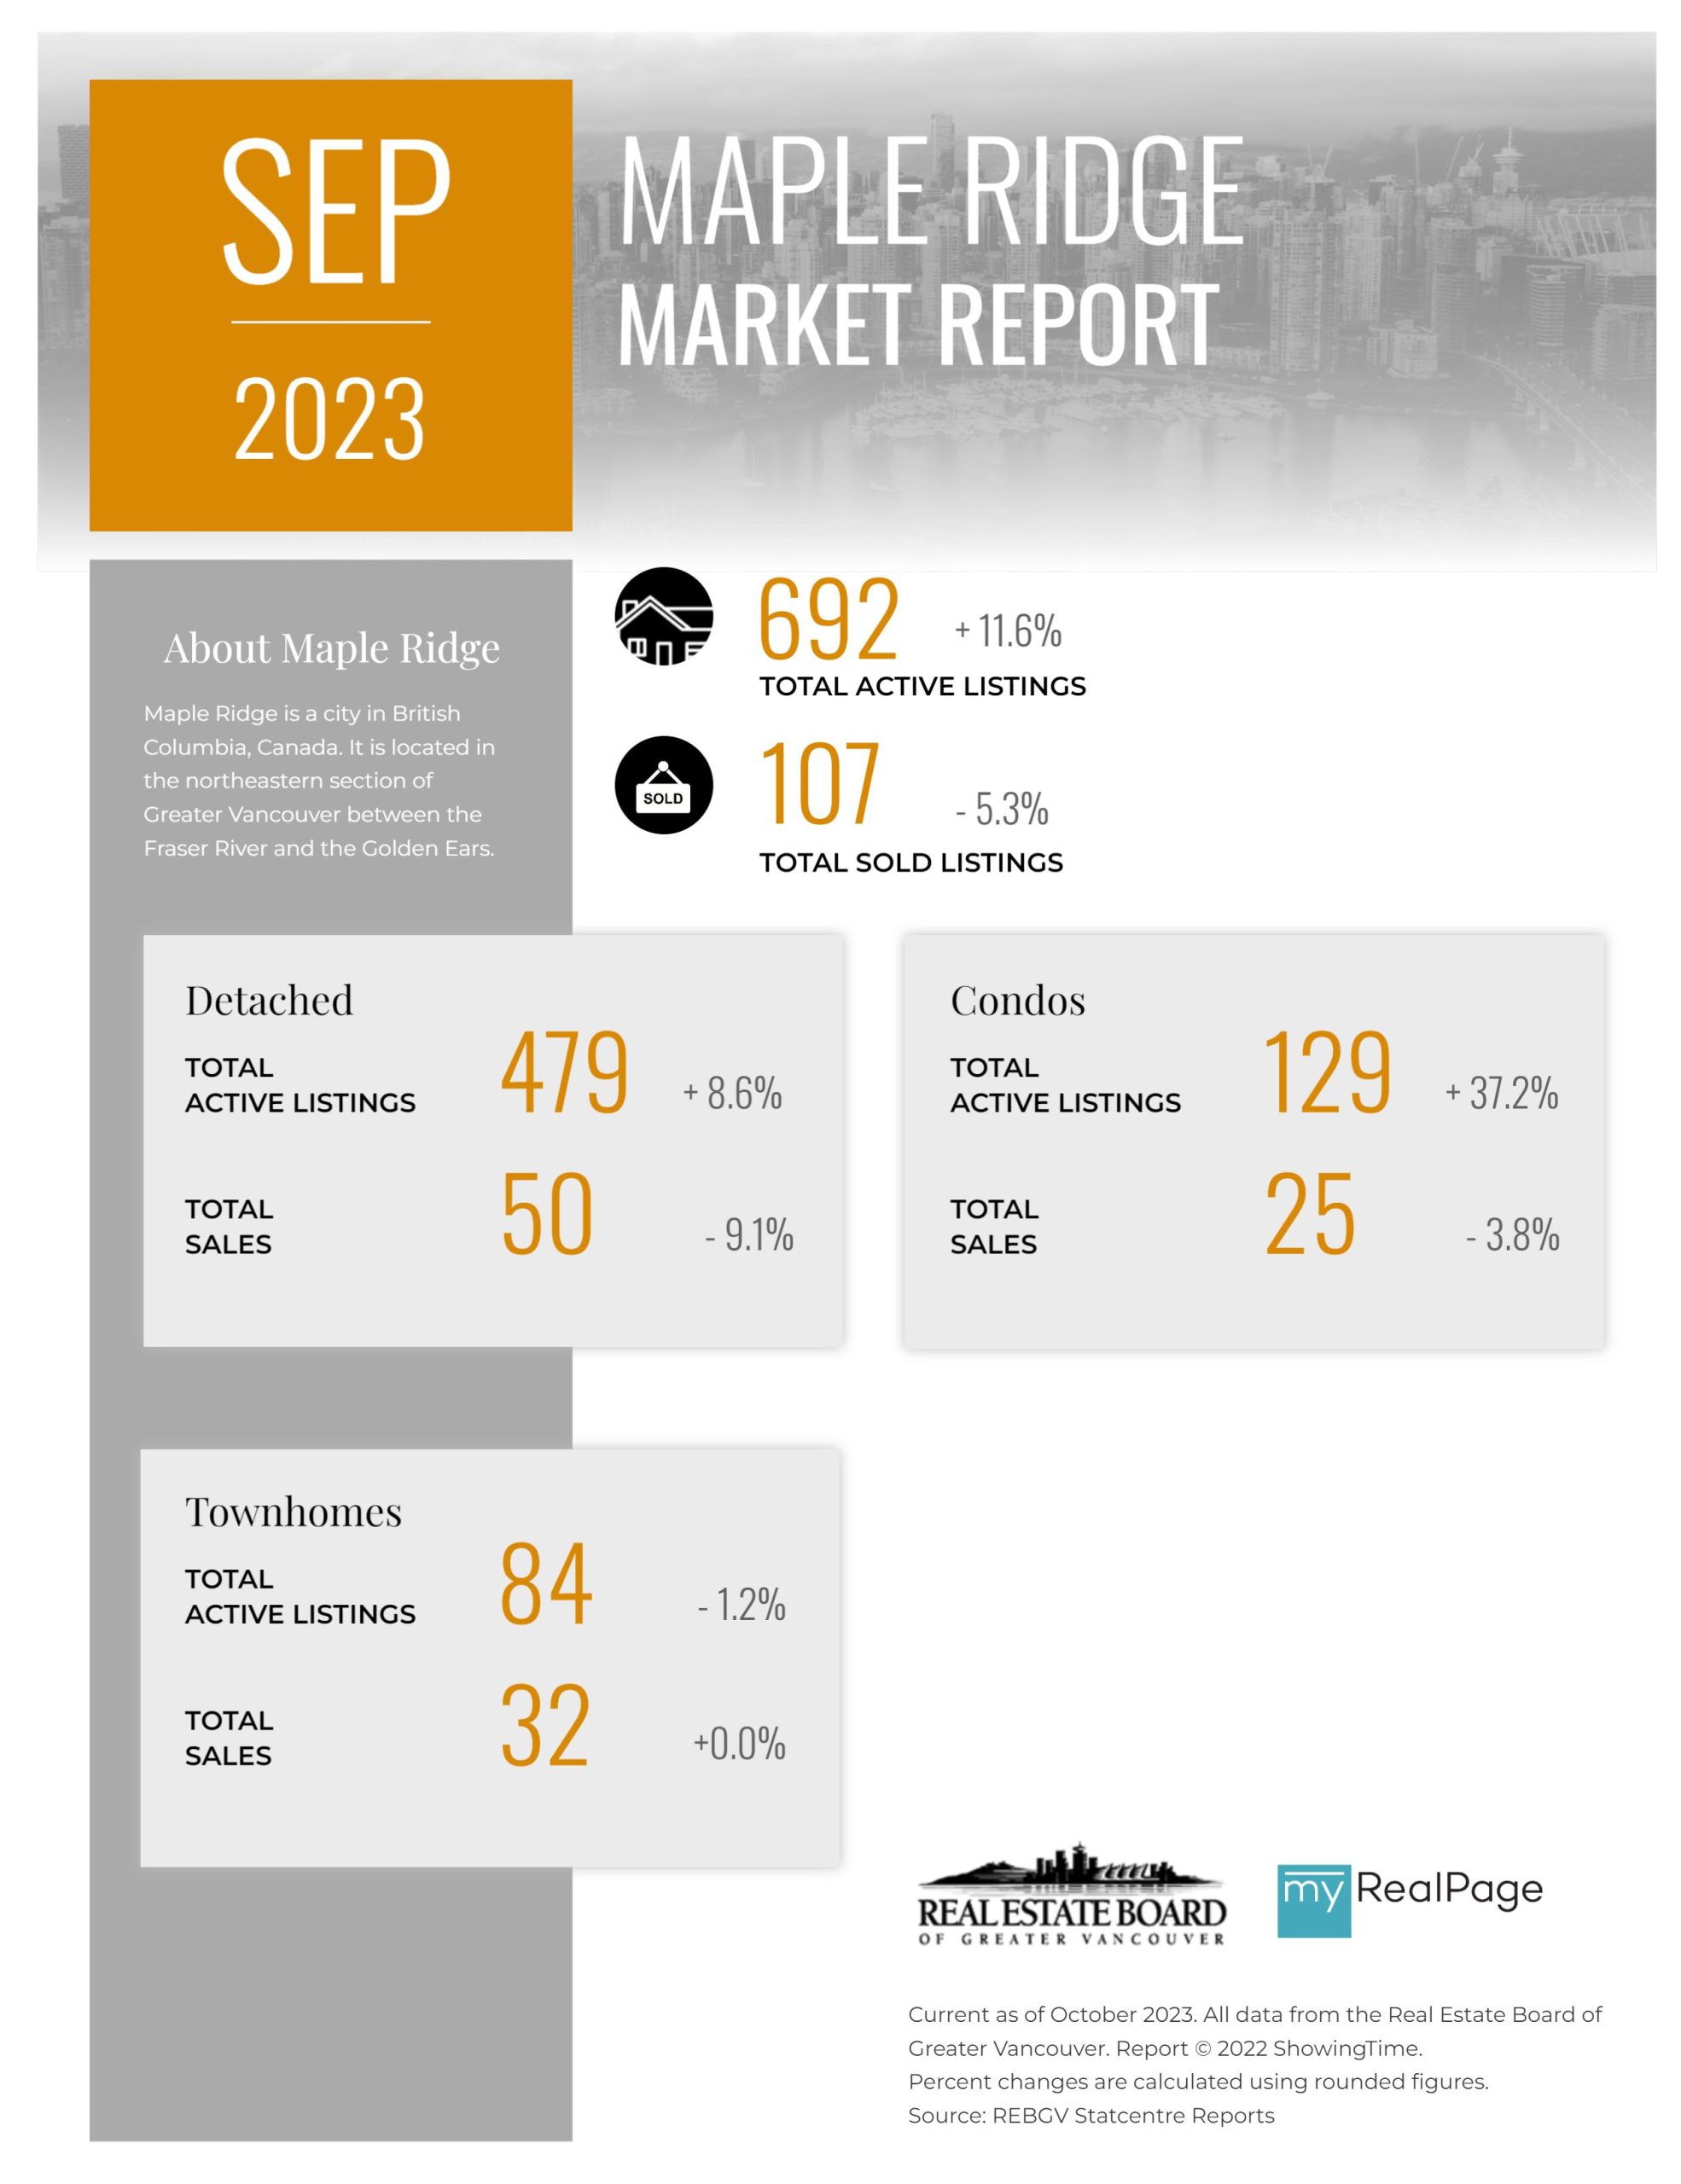
Printable Version – REBGV September 2023 Data Infographic Report Maple Ridge
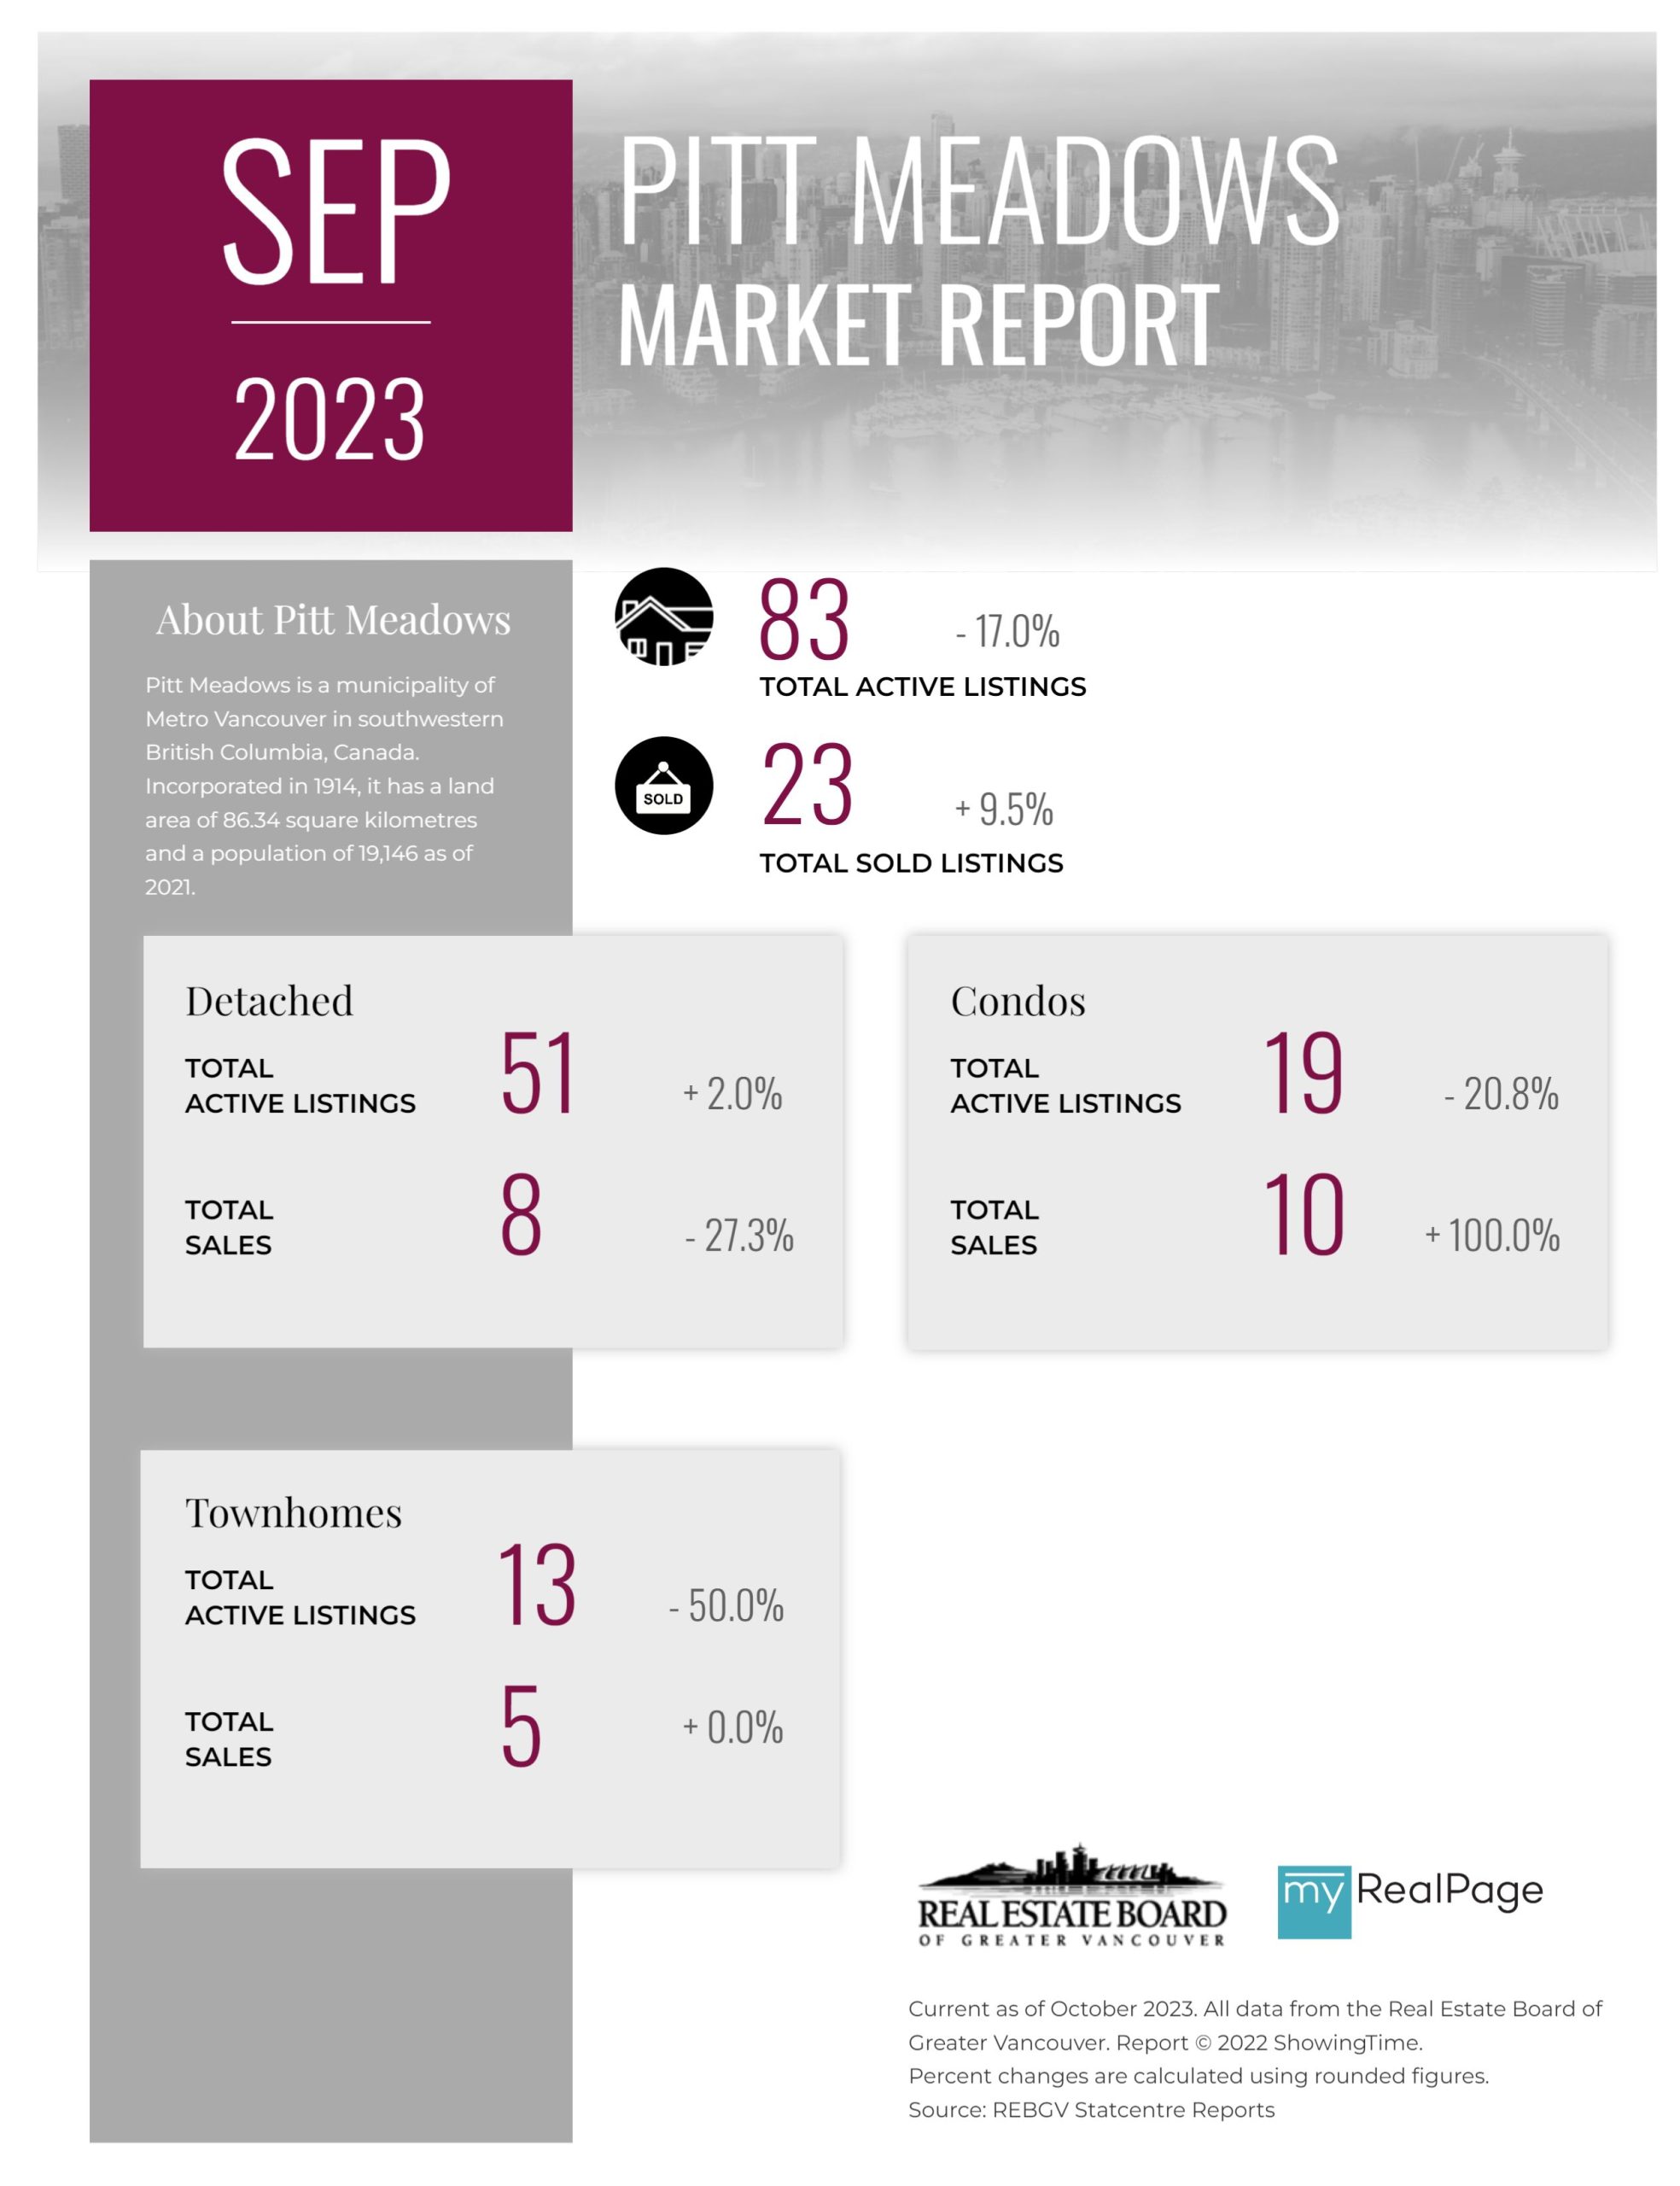
Printable Version – REBGV September 2023 Data Infographics Report Pitt Meadows
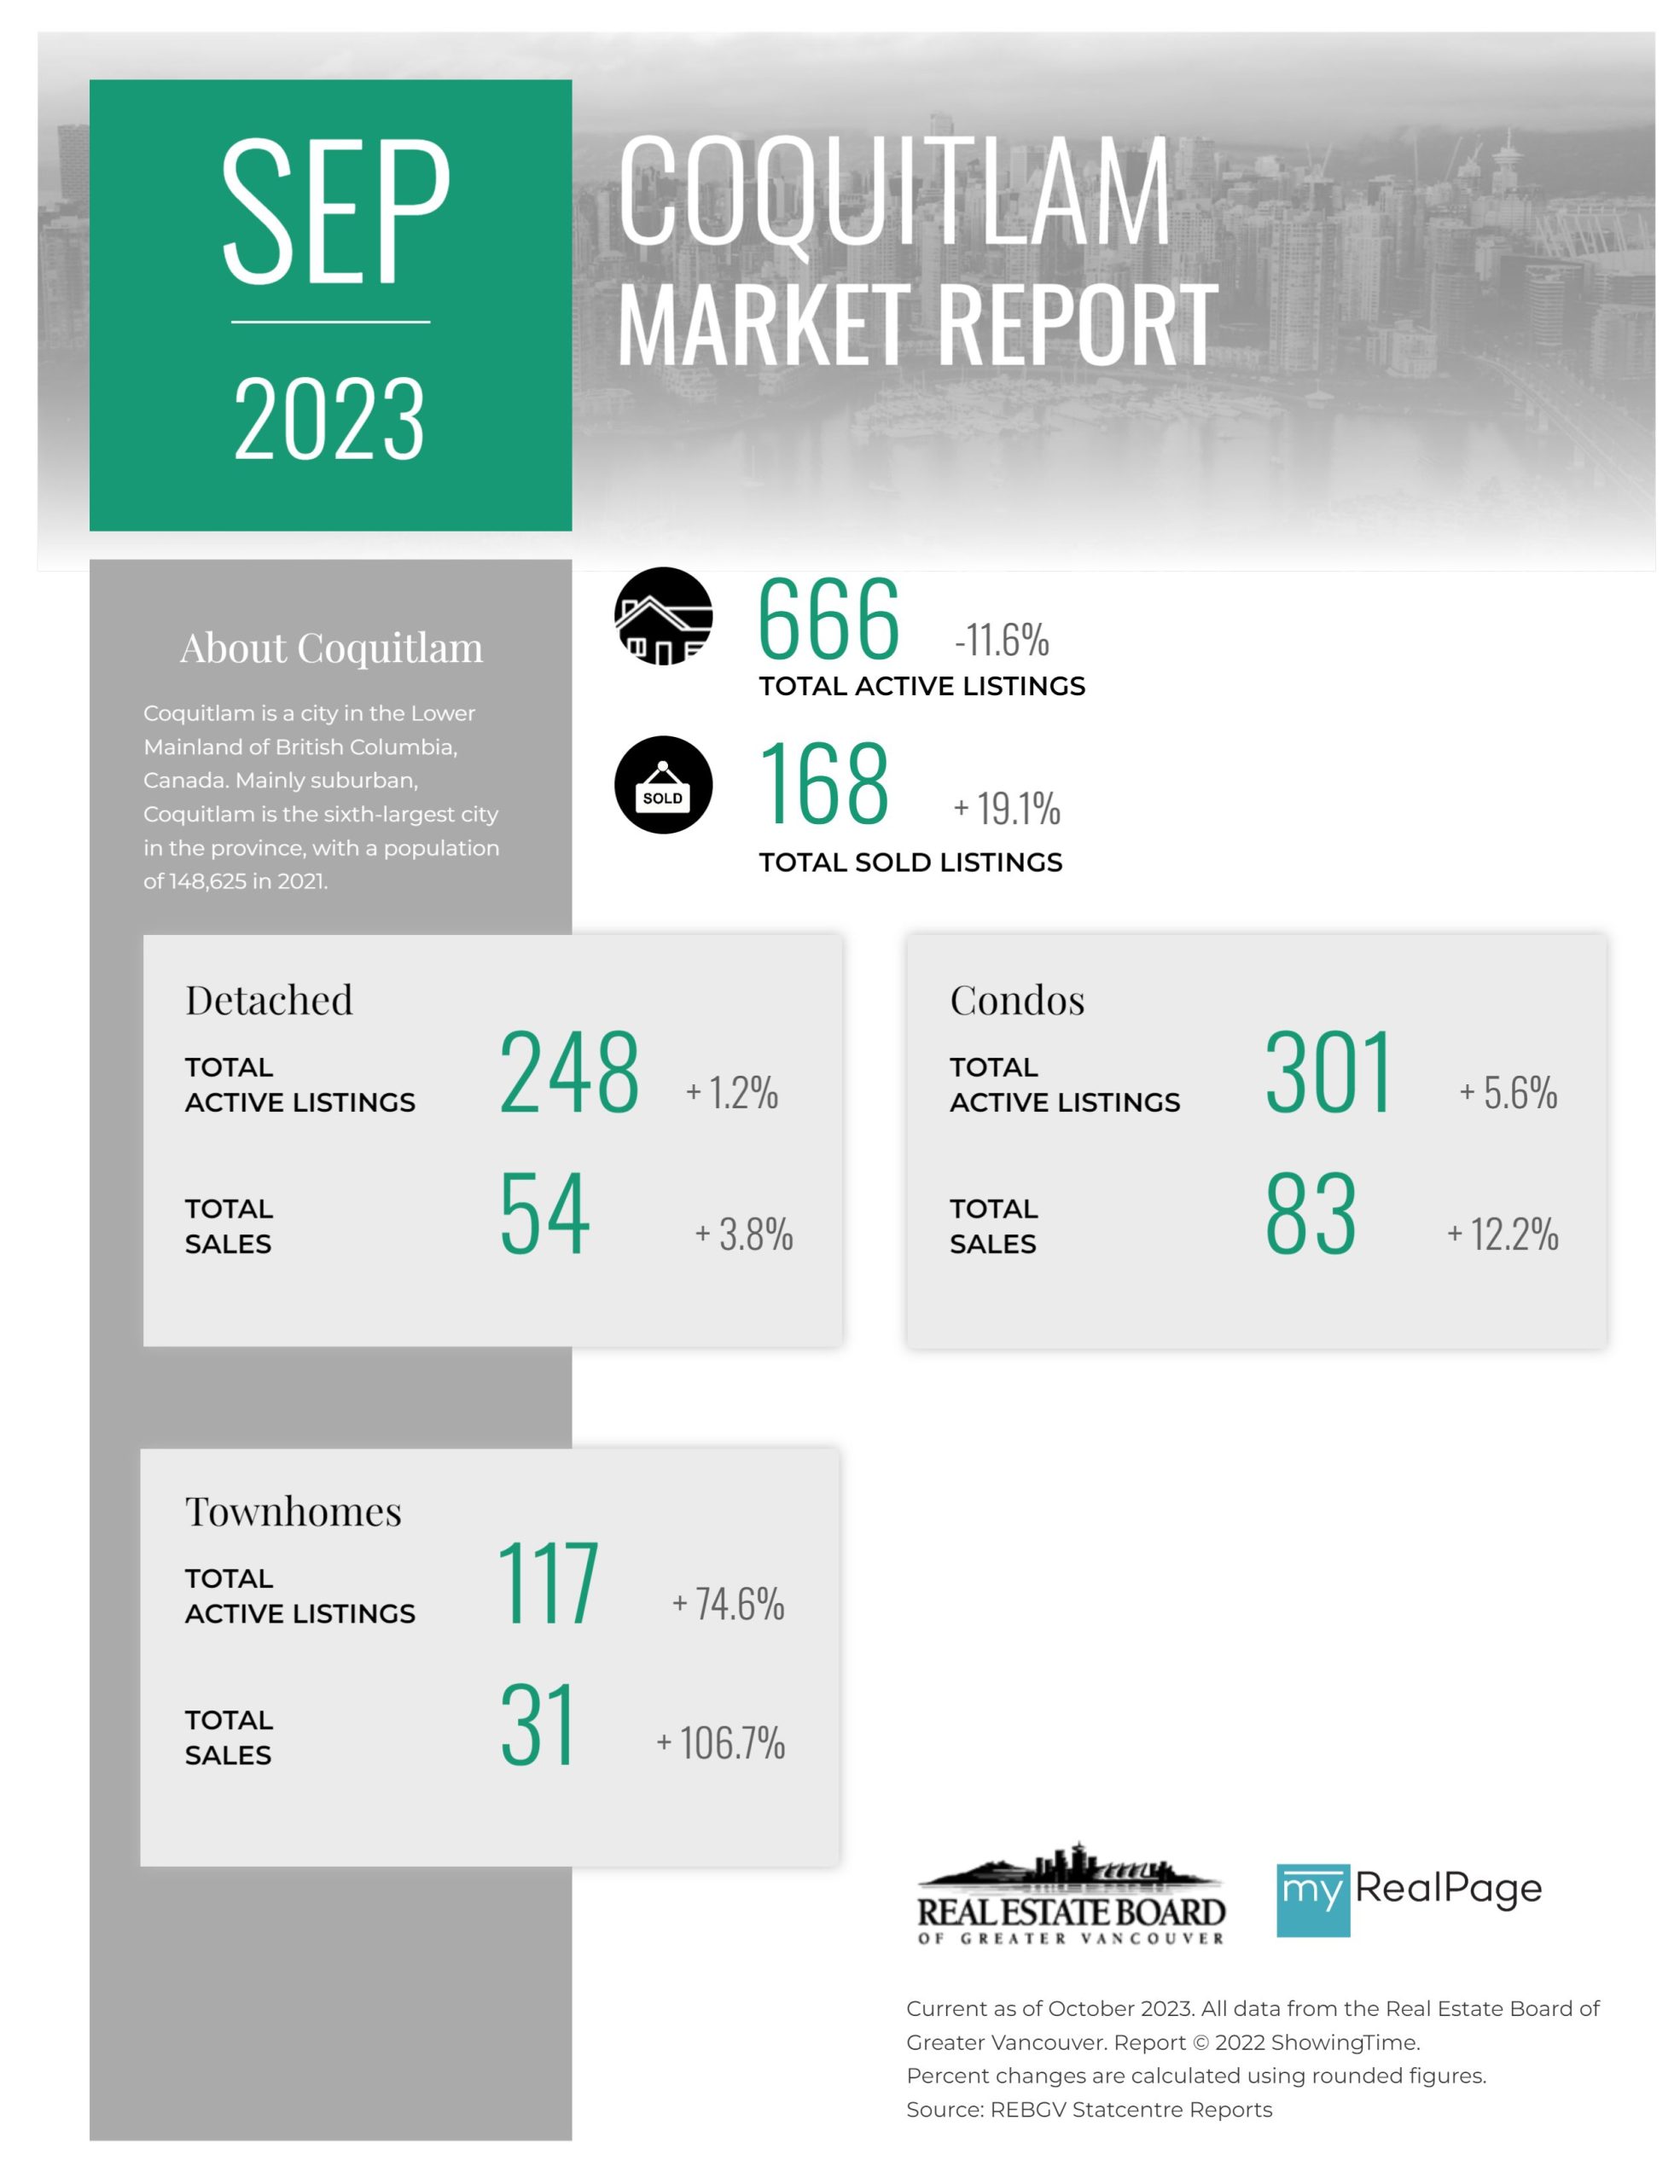
Printable Version – REBGV September 2023 Data Infographics Report Coquitlam
Printable Version – REBGV September 2023 Data Infographics Report Port Coquitlam
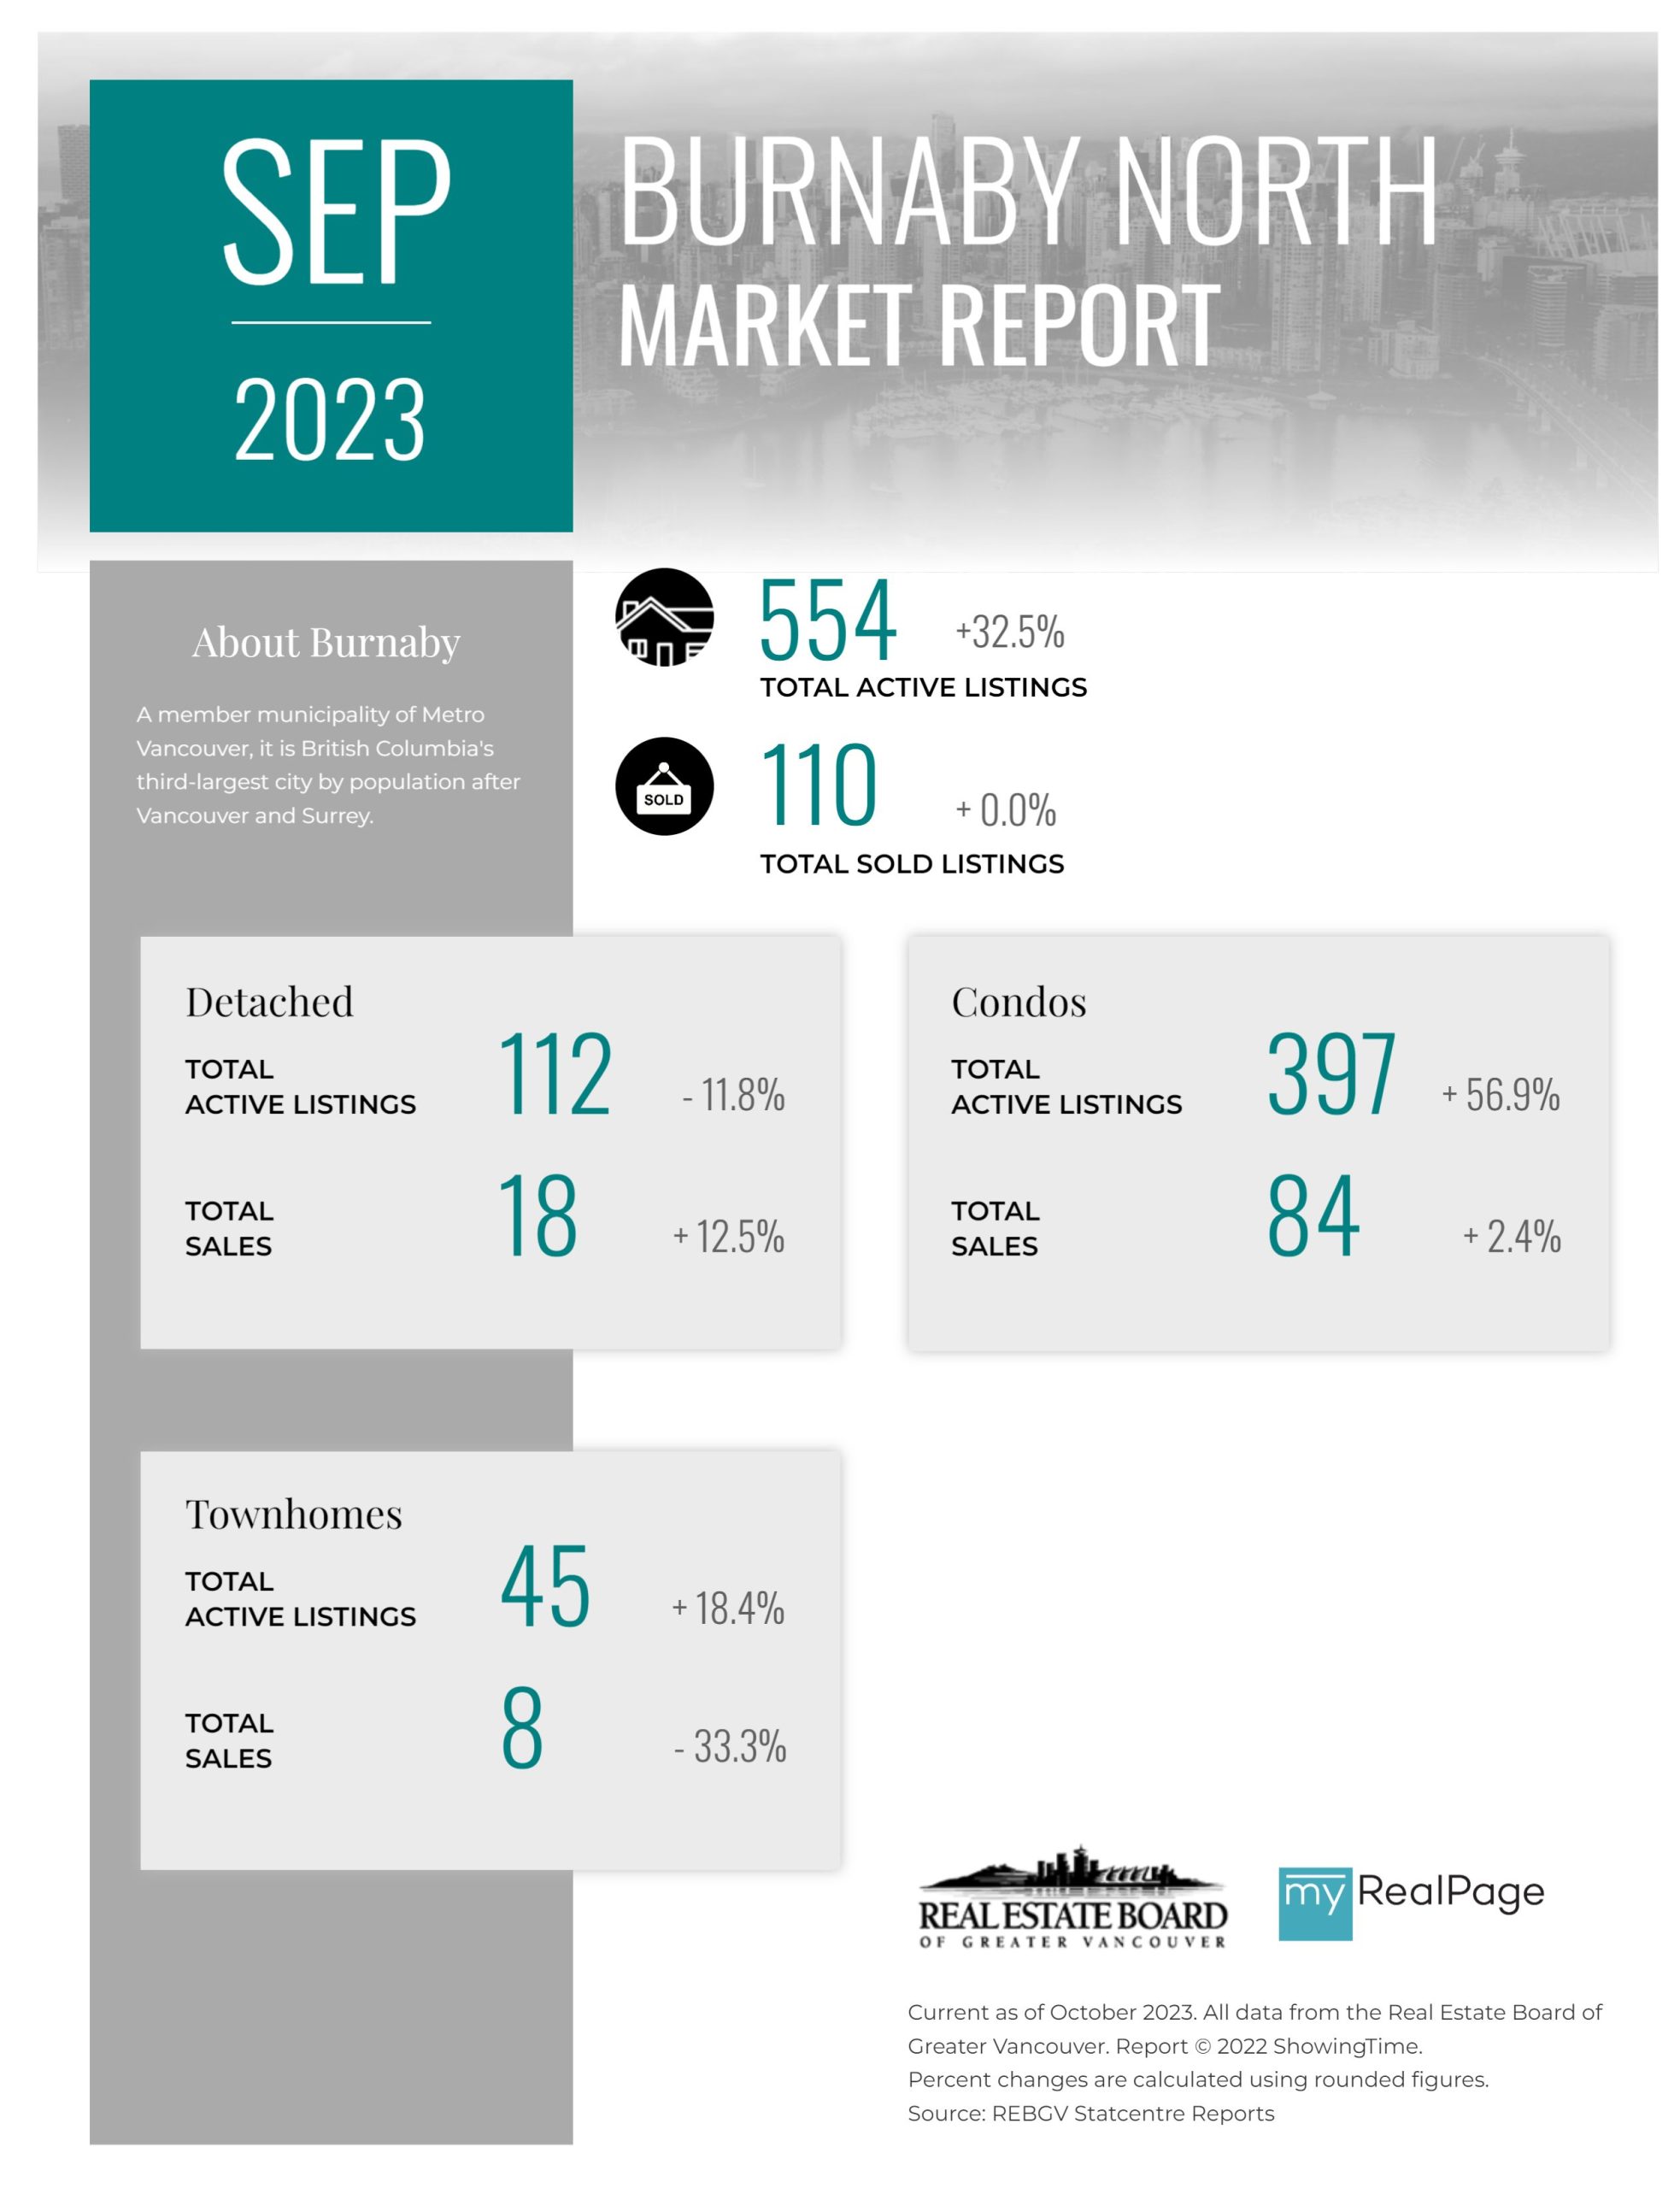
Printable Version – REBGV September 2023 Data Infographic Report Burnaby North
Printable Version – REBGV September 2023 Data Infographics Report Burnaby South
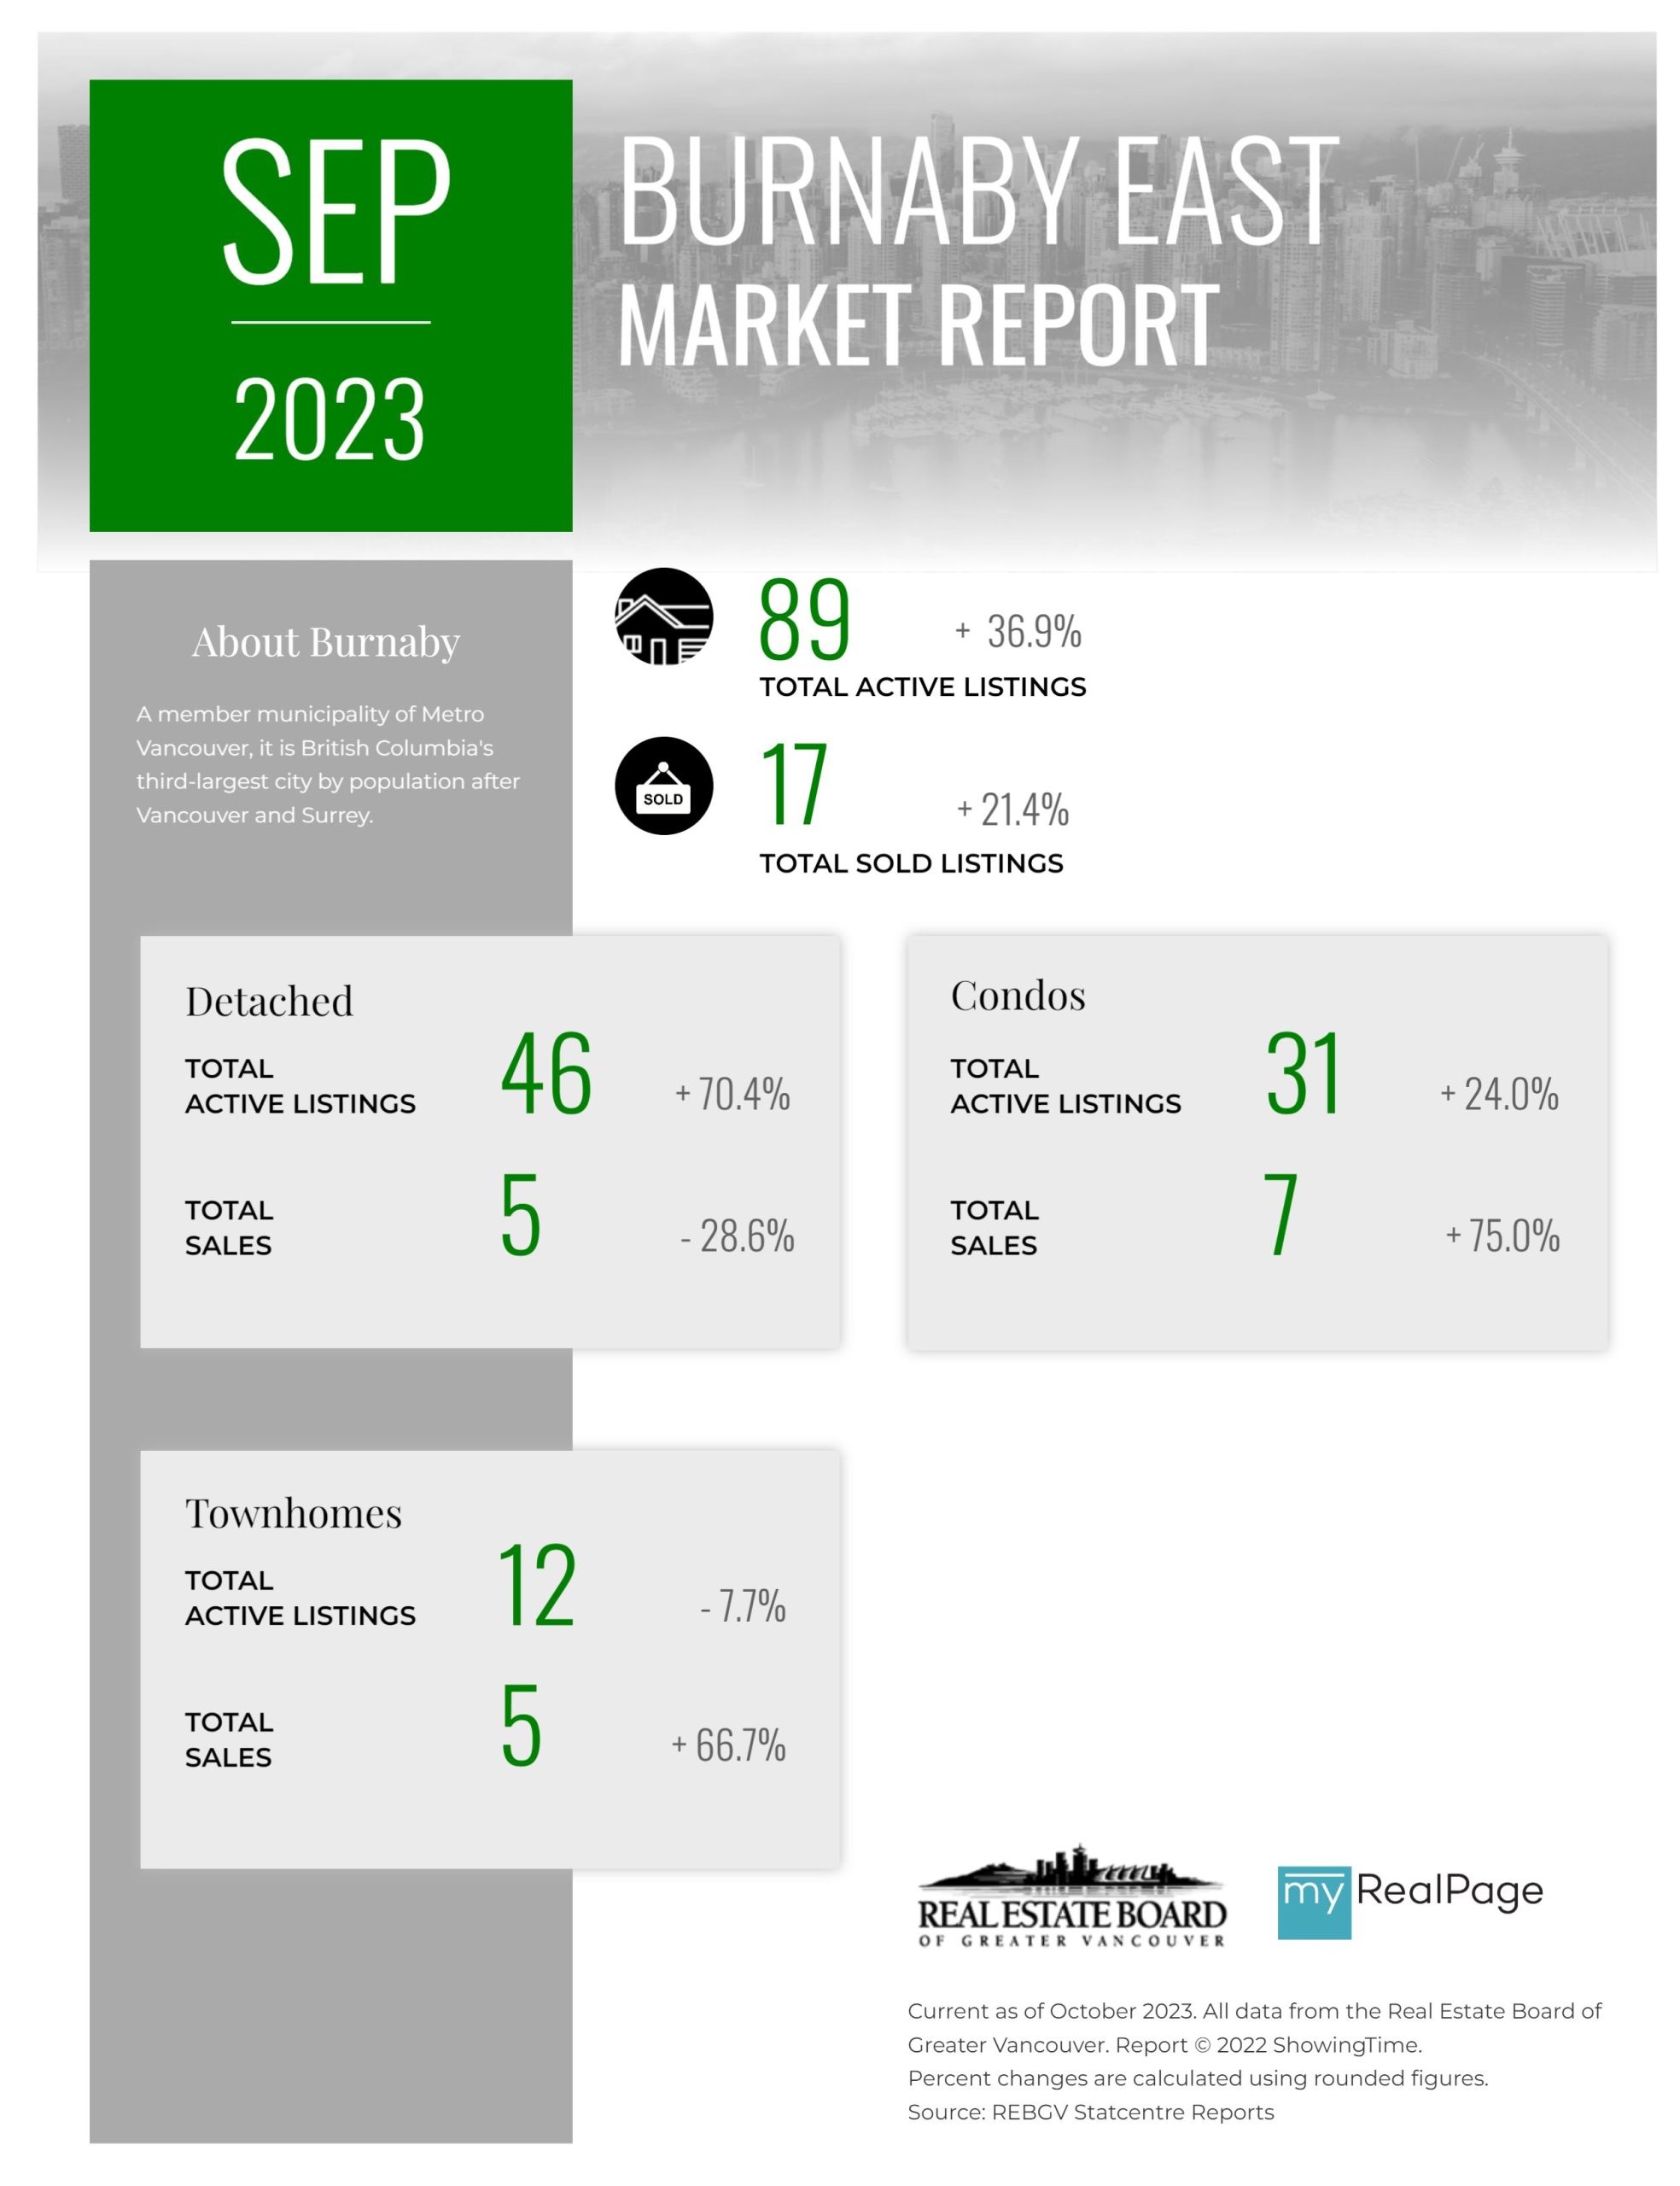
Printable Version – REBGV September 2023 Data Infographics Report Burnaby East
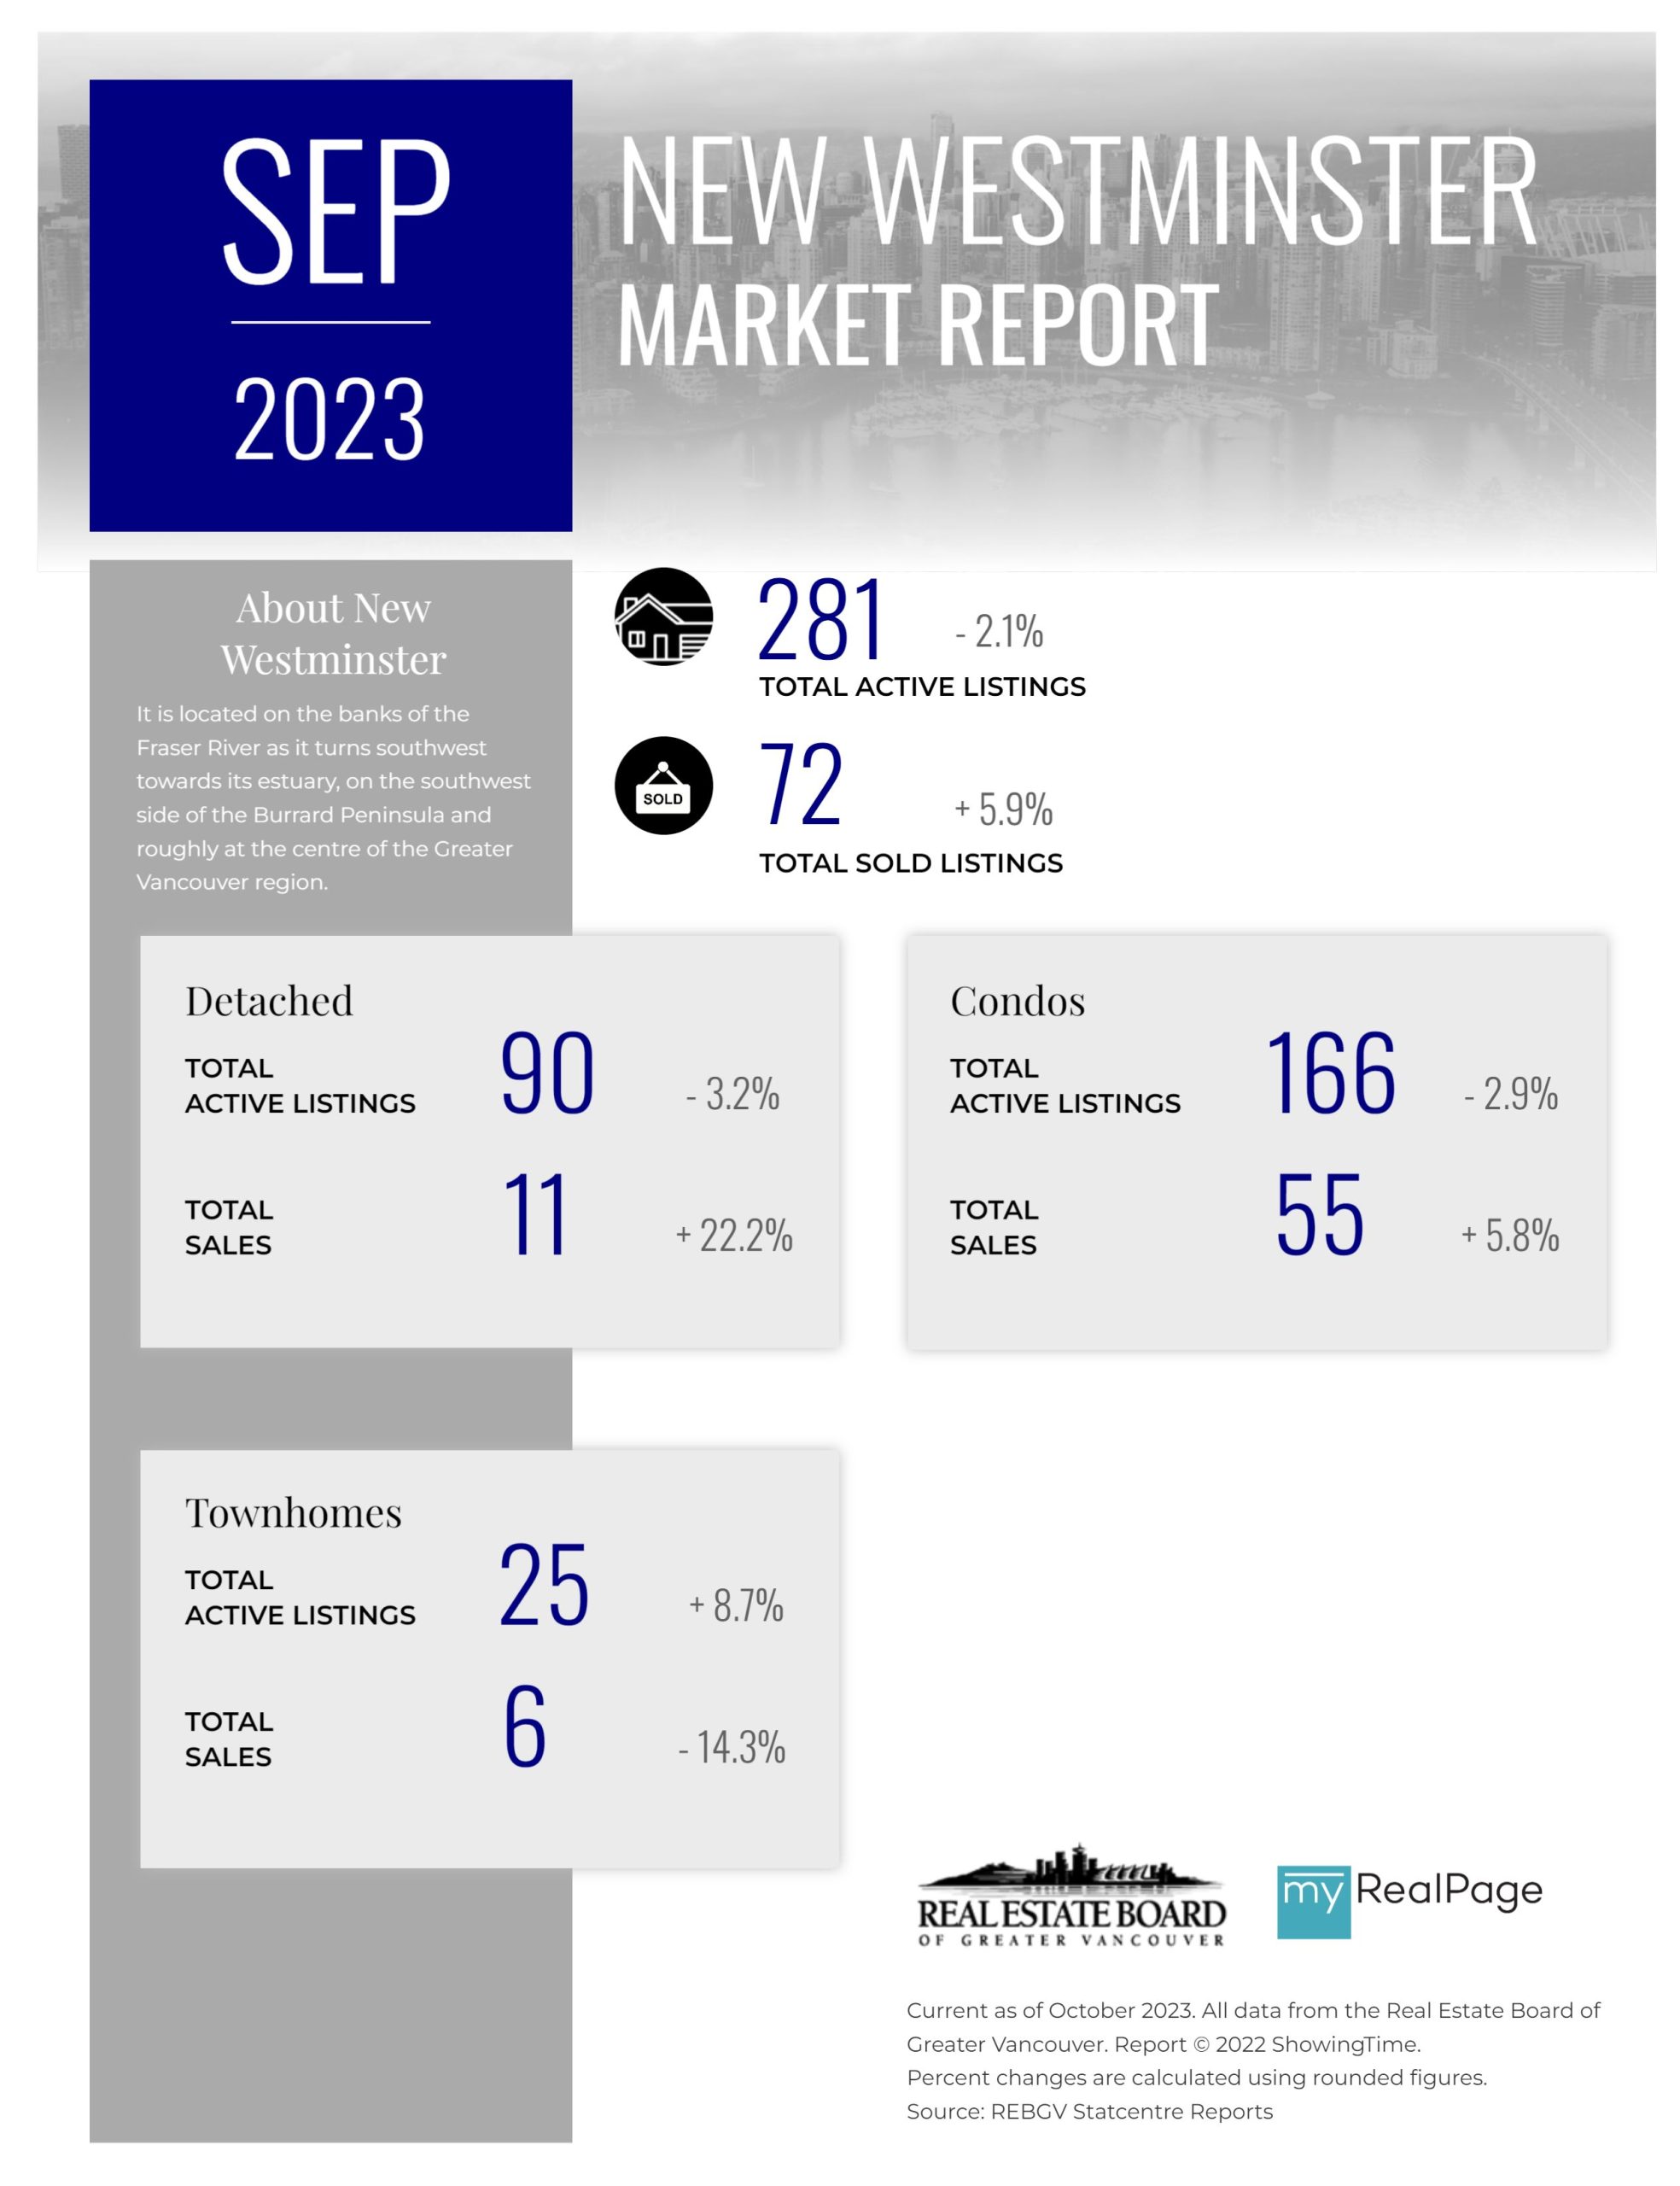
Printable Version – REBGV September 2023 Data Infographics Report New Westminster
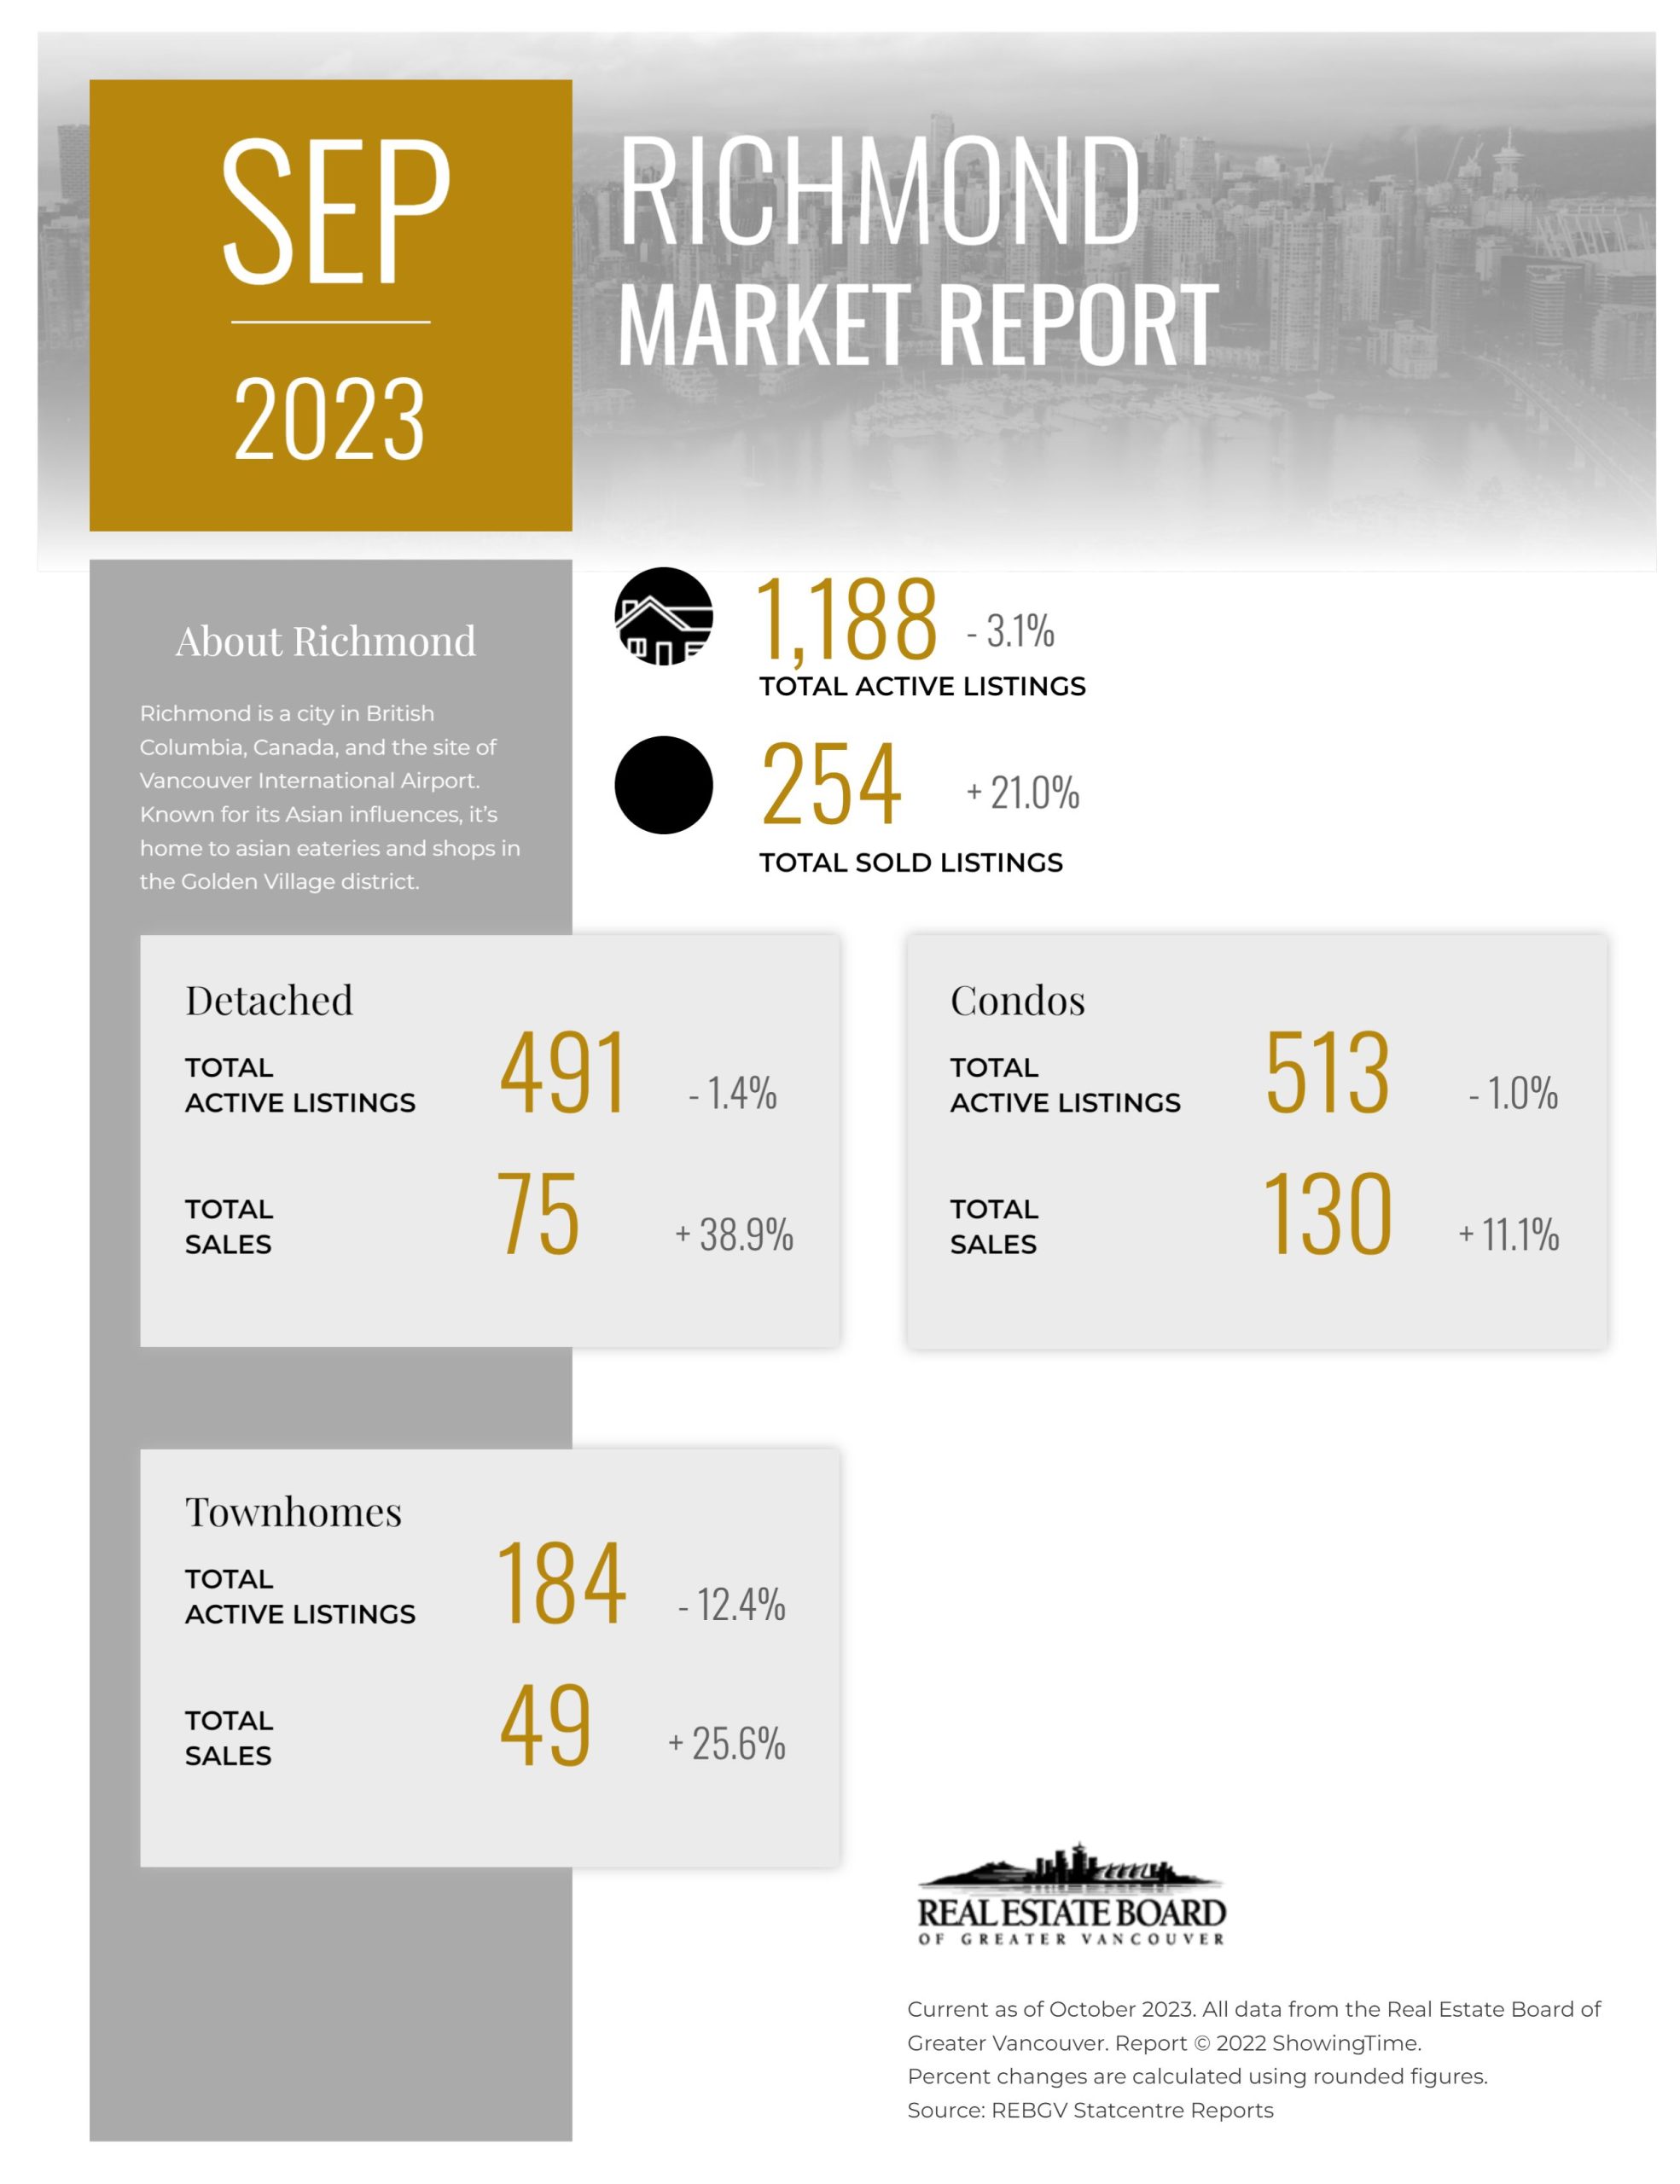
Printable Version – REBGV September 2023 Data Infographics Report Richmond


Last Updated on October 7, 2023 by myRealPage
