INFOGRAPHICS: June 2024 GVR Greater Vancouver Market Reports

Market shifting in buyers’ favour, though hesitation remains
Metro Vancouver home sales registered on the MLS® remained below seasonal and historical averages in June. With reduced competition among buyers, inventory has continued to accumulate to levels not seen since the spring of 2019.
The Greater Vancouver REALTORS® (GVR) reports that residential sales in the region totalled 2,418 in June 2024, a 19.1 per cent decrease from the 2,988 sales recorded in June 2023. This was 23.6 per cent below the 10-year seasonal average (3,166).
“The June data continued a trend we’ve been watching where buyers appear hesitant to transact in volumes we consider typical for this time of year, while sellers remain keen to bring their properties to market.” Andrew Lis, GVR director of economics and data analytics
Read the full report on the REBGV website!
The following data is a comparison between June 2024 and June 2023 numbers, and is current as of July 2024. For last month’s update, you can check out our previous post!
Or follow this link for all our GVR Infographics!
These infographics cover current trends in several areas within the Greater Vancouver region. Click on the images for a larger view!
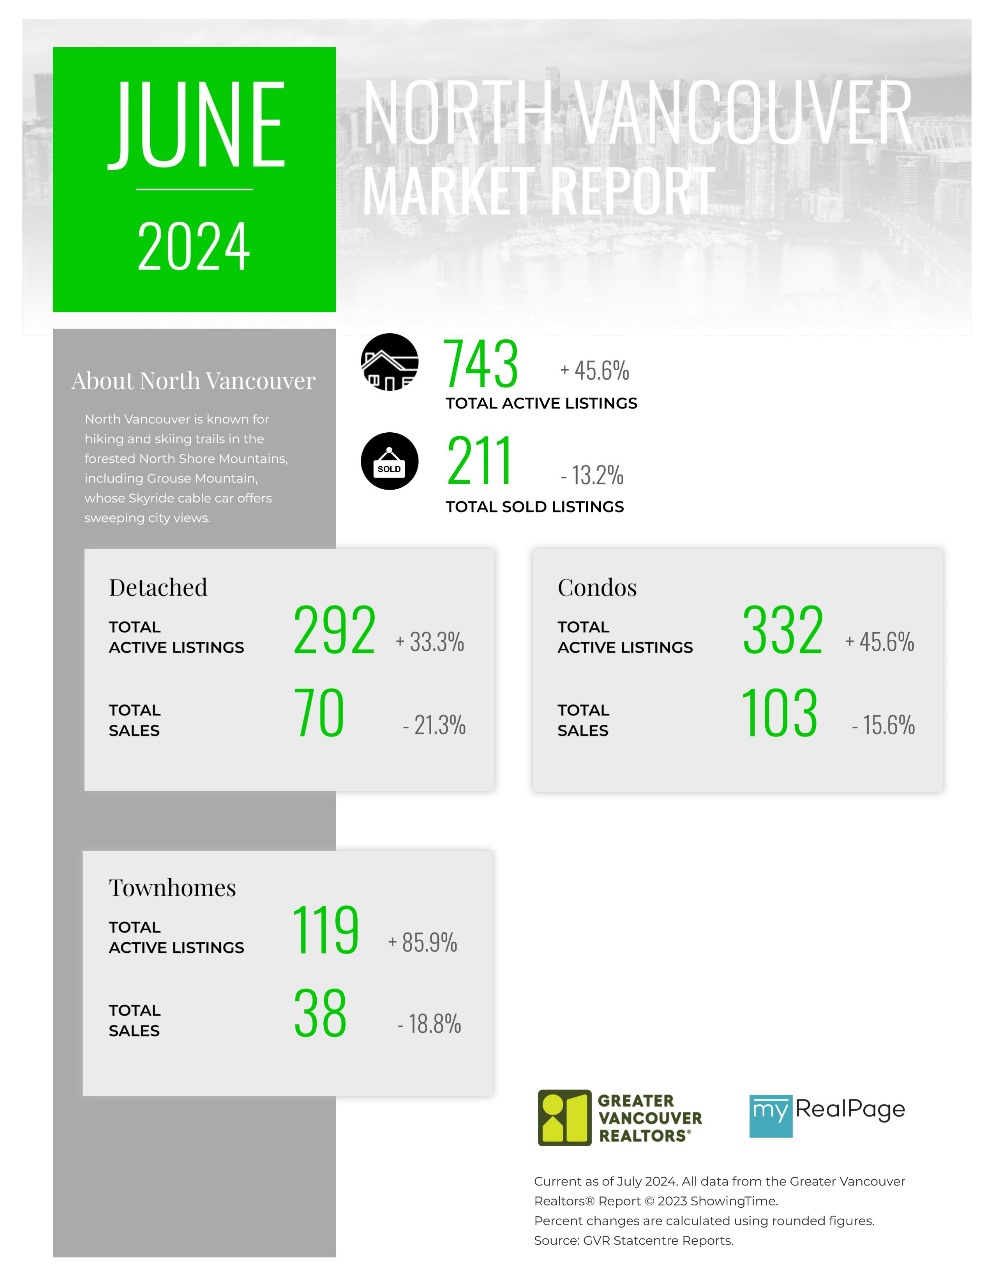
Printable Version – GVR June 2024 Data Infographic Report North Vancouver
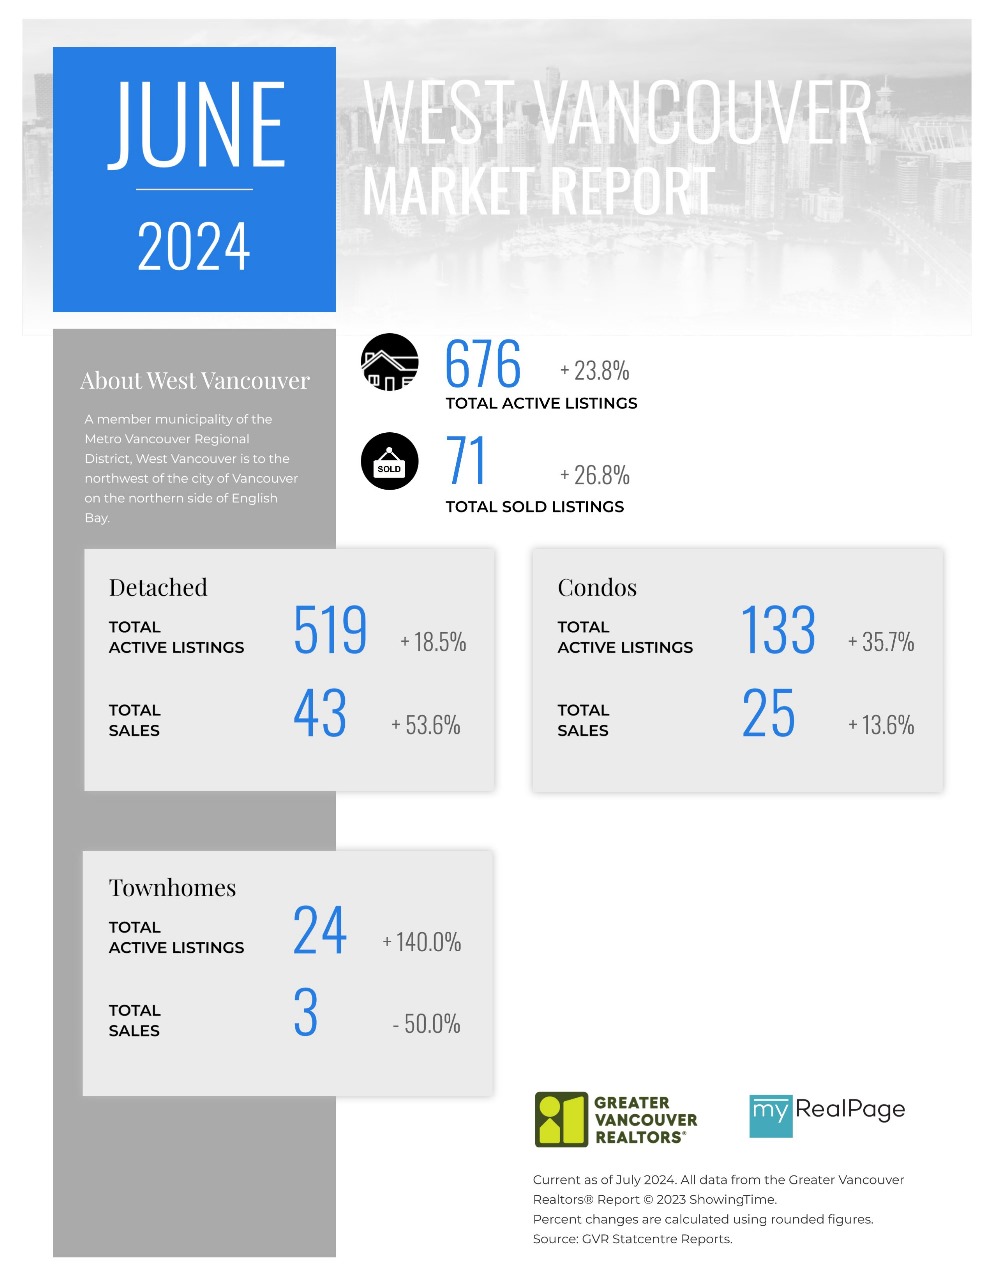
Printable Version – GVR June 2024 Data Infographics Report West Vancouver
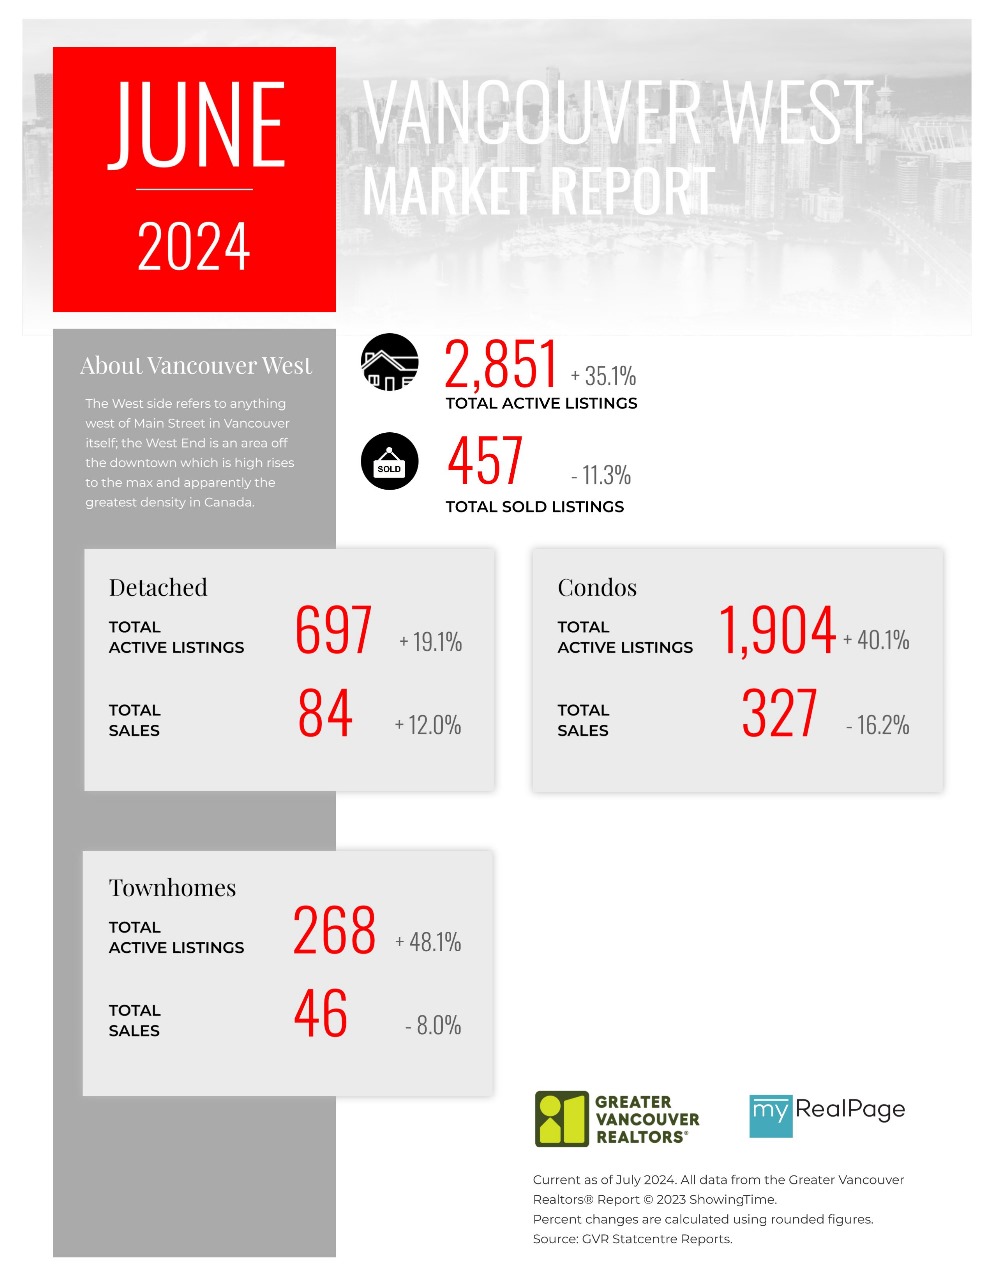
Printable Version – GVR June 2024 Data Infographics Report Vancouver West
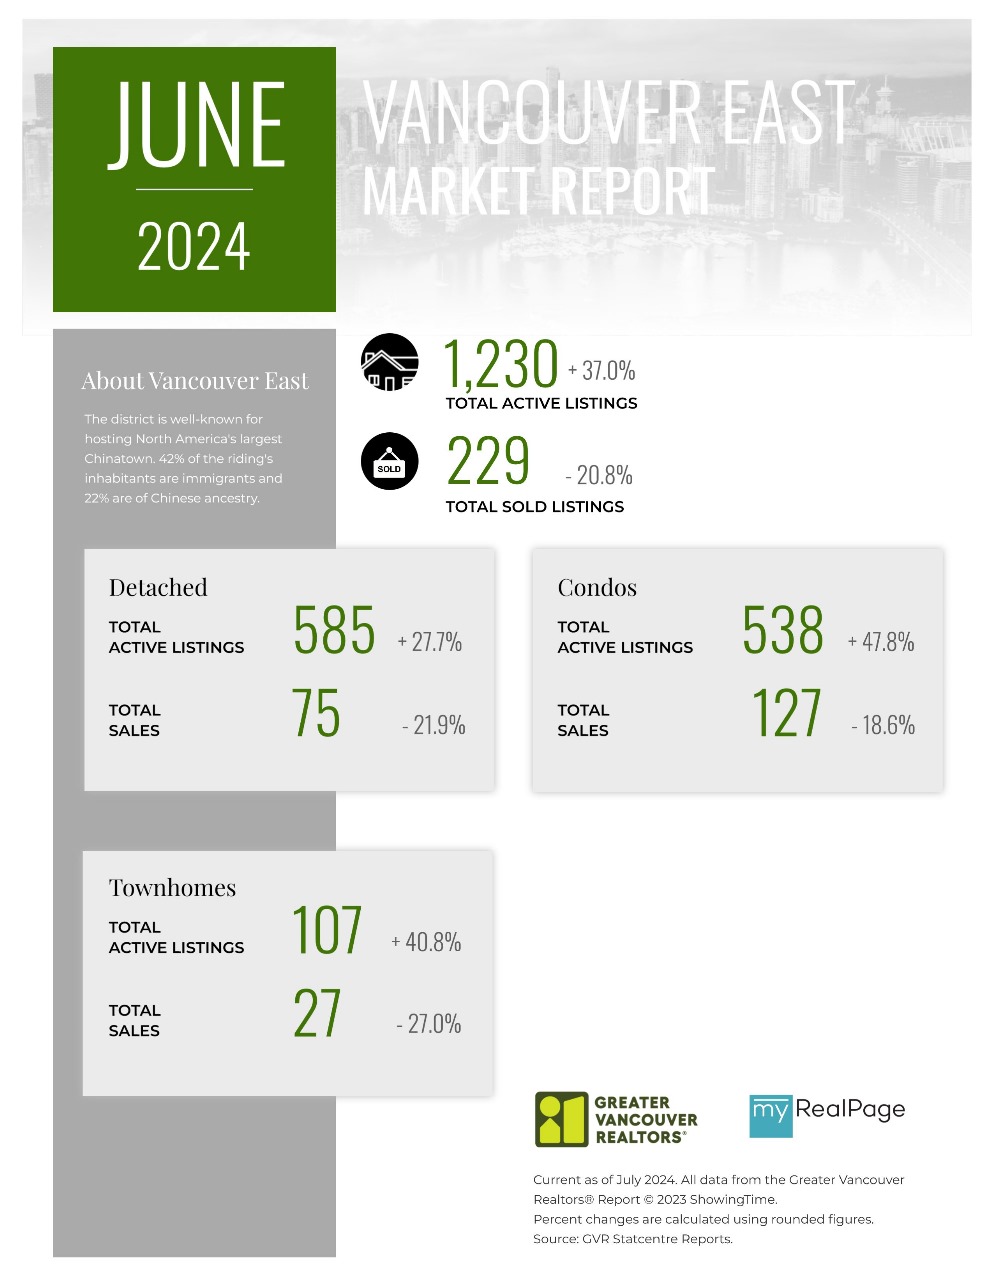
Printable Version – GVR June 2024 Data Infographics Report Vancouver East
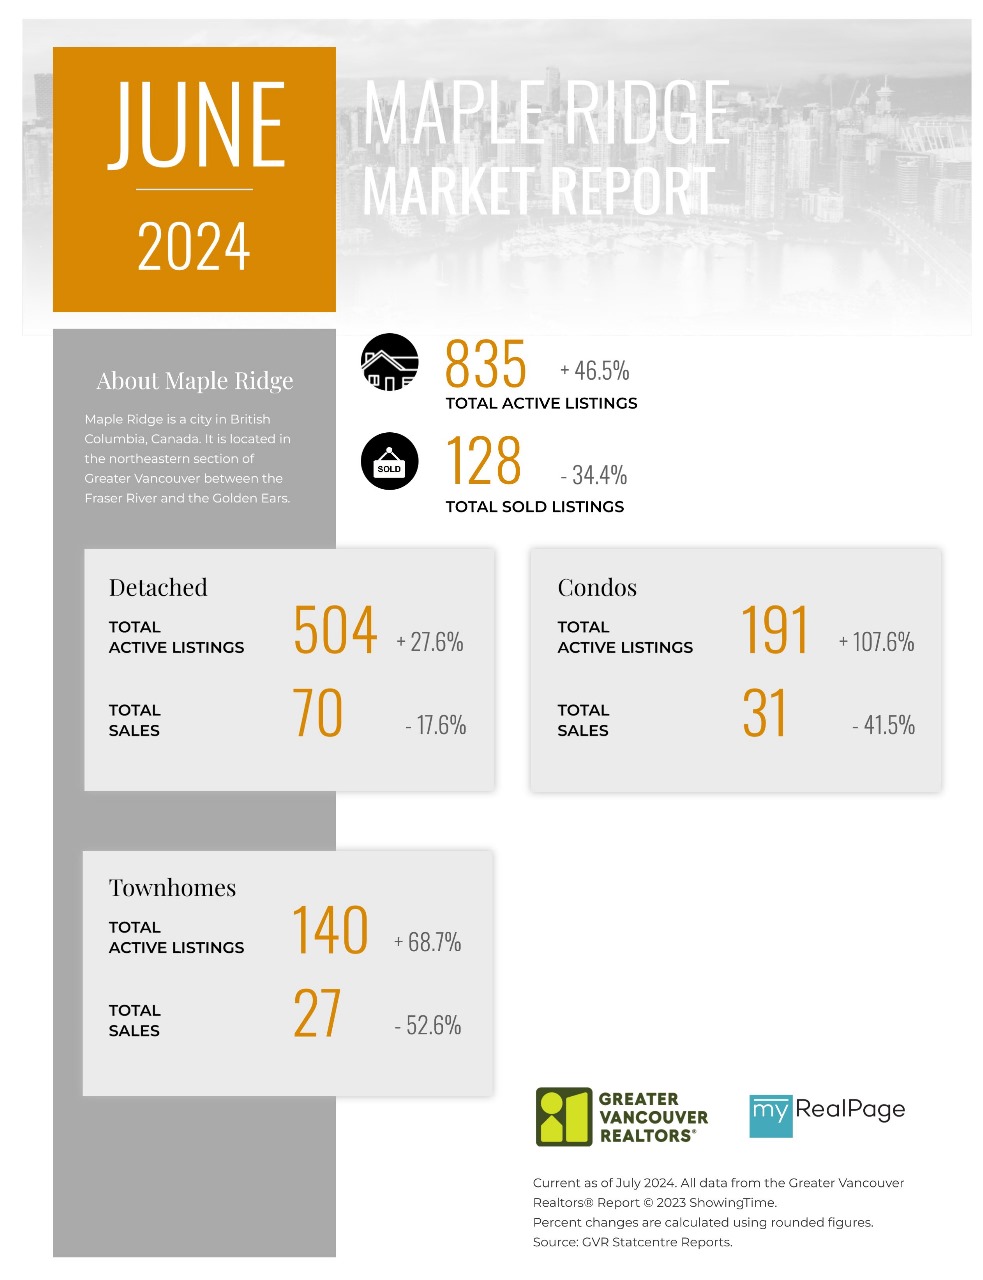
Printable Version – GVR June 2024 Data Infographic Report Maple Ridge
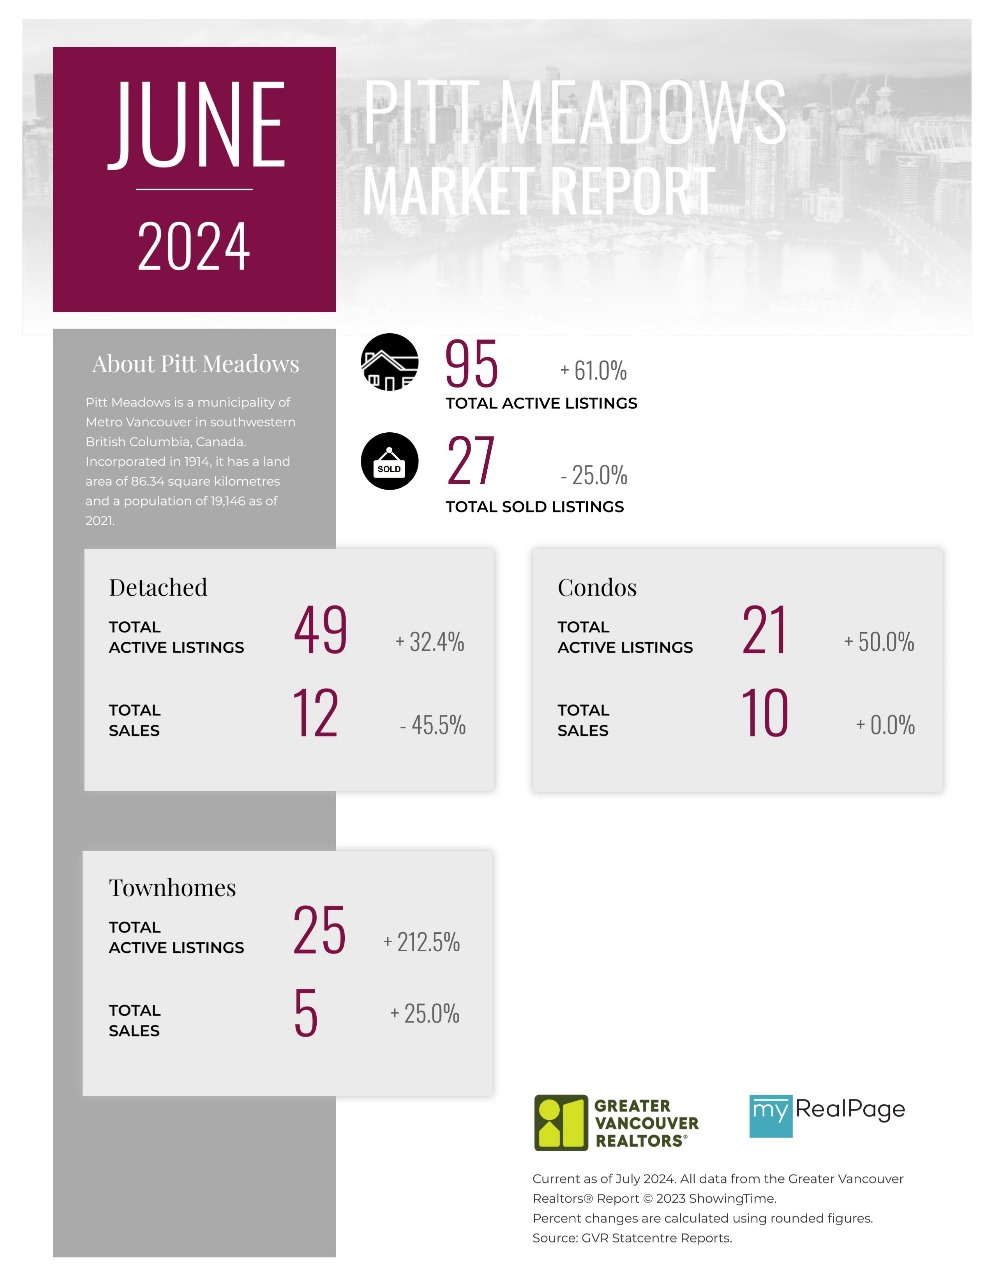
Printable Version – GVR June 2024 Data Infographics Report Pitt Meadows
Printable Version – GVR June 2024 Data Infographics Report Port Coquitlam
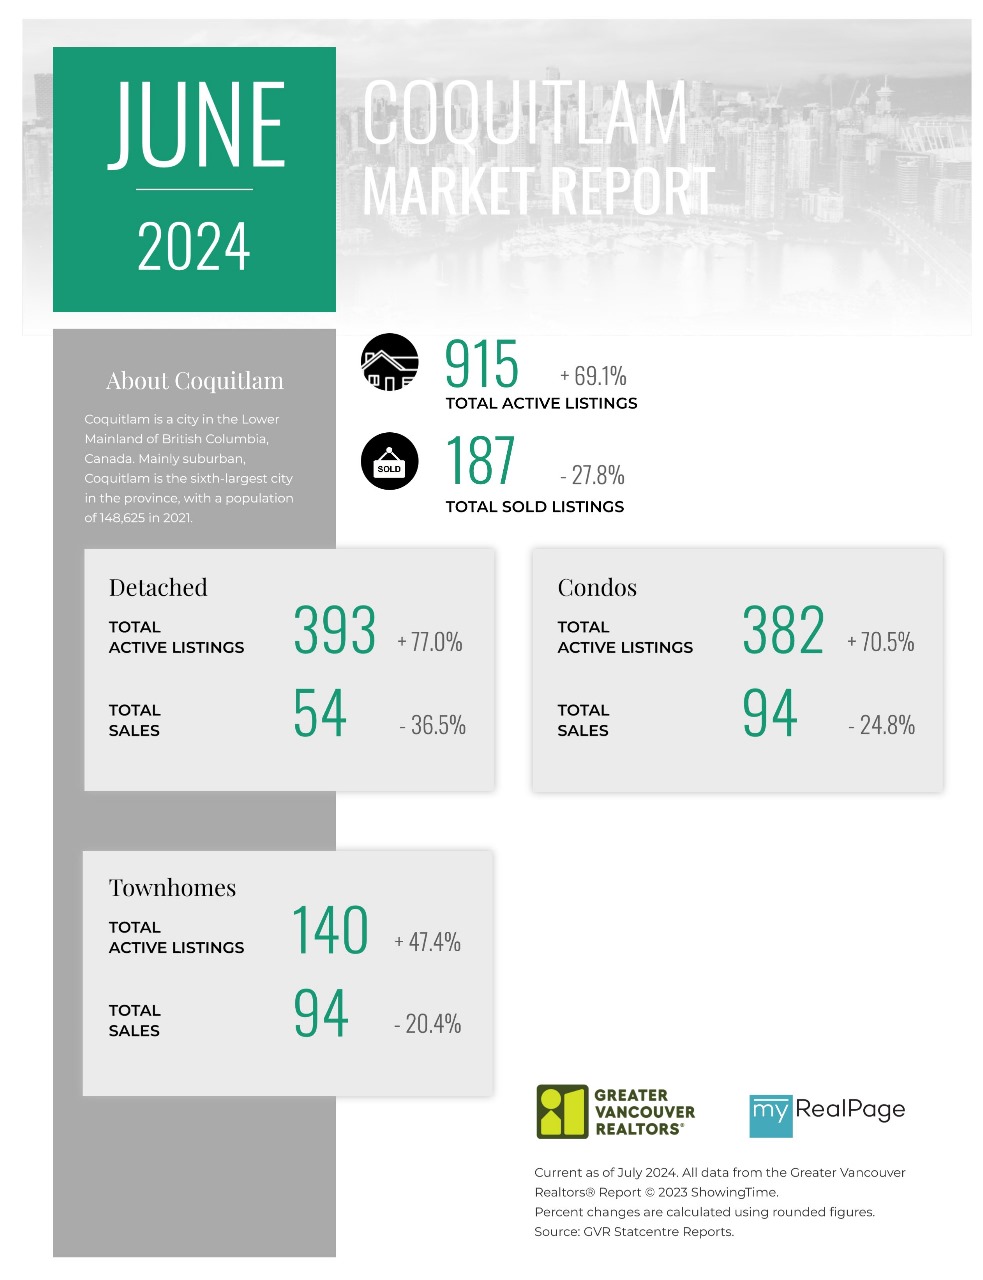
Printable Version – GVR June 2024 Data Infographics Report Coquitlam
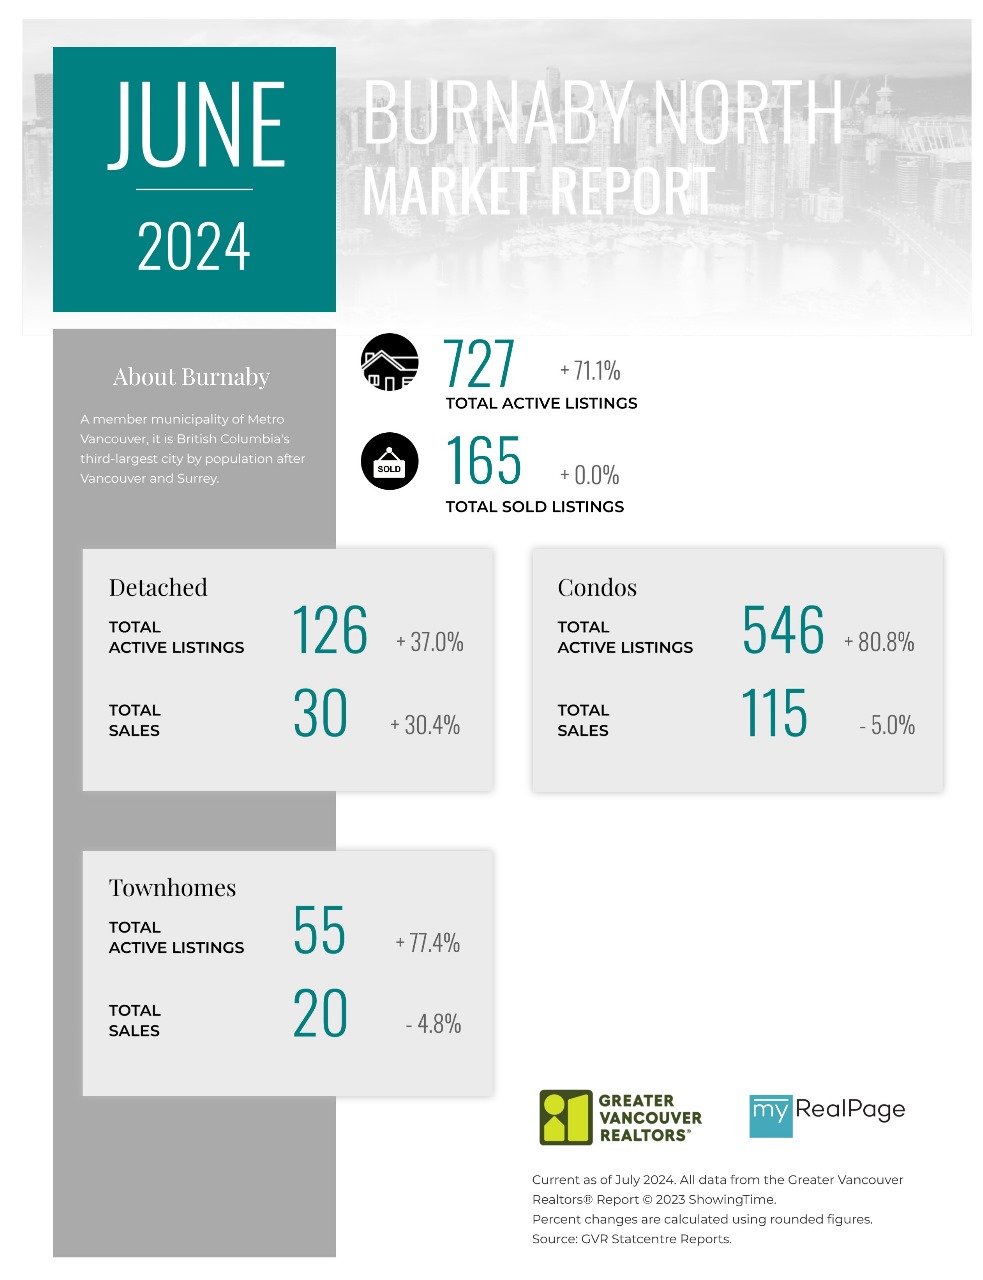
Printable Version – GVR June 2024 Data Infographic Report Burnaby North
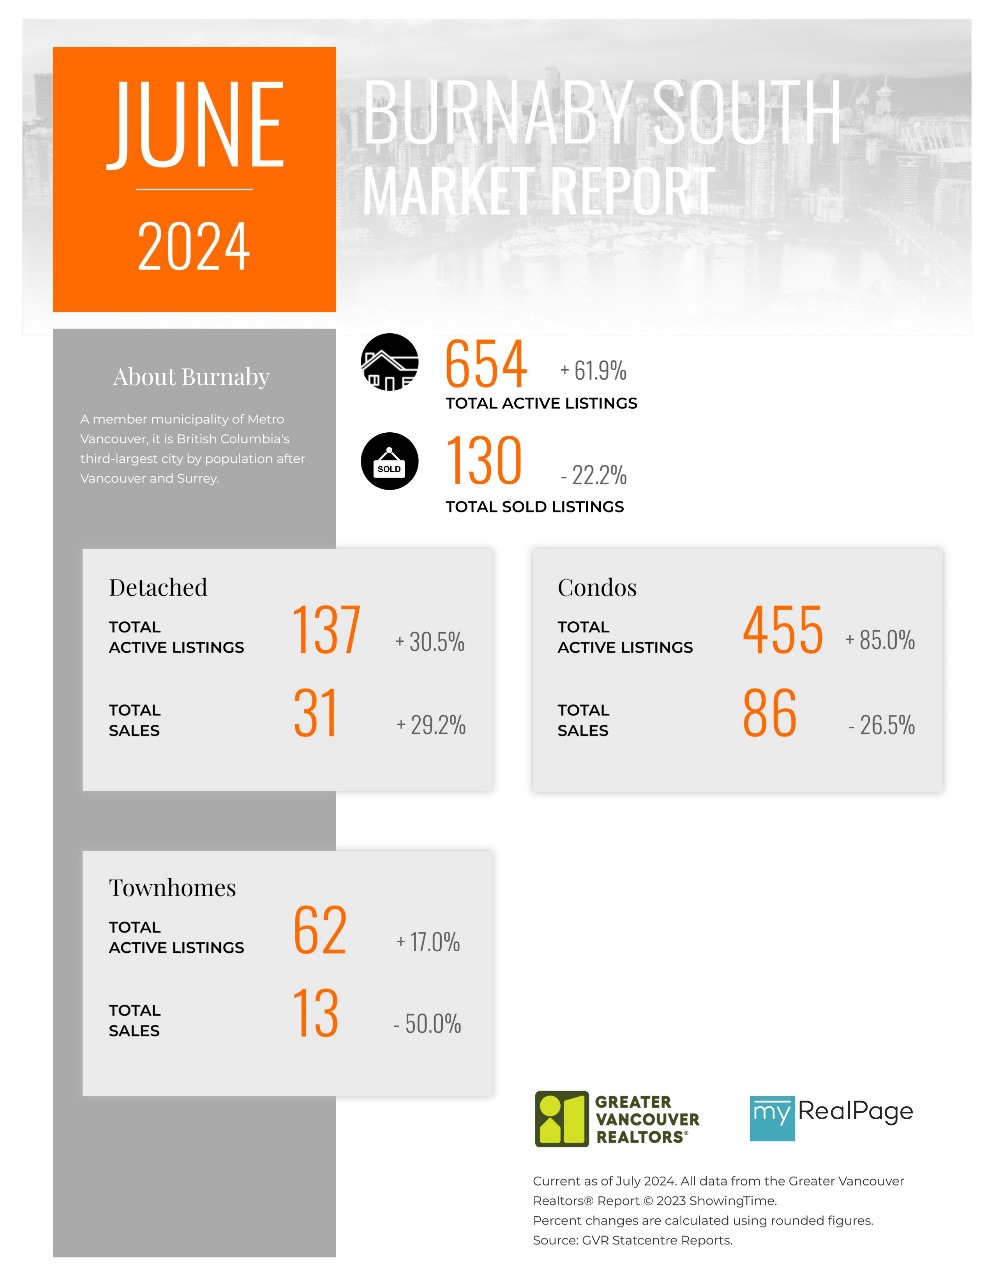
Printable Version – GVR June 2024 Data Infographics Report Burnaby South
Printable Version – GVR June 2024 Data Infographics Report Burnaby East
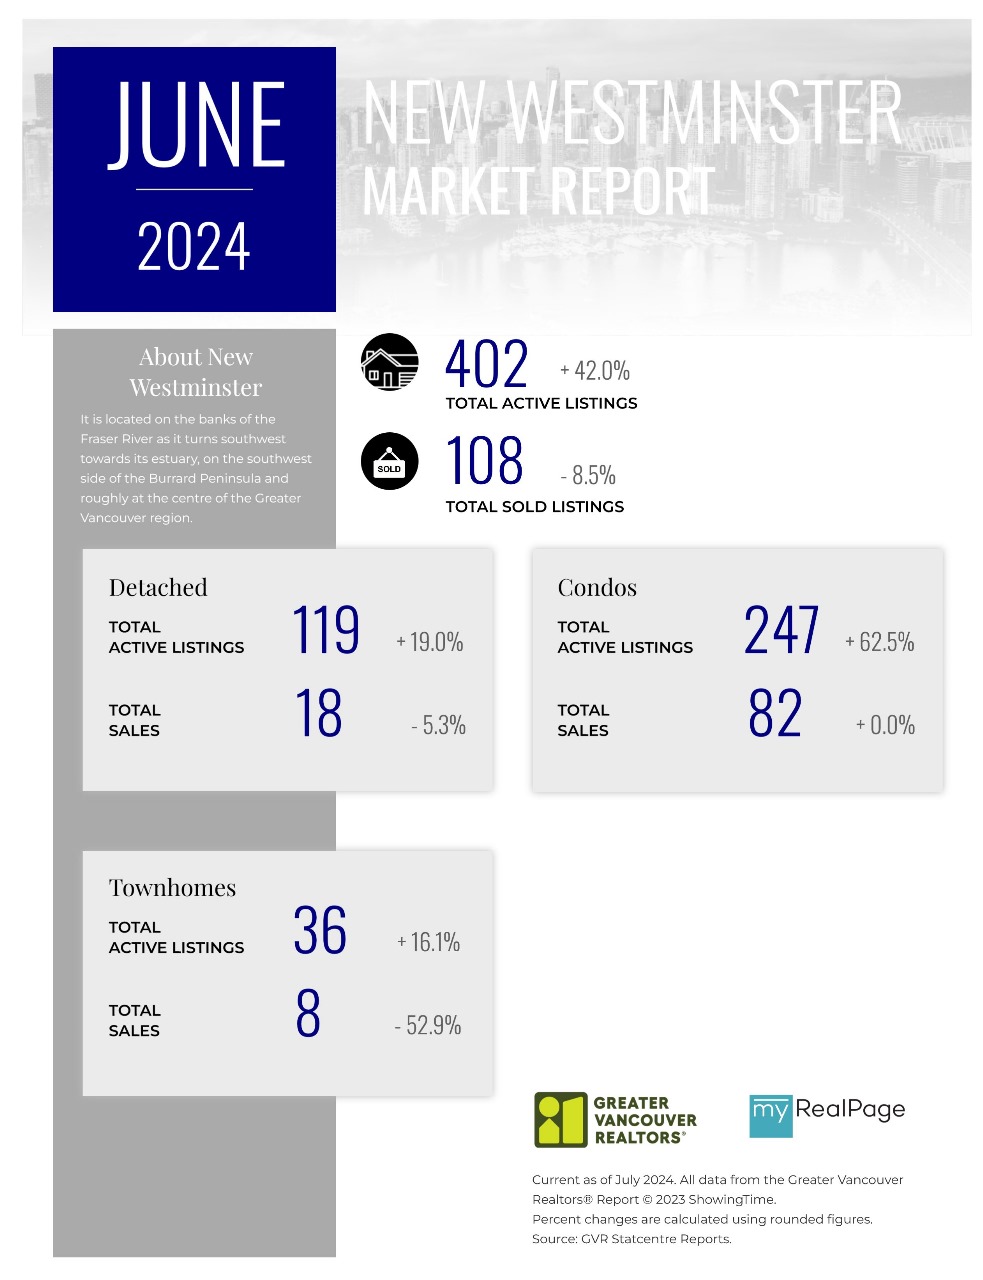
Printable Version – GVR June 2024 Data Infographics Report New Westminster
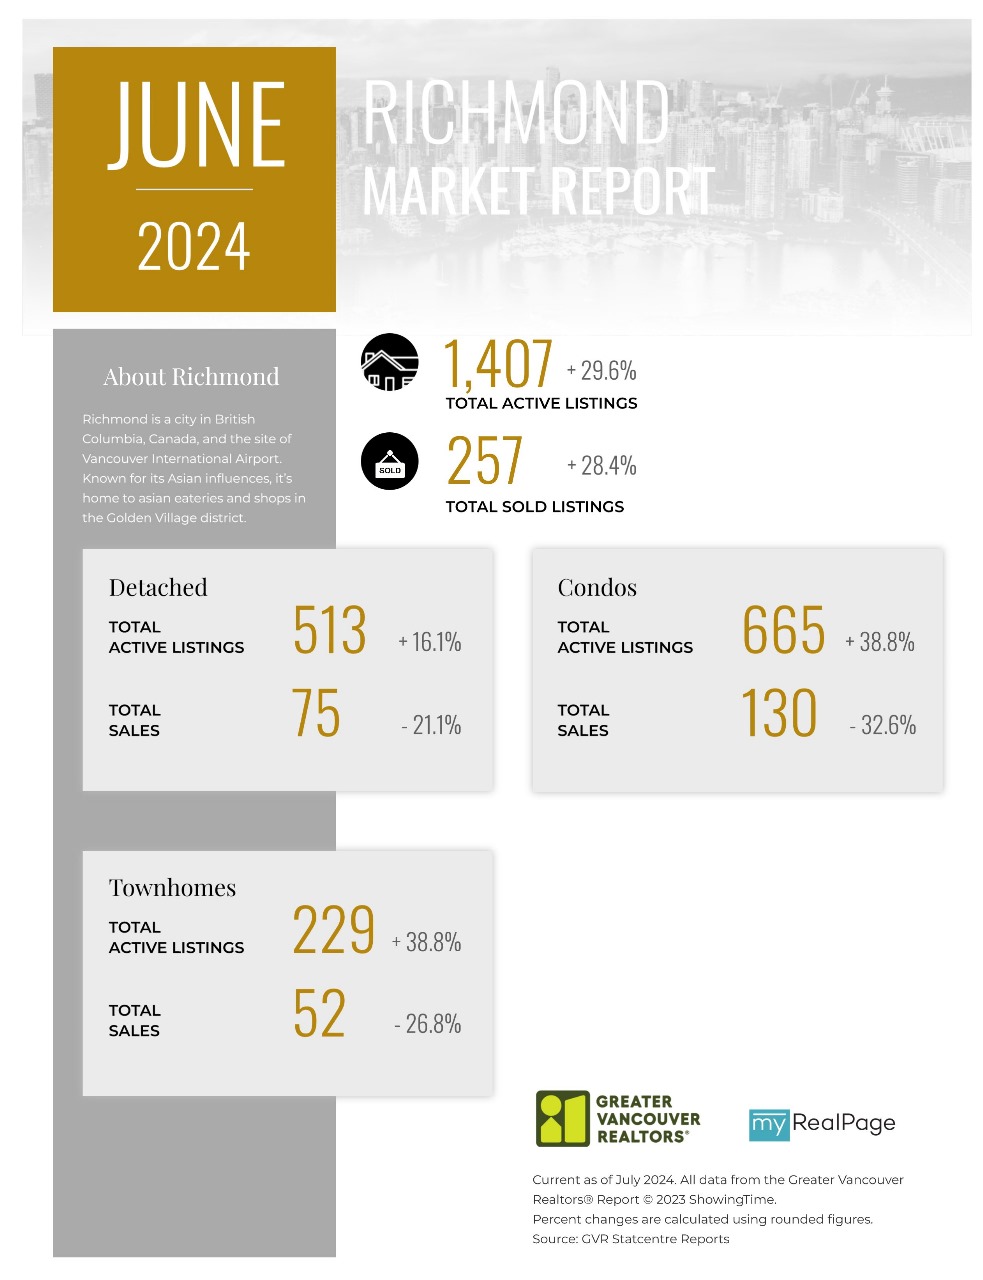
Printable Version – GVR June 2024 Data Infographics Report Richmond
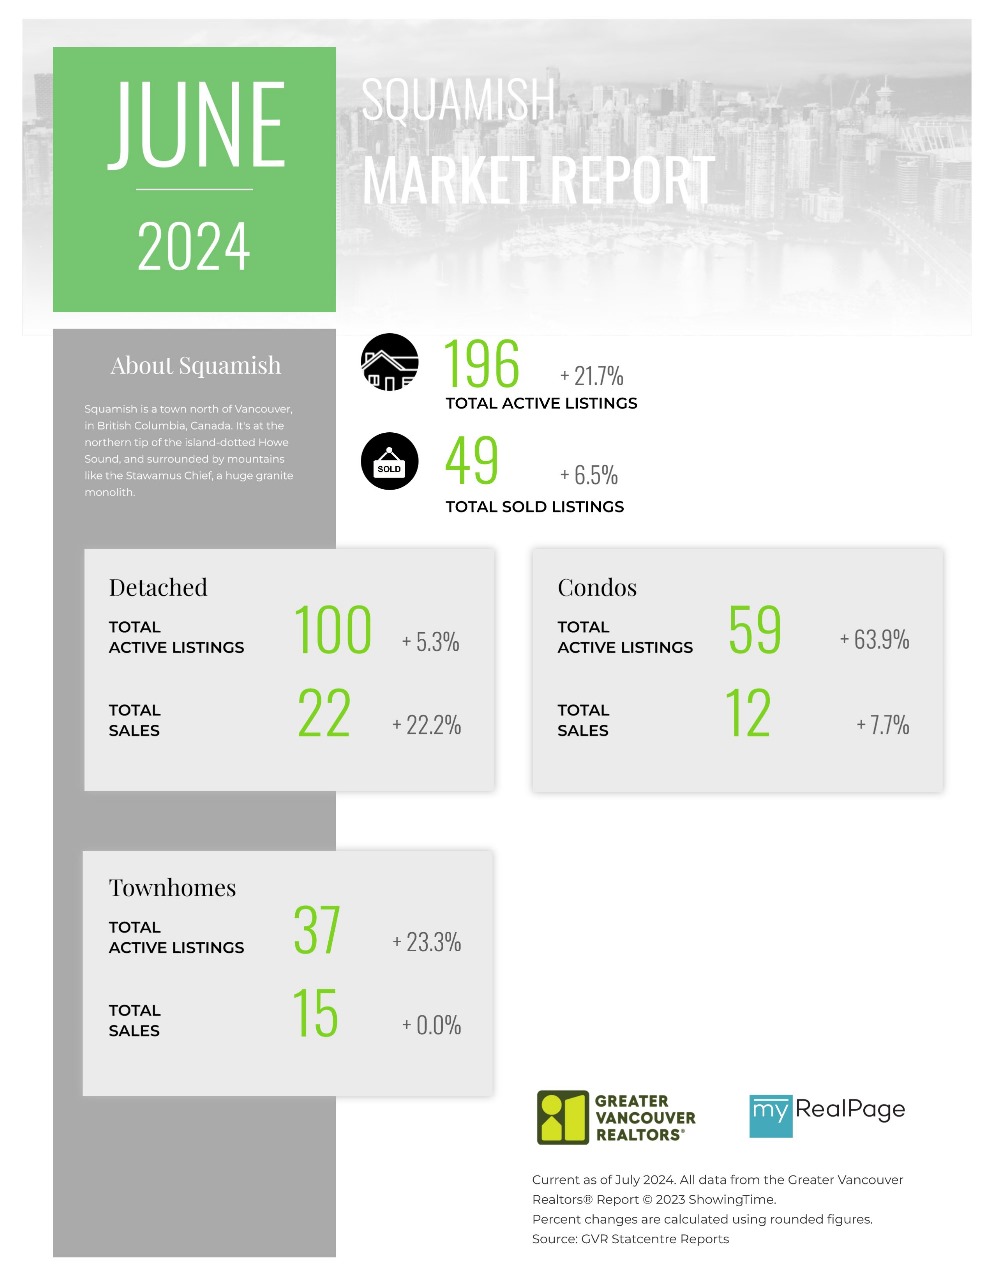
Printable Version – GVR June 2024 Data Infographics Report Squamish


Last Updated on August 5, 2024 by myRealPage
