INFOGRAPHICS: September 2024 GVR Greater Vancouver Market Reports

Buyers remain cautious to begin the fall market
Home sales registered on the MLS® in Metro Vancouver declined 3.8 per cent year over year in September, suggesting recent reductions in borrowing costs are having a limited effect in spurring demand so far.
Greater Vancouver REALTORS® (GVR) reports that residential sales in the region totalled 1,852 in September 2024, a 3.8 per cent decrease from the 1,926 sales recorded in September 2023. This was 26 per cent below the 10-year seasonal average (2,502).
“Real estate watchers have been monitoring the data for signs of renewed strength in demand in response to recent mortgage rate reductions, but the September figures don’t offer the signal that many are watching for.
Sales continue trending roughly 25 per cent below the ten-year seasonal average in the region, which, believe it or not, is a trend that has been in place for a few years now. With the September data, sales are now tracking slightly below our forecast however, but we remain optimistic sales will still end 2024 higher than 2023” Andrew Lis, GVR director of economics and data analytics
Read the full report on the REBGV website!
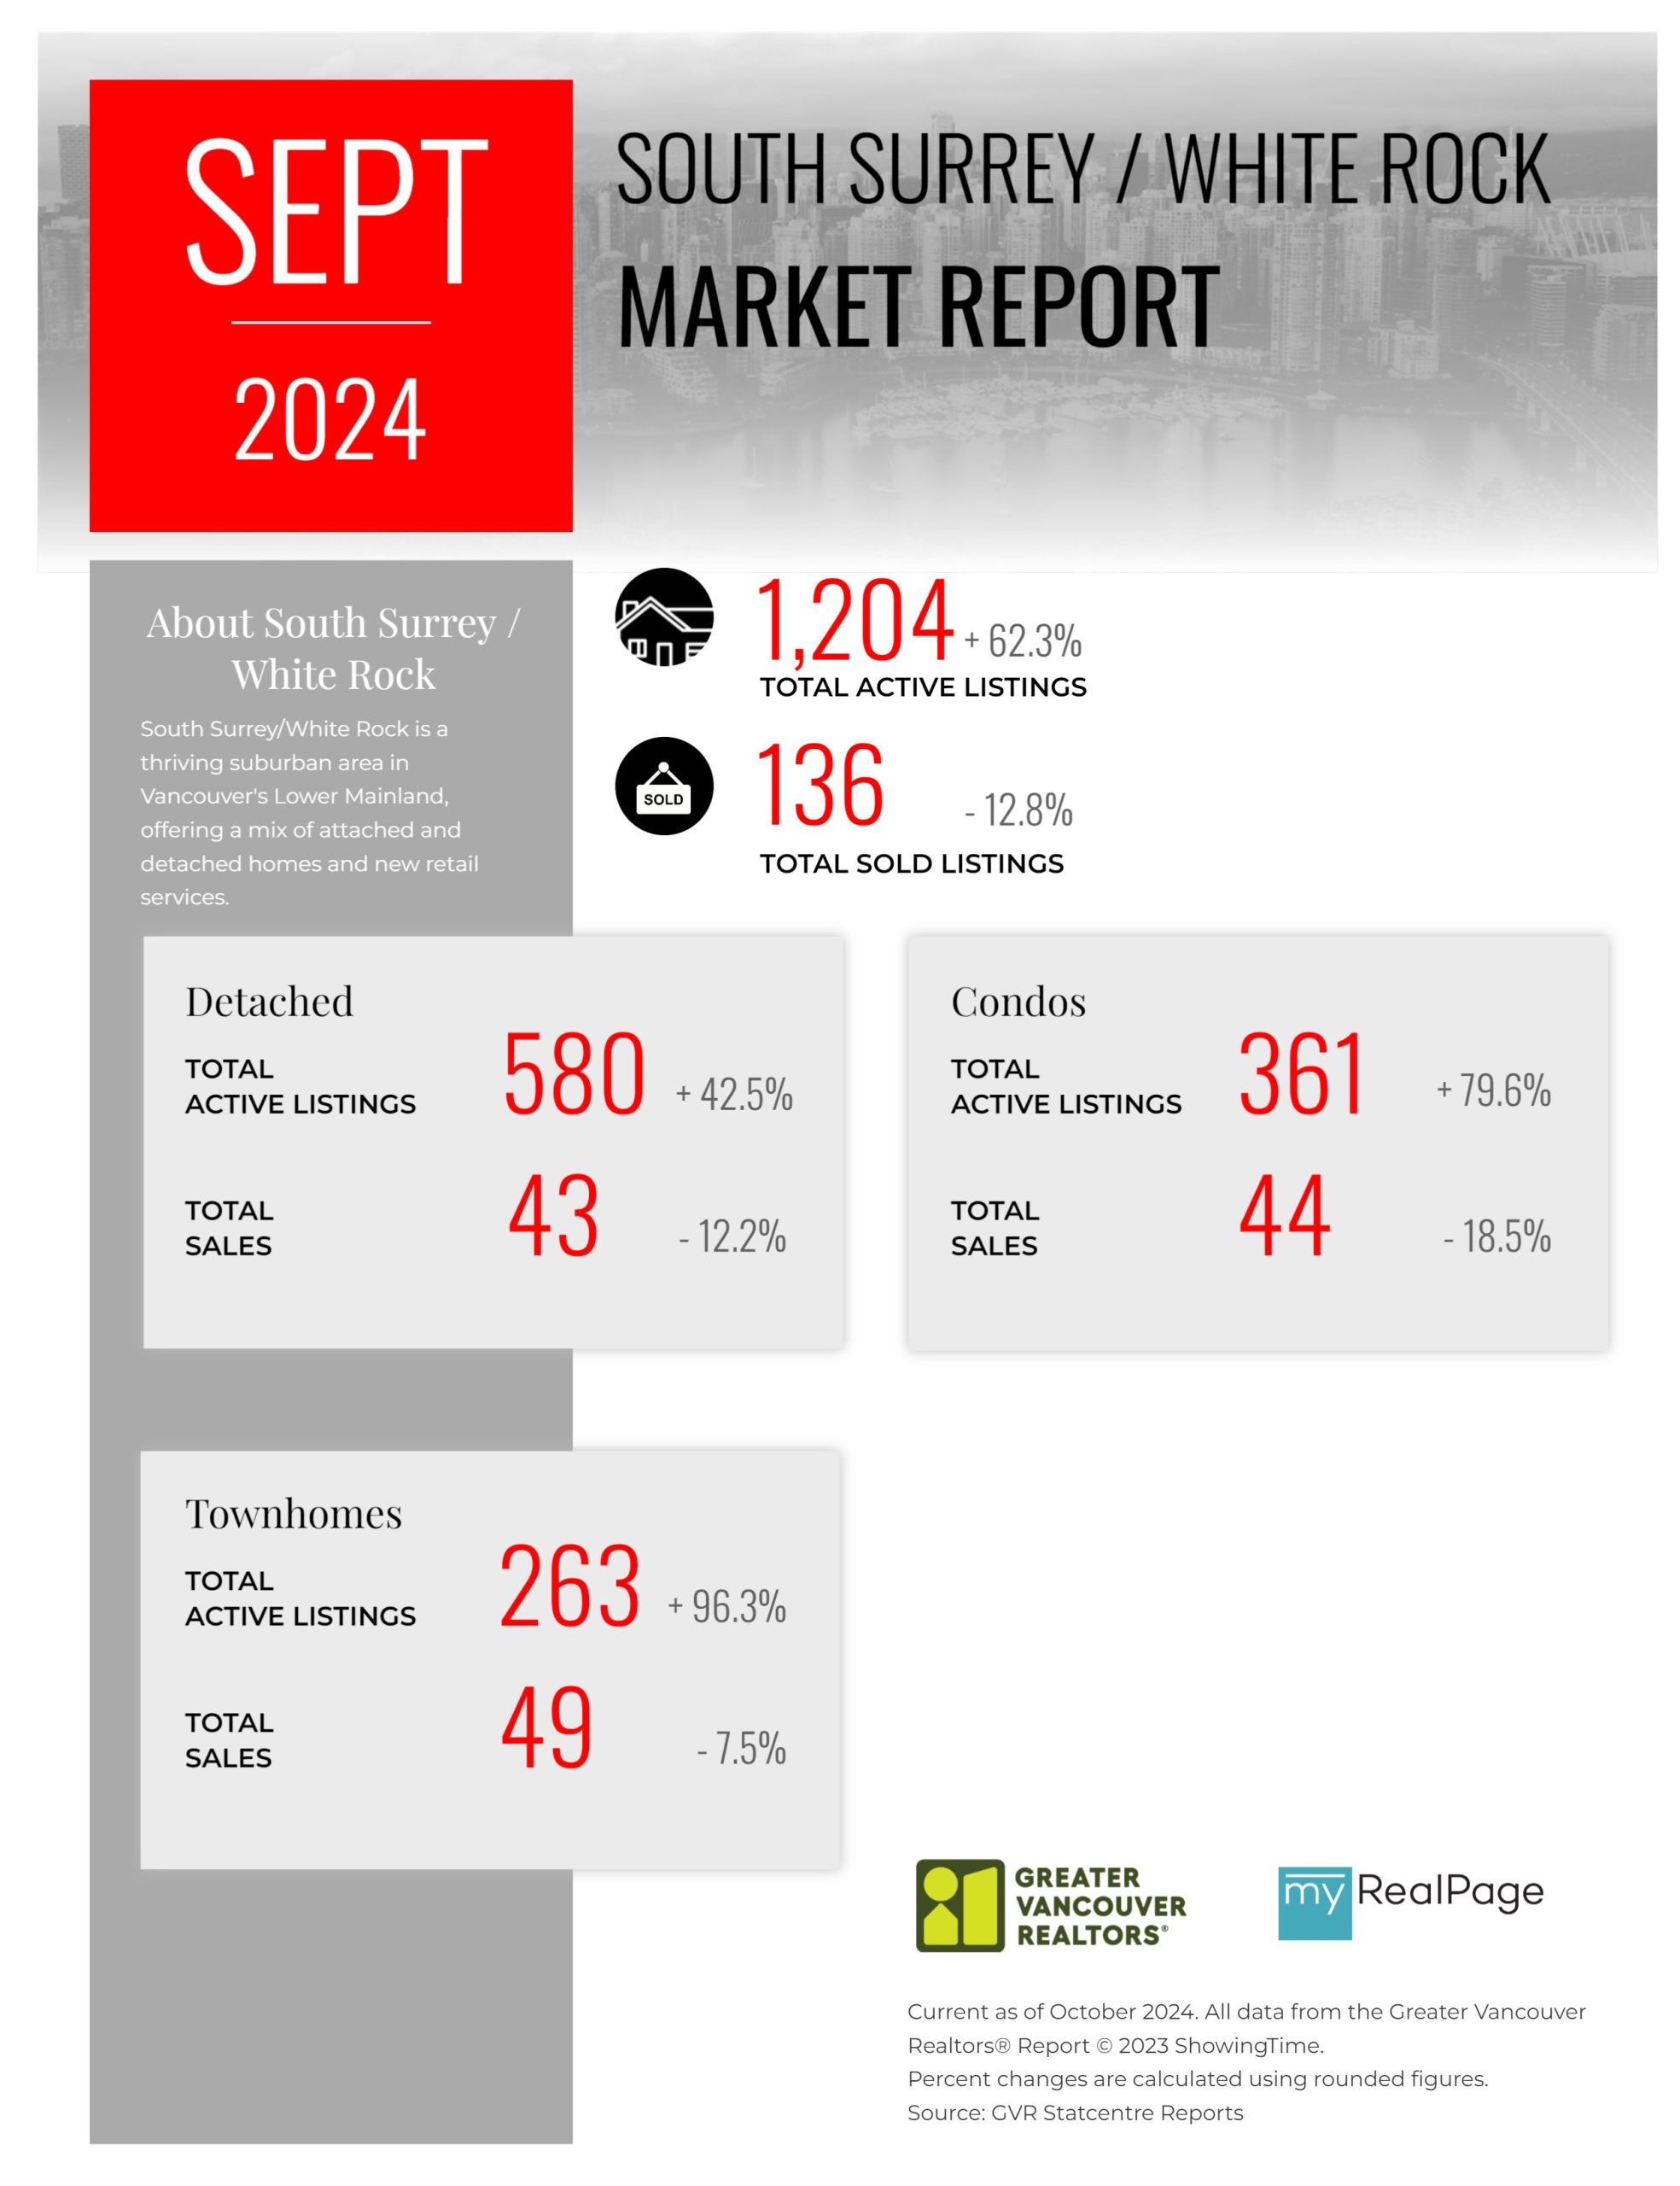
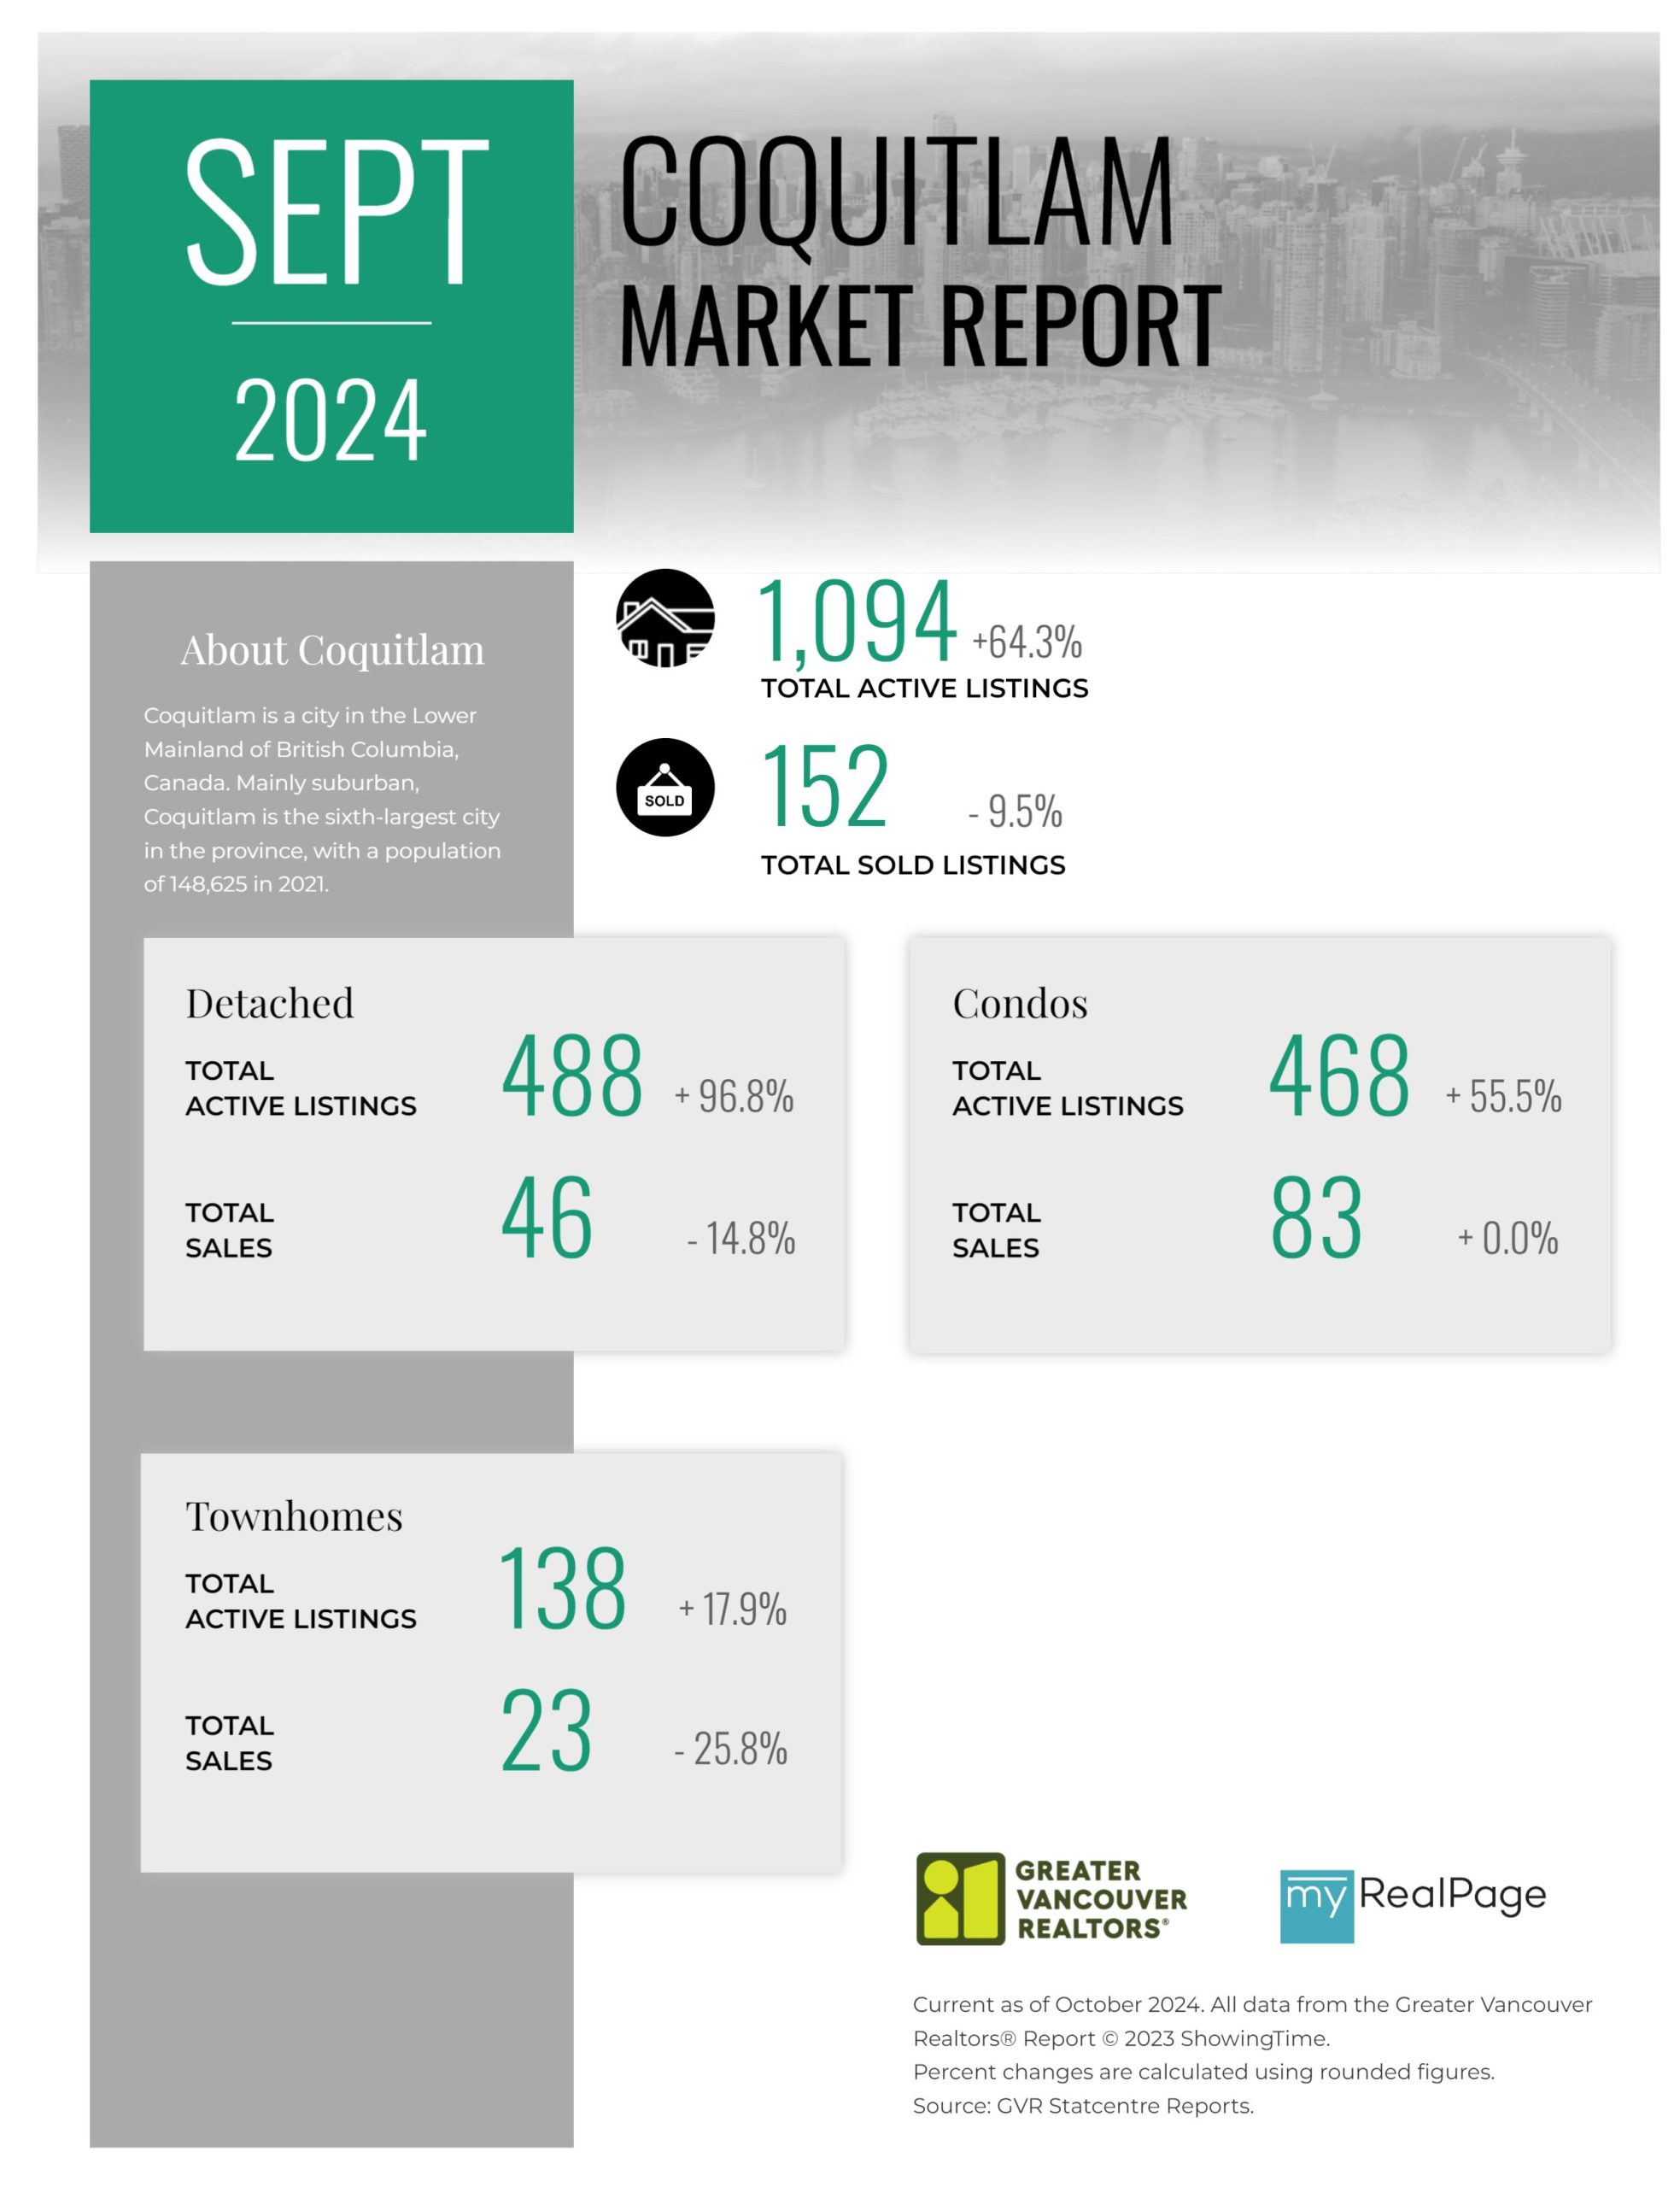
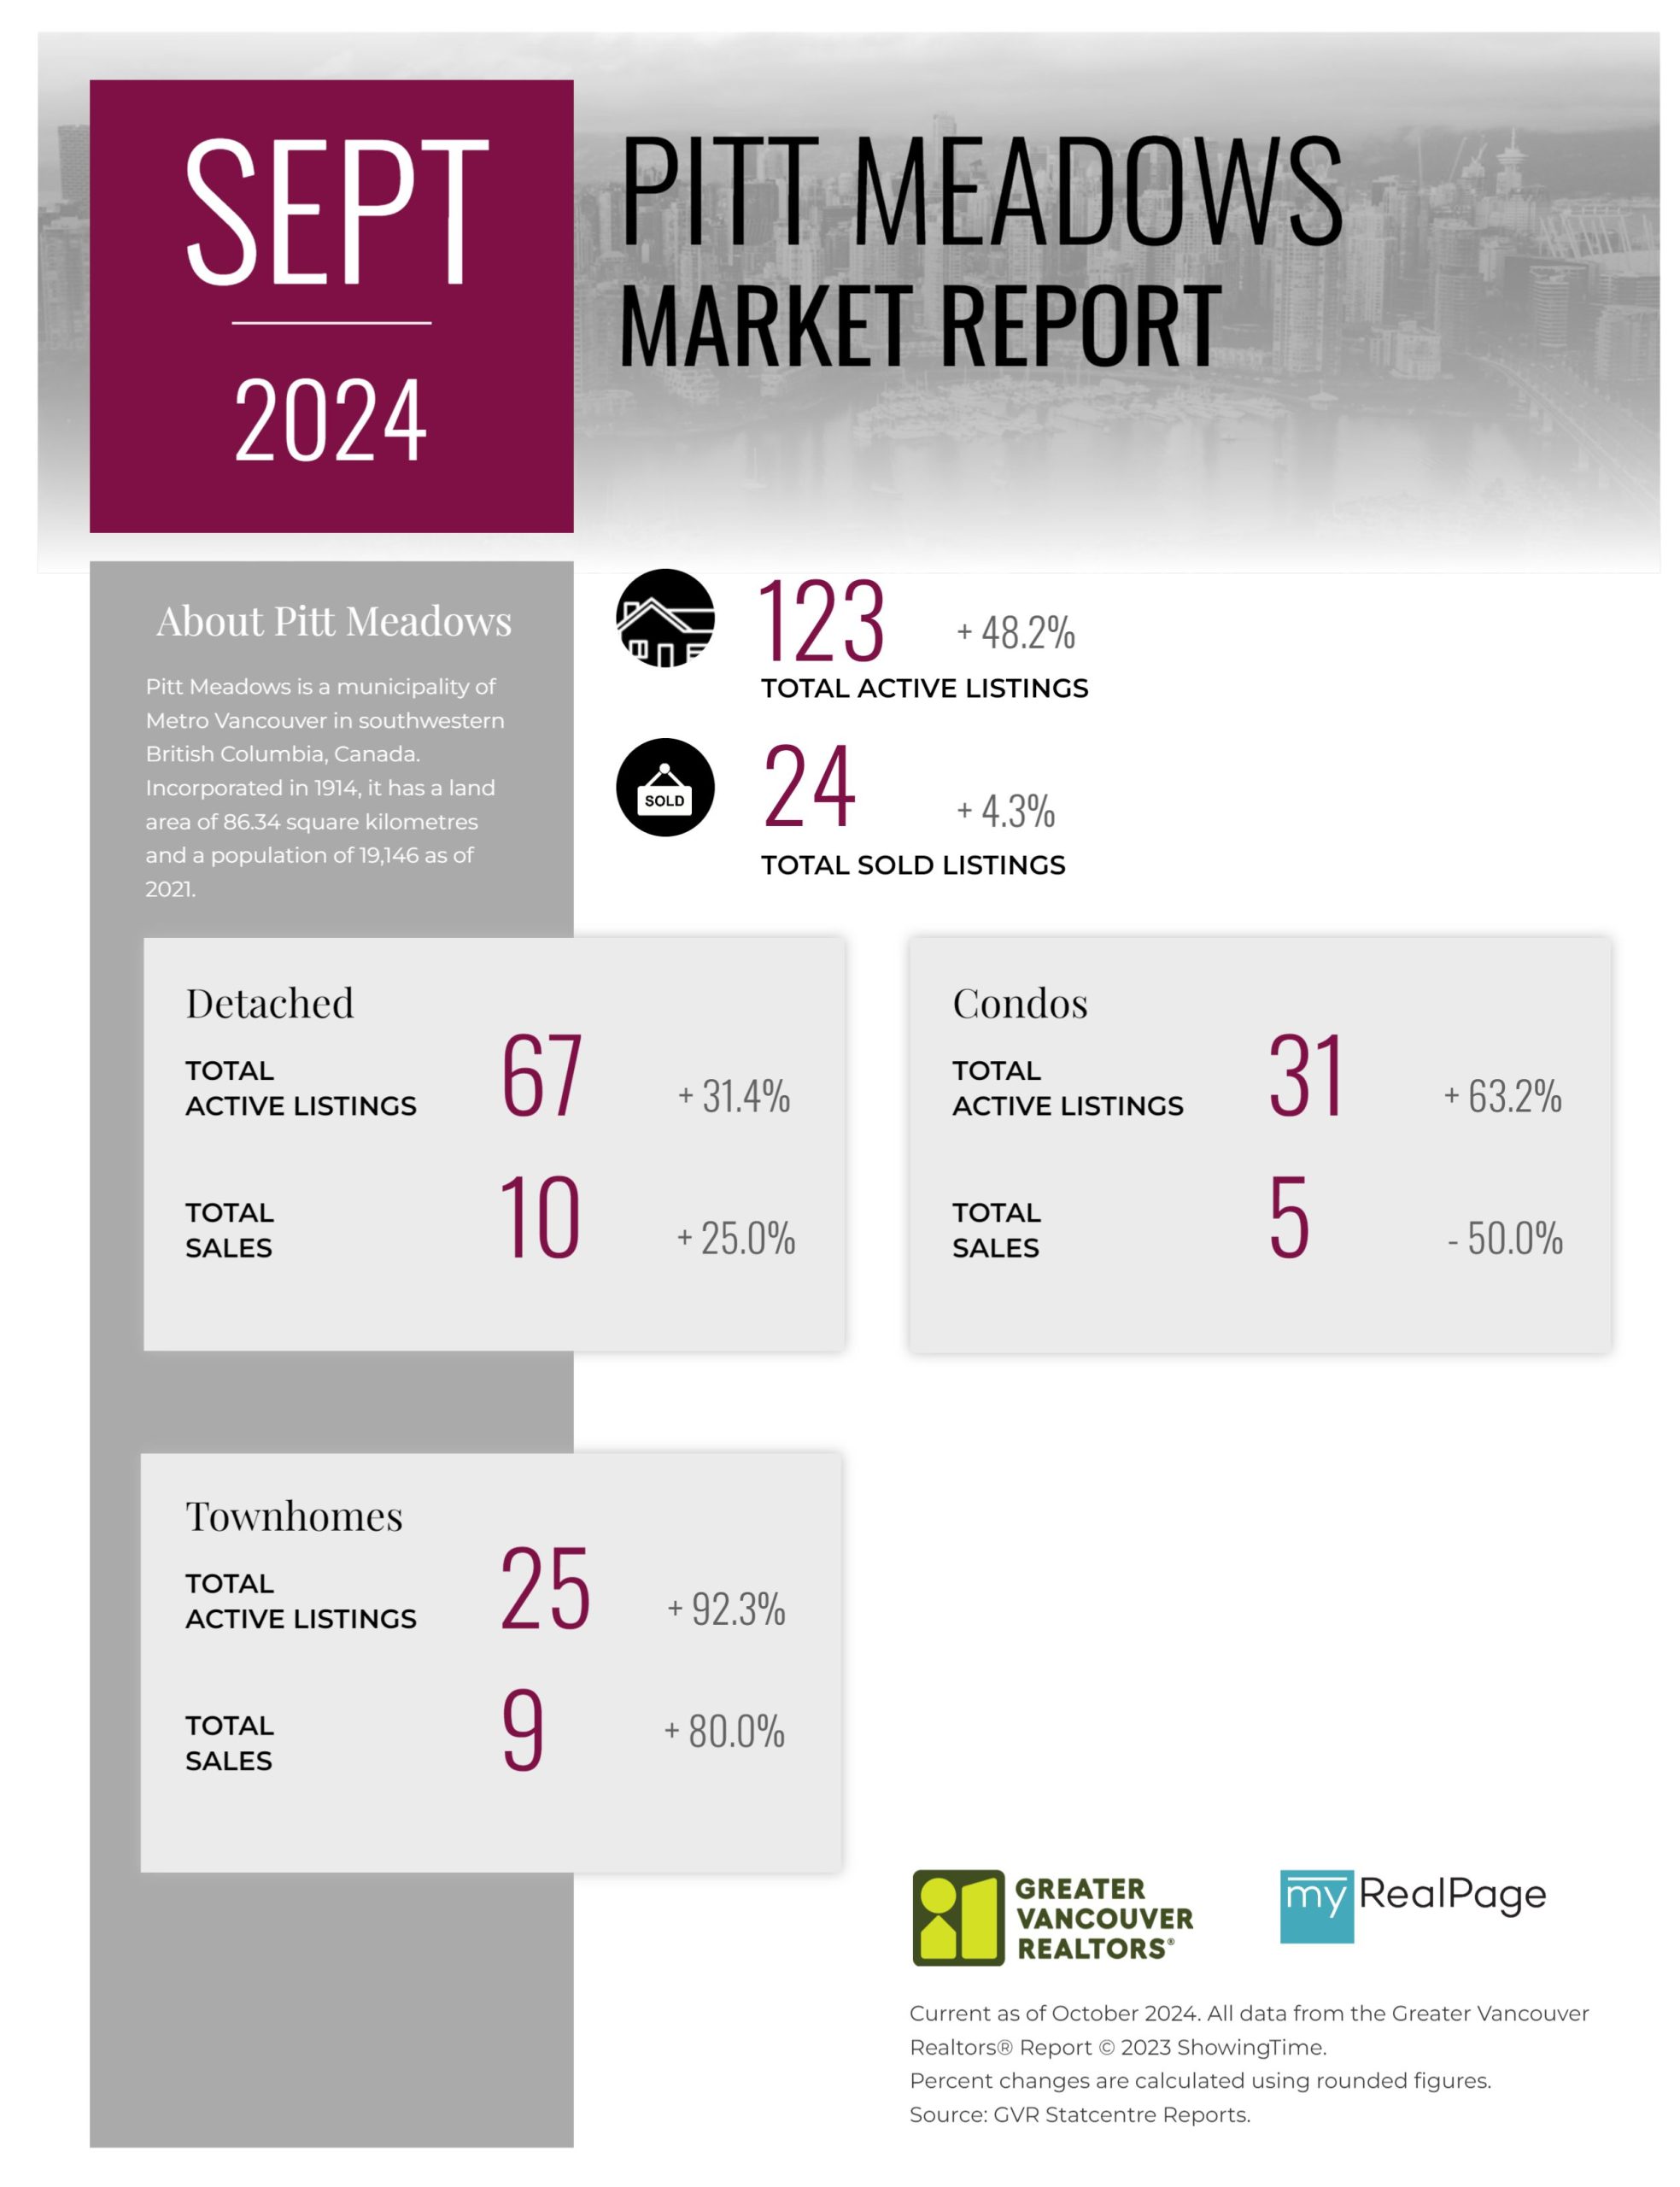
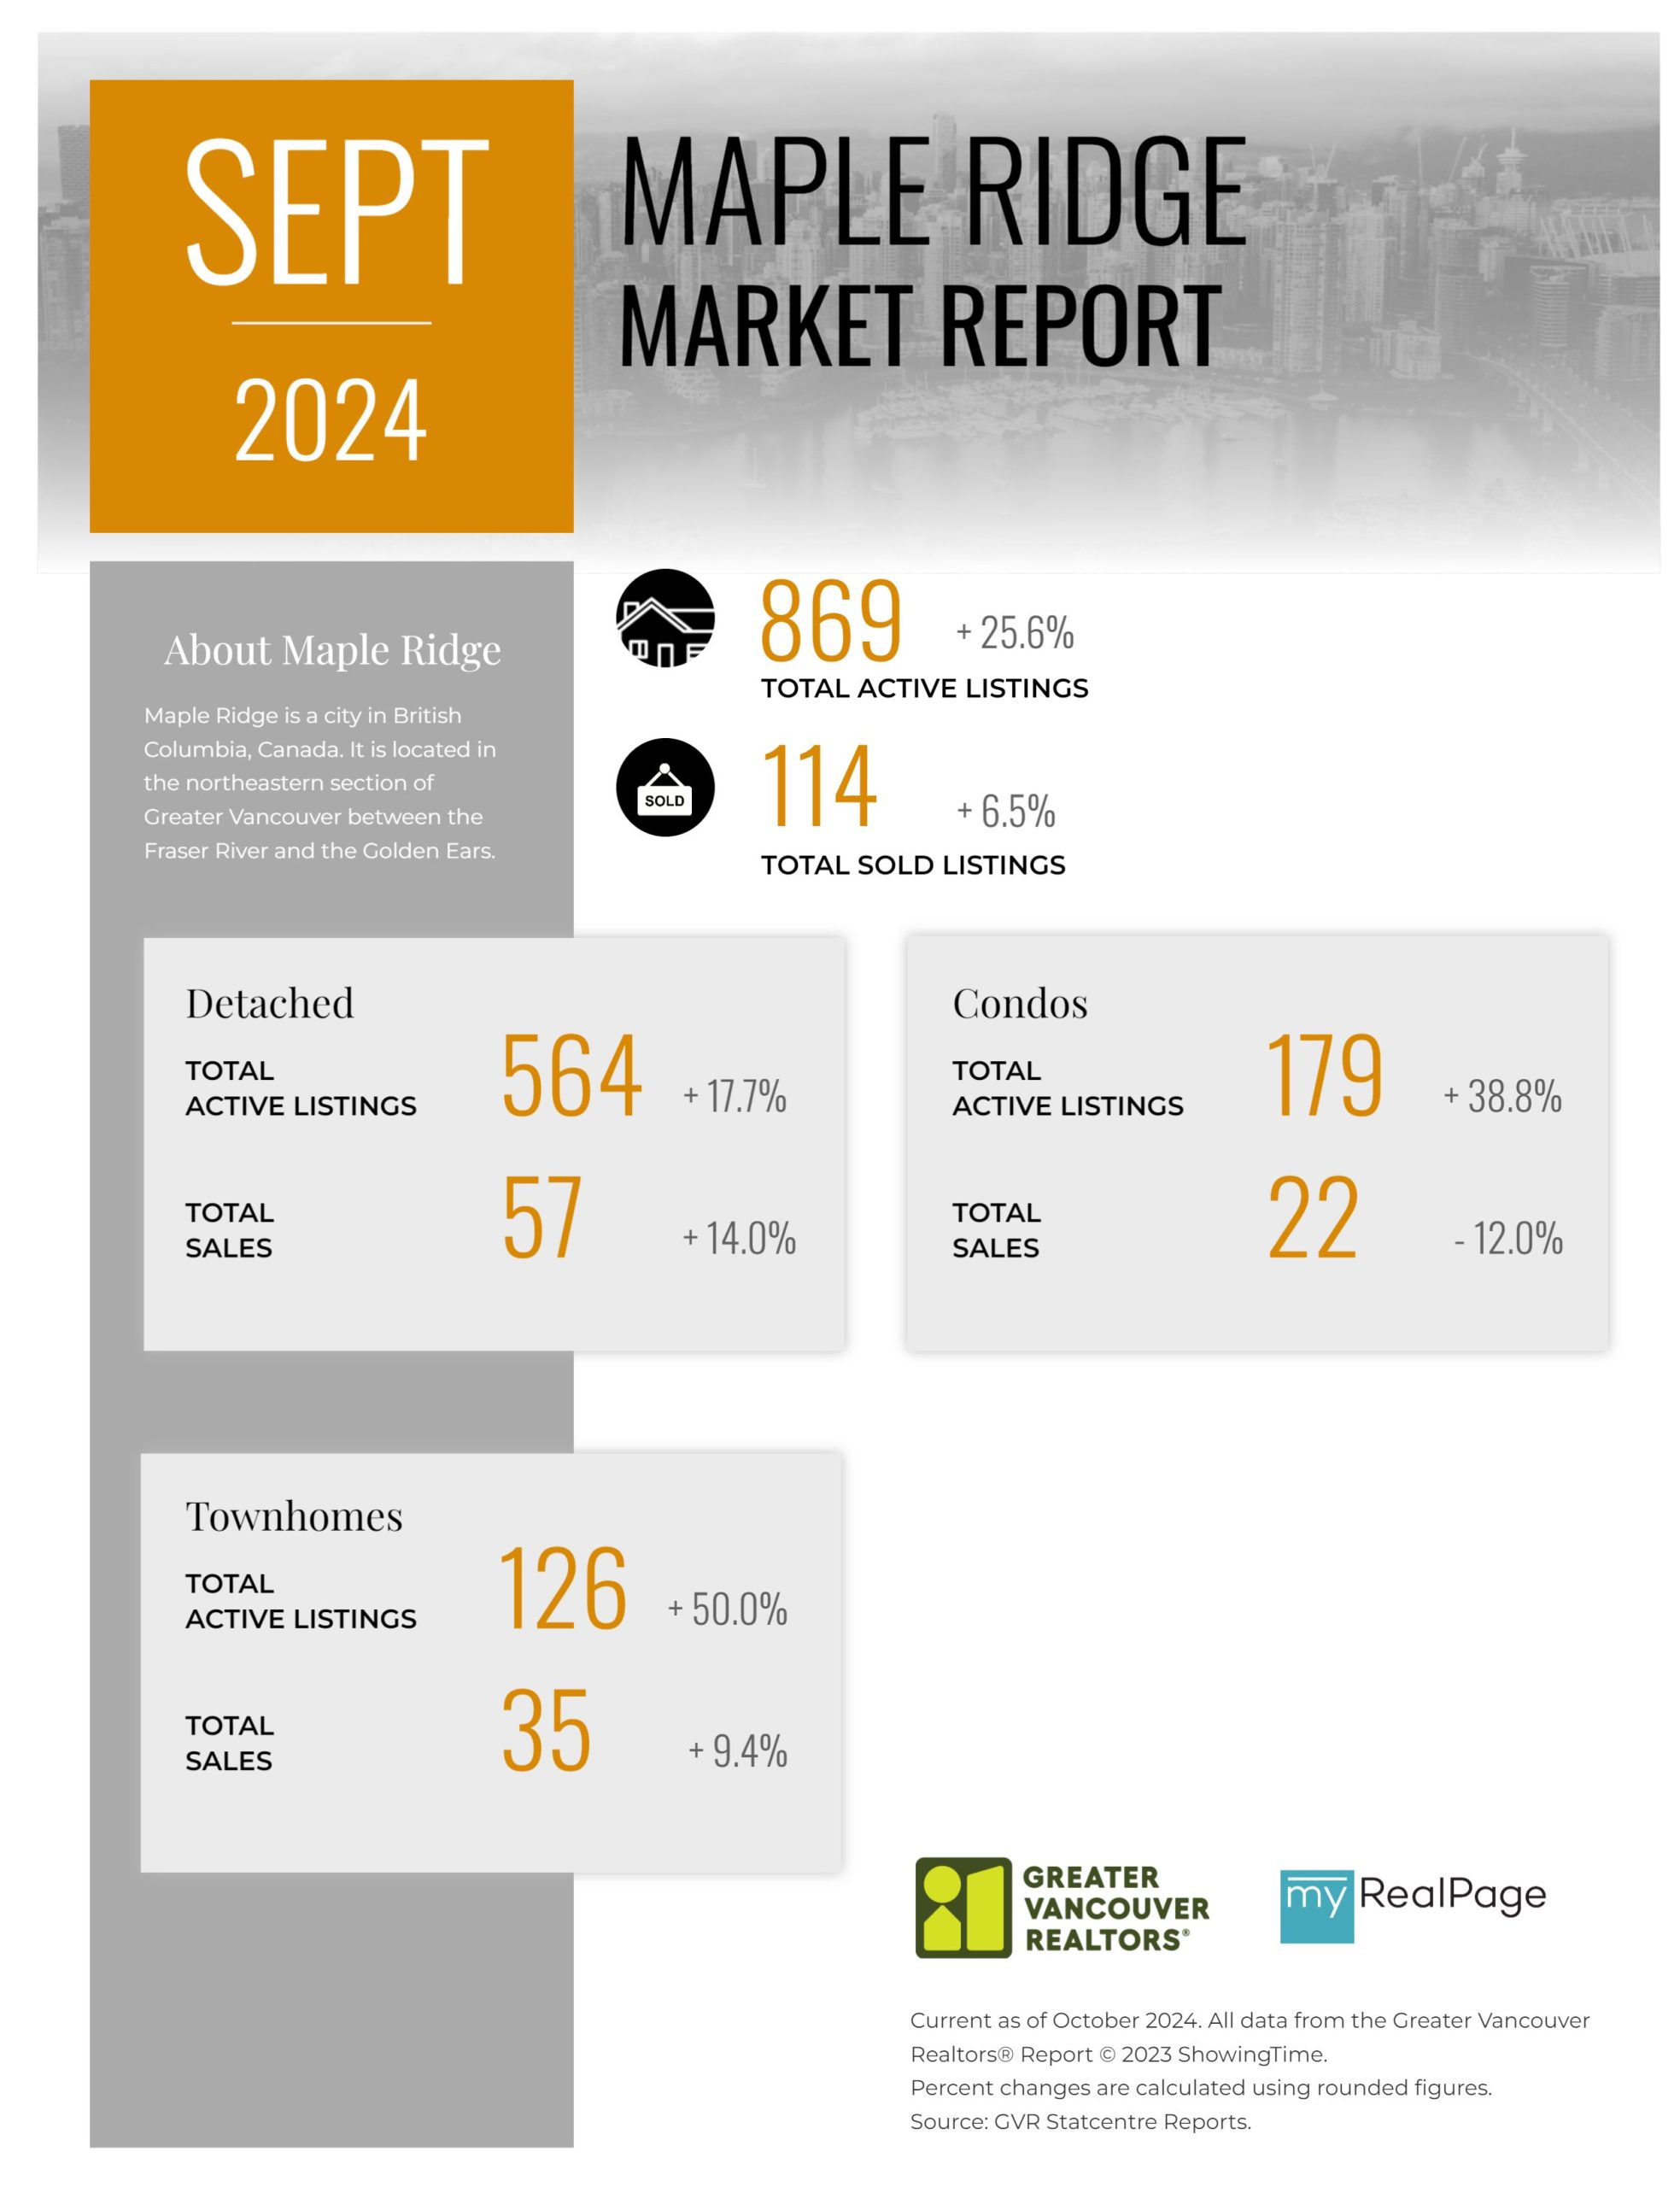
The following data is a comparison between September 2024 and September 2023 numbers, and is current as of October 2024. For last month’s update, you can check out our previous post!
Or follow this link for all our GVR Infographics!
These infographics cover current trends in several areas within the Greater Vancouver region. Click on the images for a larger view!
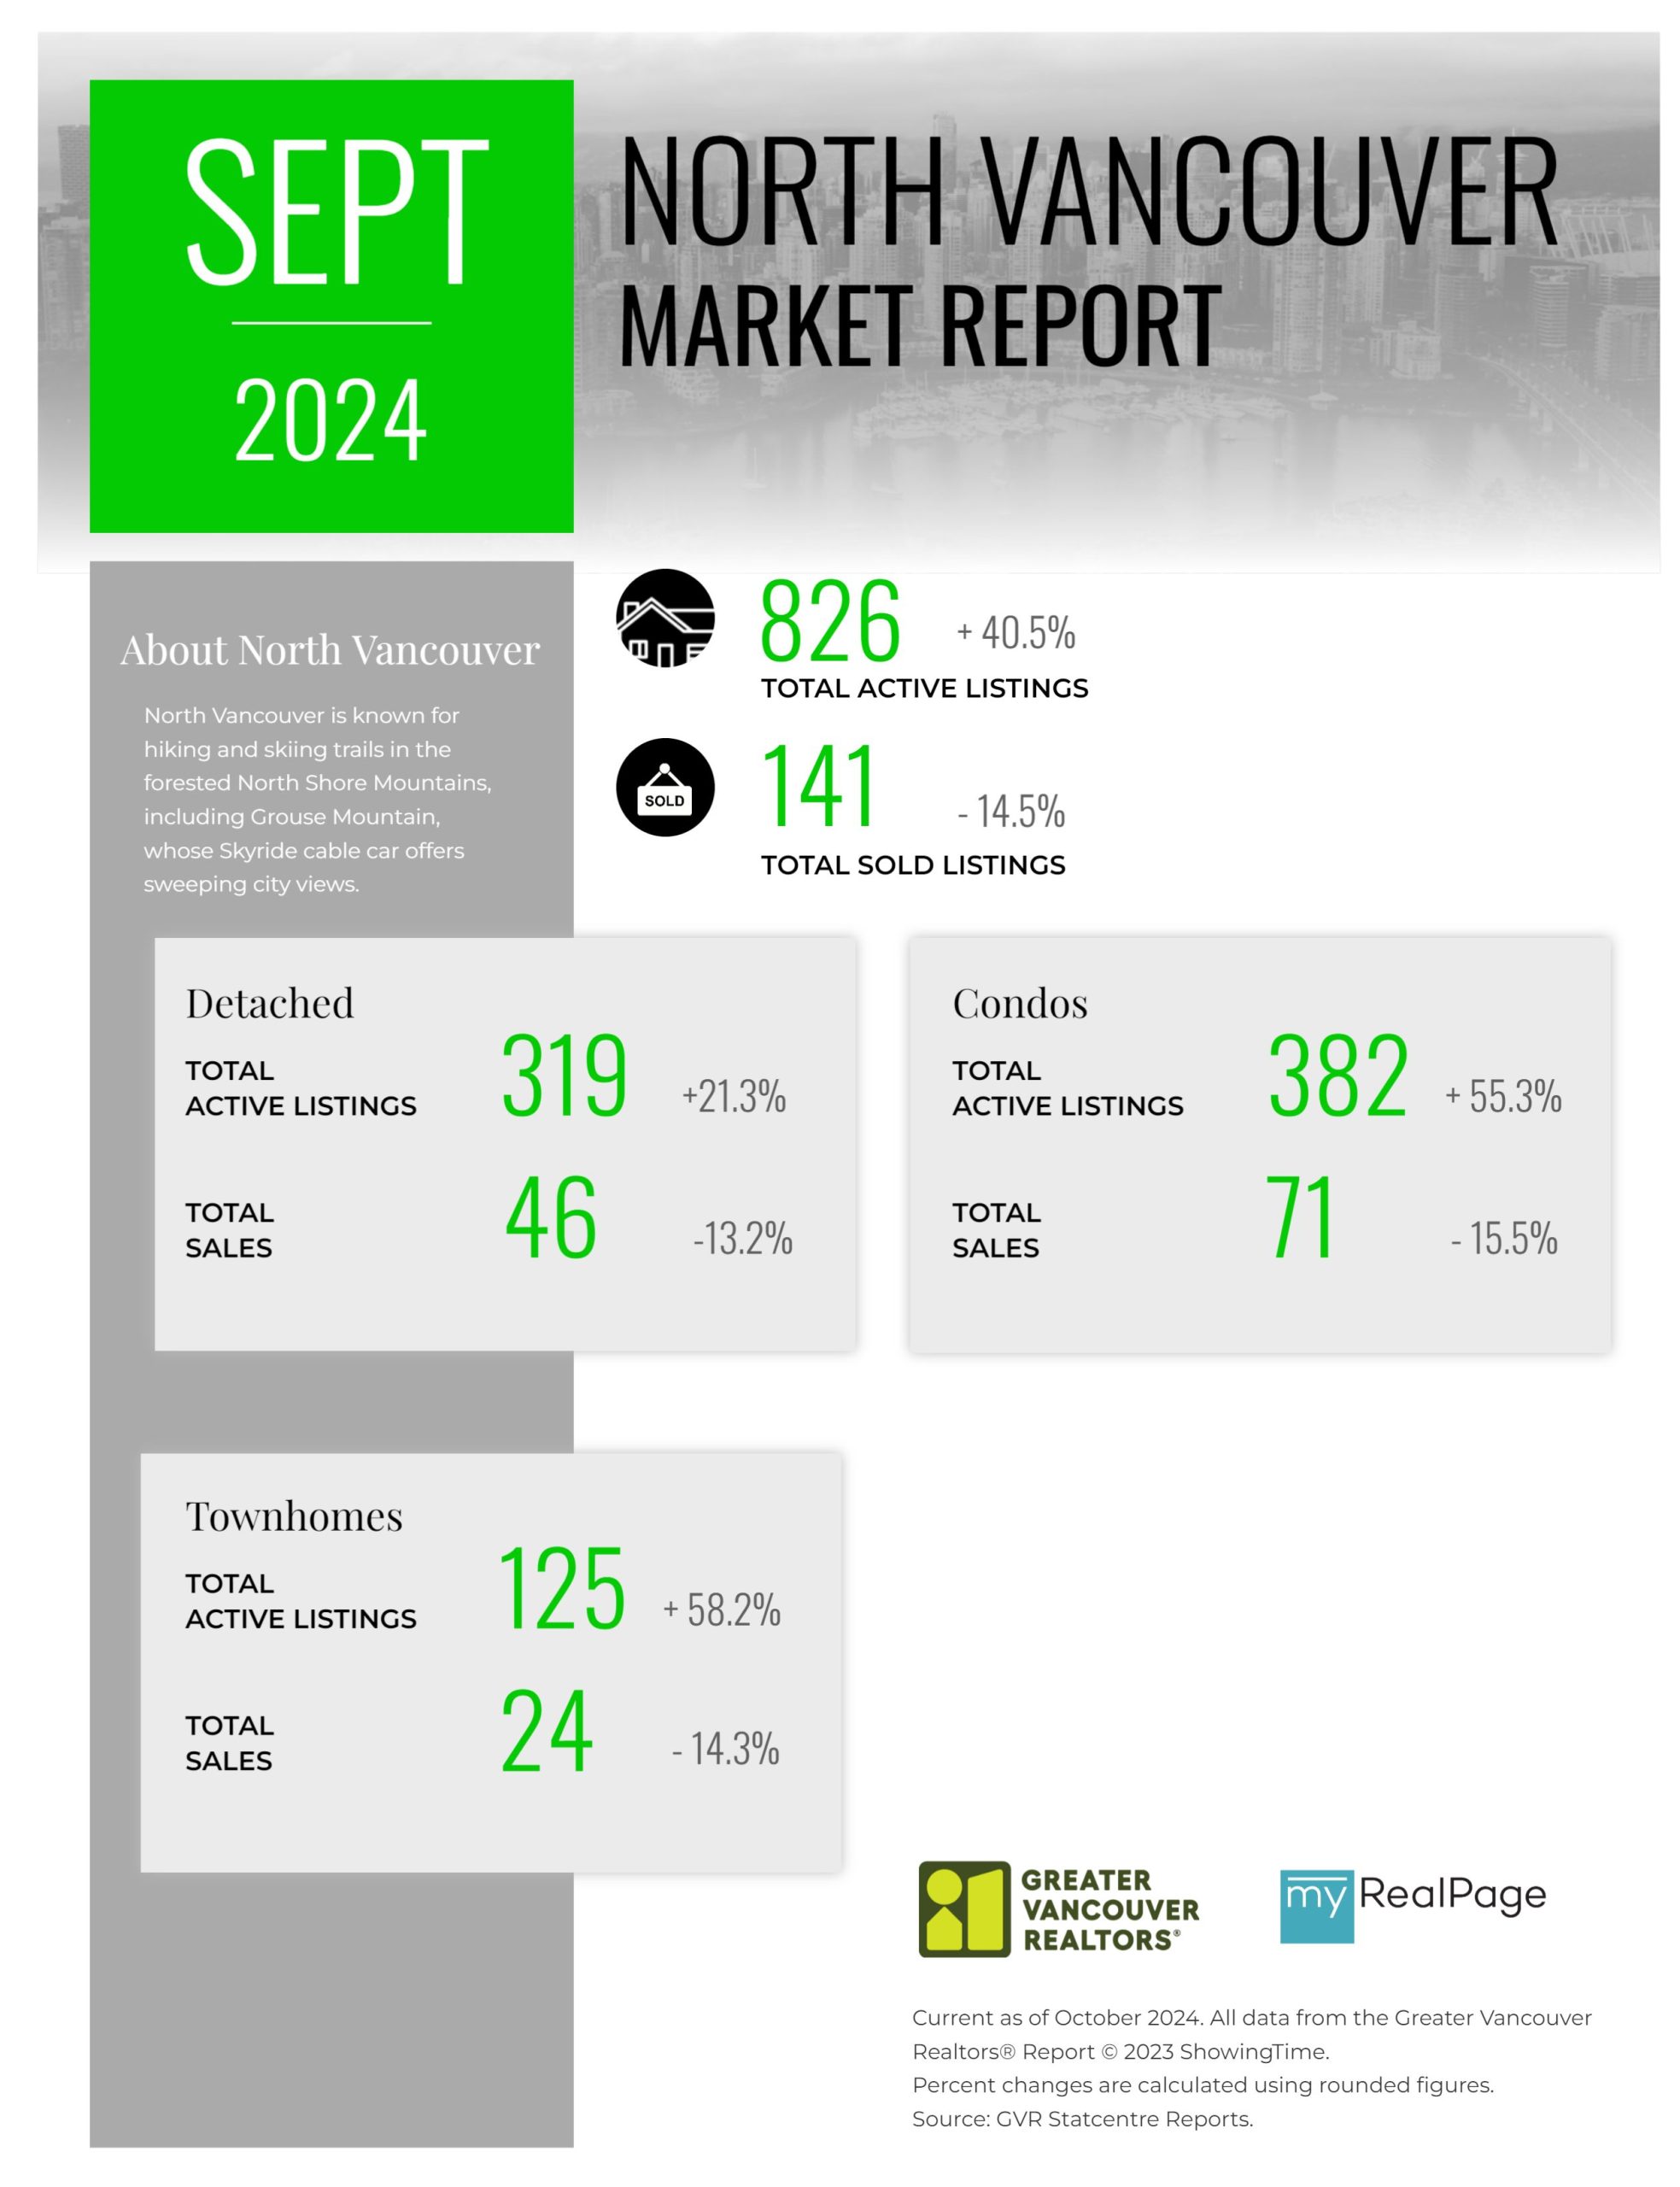
Printable Version – GVR September 2024 Data Infographic Report North Vancouver
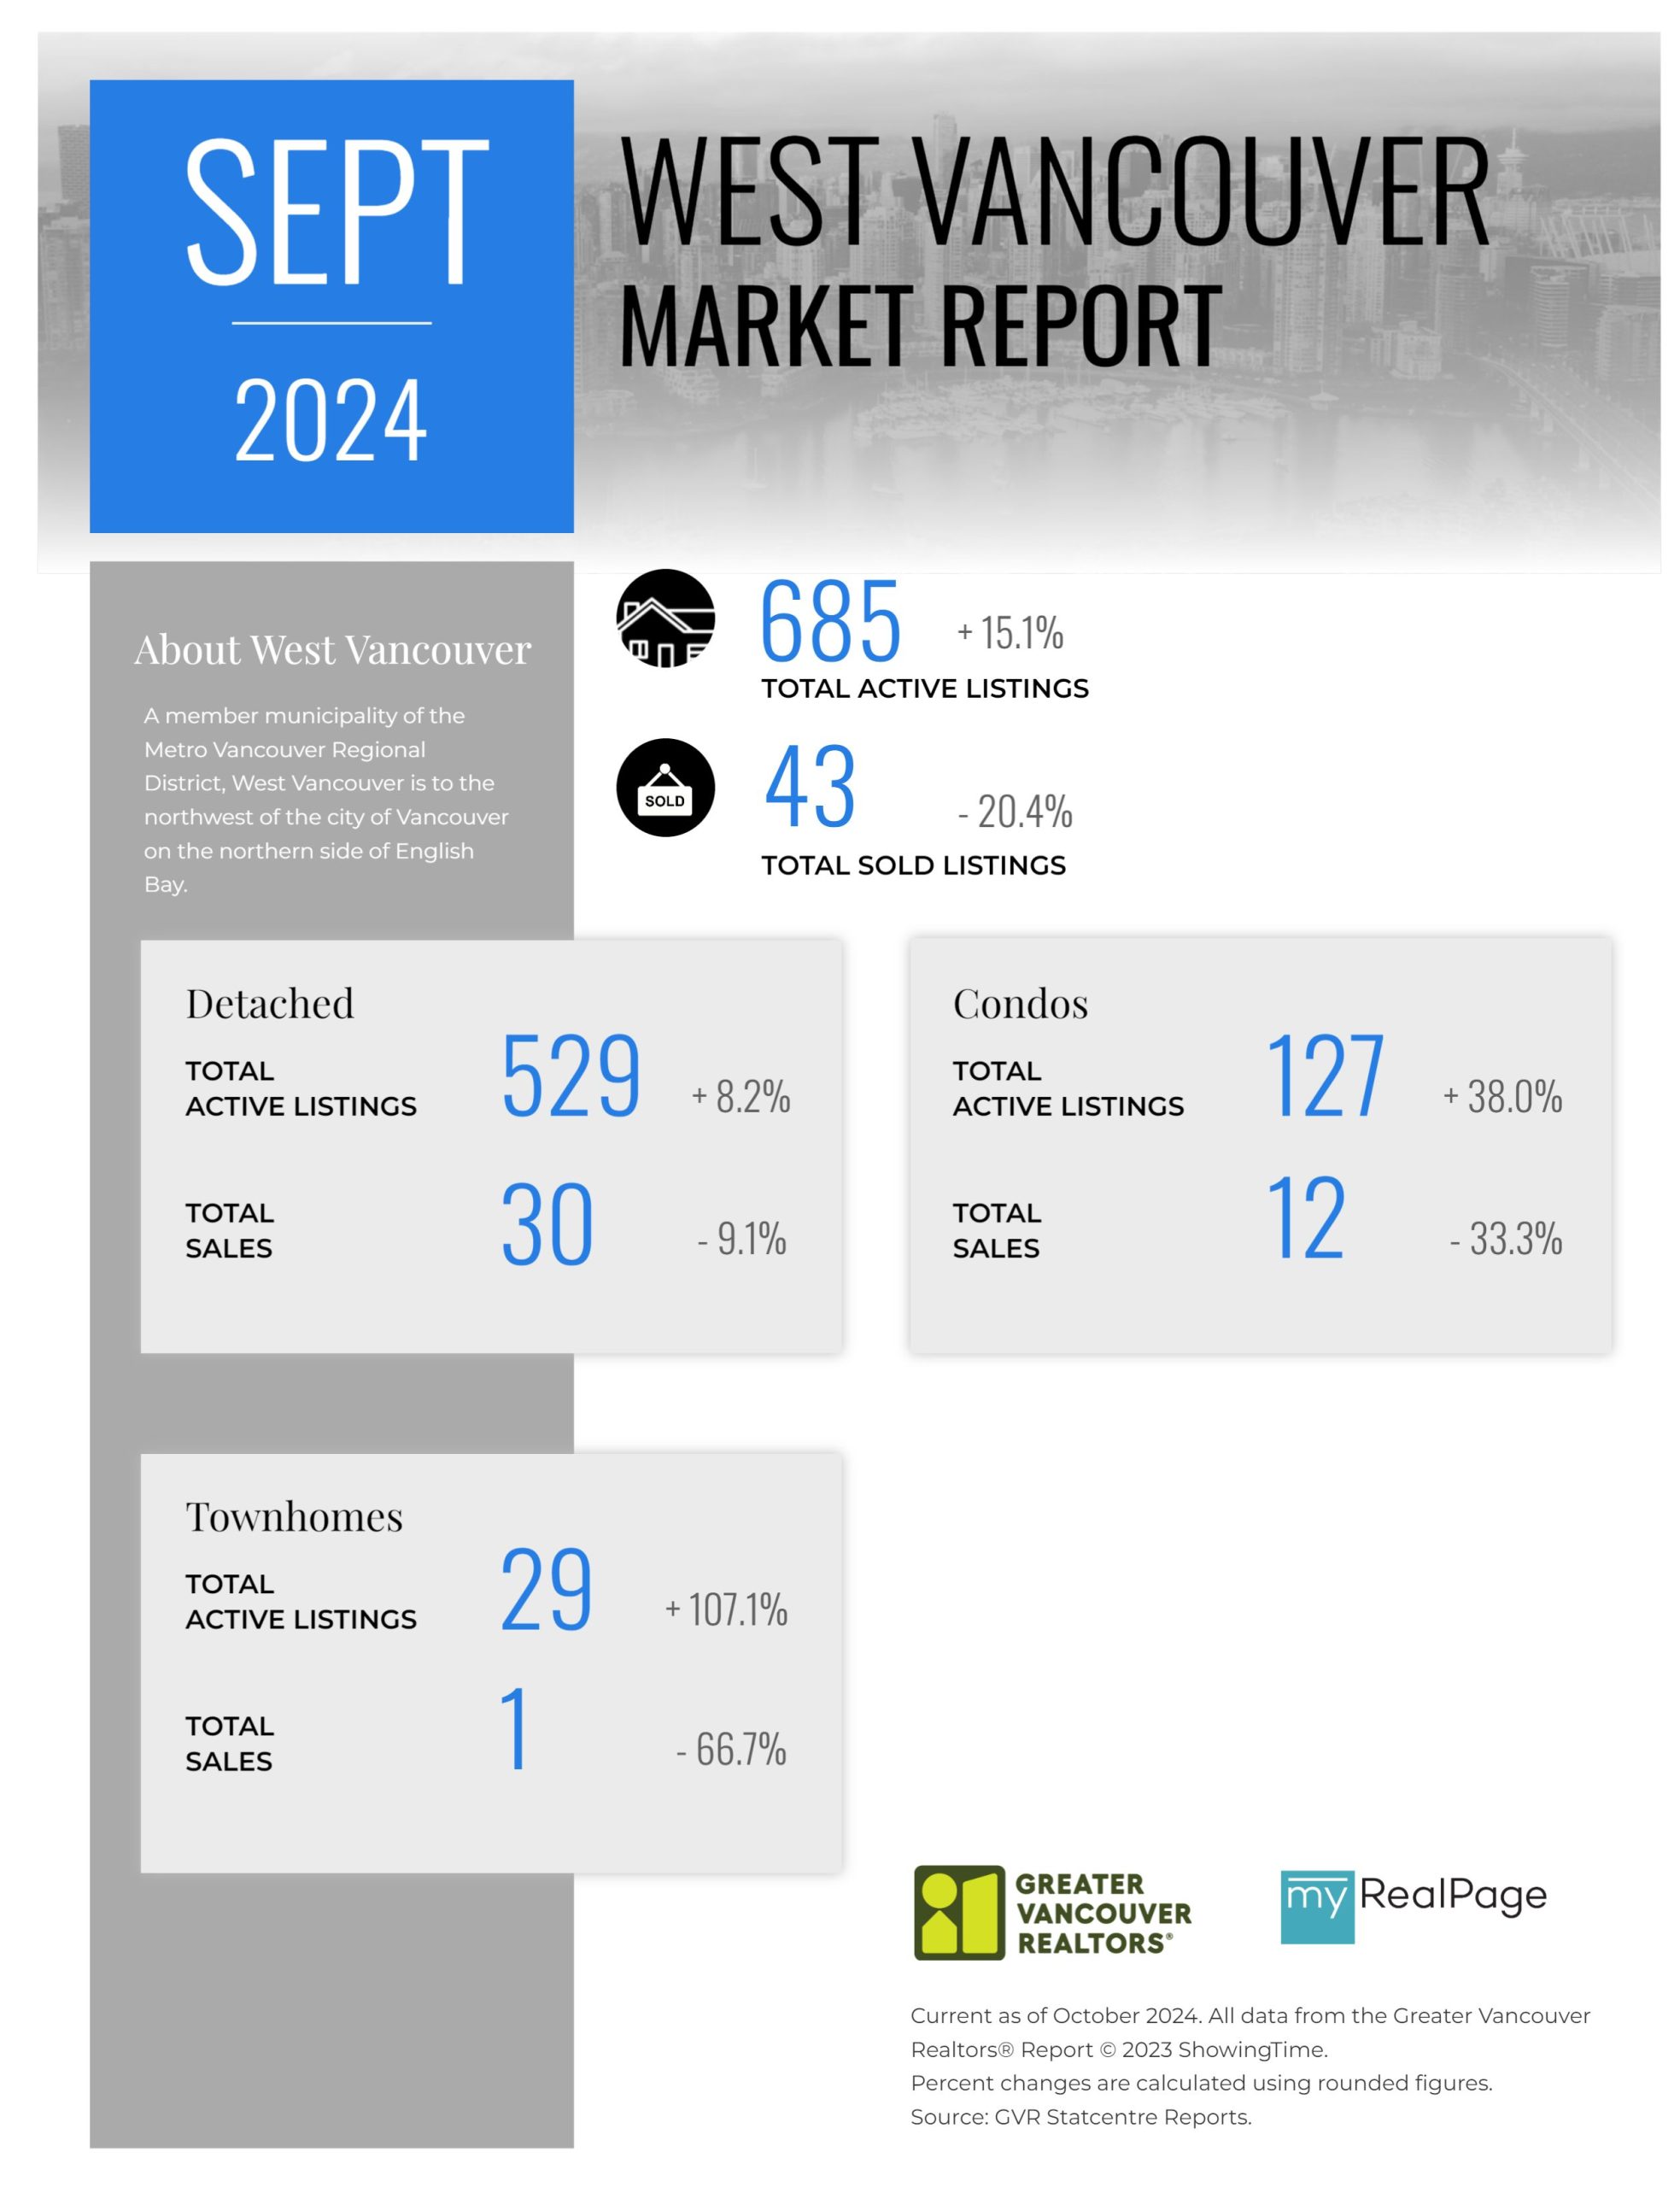
Printable Version – GVR September 2024 Data Infographics Report West Vancouver
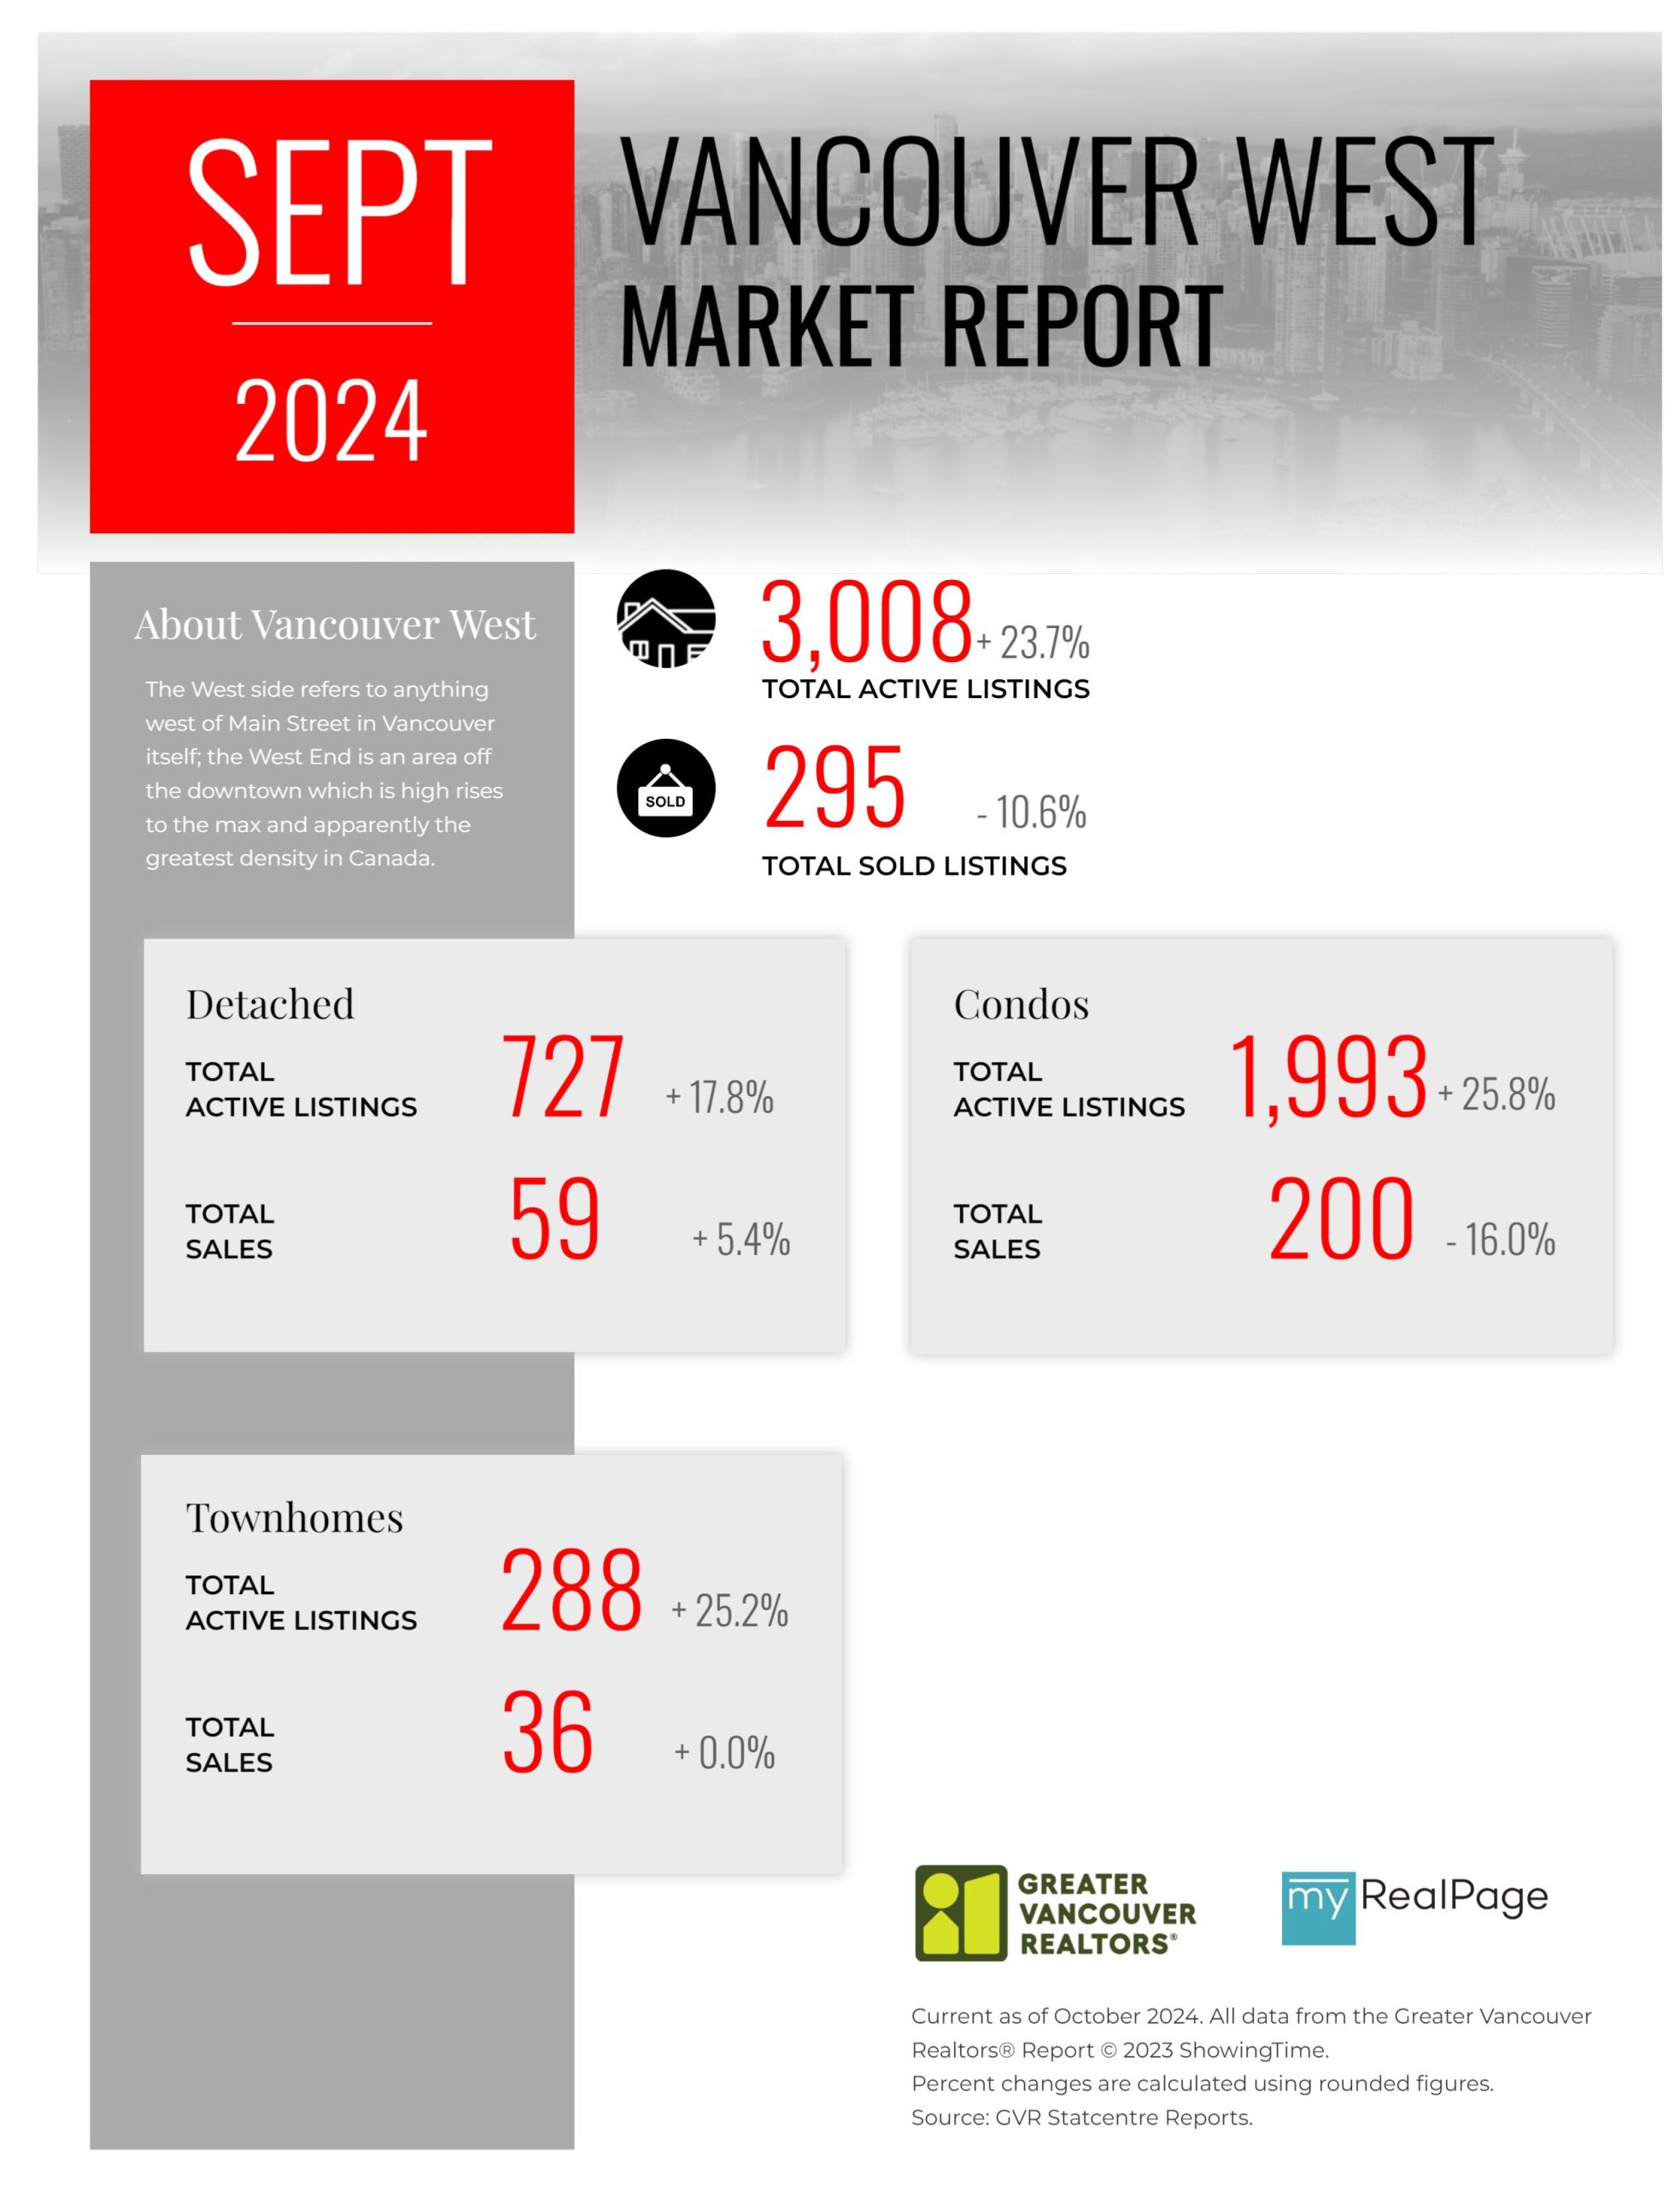
Printable Version – GVR September 2024 Data Infographics Report Vancouver West
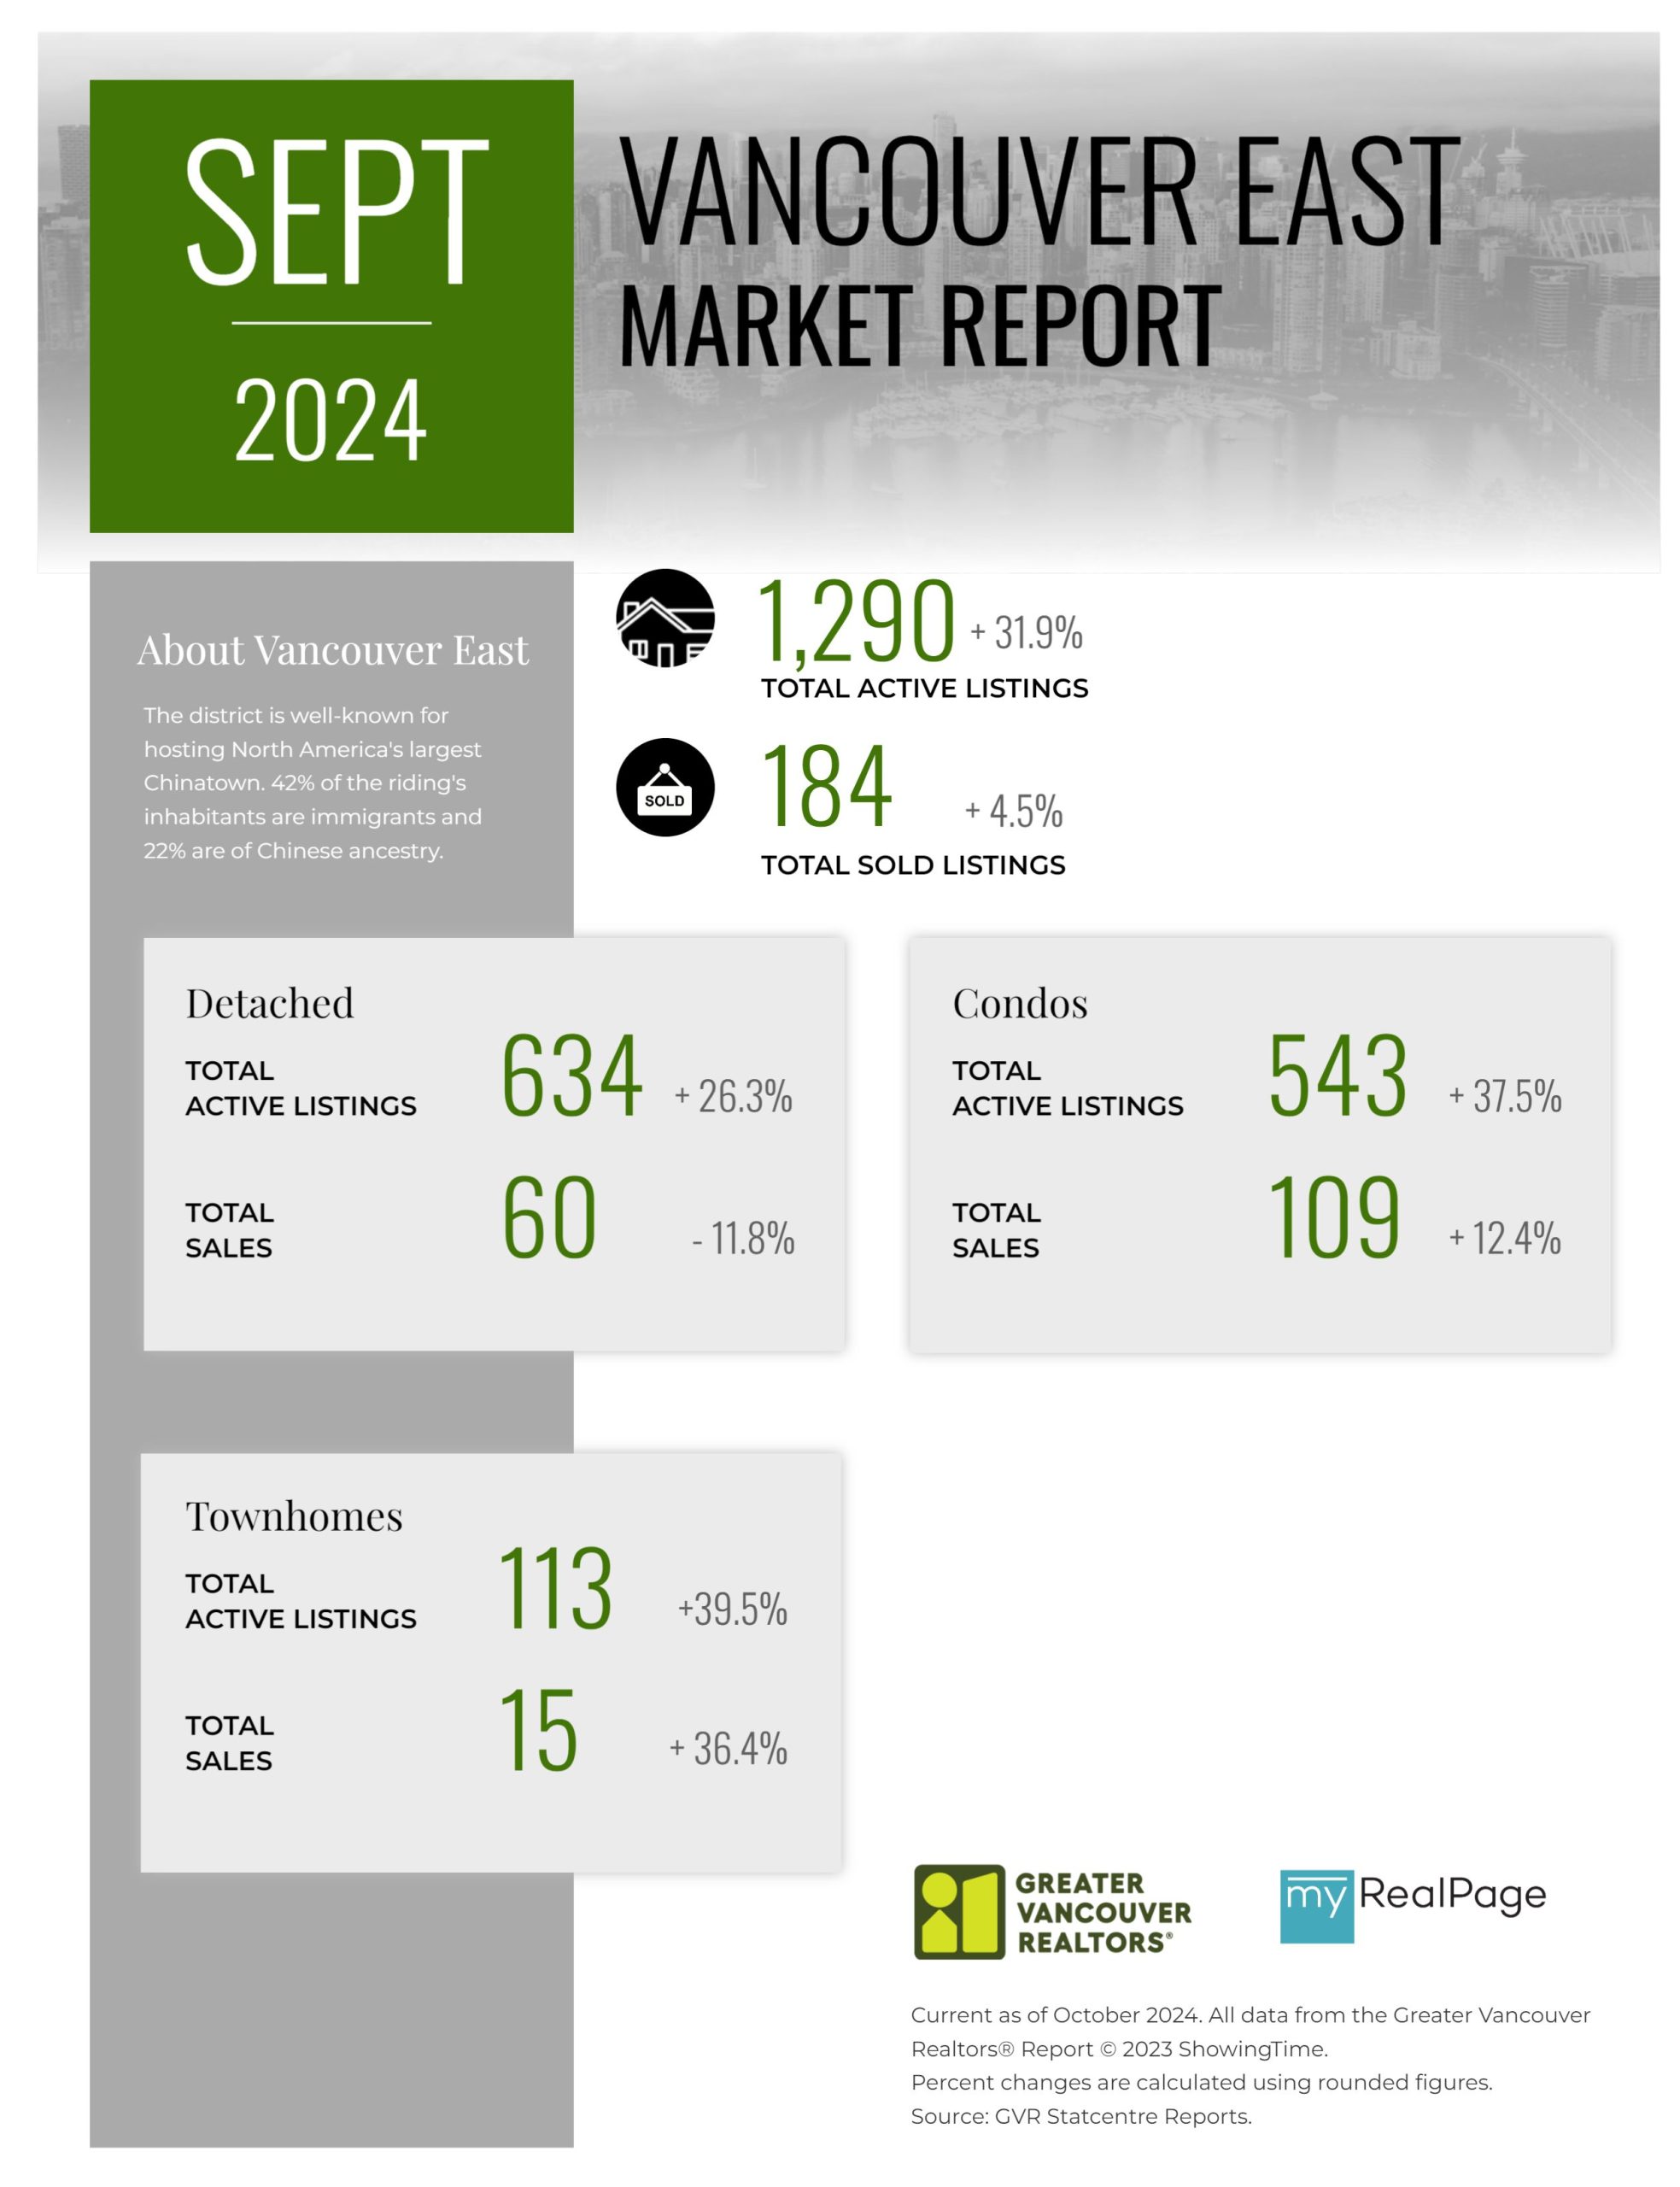
Printable Version – GVR September 2024 Data Infographics Report Vancouver East
Printable Version – GVR September 2024 Data Infographic Report Maple Ridge
Printable Version – GVR September 2024 Data Infographics Report Pitt Meadows
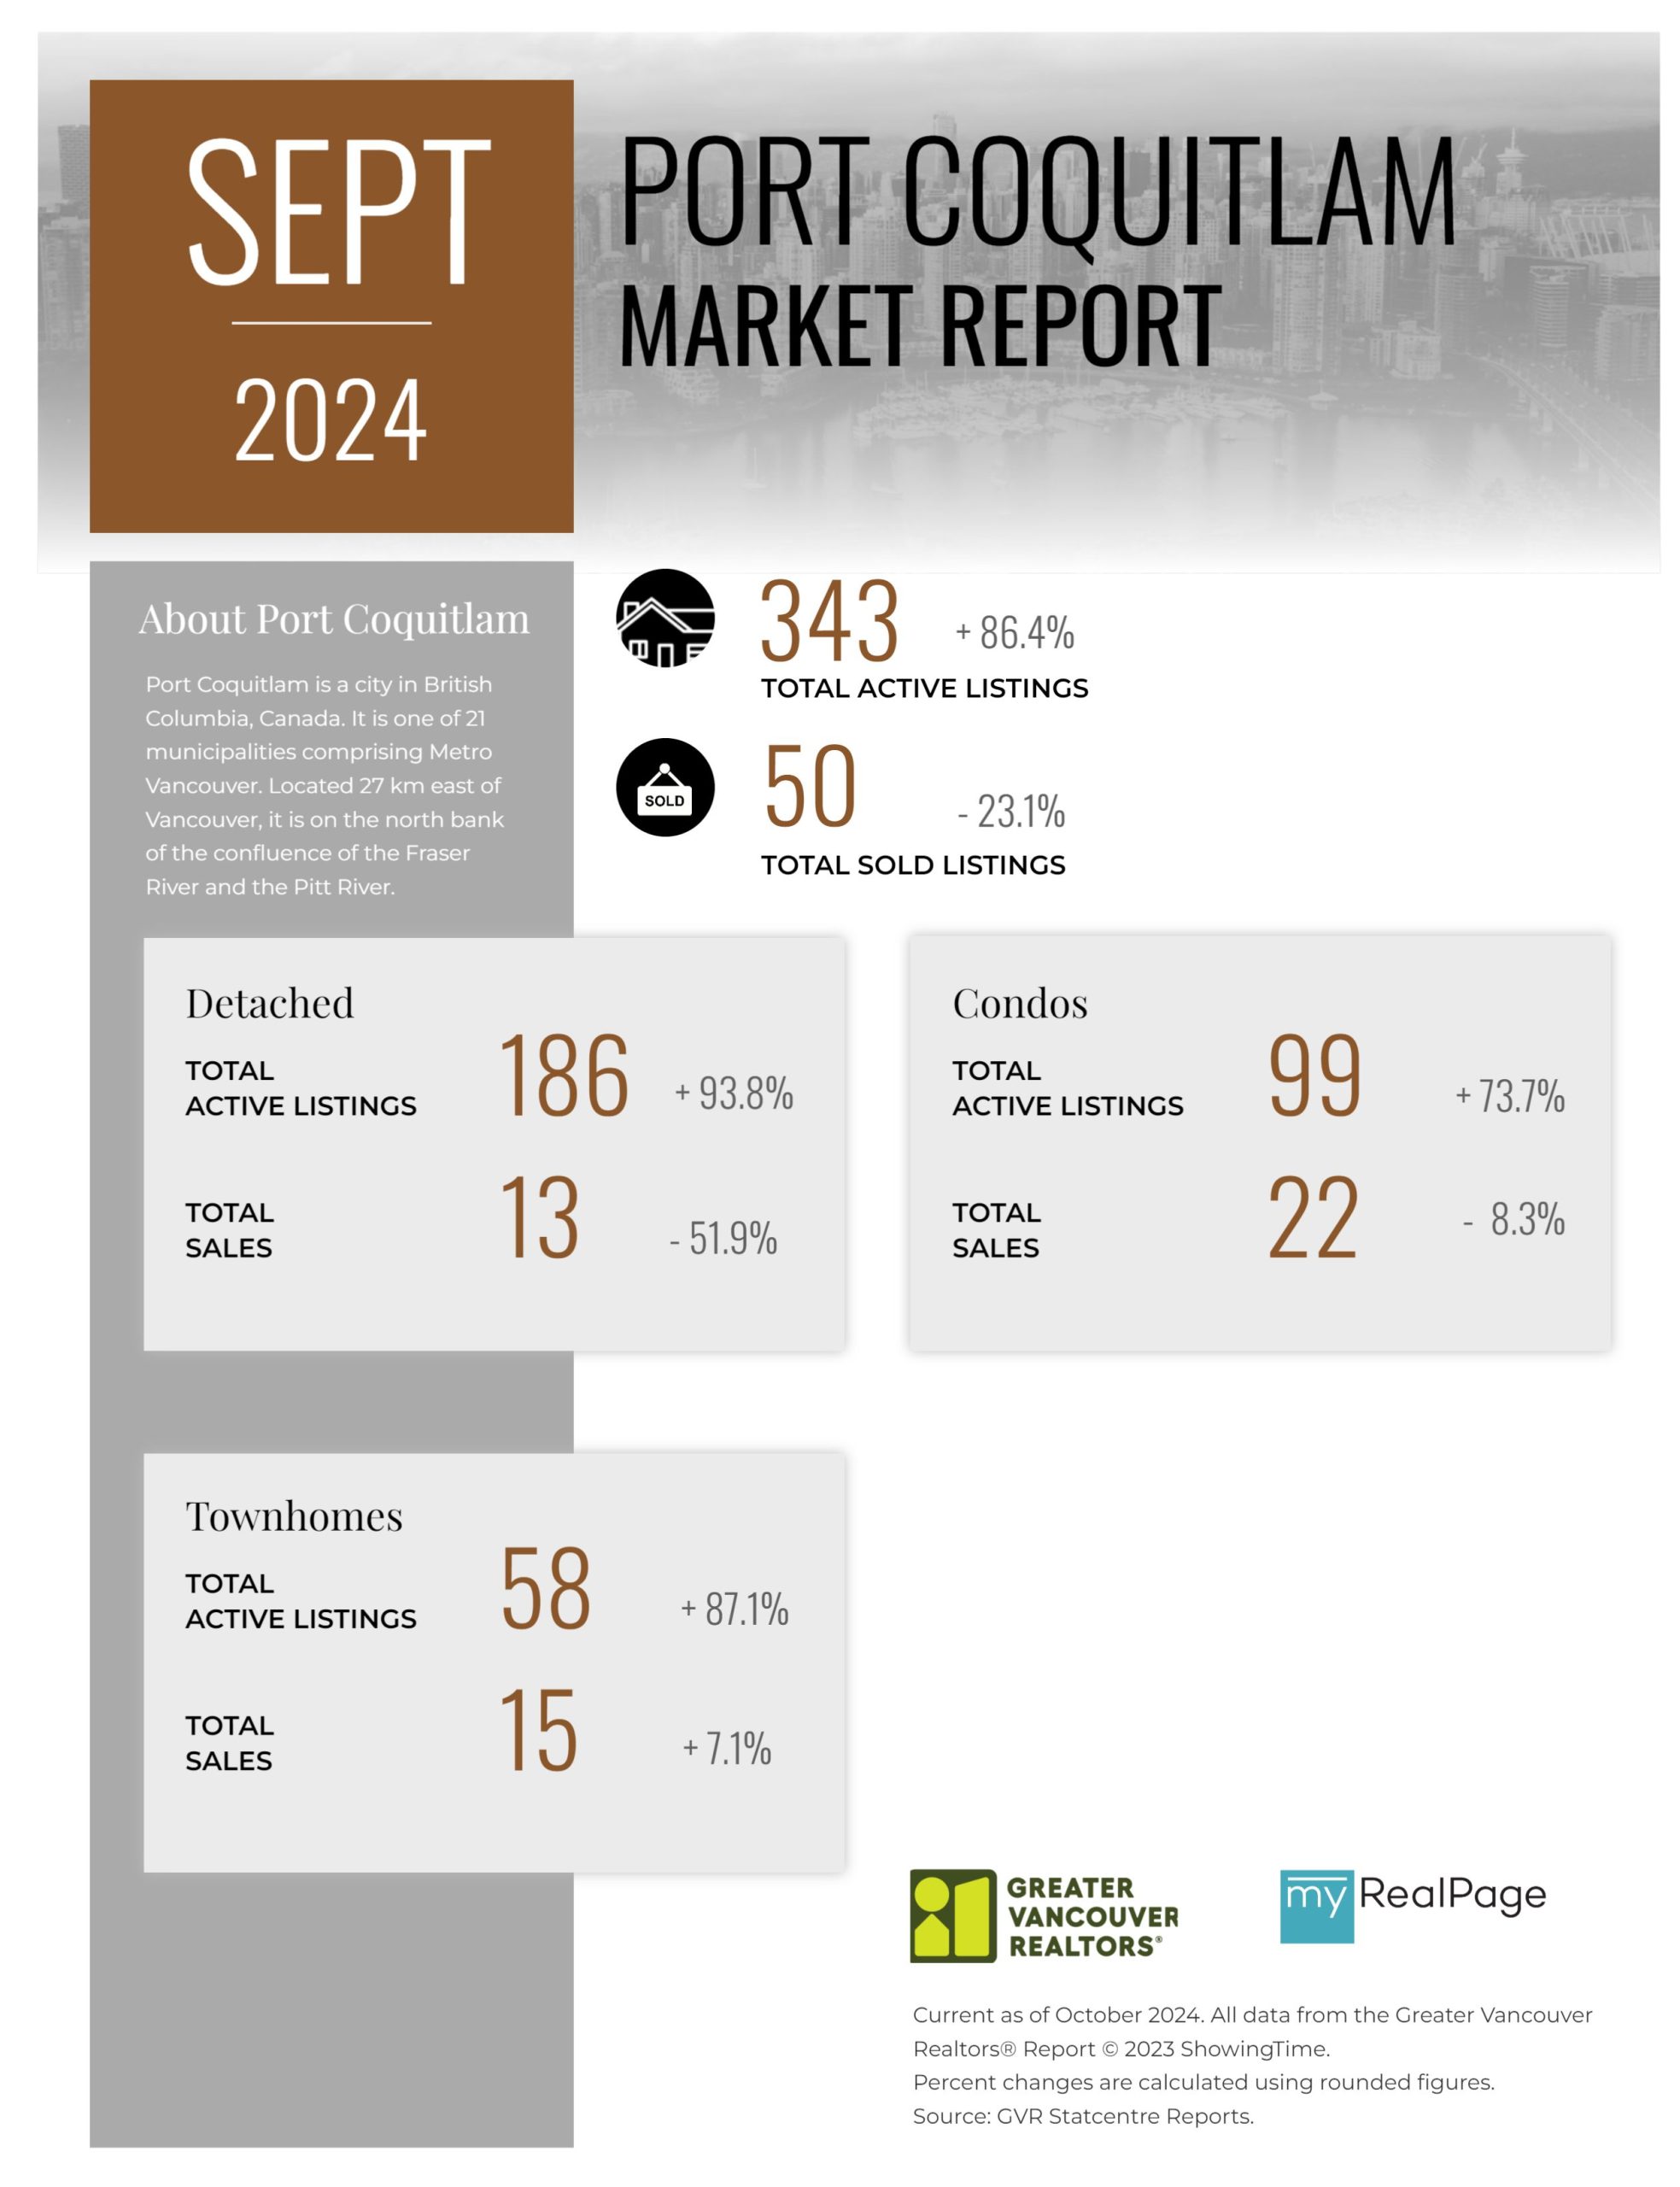
Printable Version – GVR September 2024 Data Infographics Report Port Coquitlam
Printable Version – GVR September 2024 Data Infographics Report Coquitlam
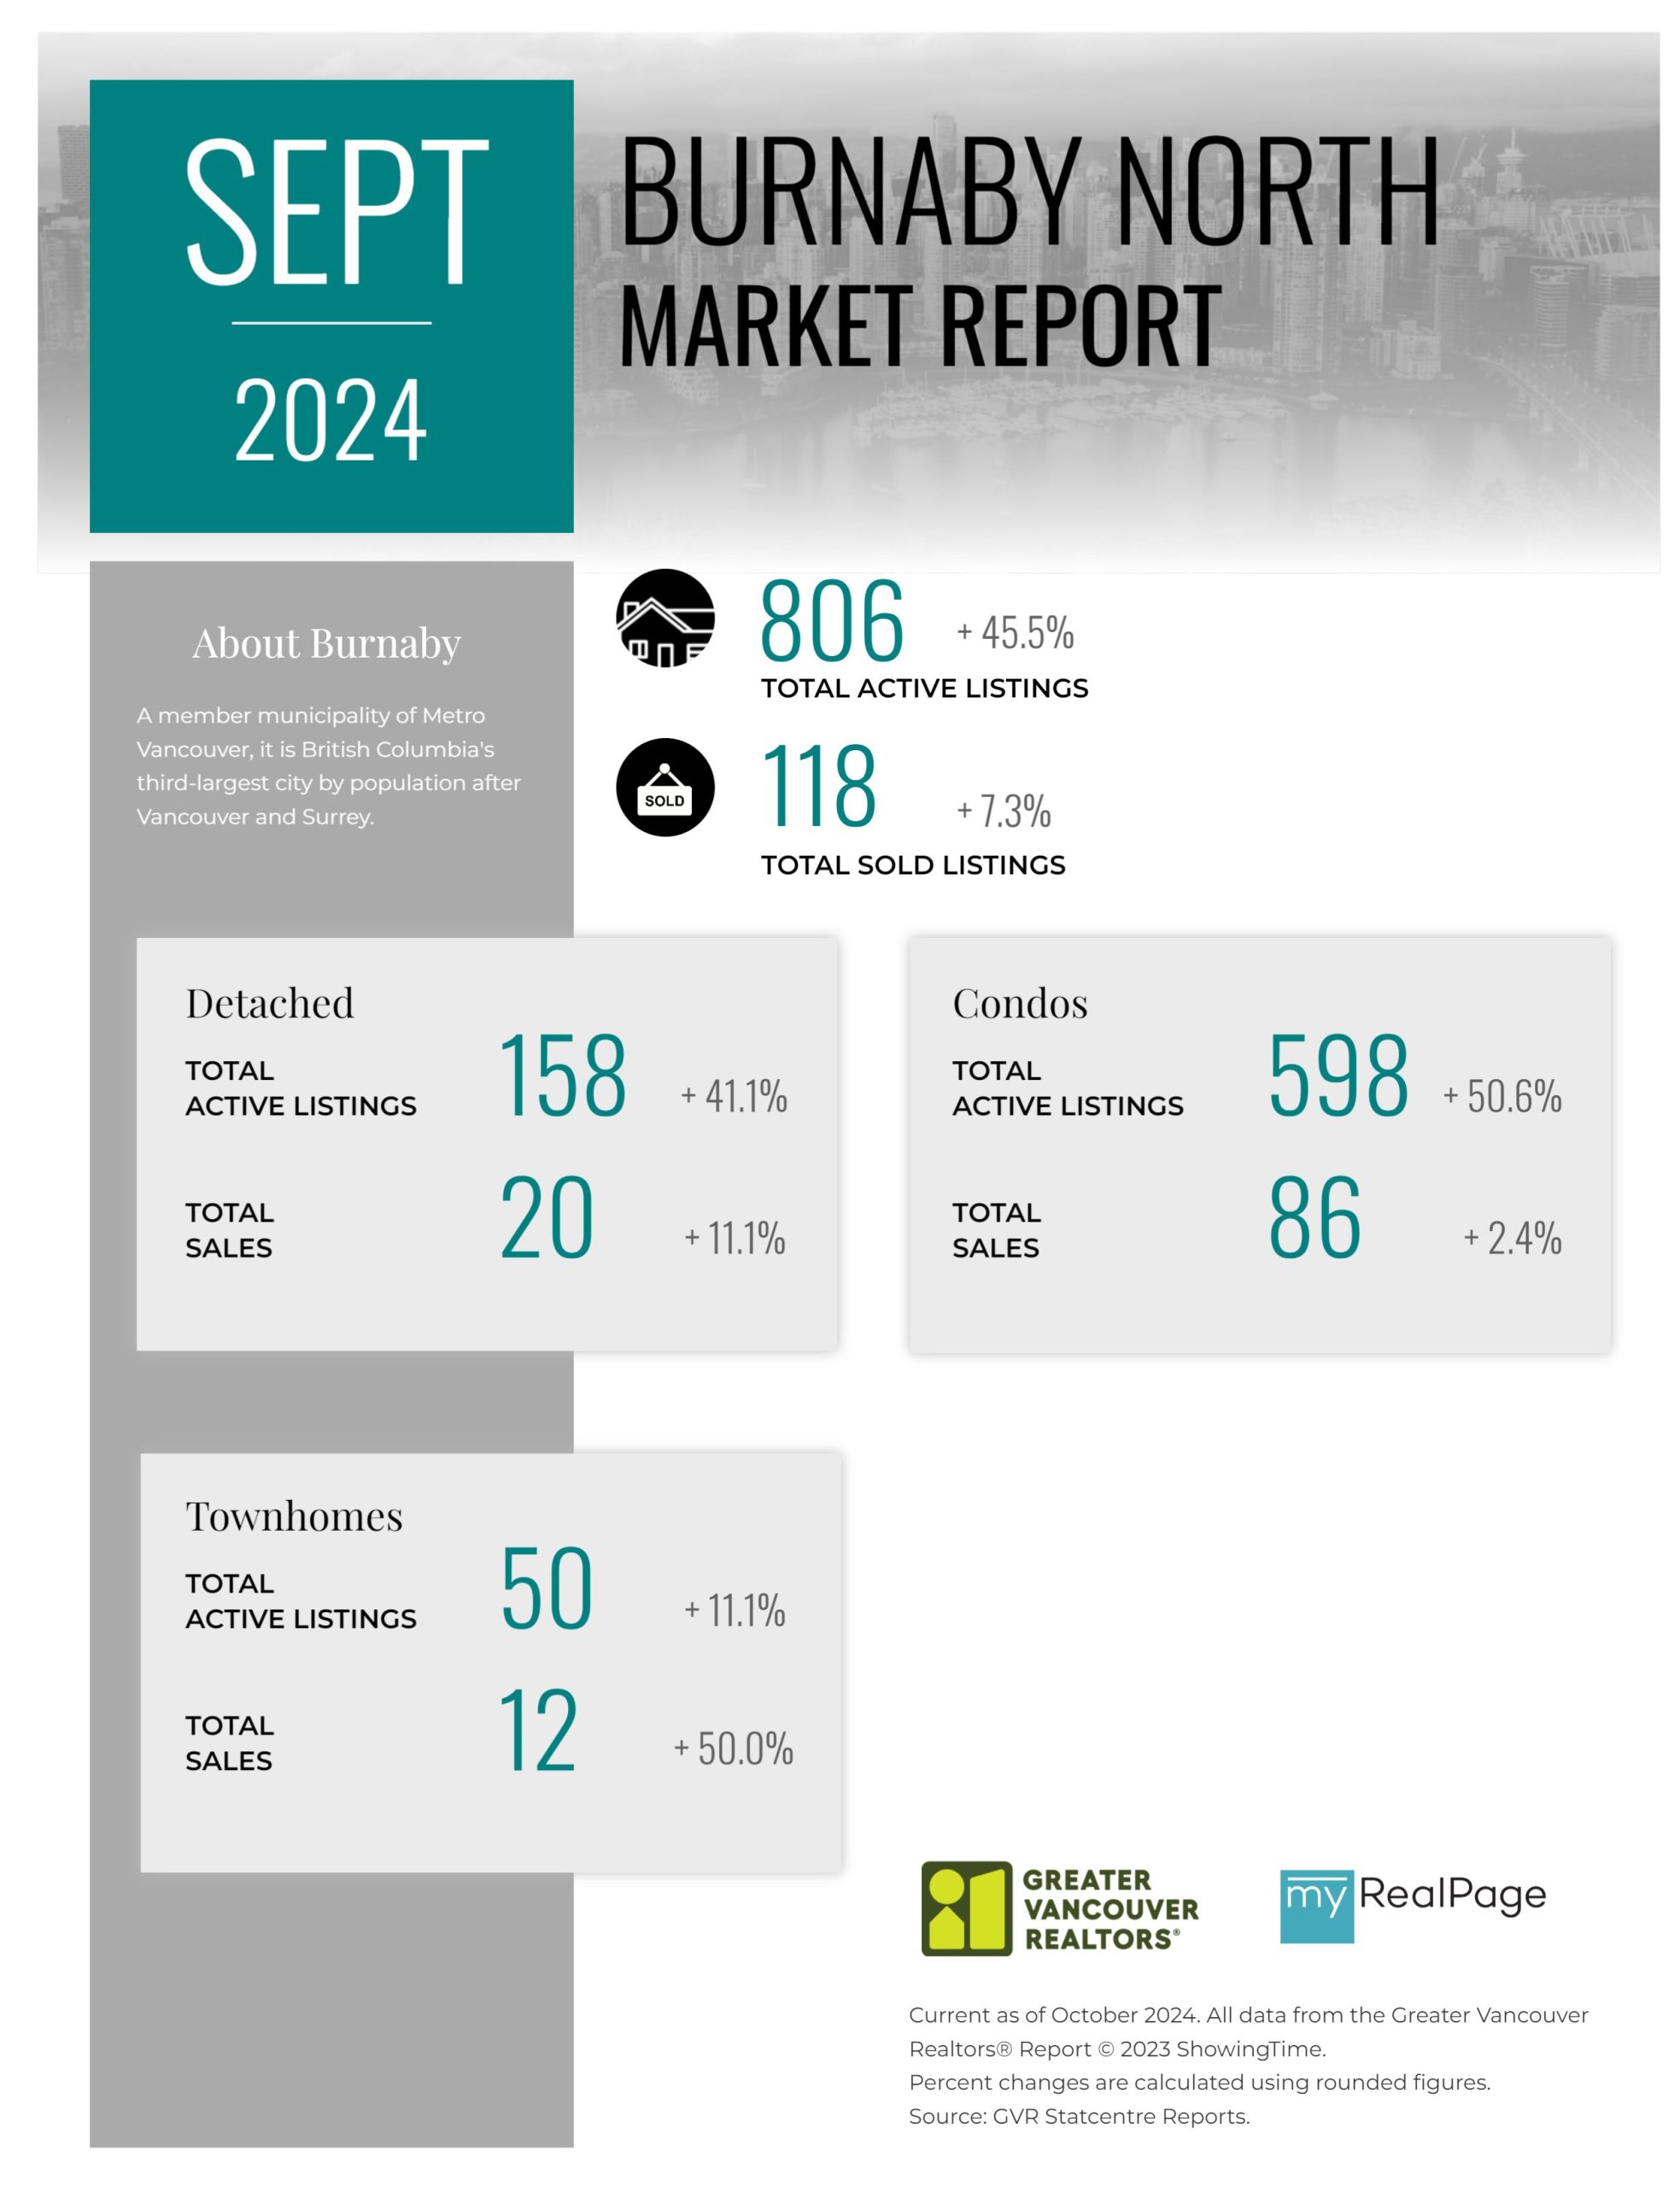
Printable Version – GVR September 2024 Data Infographic Report Burnaby North
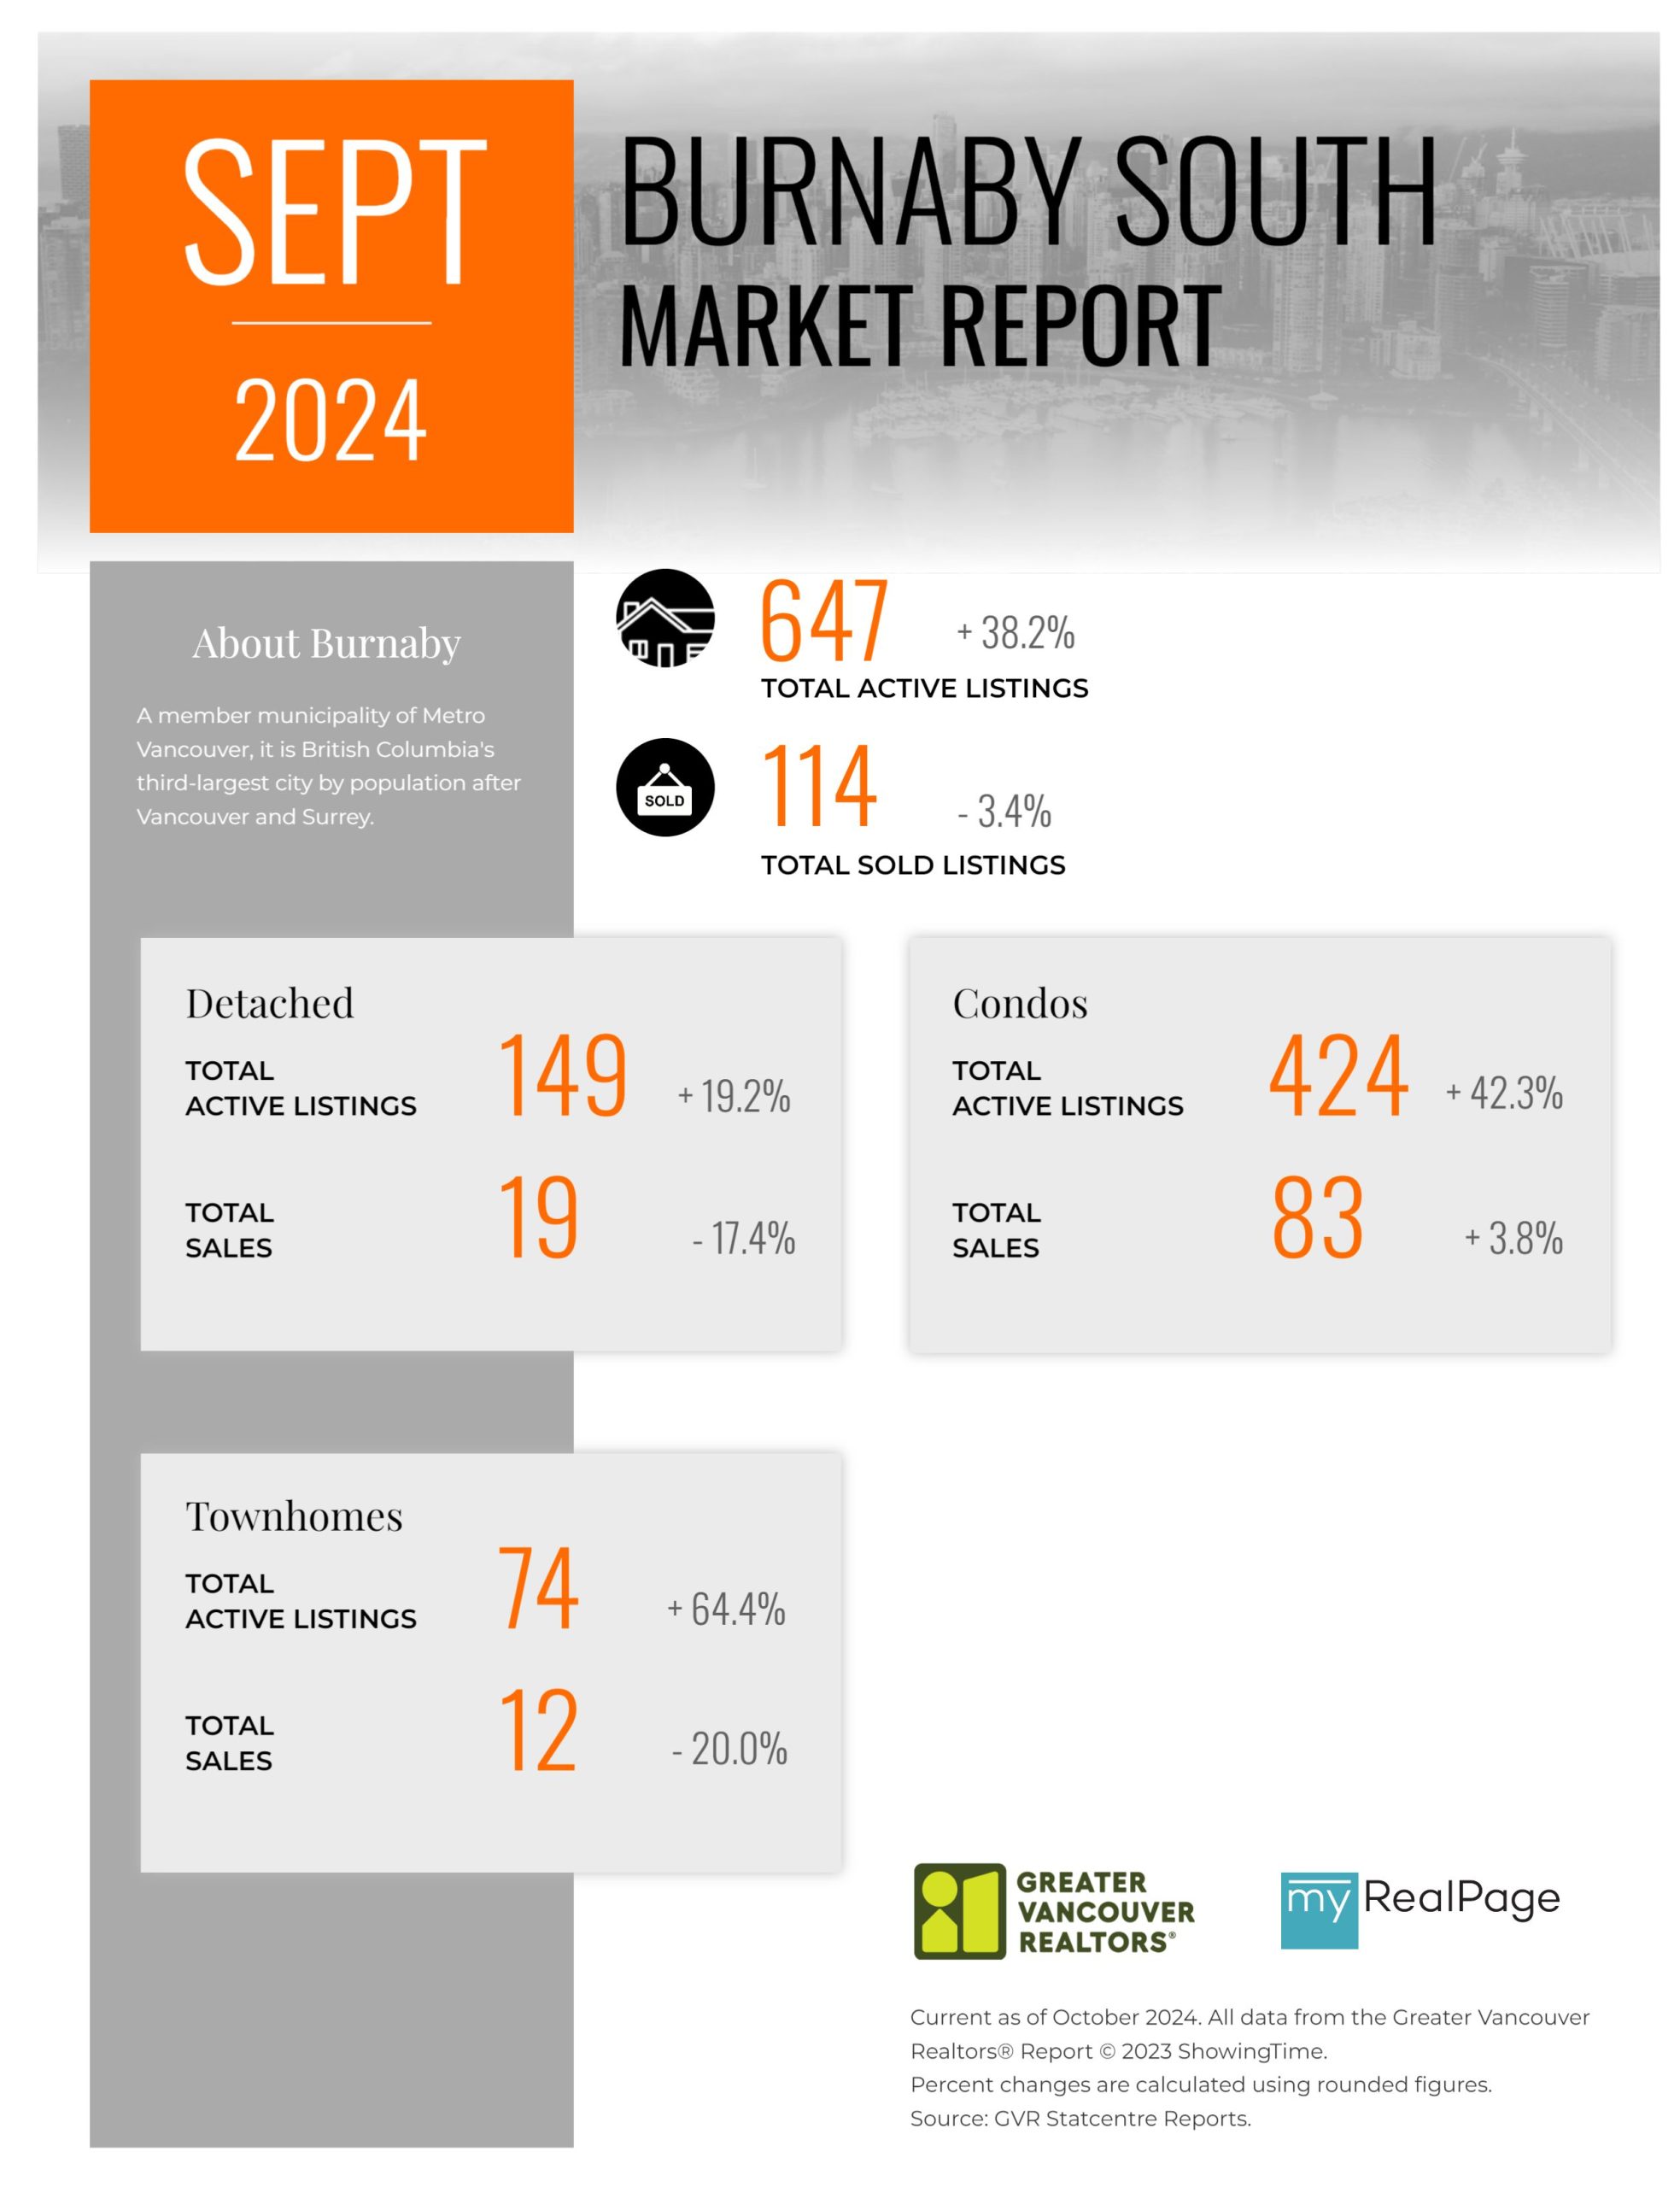
Printable Version – GVR September 2024 Data Infographics Report Burnaby South
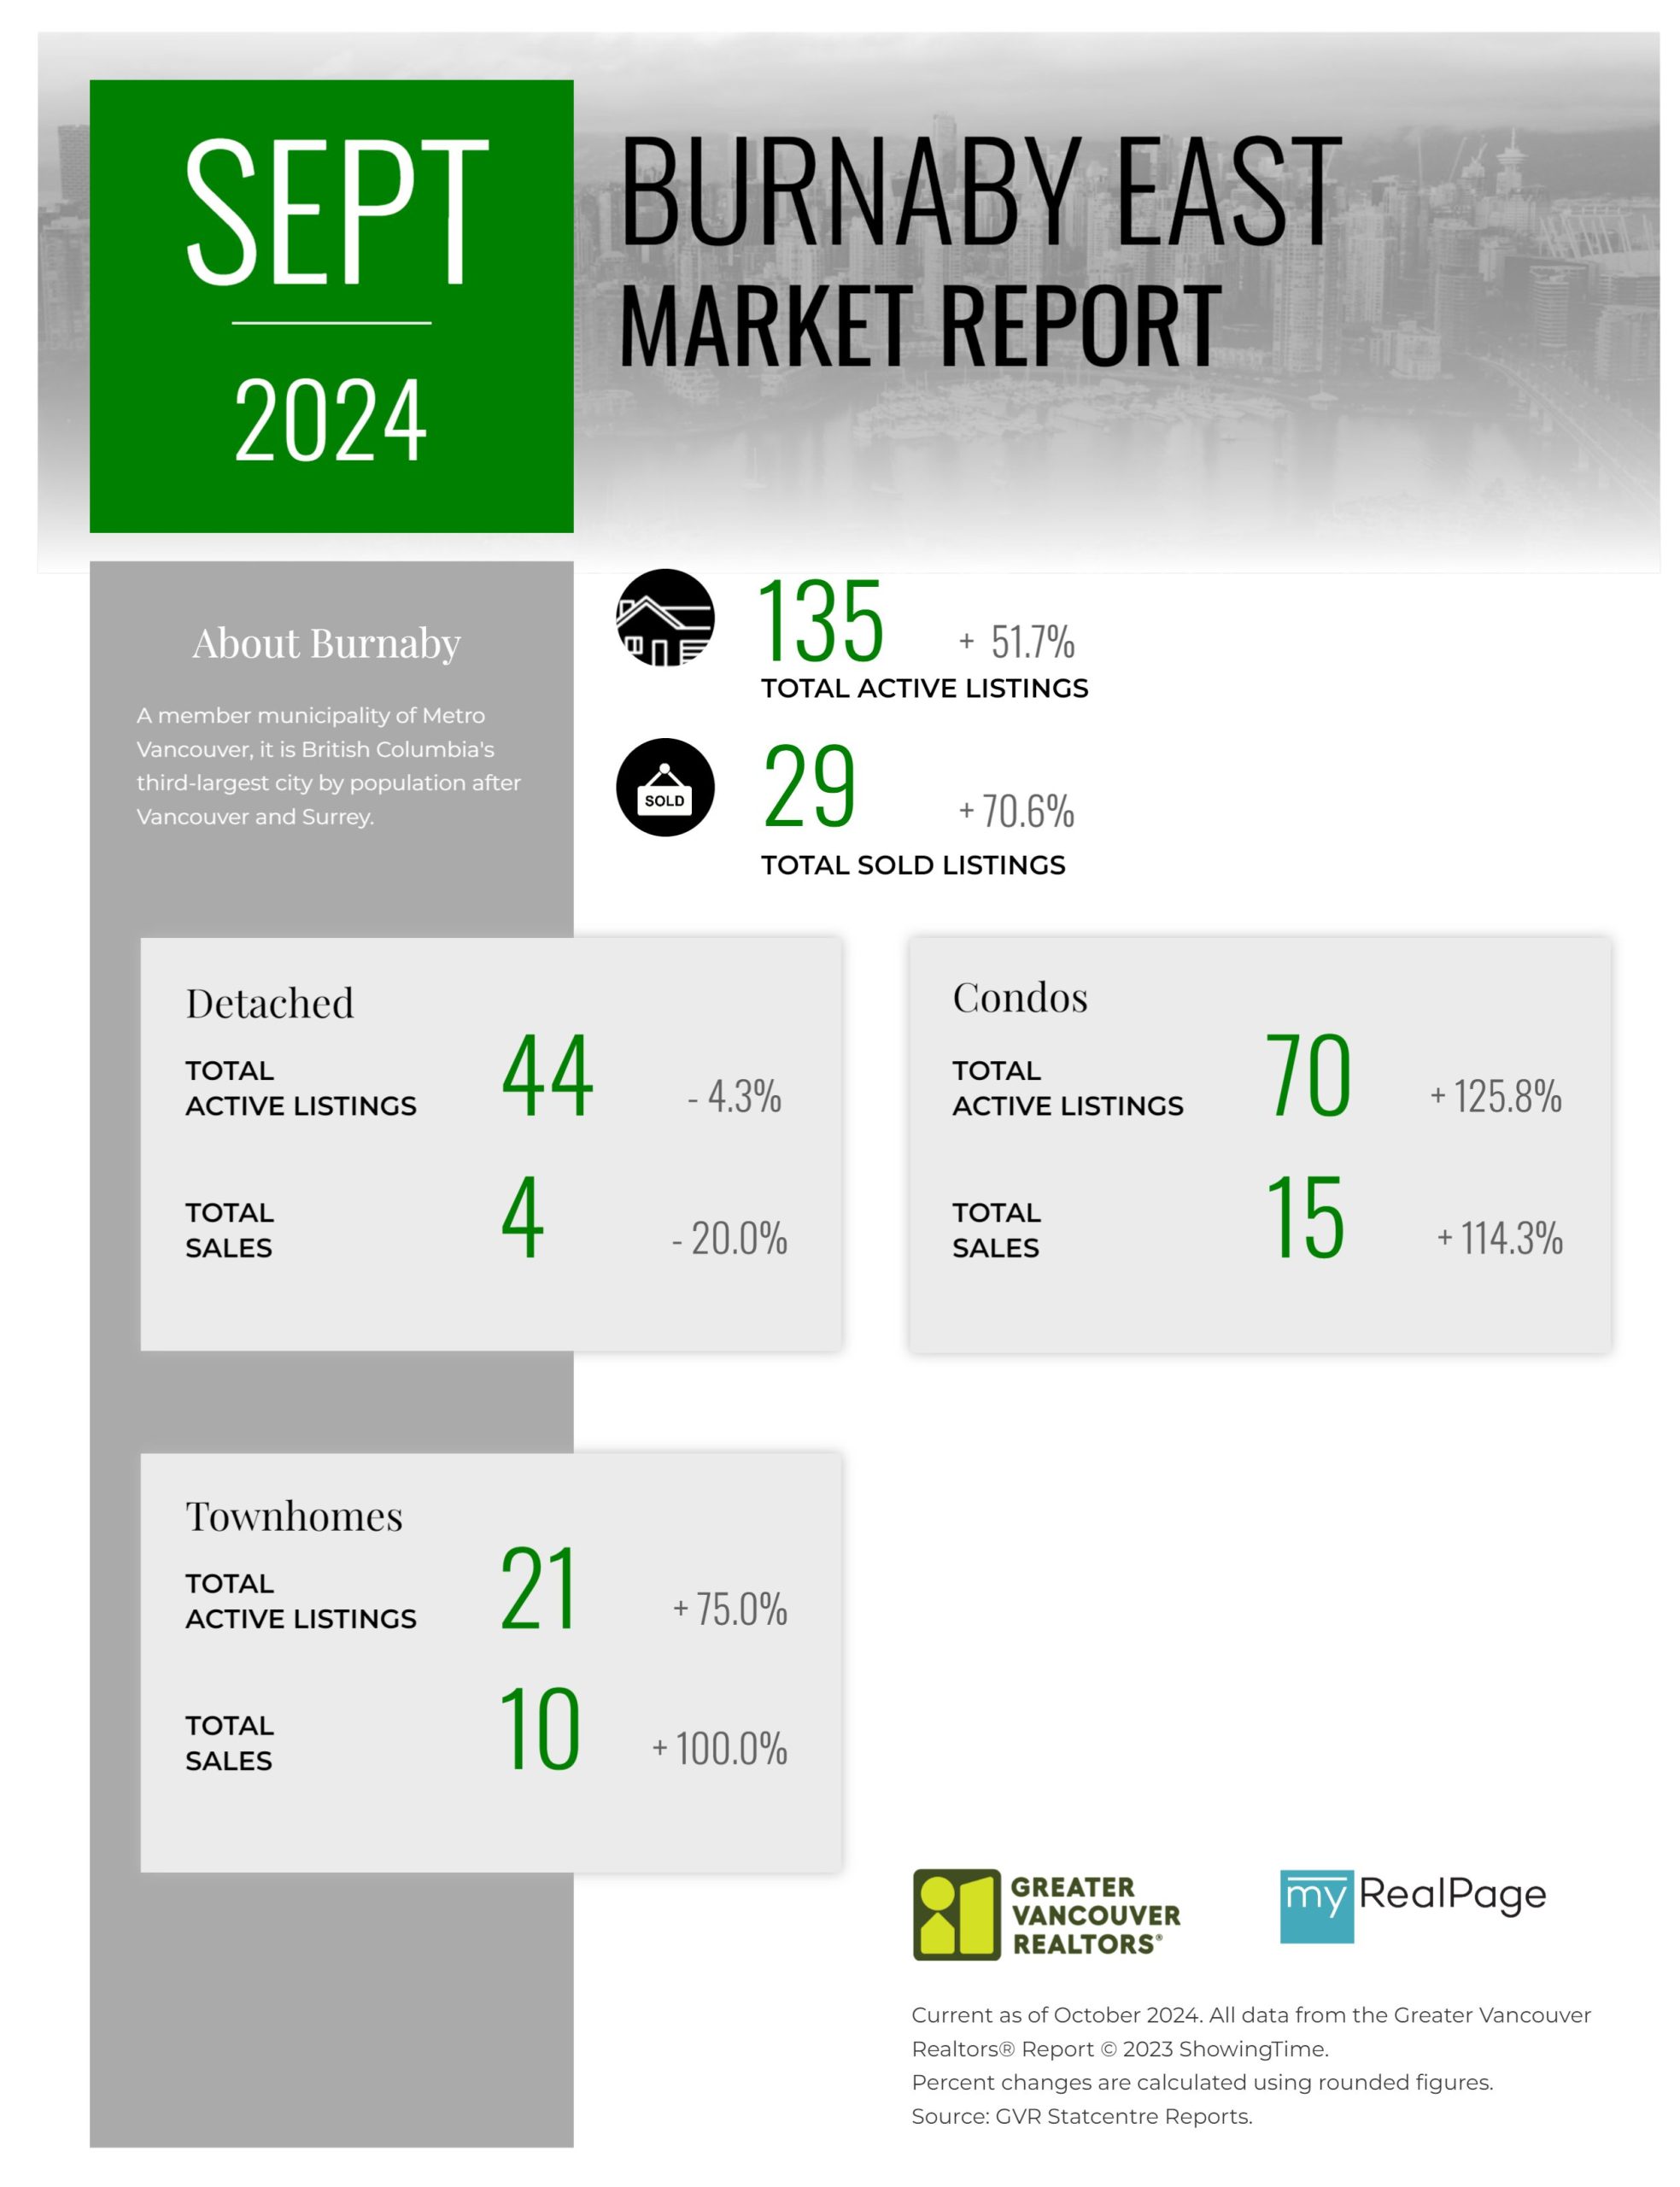
Printable Version – GVR September 2024 Data Infographics Report Burnaby East
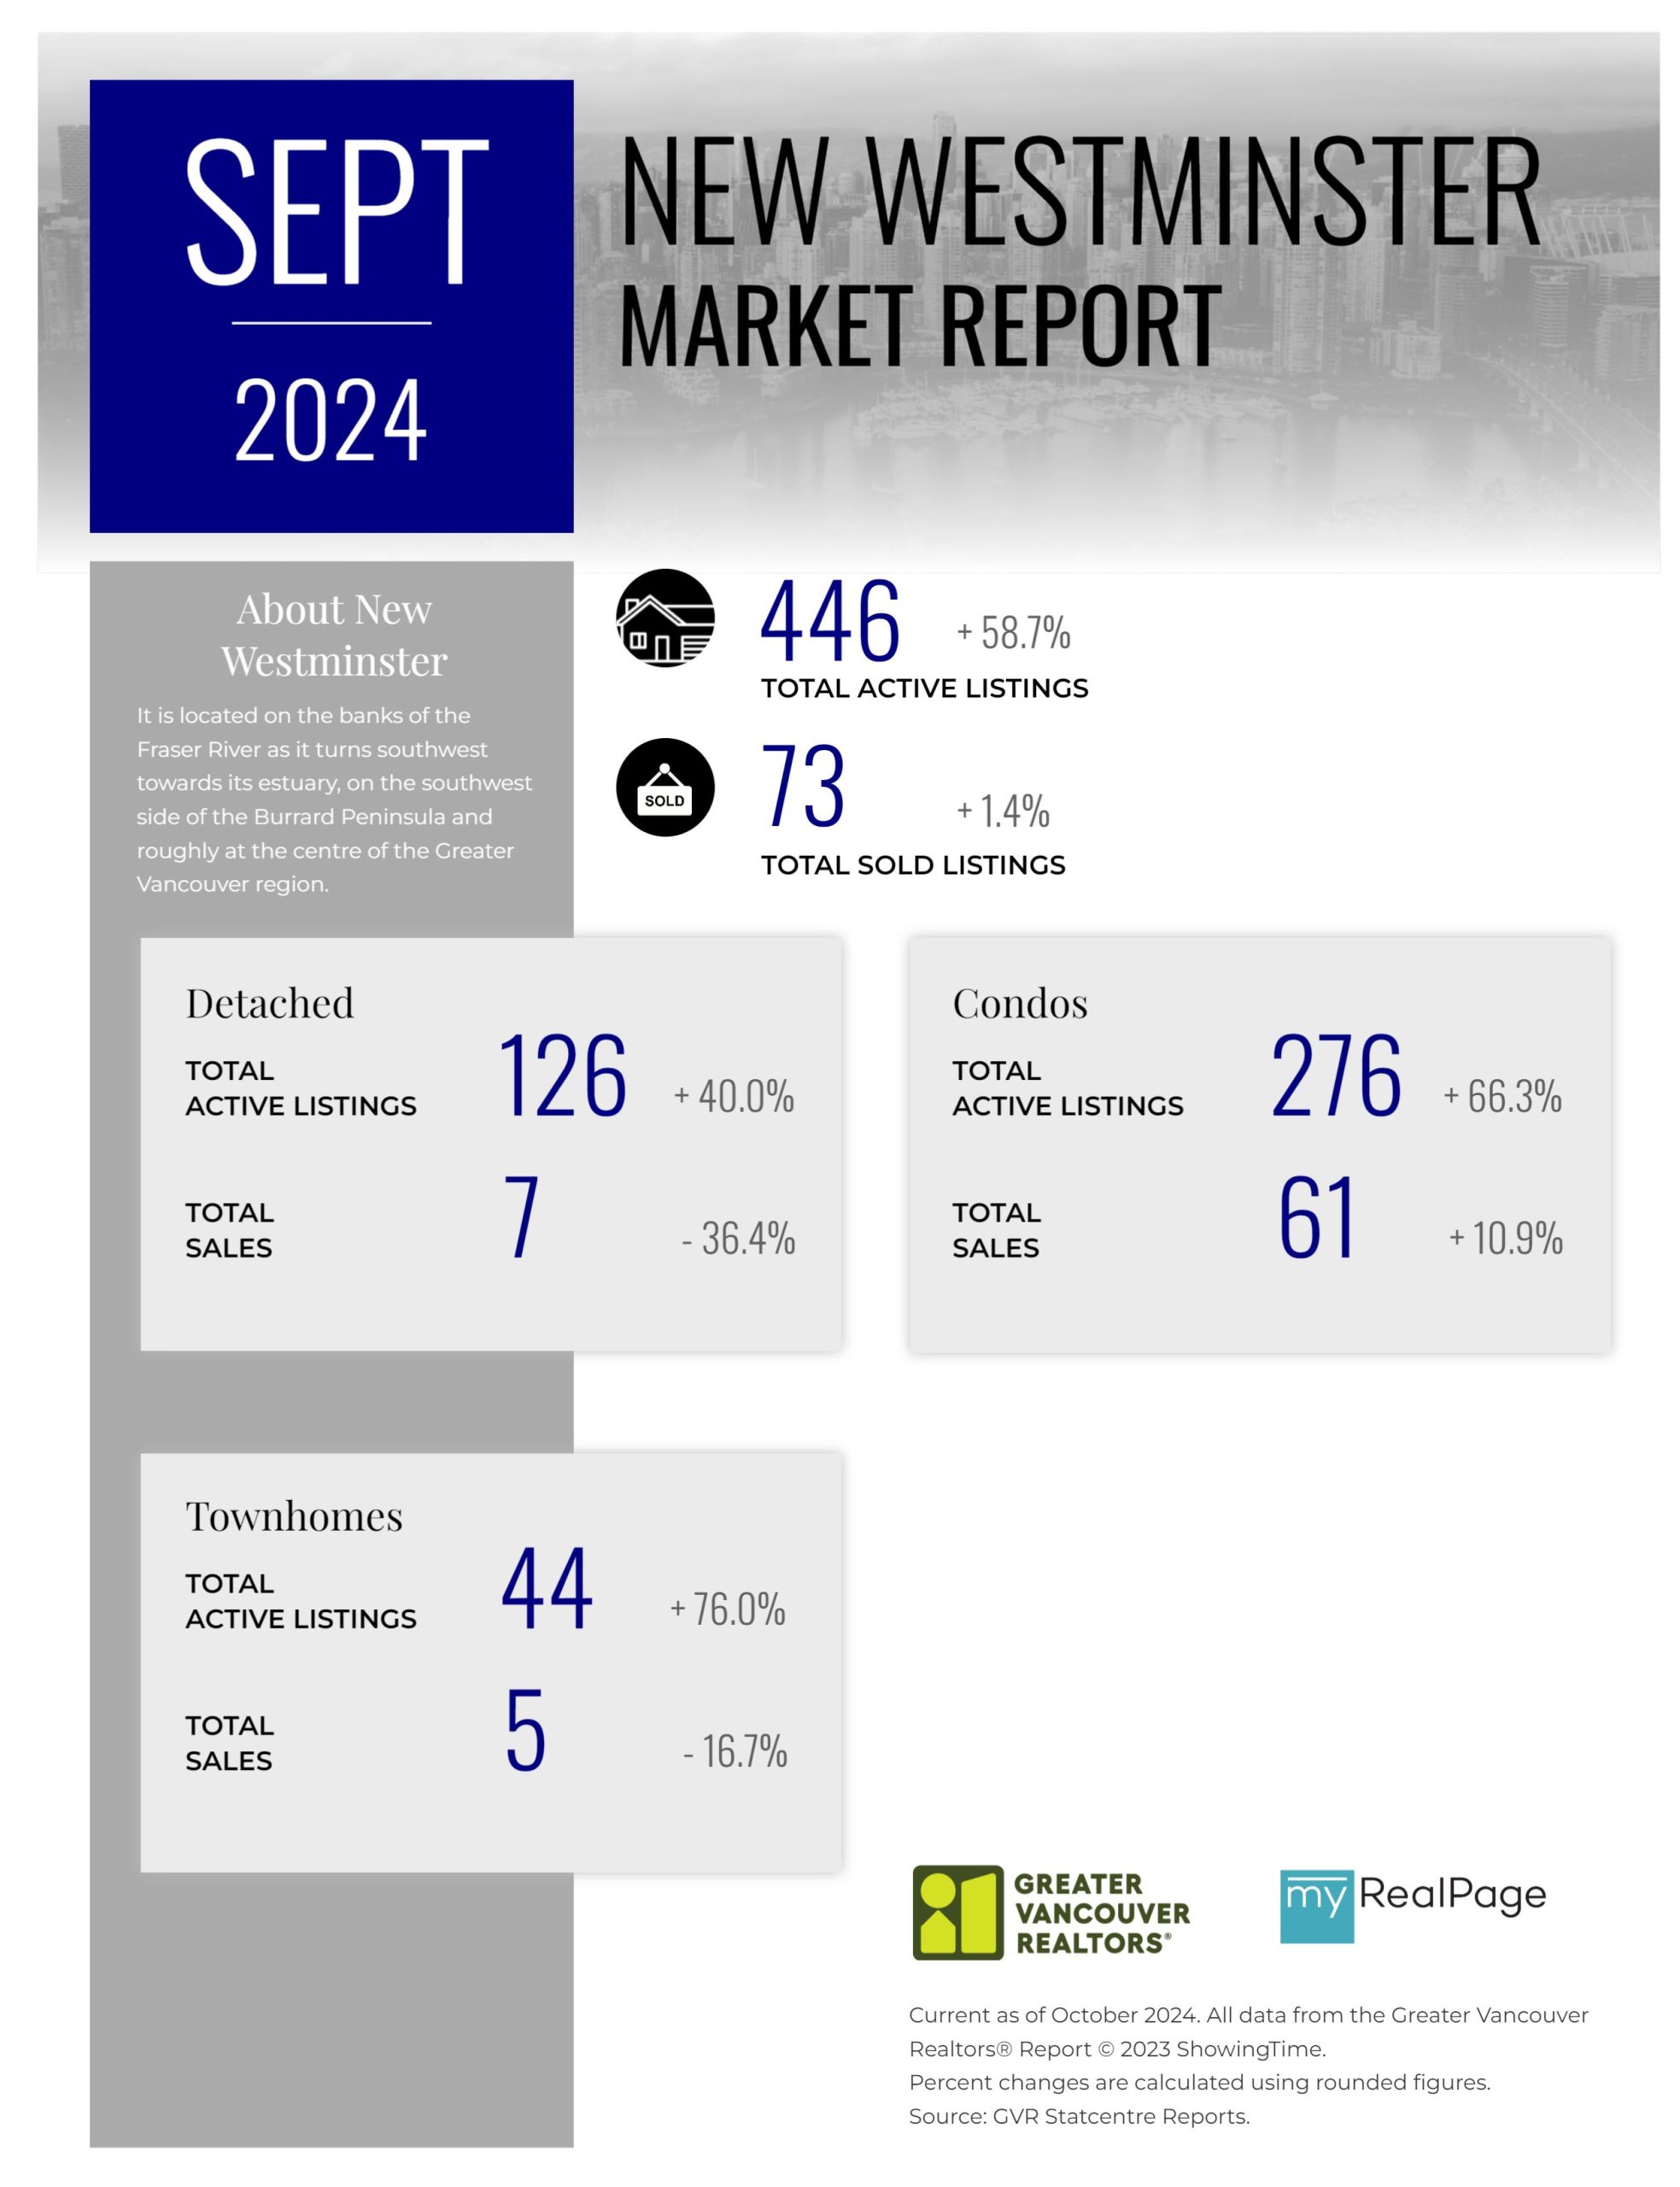
Printable Version – GVR September 2024 Data Infographics Report New Westminster
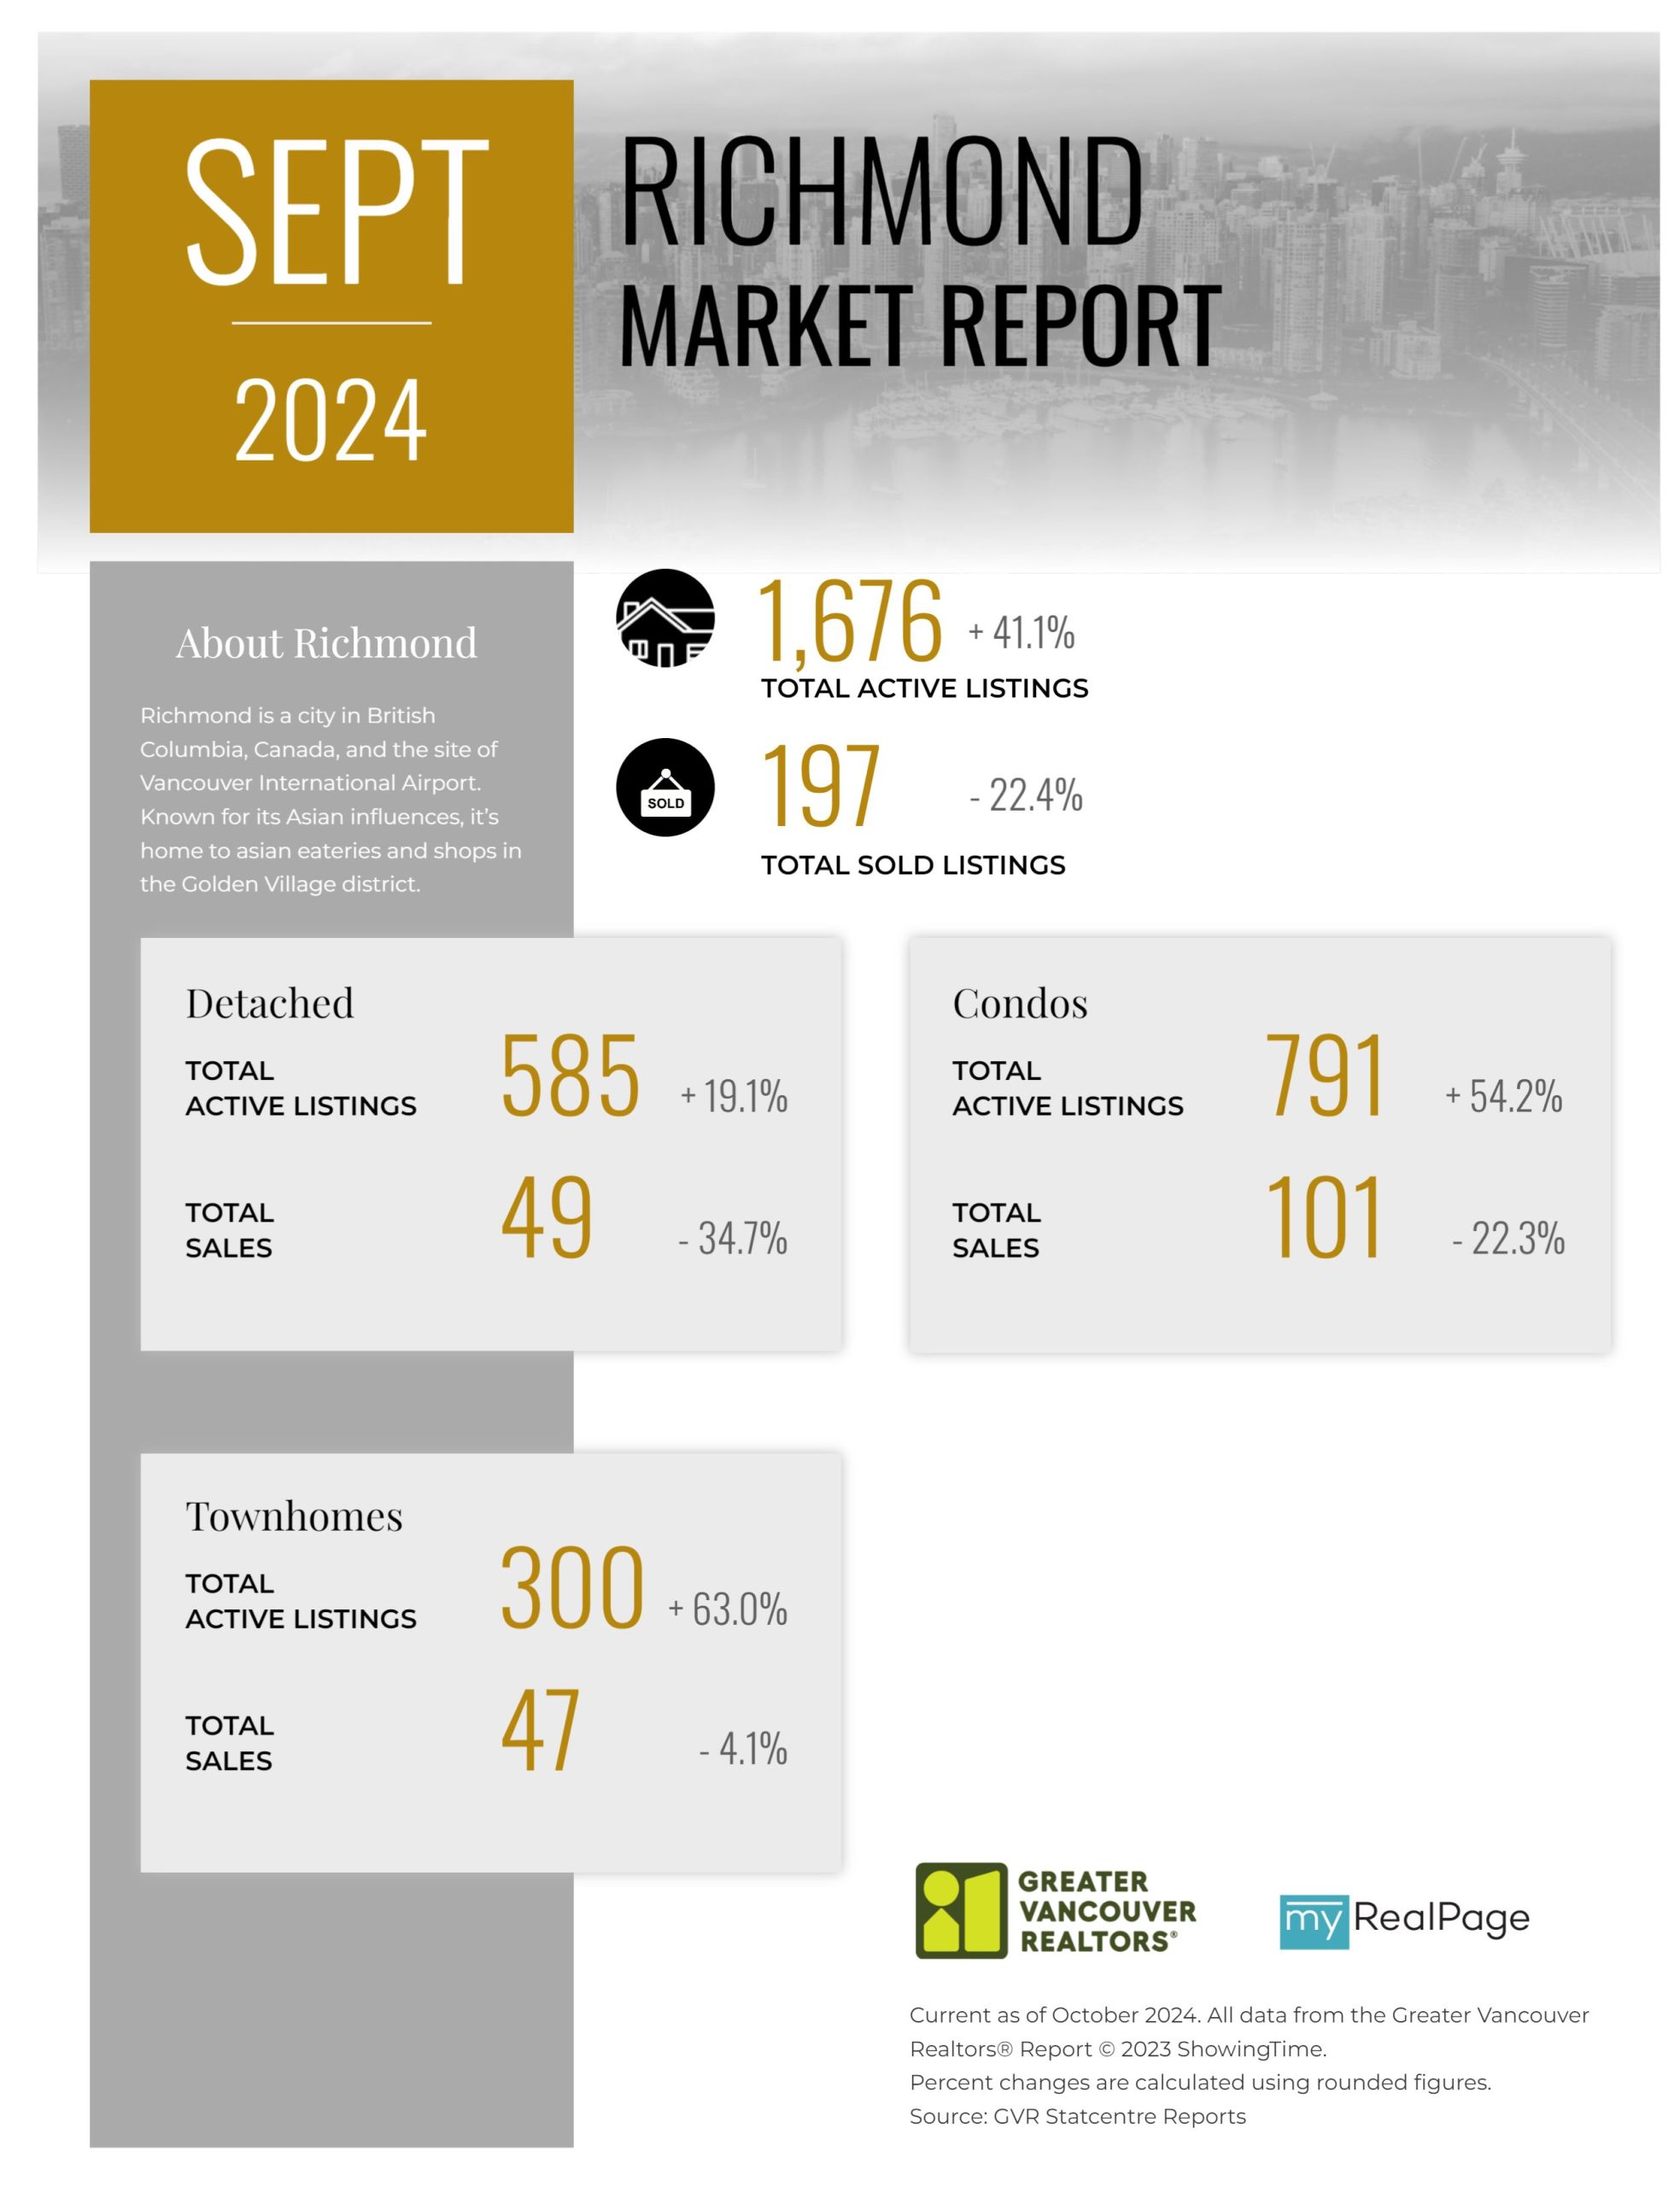
Printable Version – GVR September 2024 Data Infographics Report Richmond
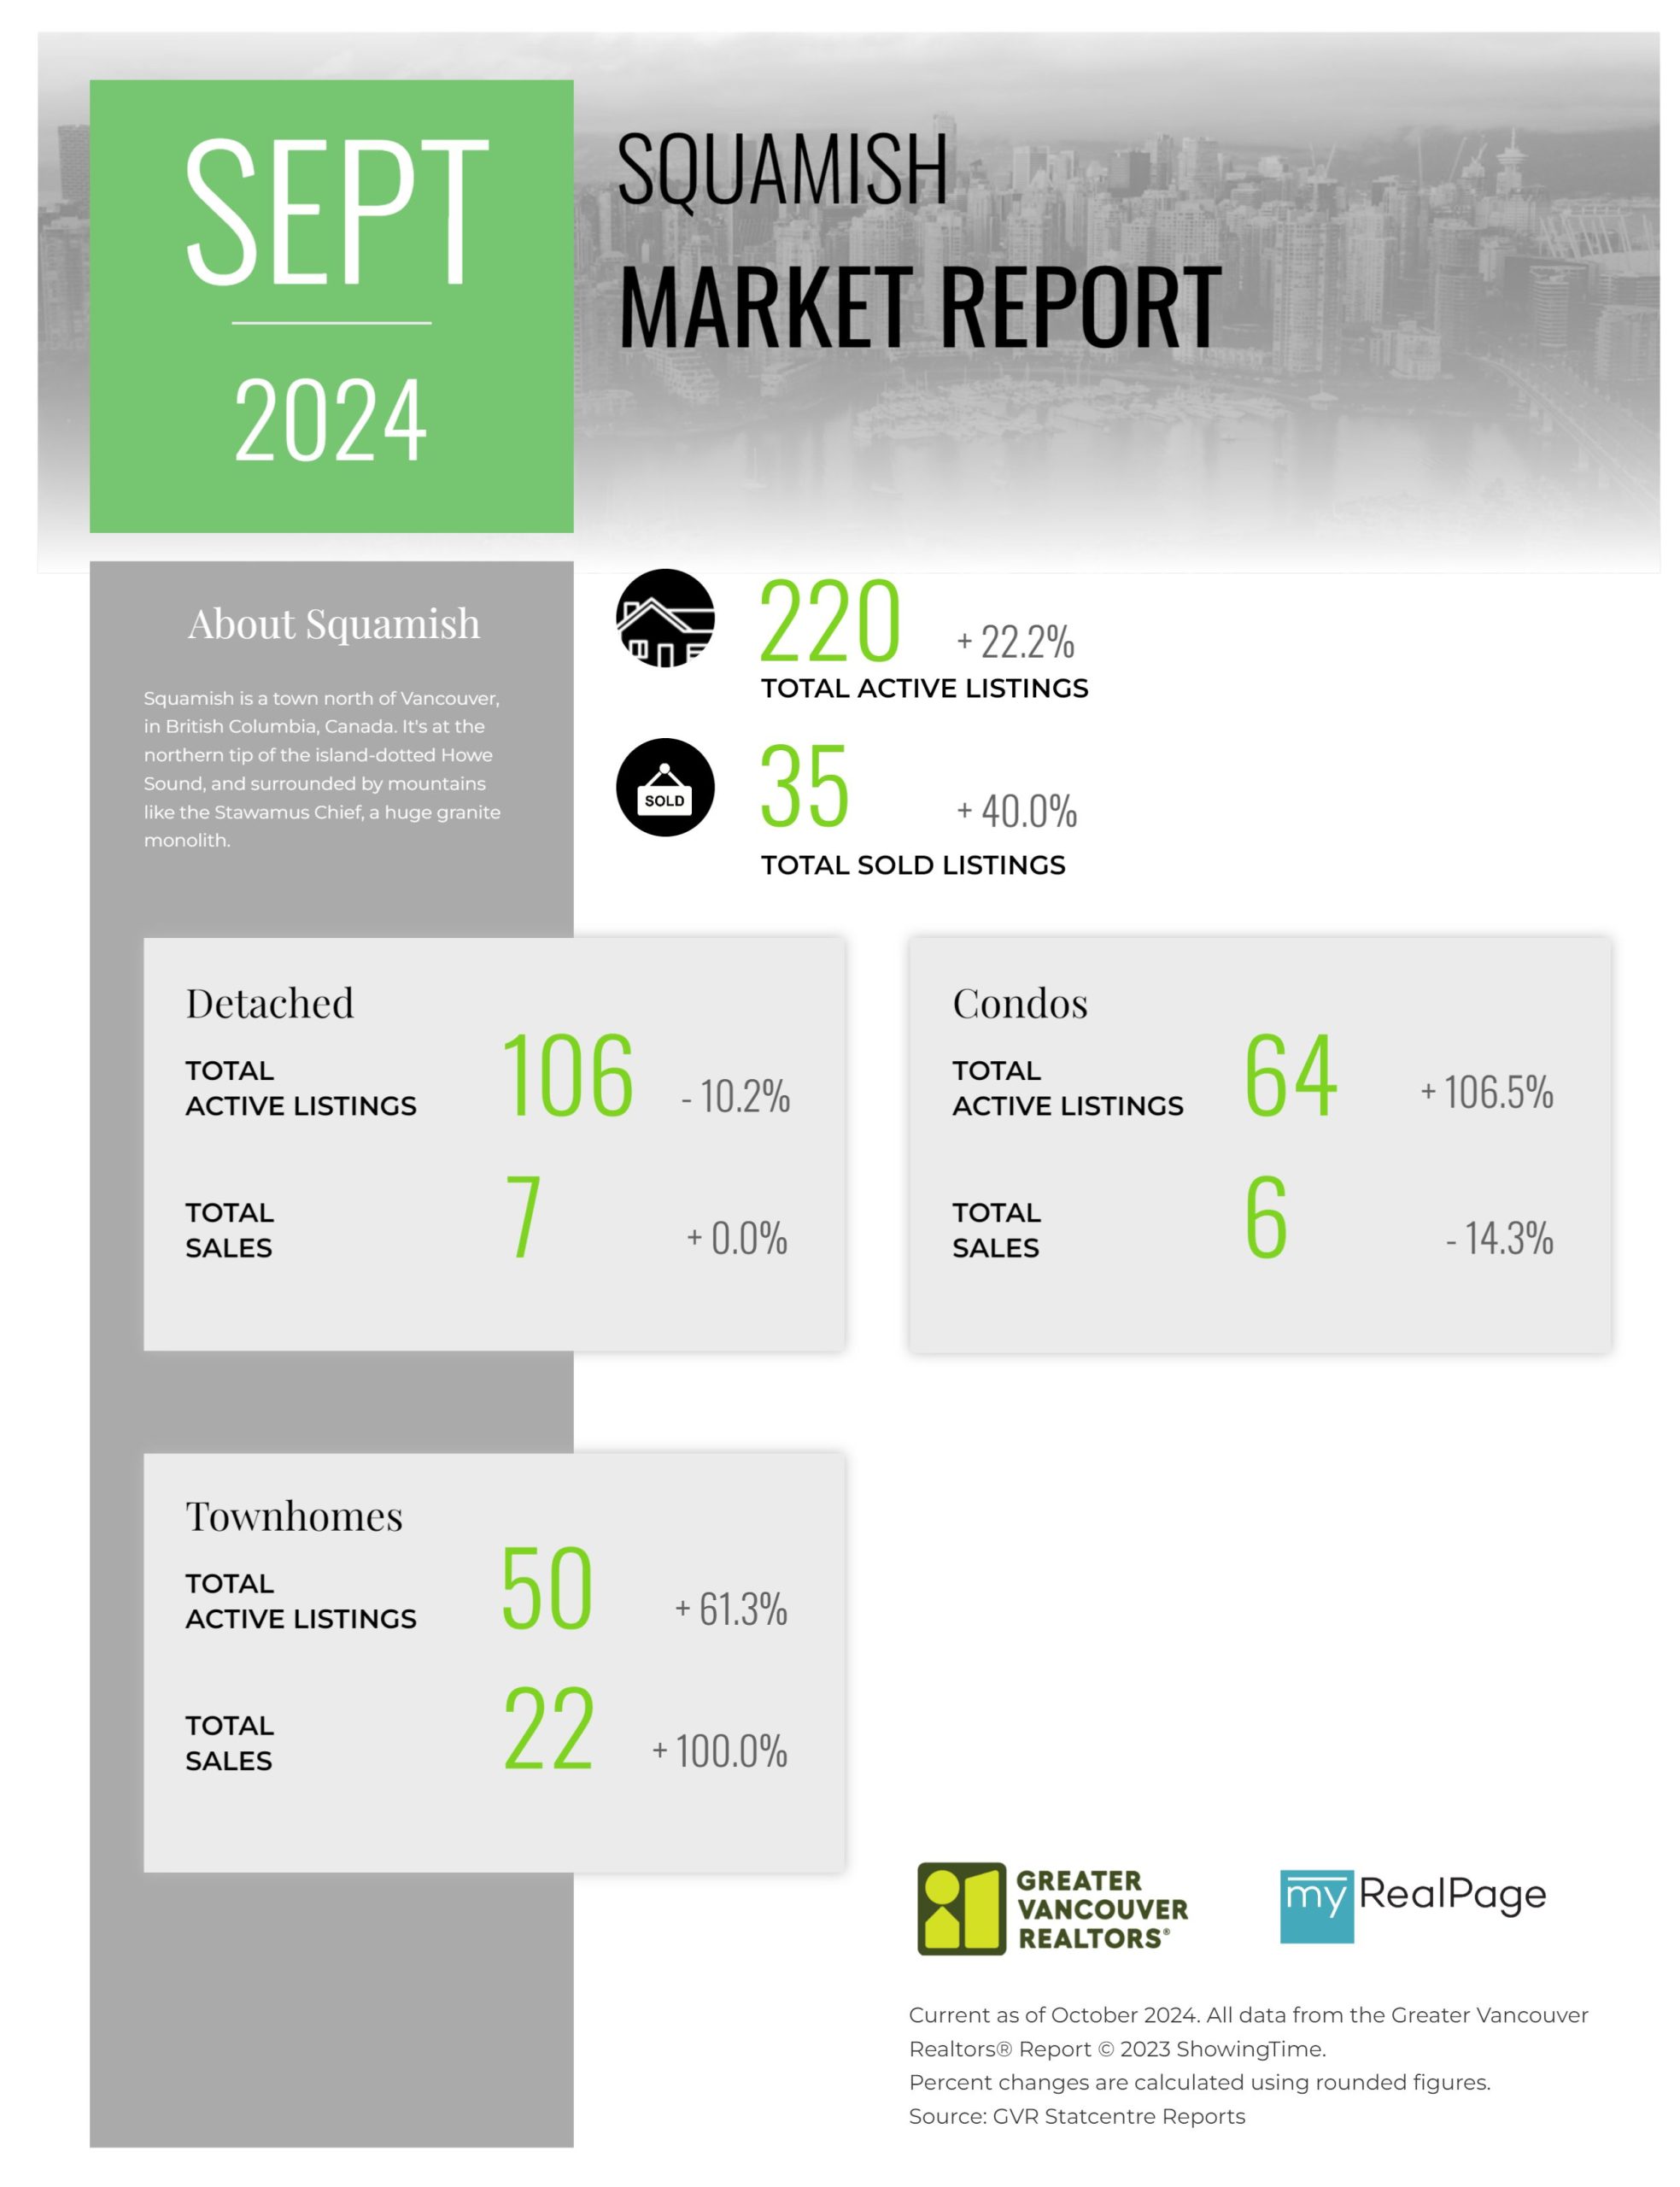
Printable Version – GVR September 2024 Data Infographics Report Squamish
Last Updated on October 9, 2024 by myRealPage
