INFOGRAPHICS: October 2023 REBGV Greater Vancouver Market Reports

Metro Vancouver housing market holds steady in October
An increase in newly listed properties is providing more choice to home buyers across Metro Vancouver, but sales remain below long-term averages.
The Real Estate Board of Greater Vancouver (REBGV) reports that residential sales in the region totalled 1,996 in October 2023, a 3.7 per cent increase from the 1,924 sales recorded in October 2022. This total is 29.5 per cent below the 10-year seasonal average (2,832) for October.
“With properties coming to market at a rate roughly five per cent above the ten-year seasonal average, there seems to be a continuation of the renewed interest on the part of sellers to participate in the market we’ve been watching this fall. Counterbalancing this increase in supply, however, is the fact sales remain almost 30 per cent below their ten-year seasonal average, which tells us demand is not as strong as we might expect this time of year.”
Andrew Lis, REBGV director of economics and data analytics
Read the full report on the REBGV website!
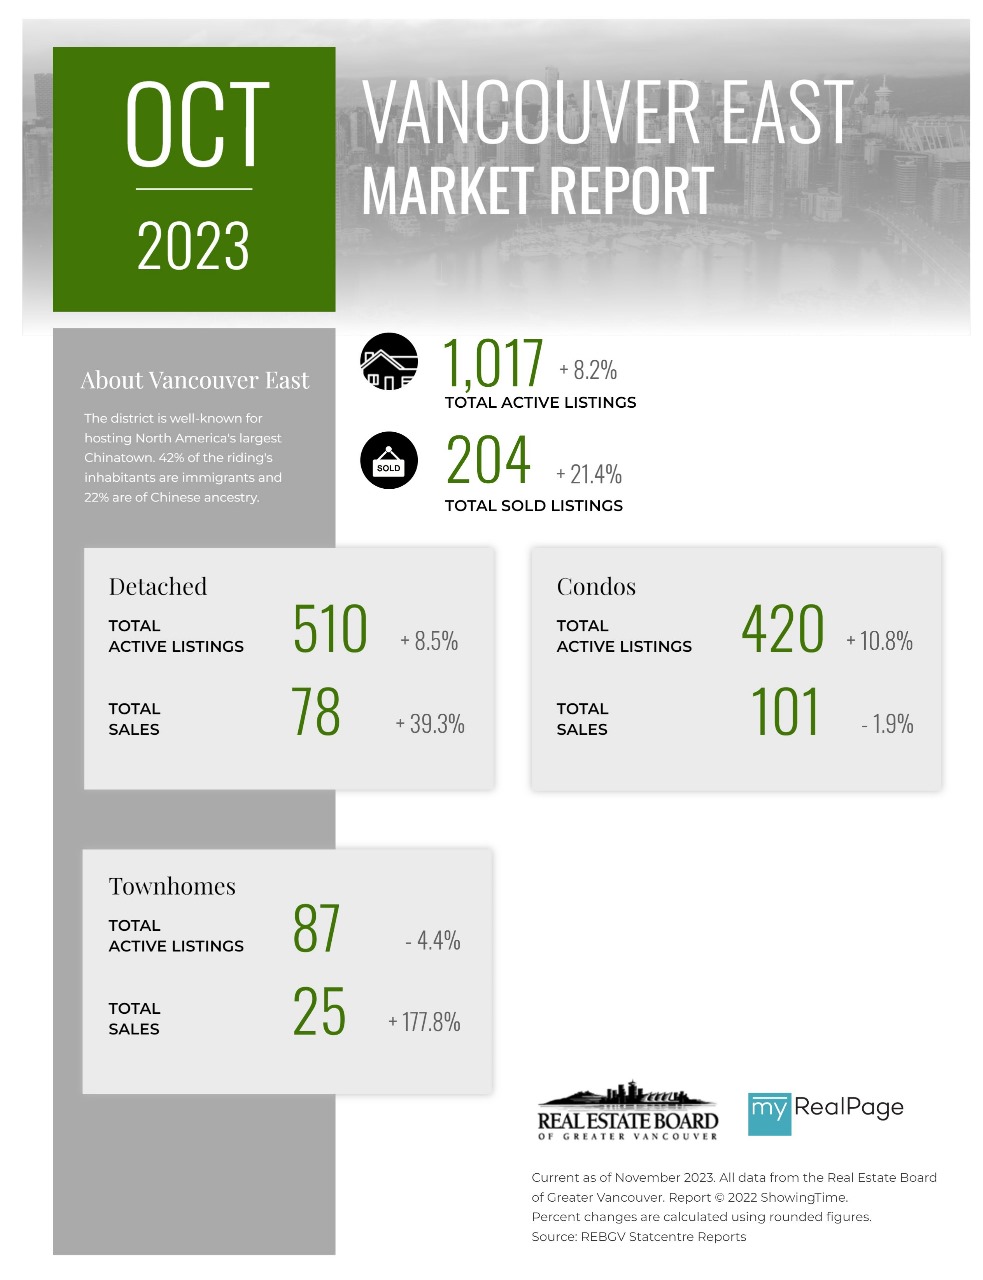
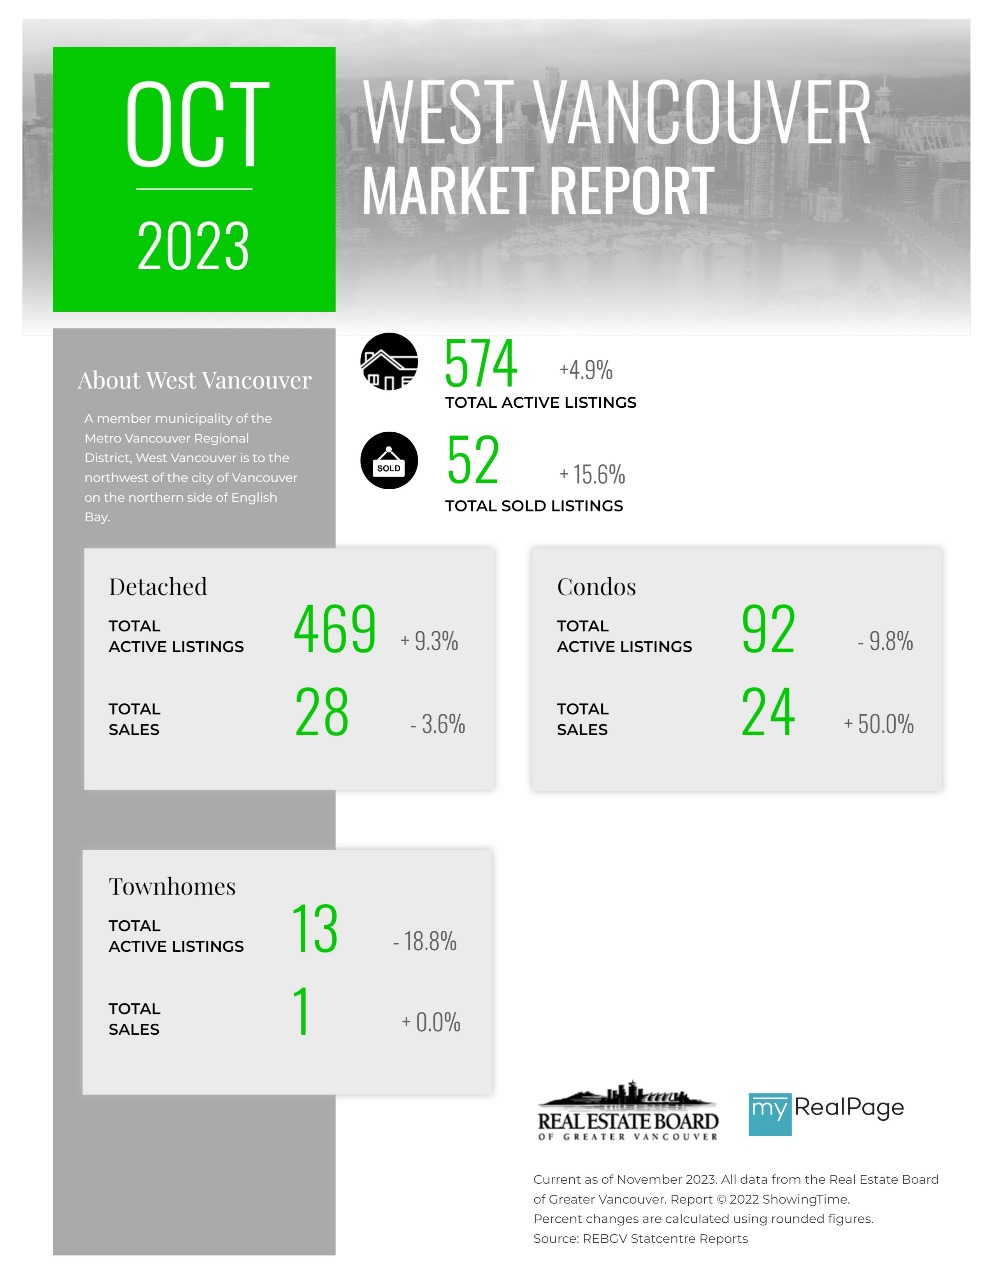
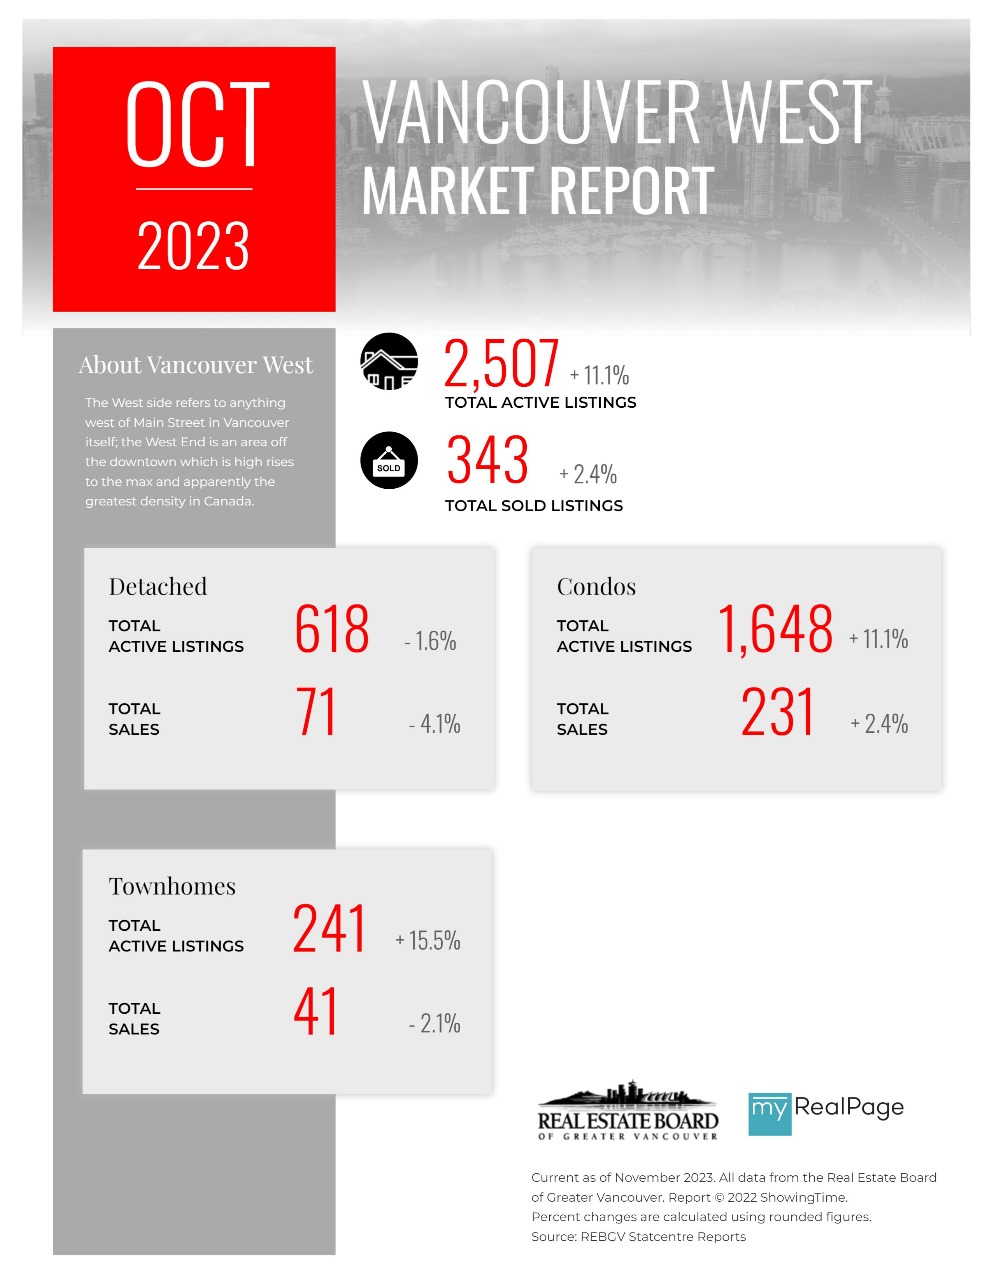
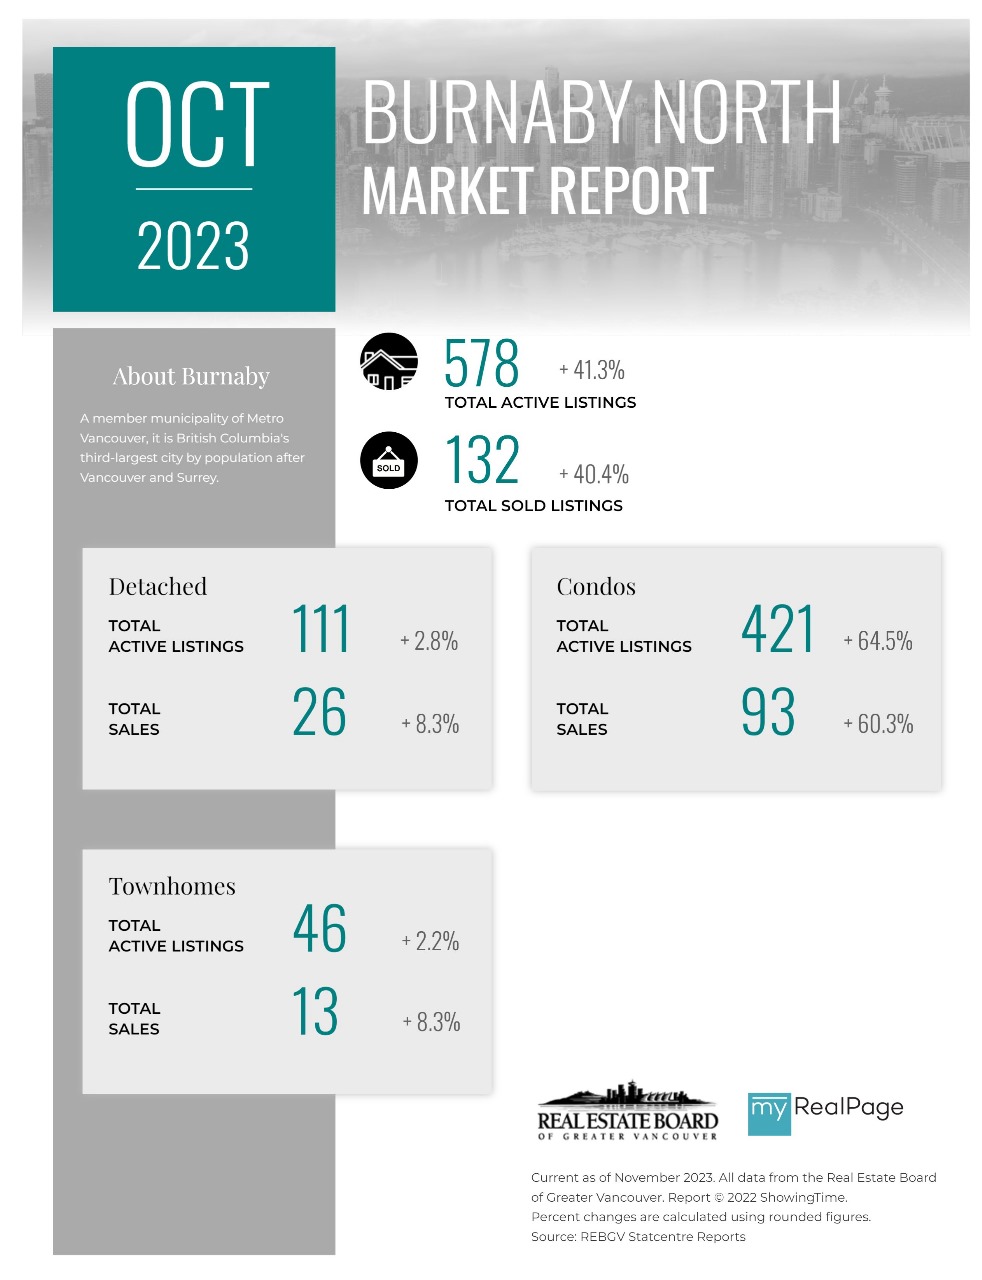
The following data is a comparison between October 2023 and October 2022 numbers, and is current as of November 2023. For last month’s update, you can check out our previous post!
Or follow this link for all our REBGV Infographics!
These infographics cover current trends in several areas within the Greater Vancouver region. Click on the images for a larger view!
Printable Version – REBGV October 2023 Data Infographic Report North Vancouver
Printable Version – REBGV October 2023 Data Infographics Report West Vancouver
Printable Version – REBGV October 2023 Data Infographics Report Vancouver West
Printable Version – REBGV October 2023 Data Infographics Report Vancouver East
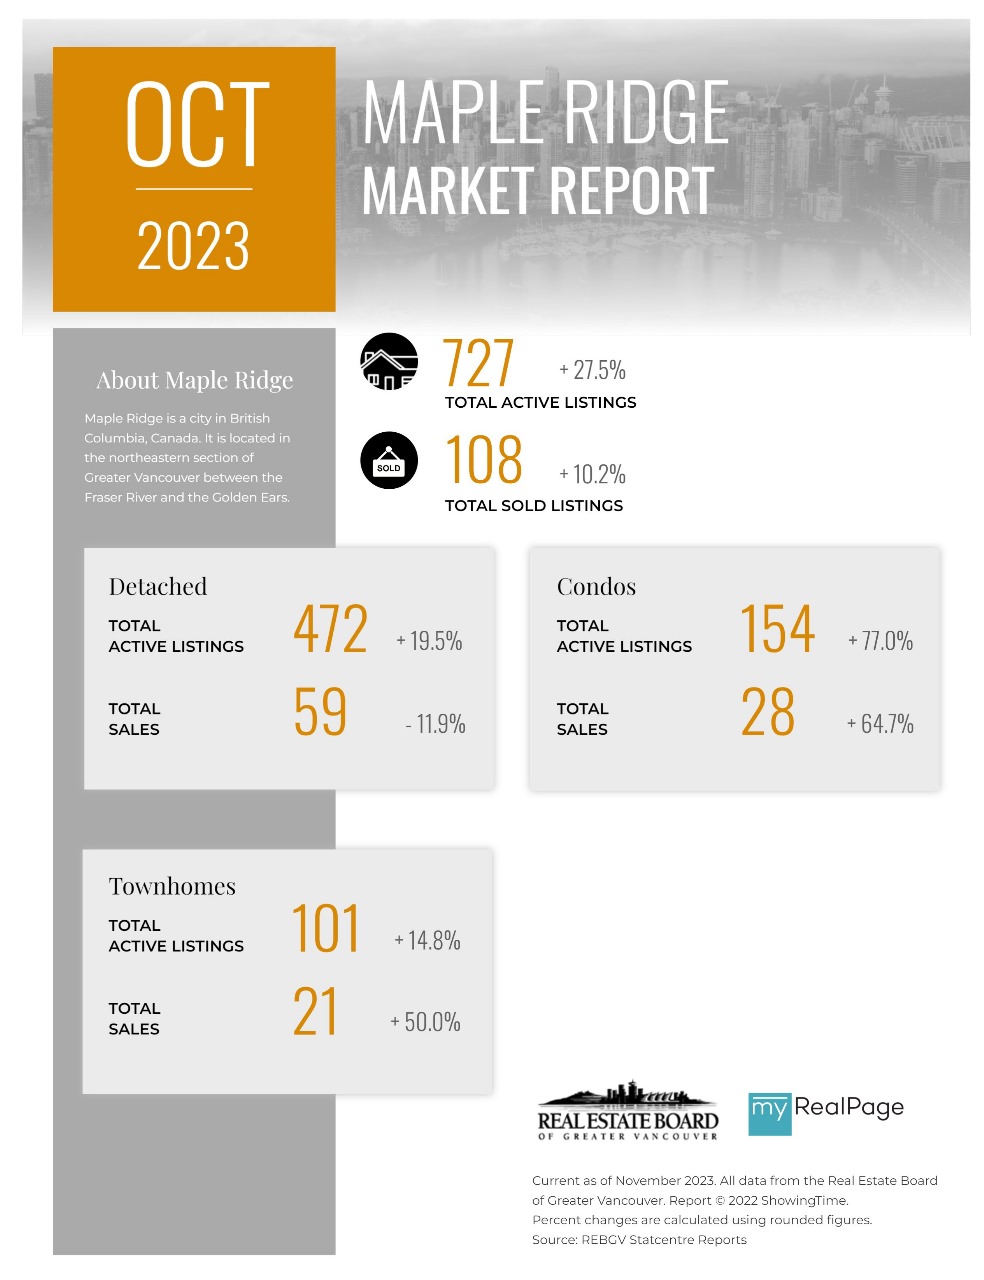
Printable Version – REBGV October 2023 Data Infographic Report Maple Ridge
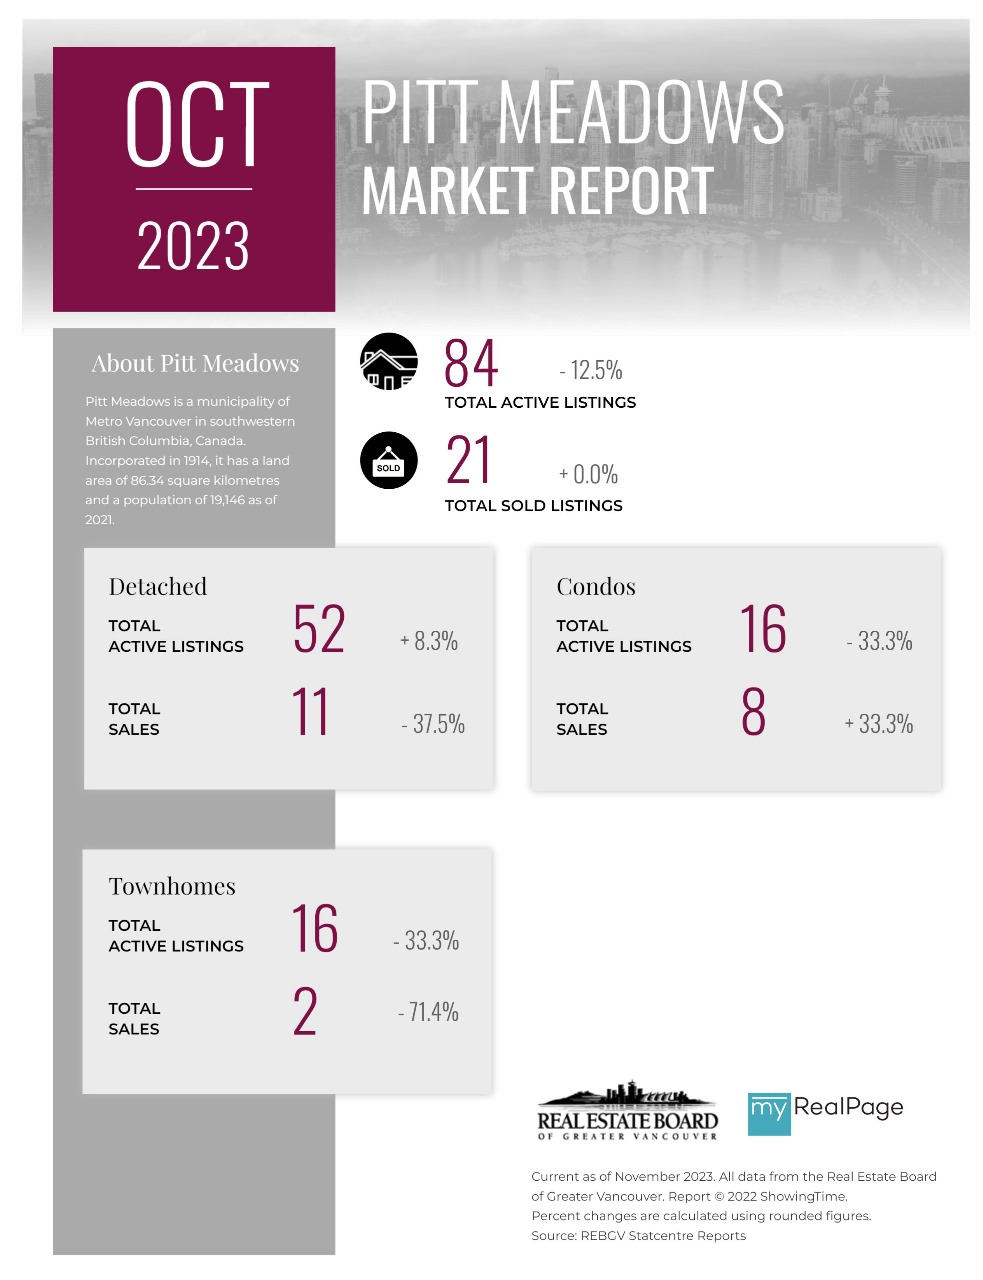
Printable Version – REBGV October 2023 Data Infographics Report Pitt Meadows
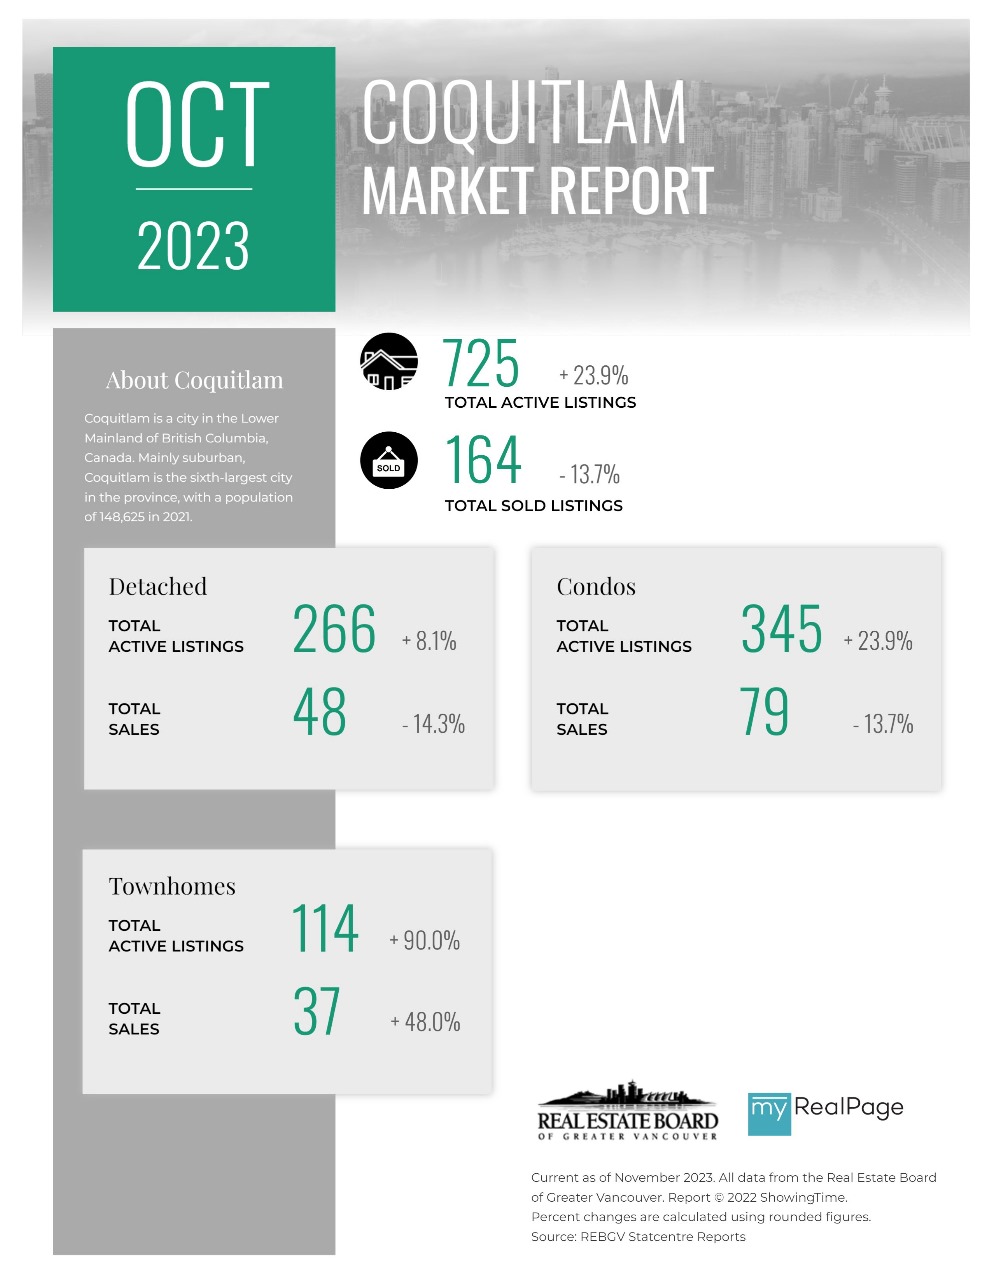
Printable Version – REBGV October 2023 Data Infographics Report Coquitlam
Printable Version – REBGV October 2023 Data Infographics Report Port Coquitlam
Printable Version – REBGV October 2023 Data Infographic Report Burnaby North
Printable Version – REBGV October 2023 Data Infographics Report Burnaby South
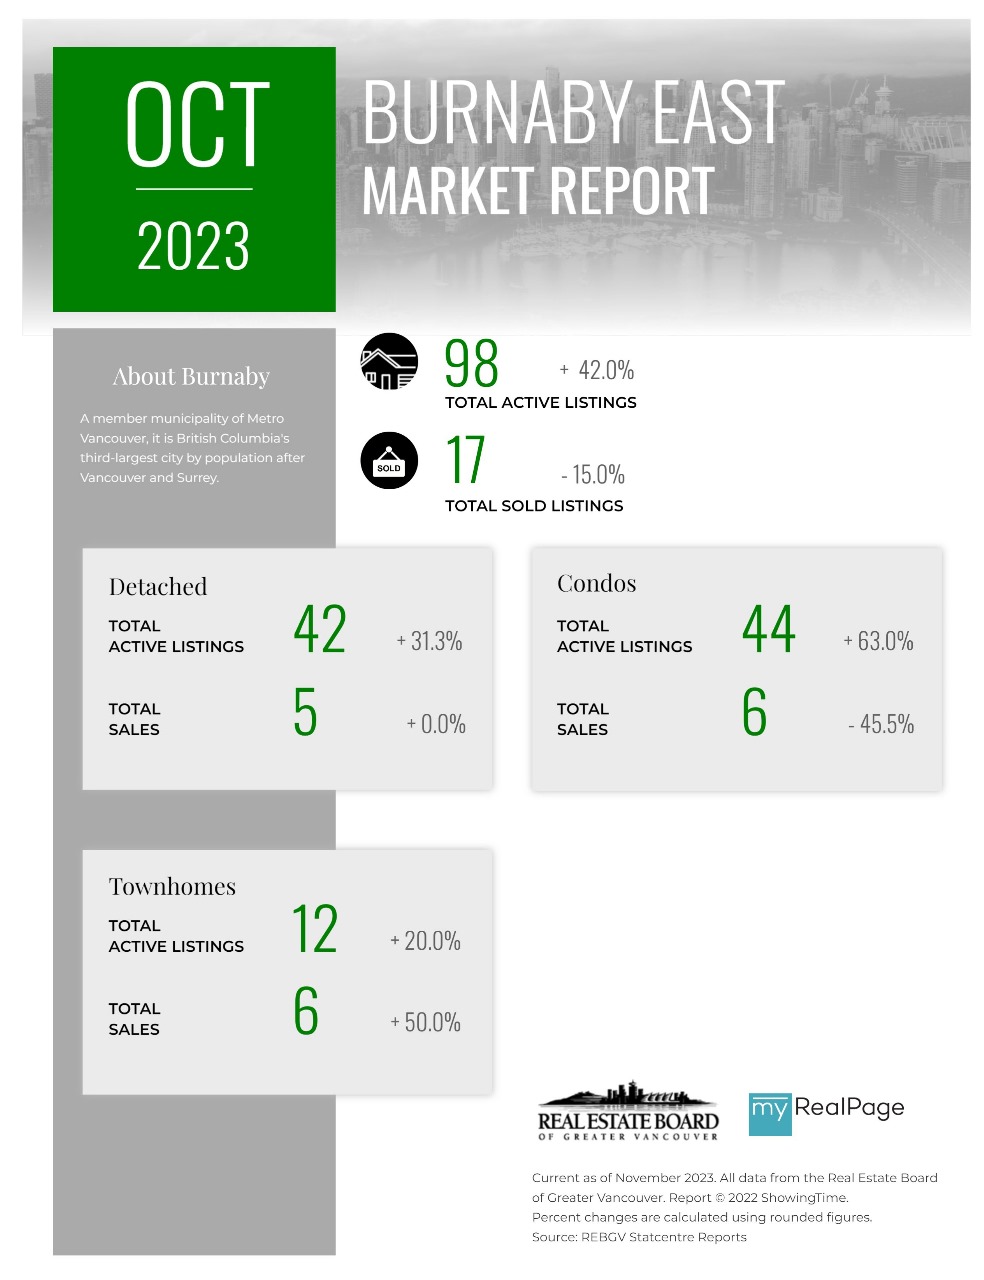
Printable Version – REBGV October 2023 Data Infographics Report Burnaby East
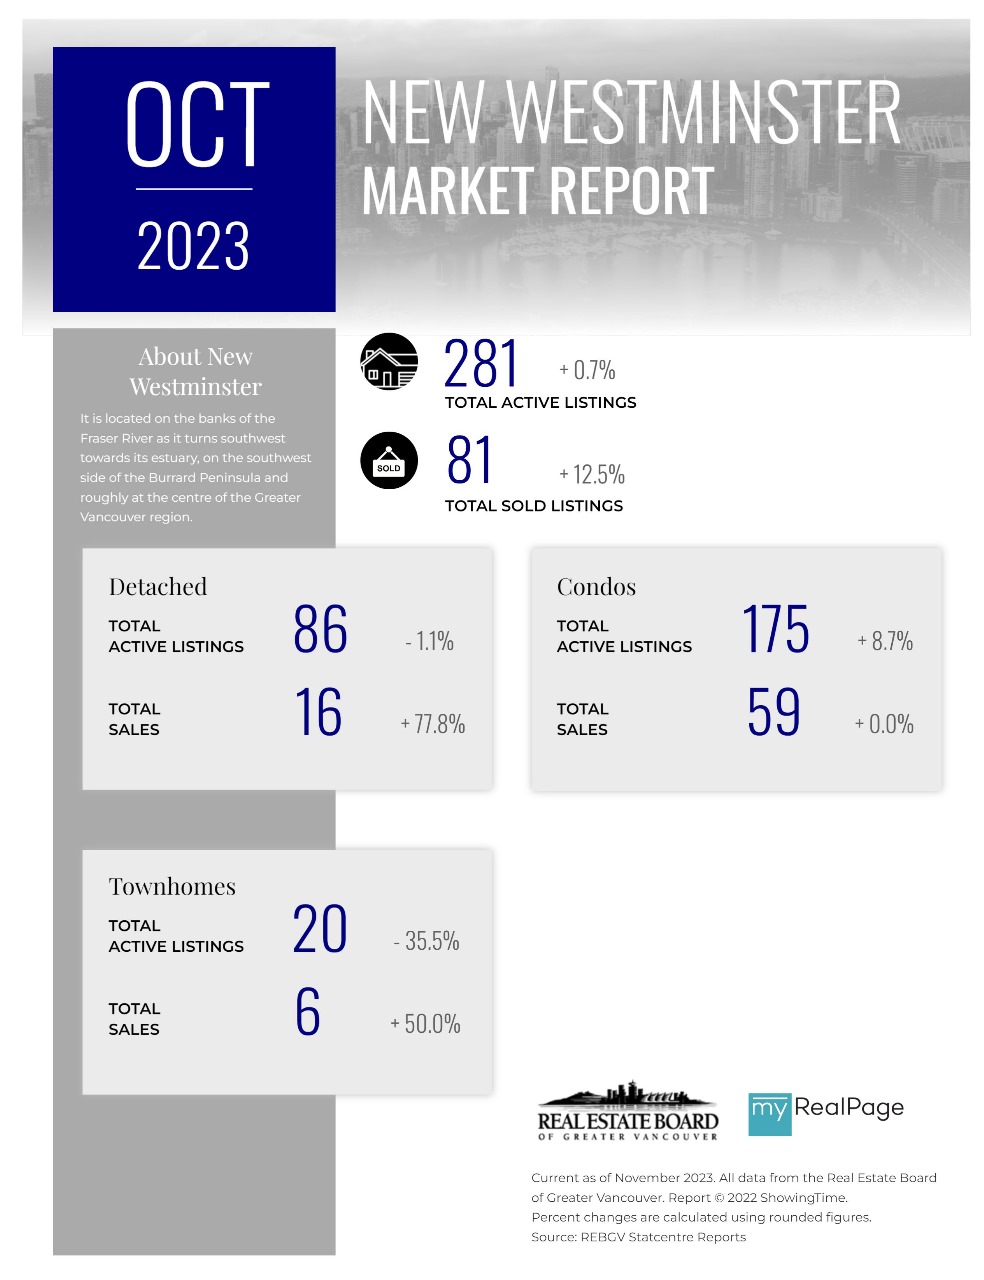
Printable Version – REBGV October 2023 Data Infographics Report New Westminster
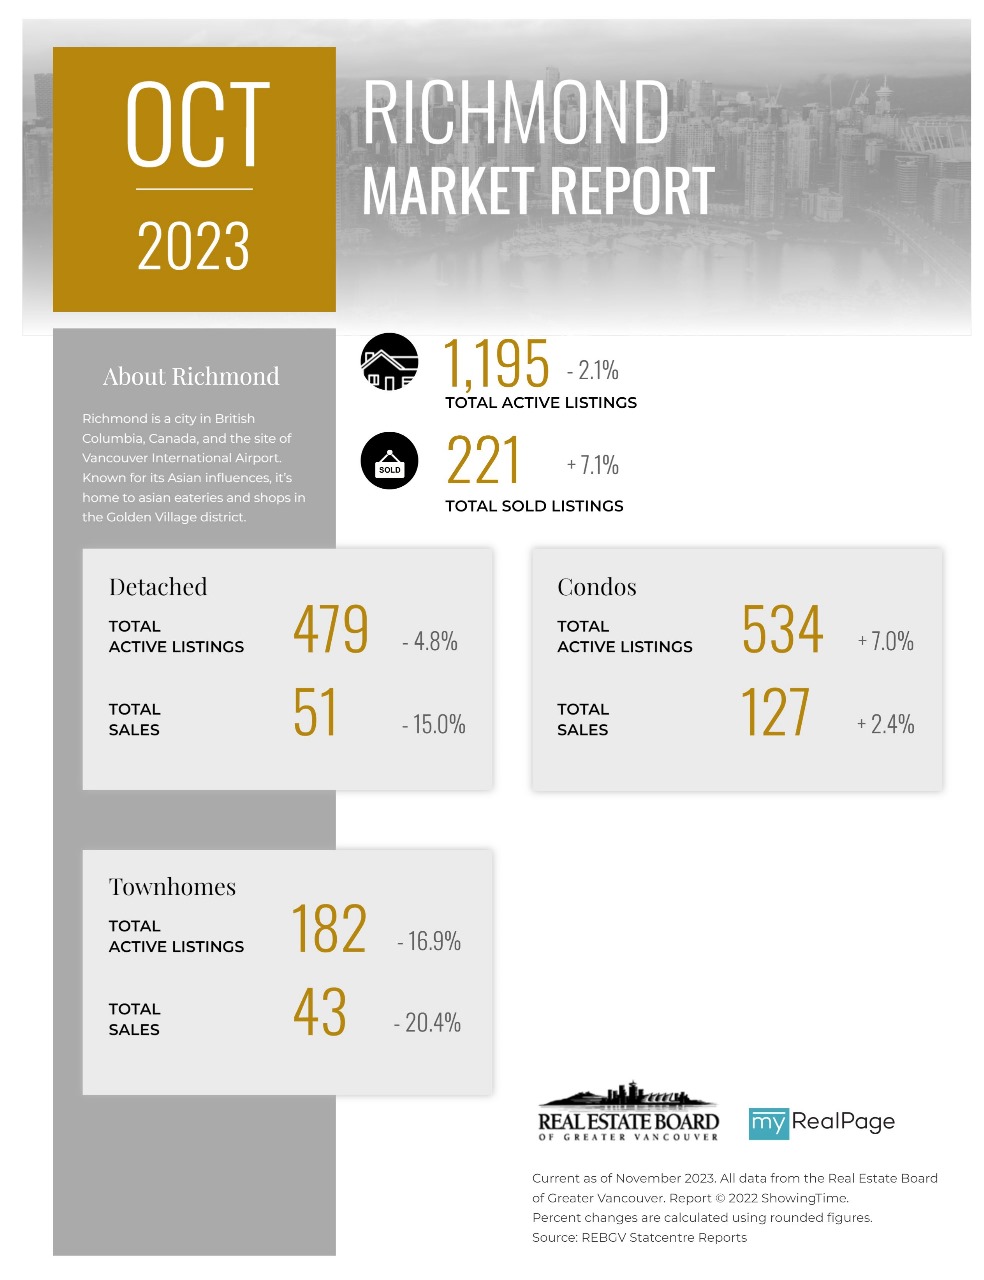
Printable Version – REBGV October 2023 Data Infographics Report Richmond
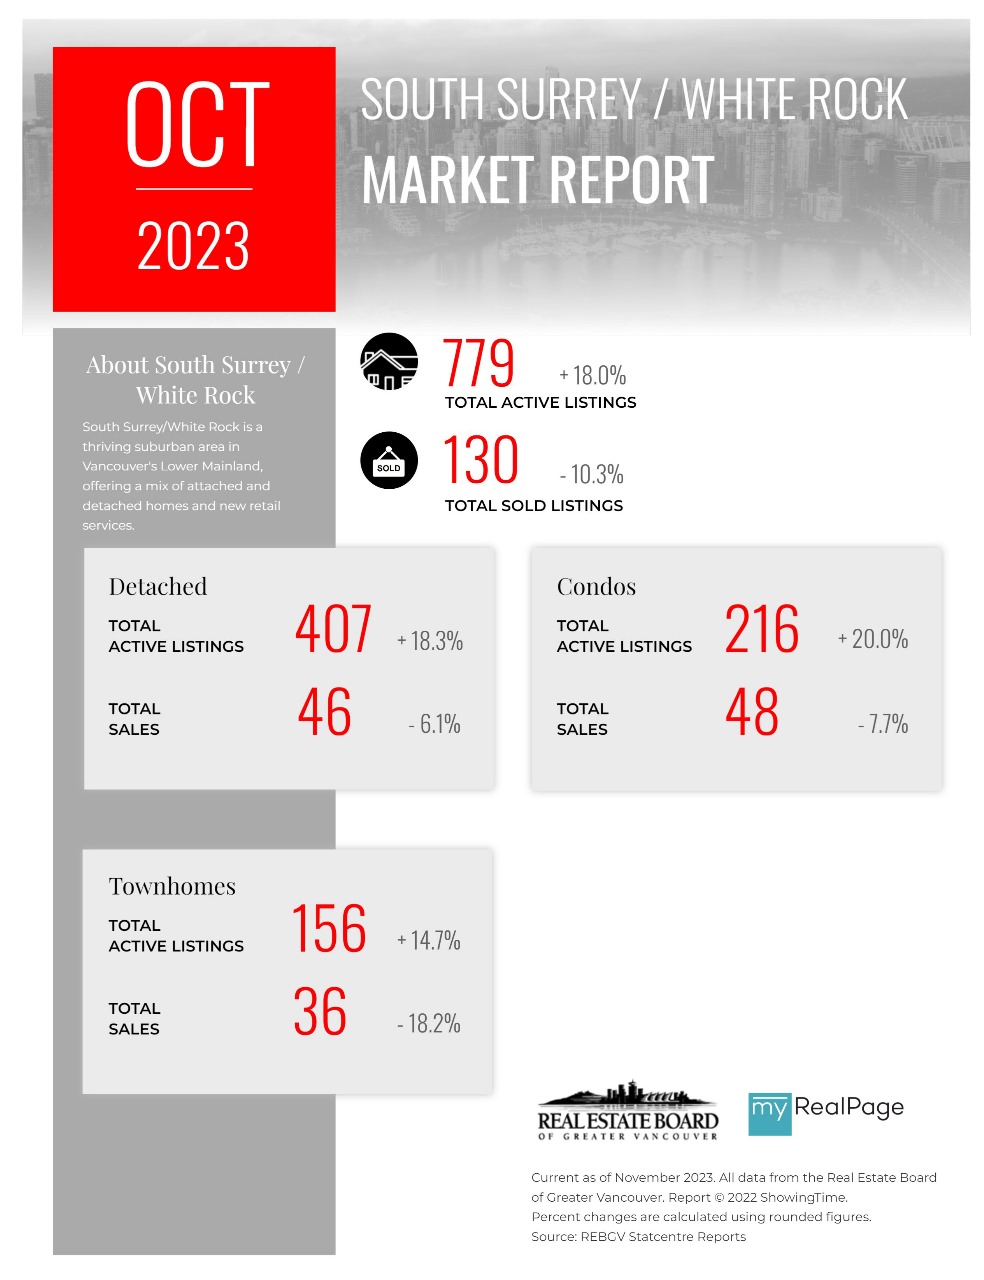
Printable Version – REBGV October 2023 Data Infographics Report South Surrey / White Rock


Last Updated on November 8, 2023 by myRealPage
