INFOGRAPHICS: August 2024 GVR Greater Vancouver Market Reports

Sellers await buyers’ return after quieter summer market
Home sales registered on the MLS® in Metro Vancouver remained below their ten-year seasonal averages in August as summer holidays come to a close.
Greater Vancouver REALTORS® (GVR) reports that residential sales in the region totalled 1,904 in August 2024, a 17.1 per cent decrease from the 2,296 sales recorded in August 2023. This total was also 26 per cent below the 10-year seasonal average (2,572).
“From a seasonal perspective, August is typically a slower month for sales than June or July. In this respect, this August has been no different. With that said, sales remain in a holding pattern, trending roughly 20 per cent below their 10-year seasonal average, which suggests buyers are still feeling the pinch of higher borrowing costs, despite two recent quarter percentage point reductions to the policy rate this summer.” Andrew Lis, GVR director of economics and data analytics
Read the full report on the REBGV website!
The following data is a comparison between August 2024 and August 2023 numbers, and is current as of September 2024. For last month’s update, you can check out our previous post!
Or follow this link for all our GVR Infographics!
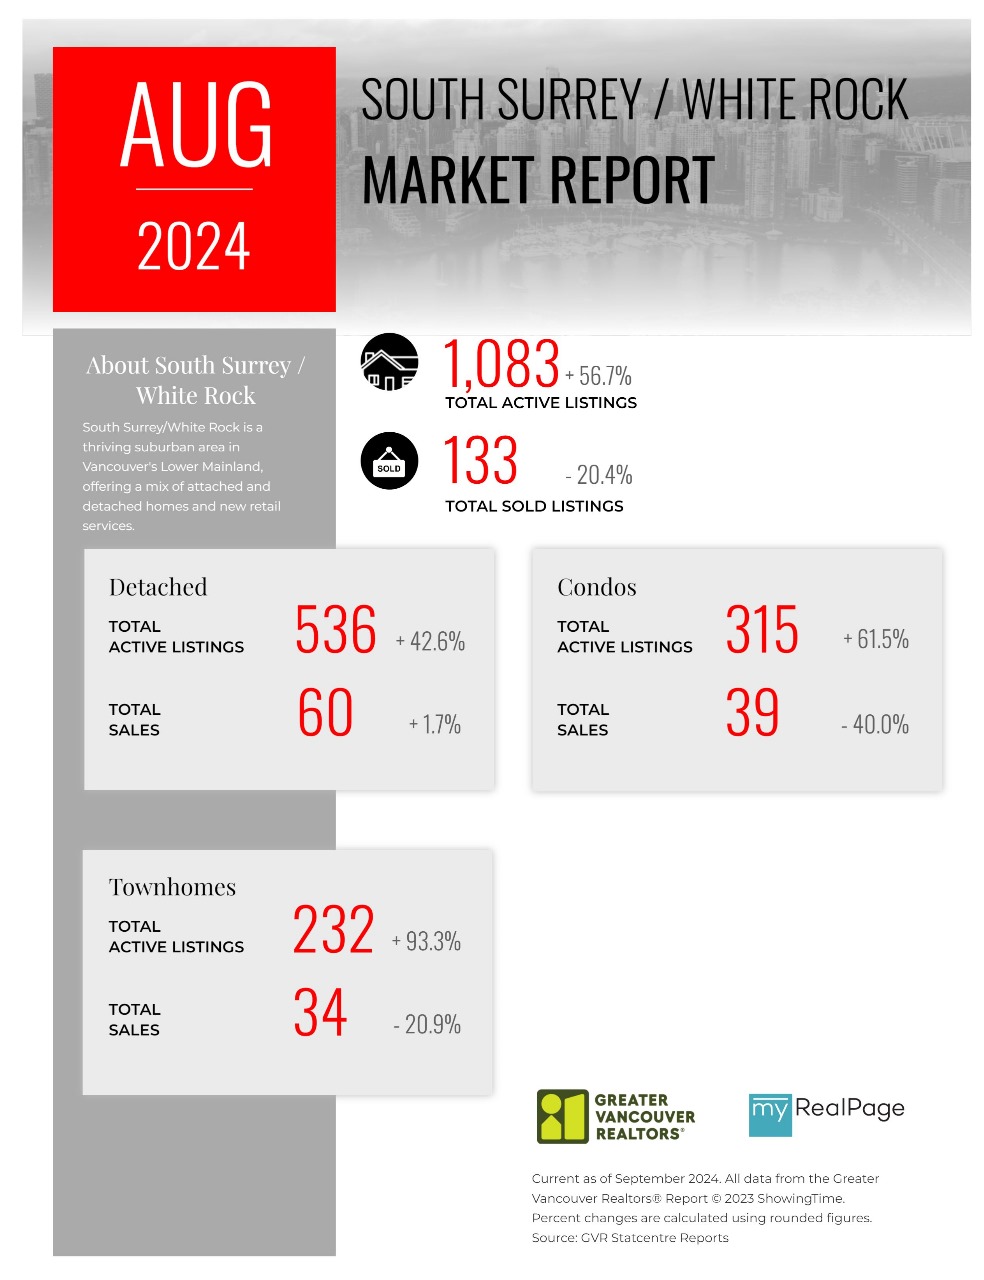
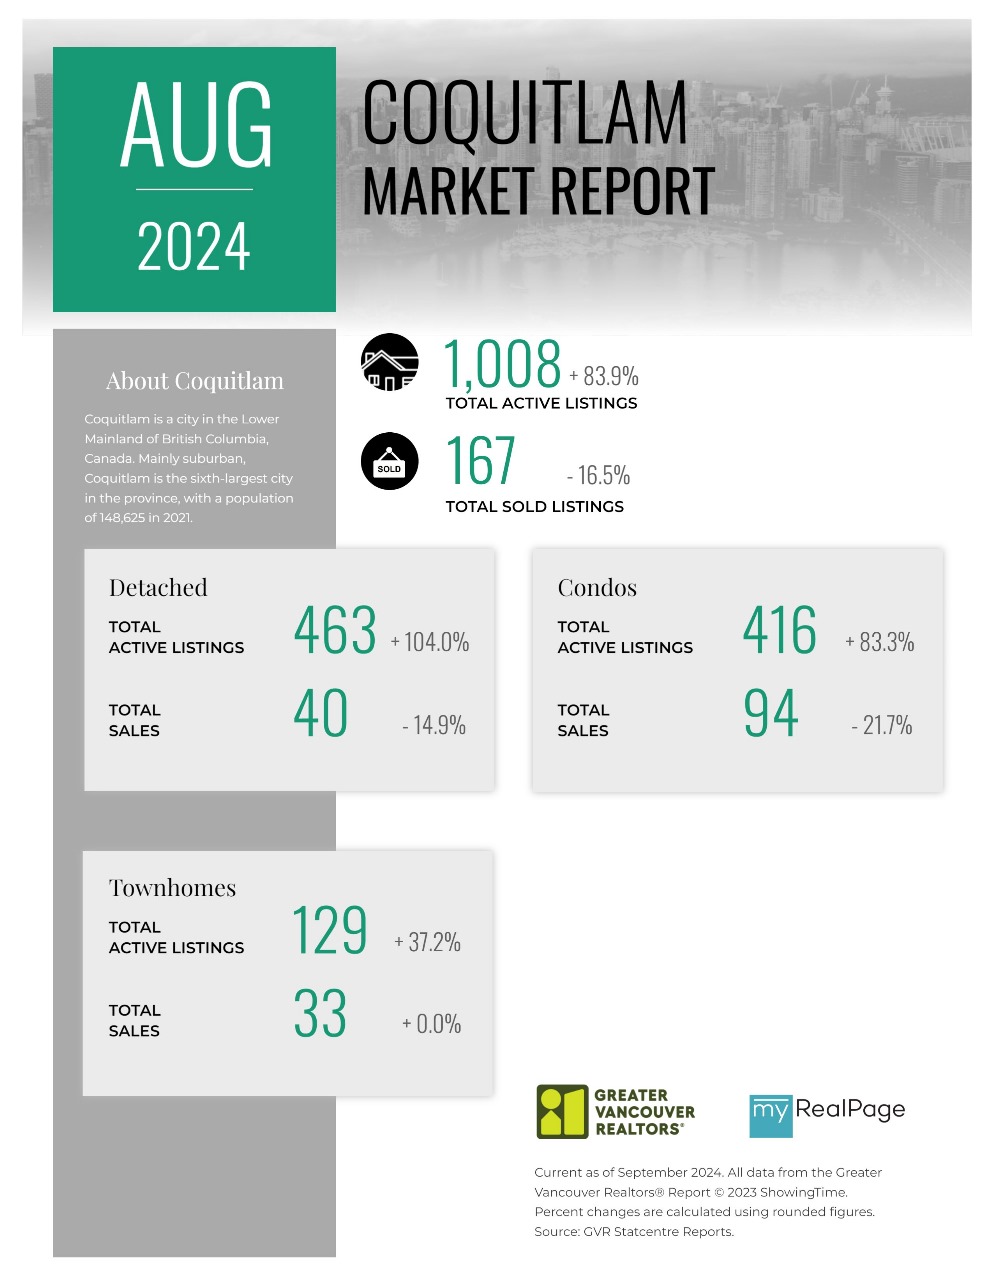
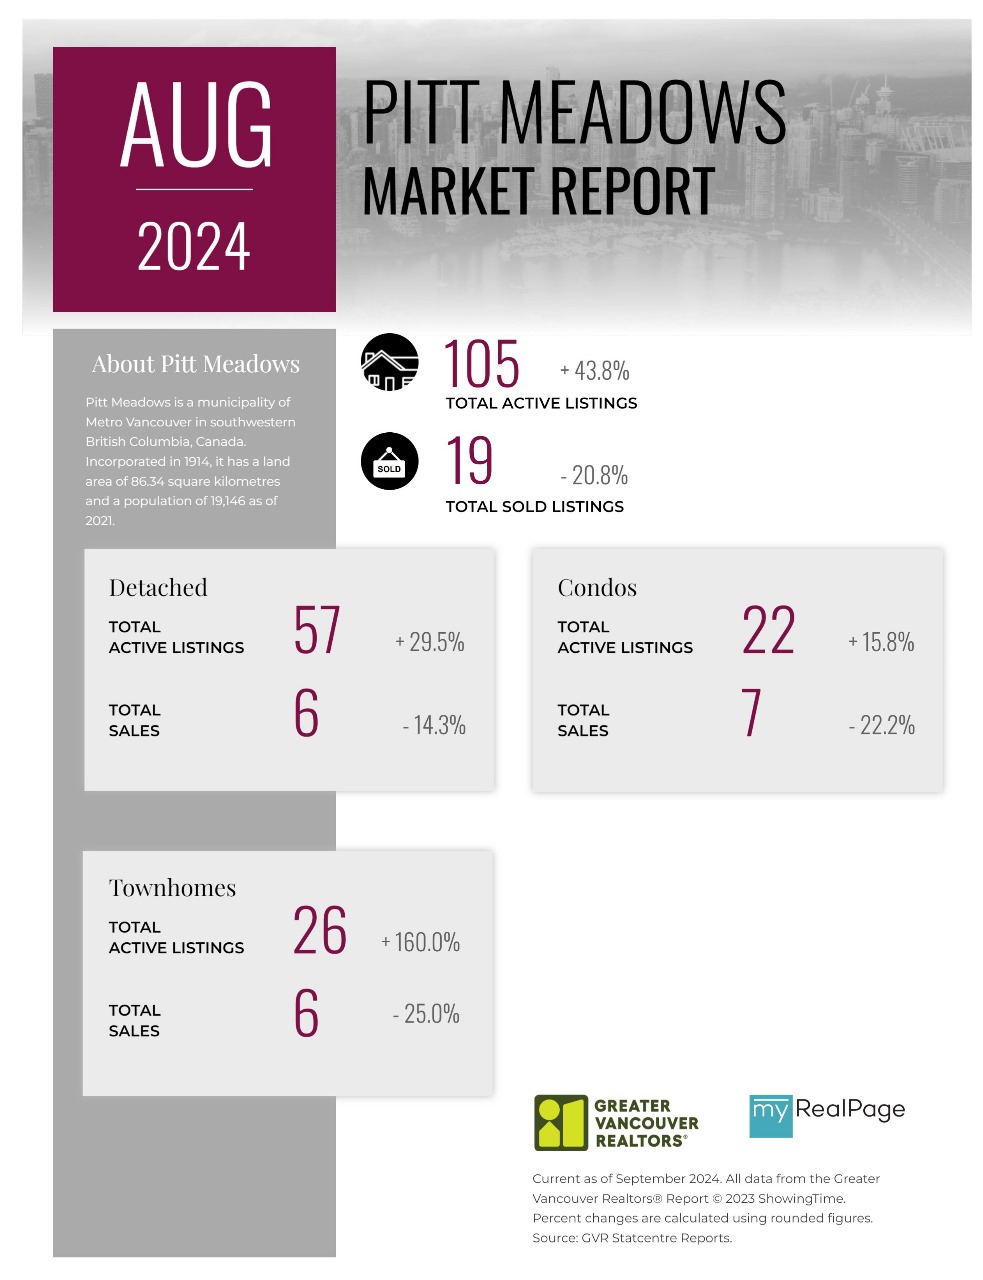
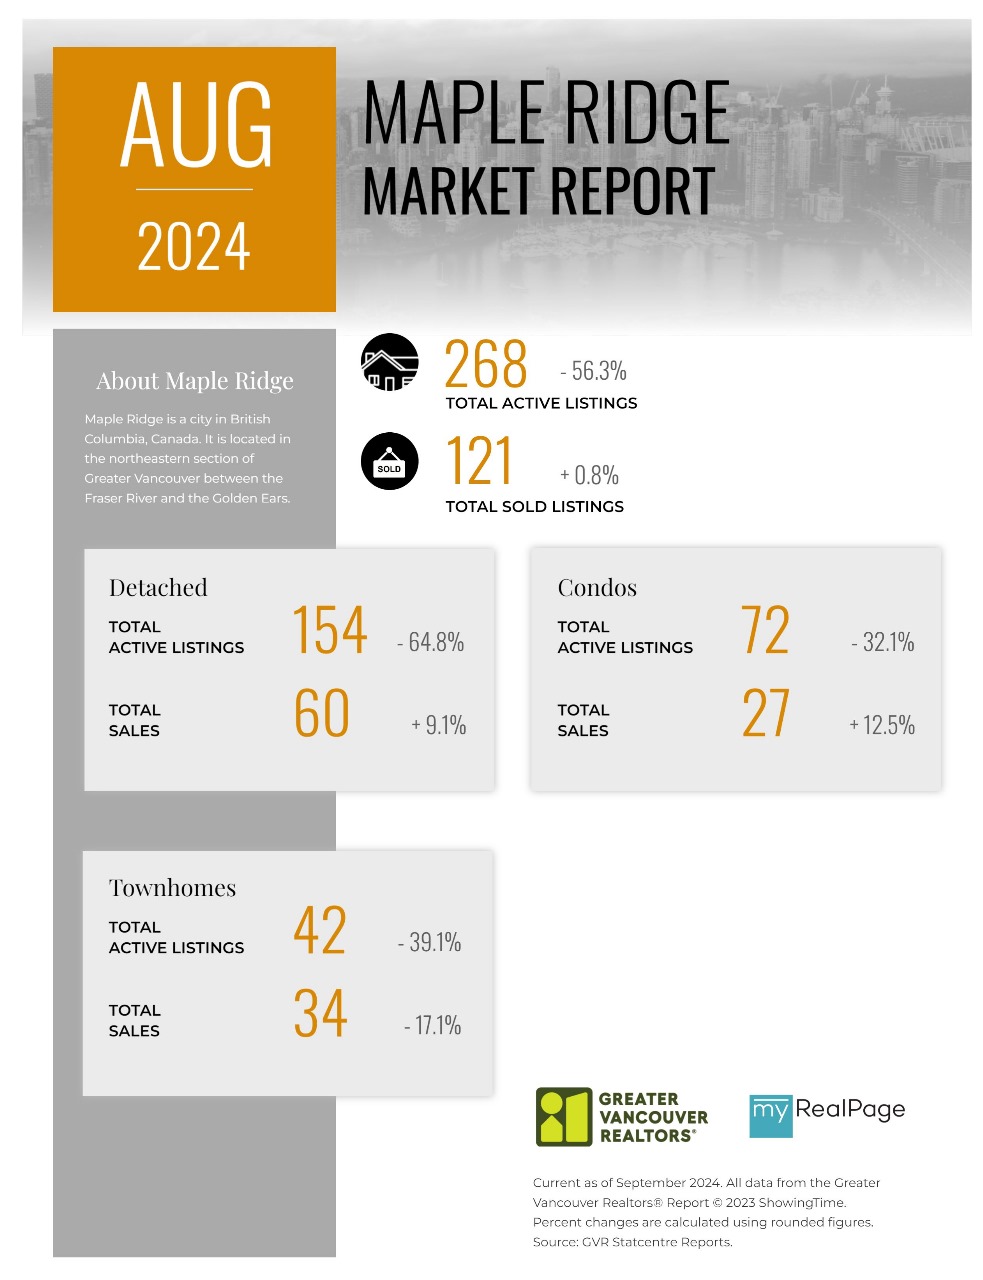
These infographics cover current trends in several areas within the Greater Vancouver region. Click on the images for a larger view!
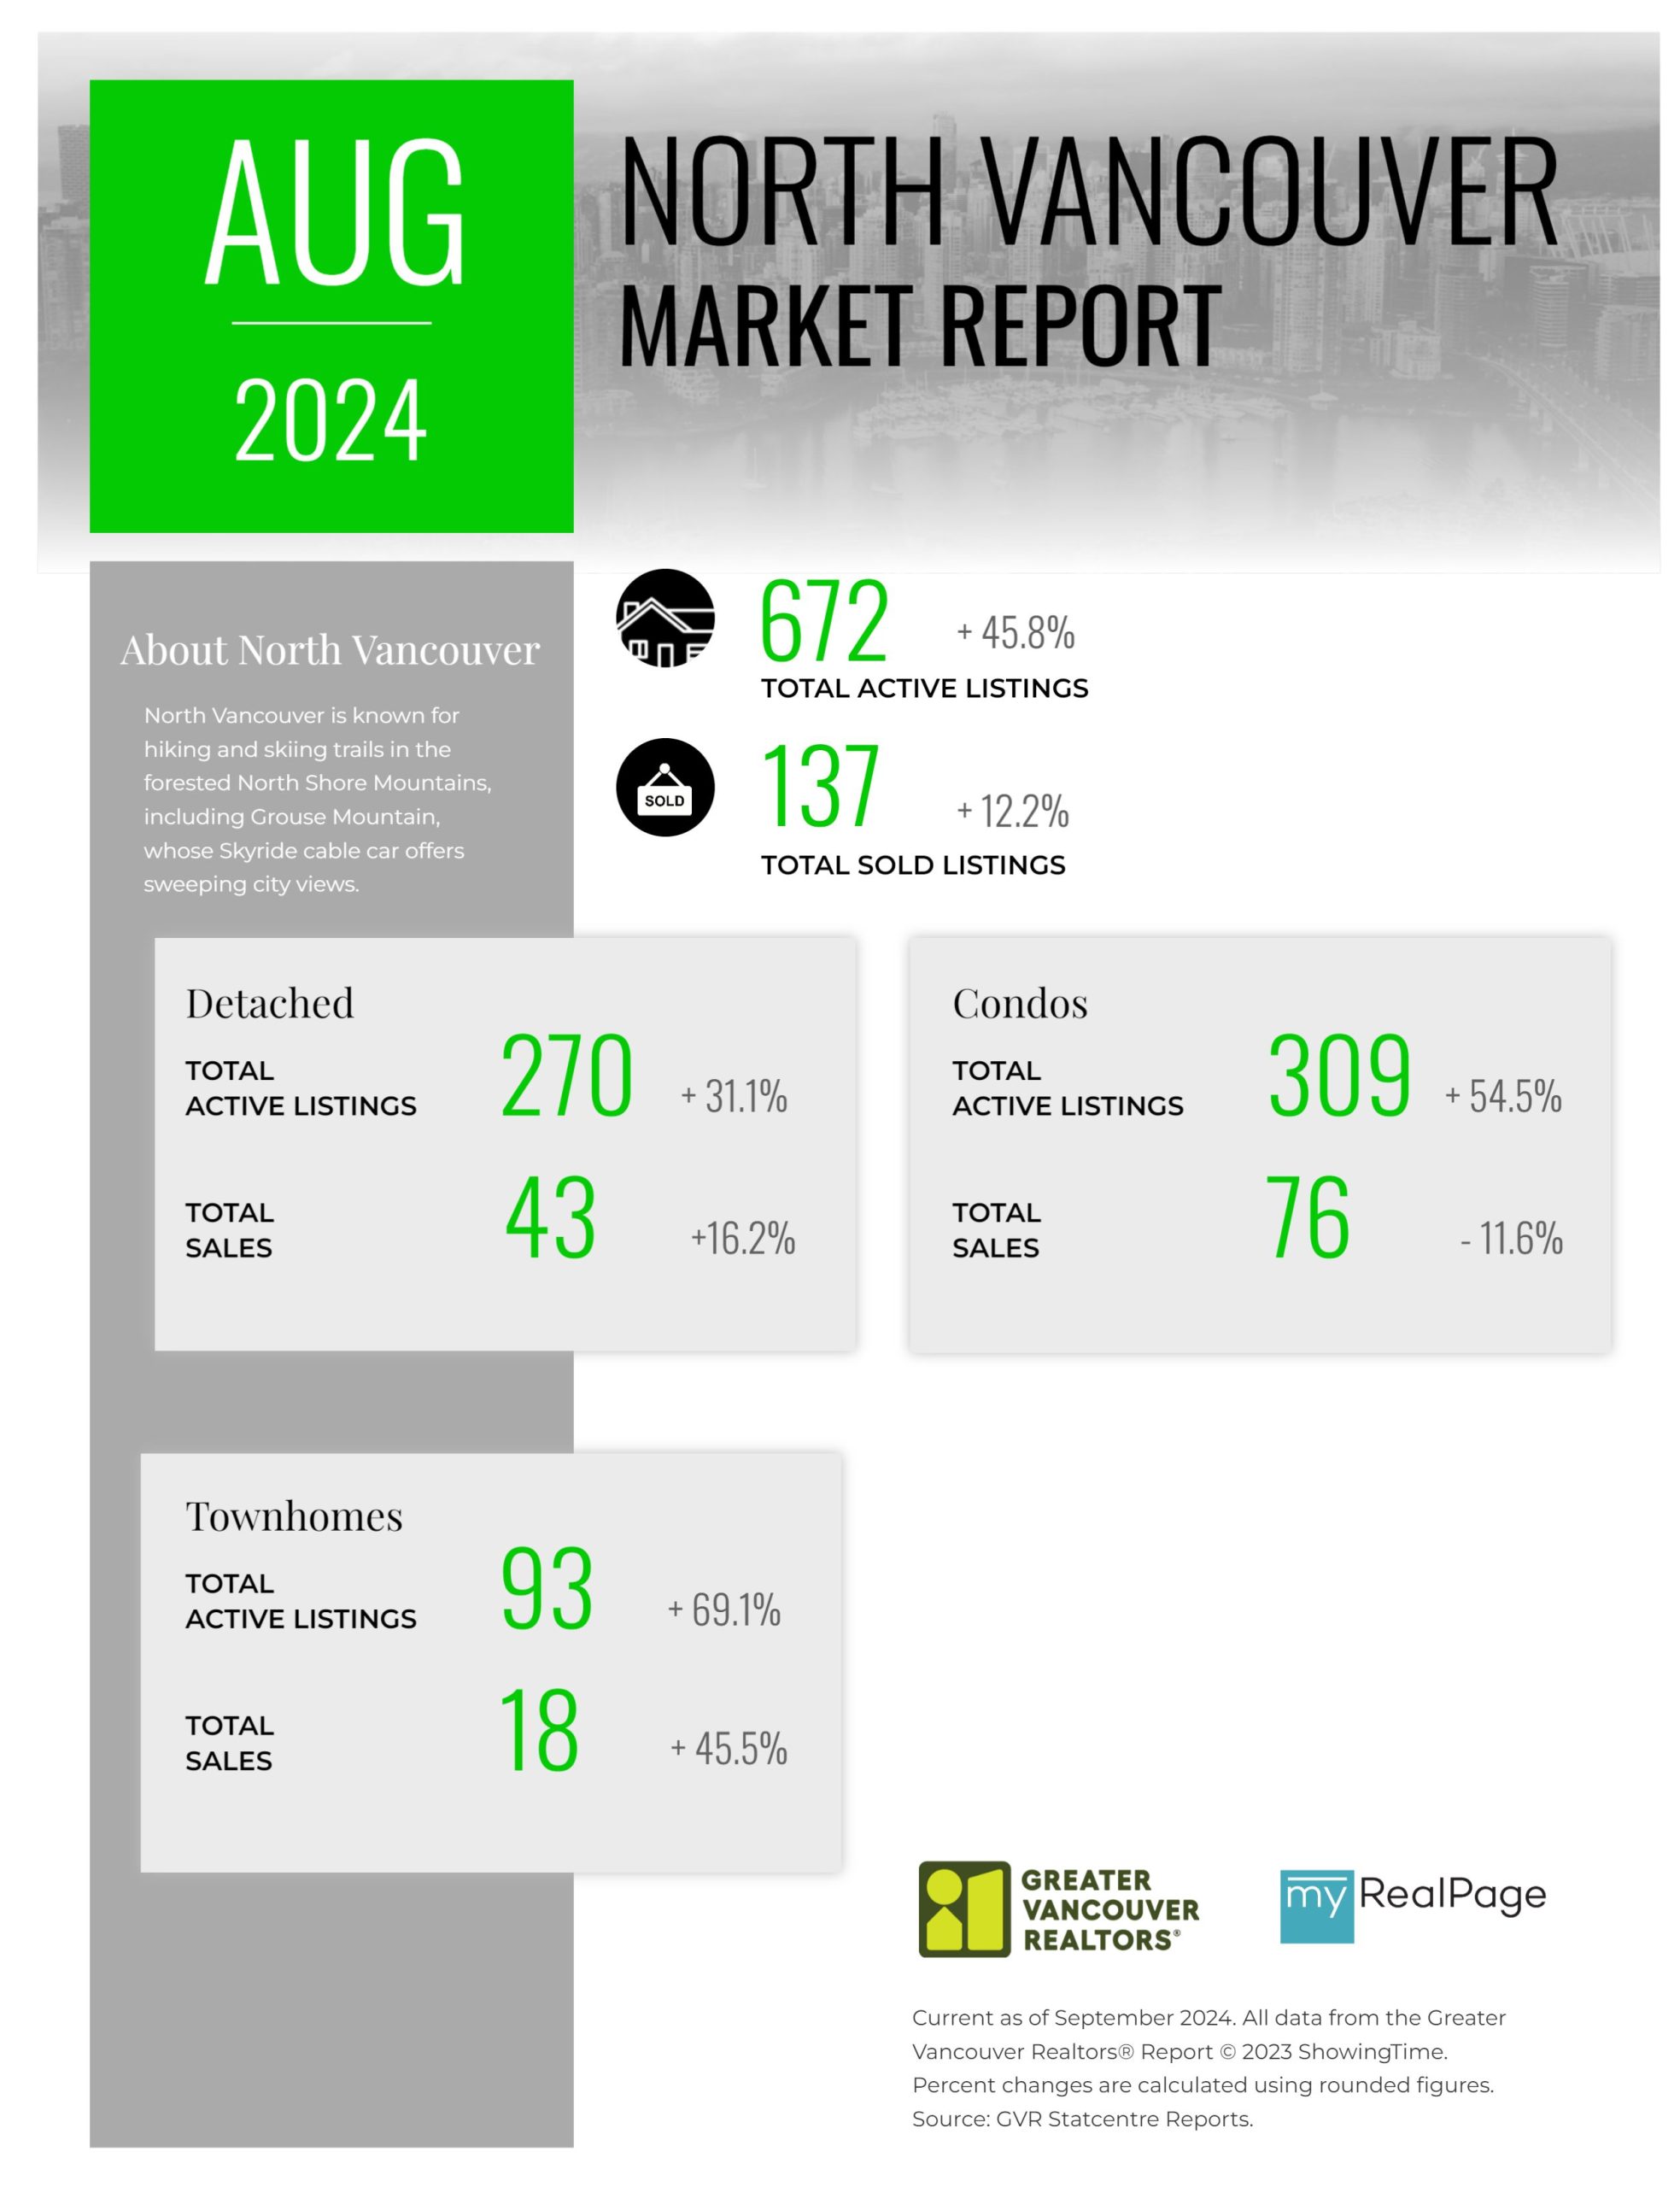
Printable Version – GVR August 2024 Data Infographic Report North Vancouver
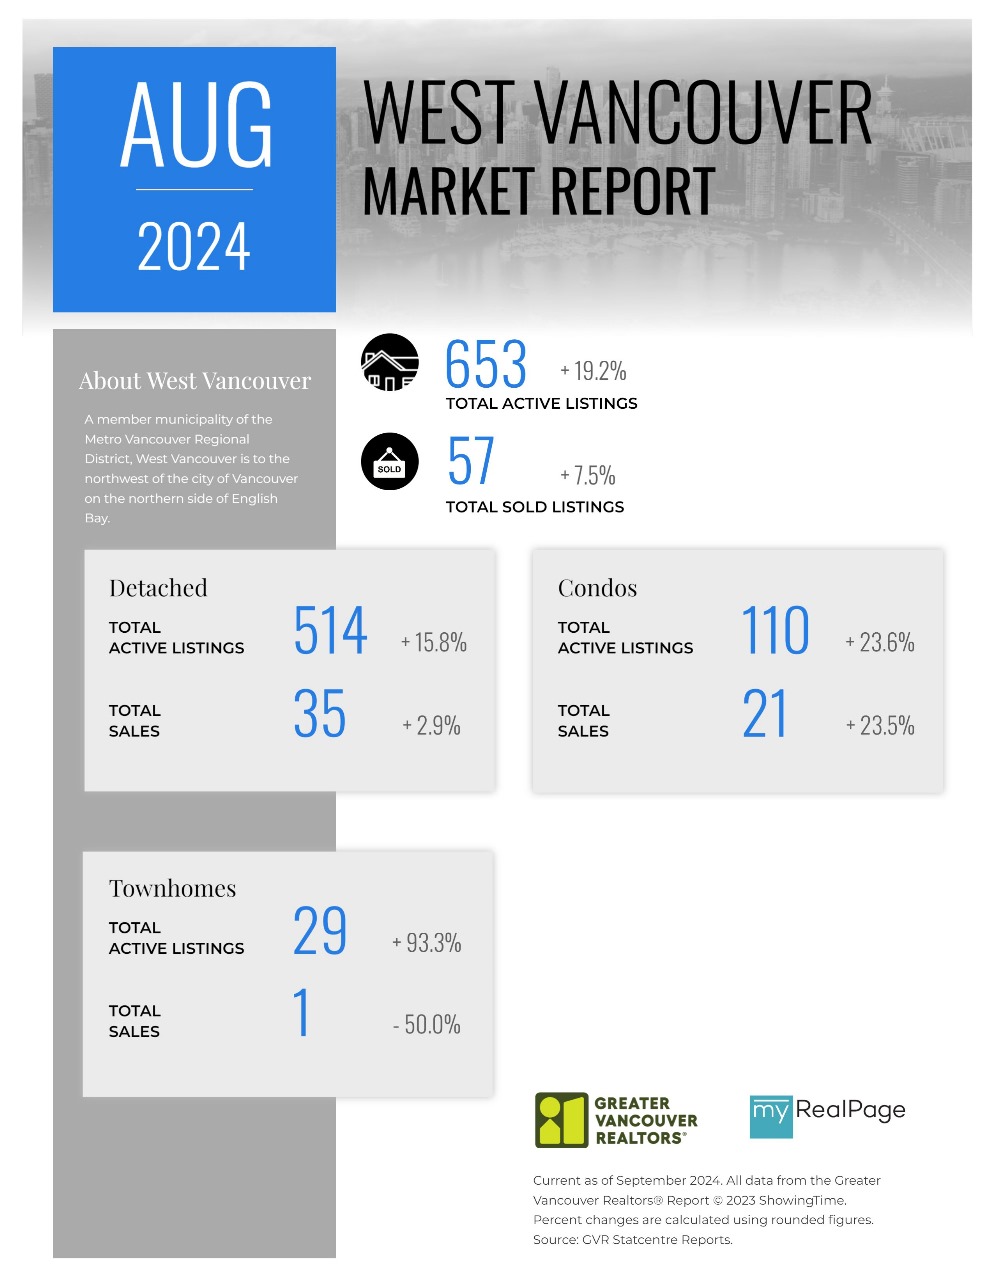
Printable Version – GVR August 2024 Data Infographics Report West Vancouver
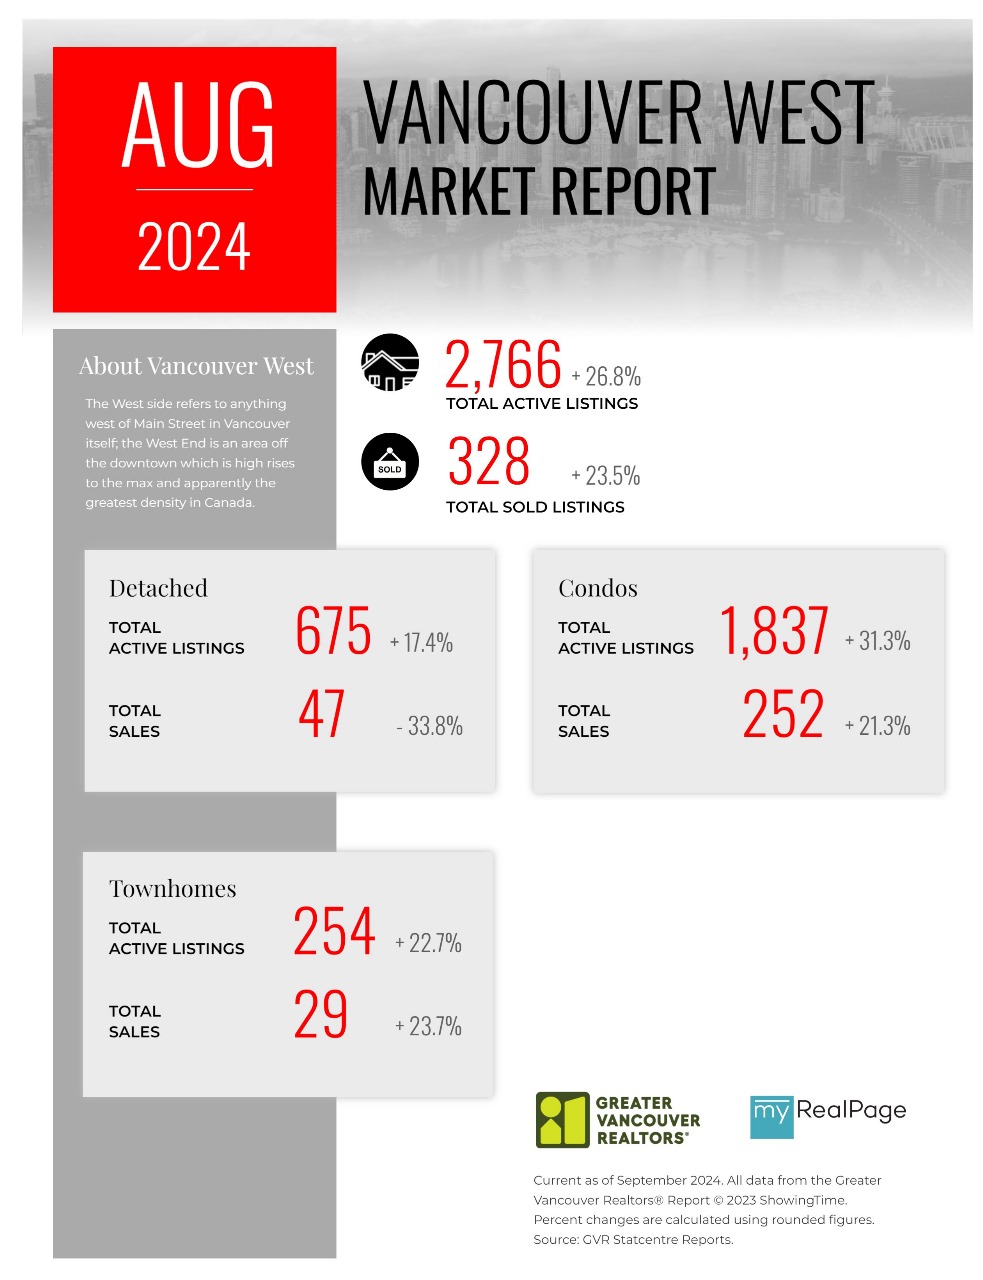
Printable Version – GVR August 2024 Data Infographics Report Vancouver West
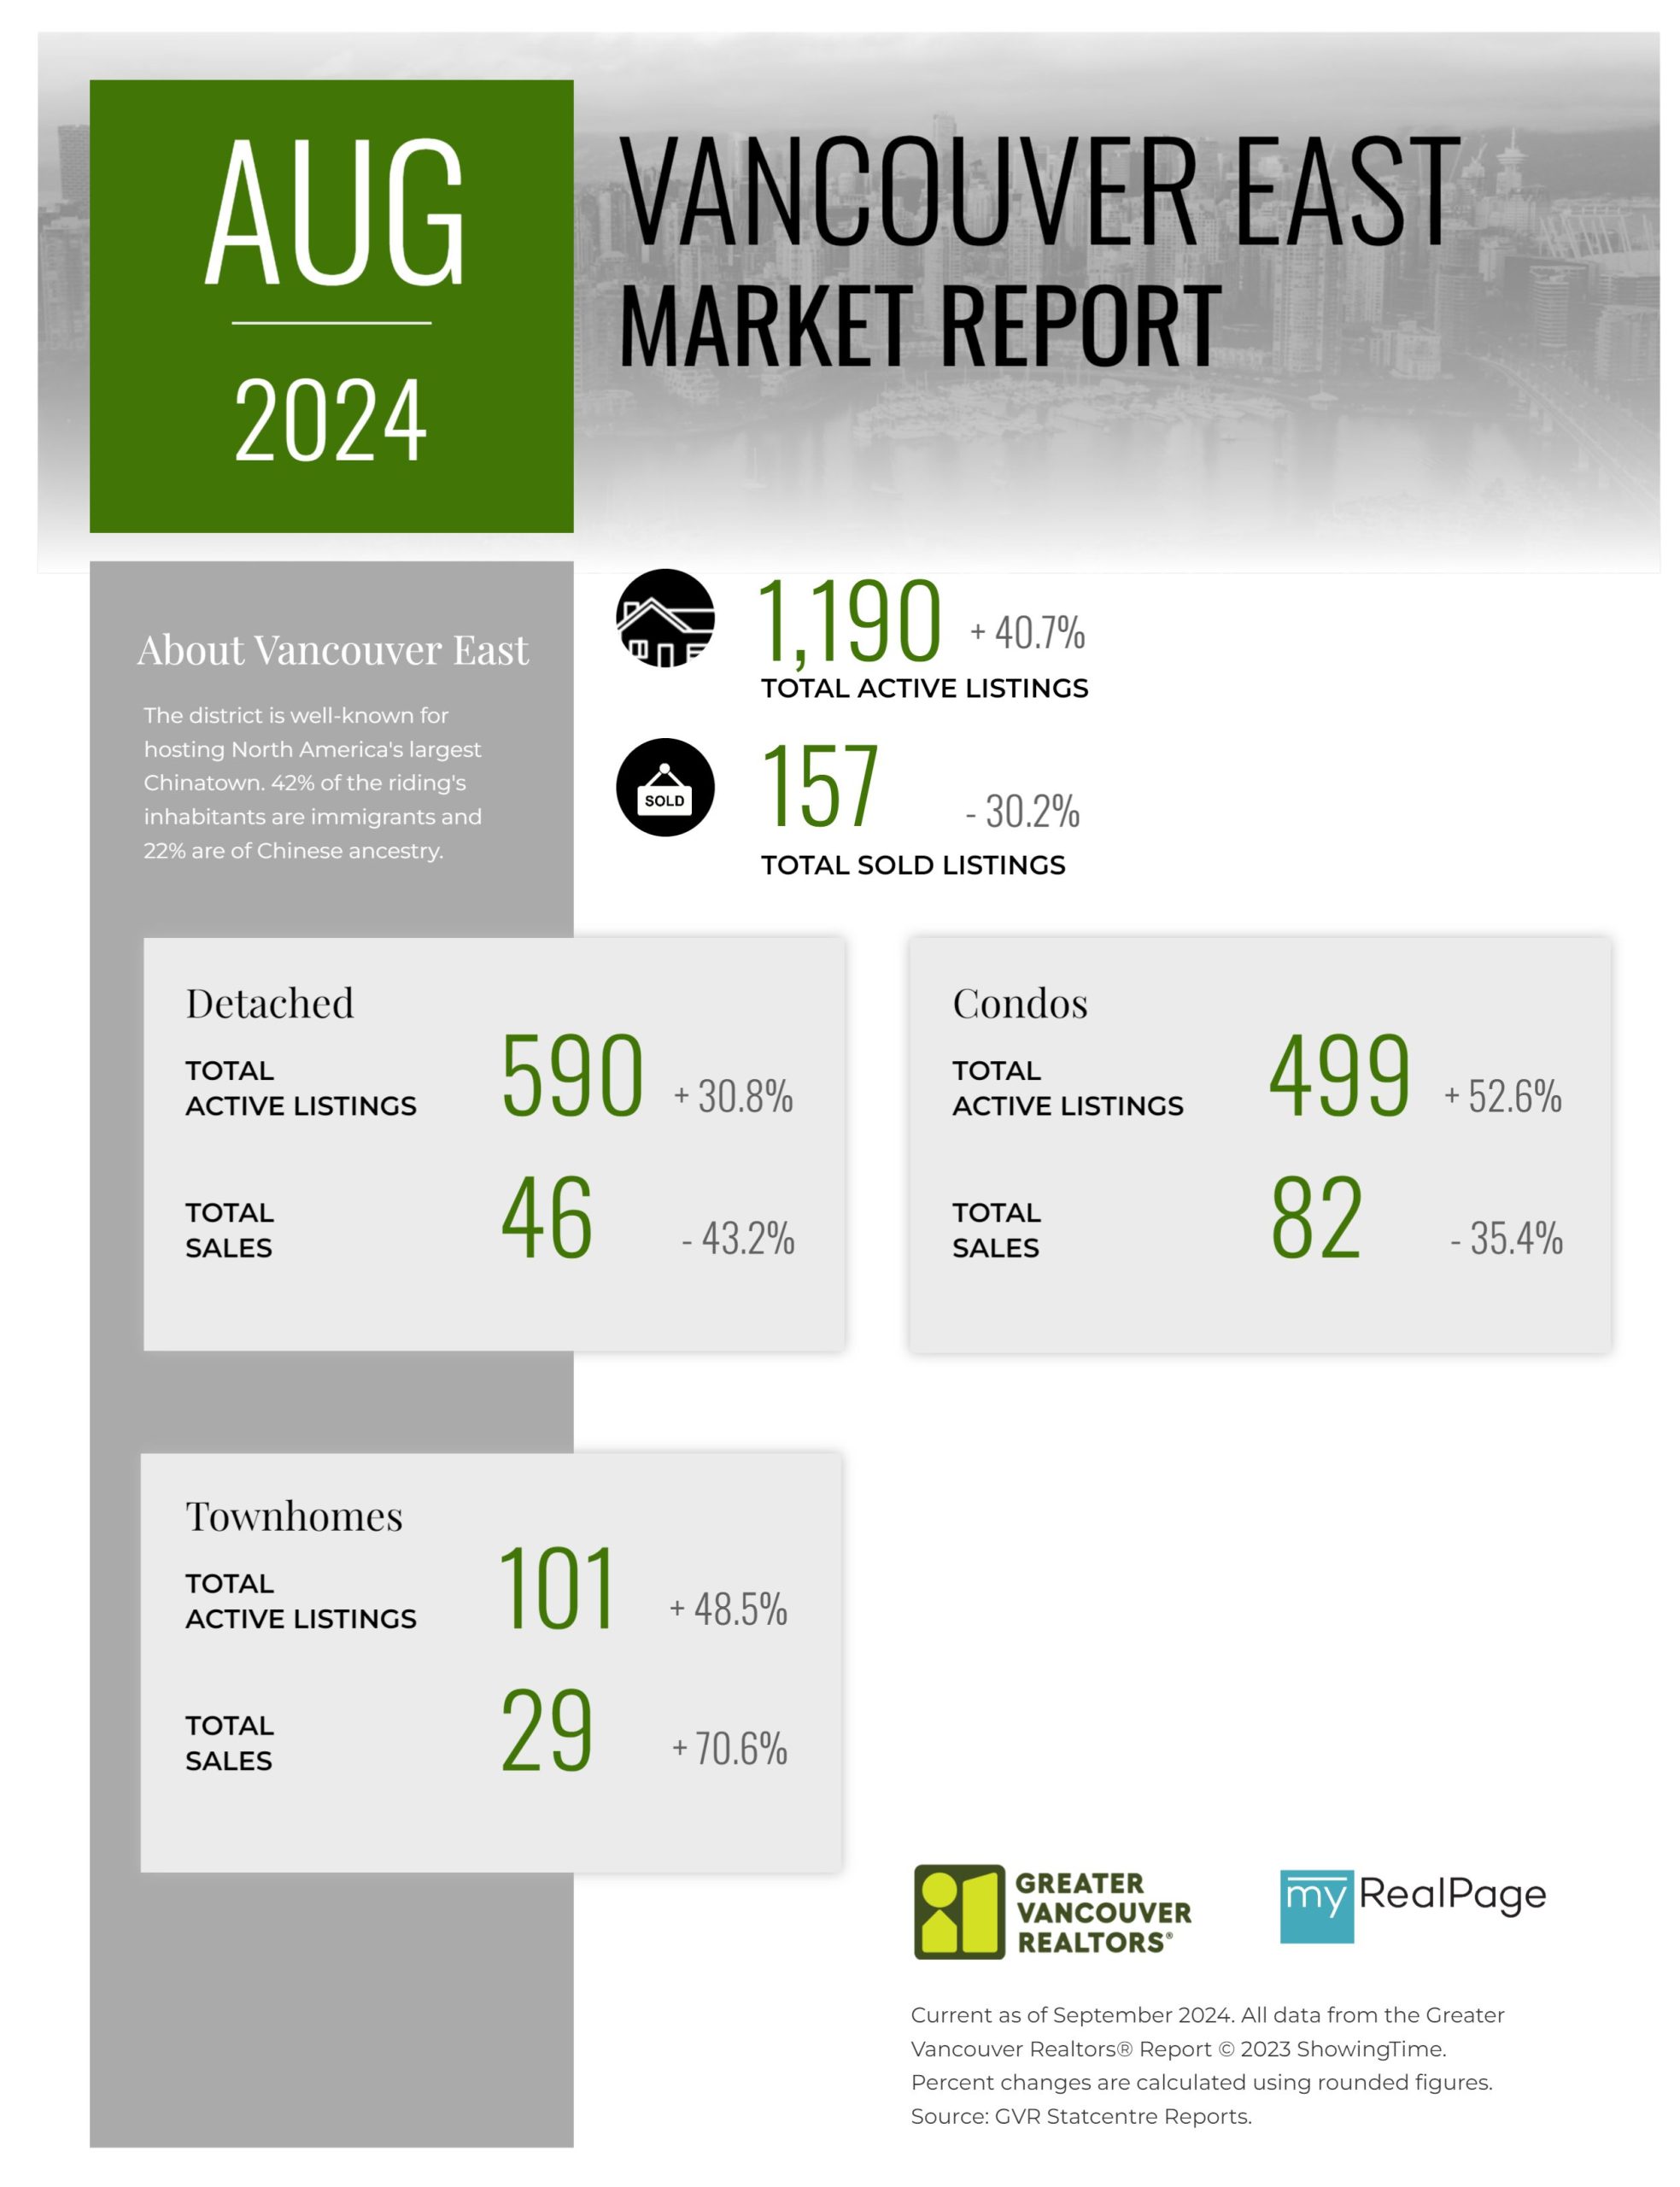
Printable Version – GVR August 2024 Data Infographics Report Vancouver East
Printable Version – GVR August 2024 Data Infographic Report Maple Ridge
Printable Version – GVR August 2024 Data Infographics Report Pitt Meadows
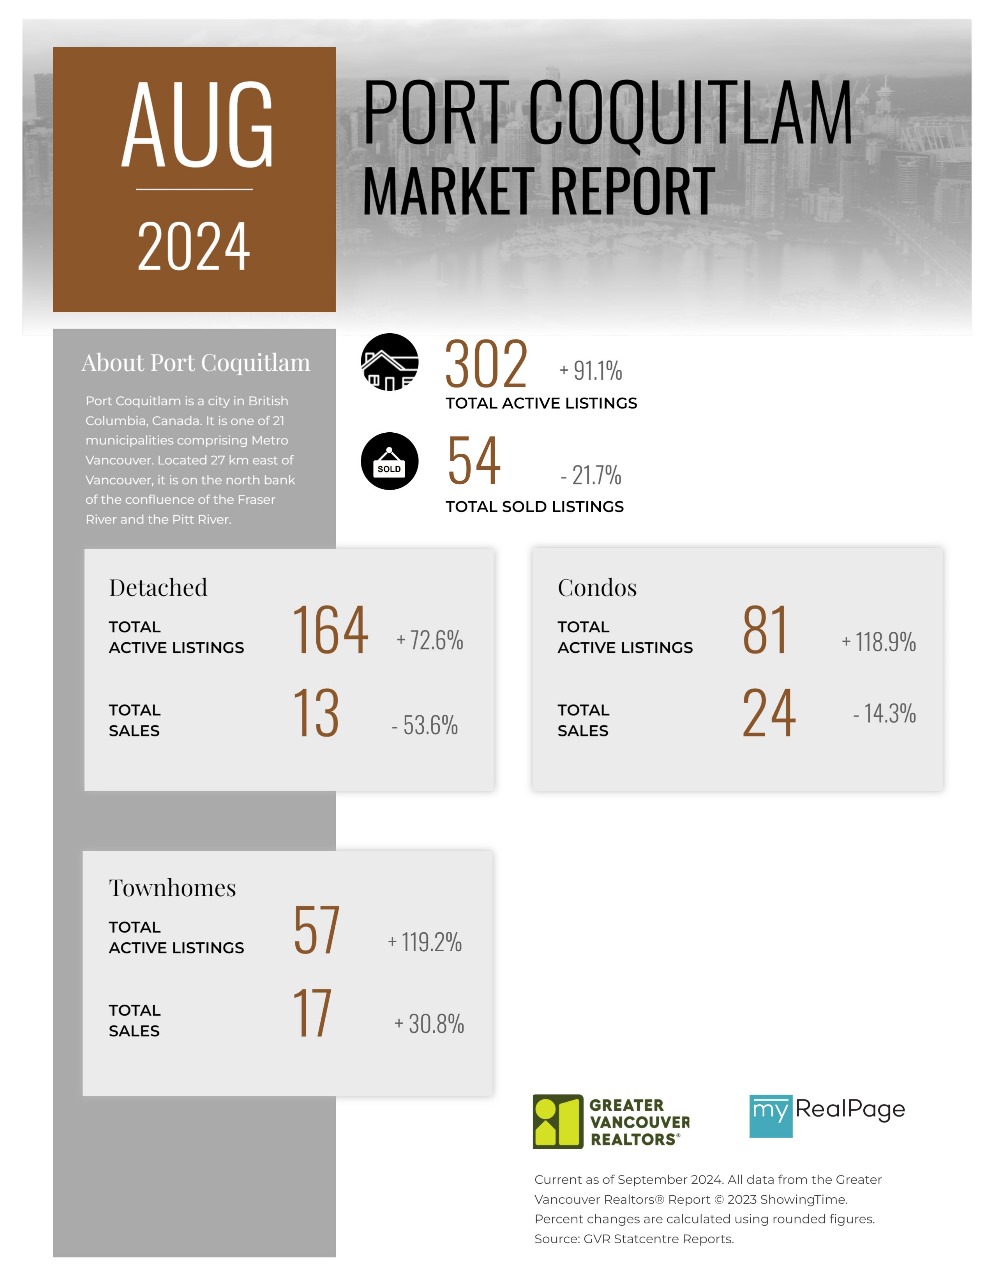
Printable Version – GVR August 2024 Data Infographics Report Port Coquitlam
Printable Version – GVR August 2024 Data Infographics Report Coquitlam
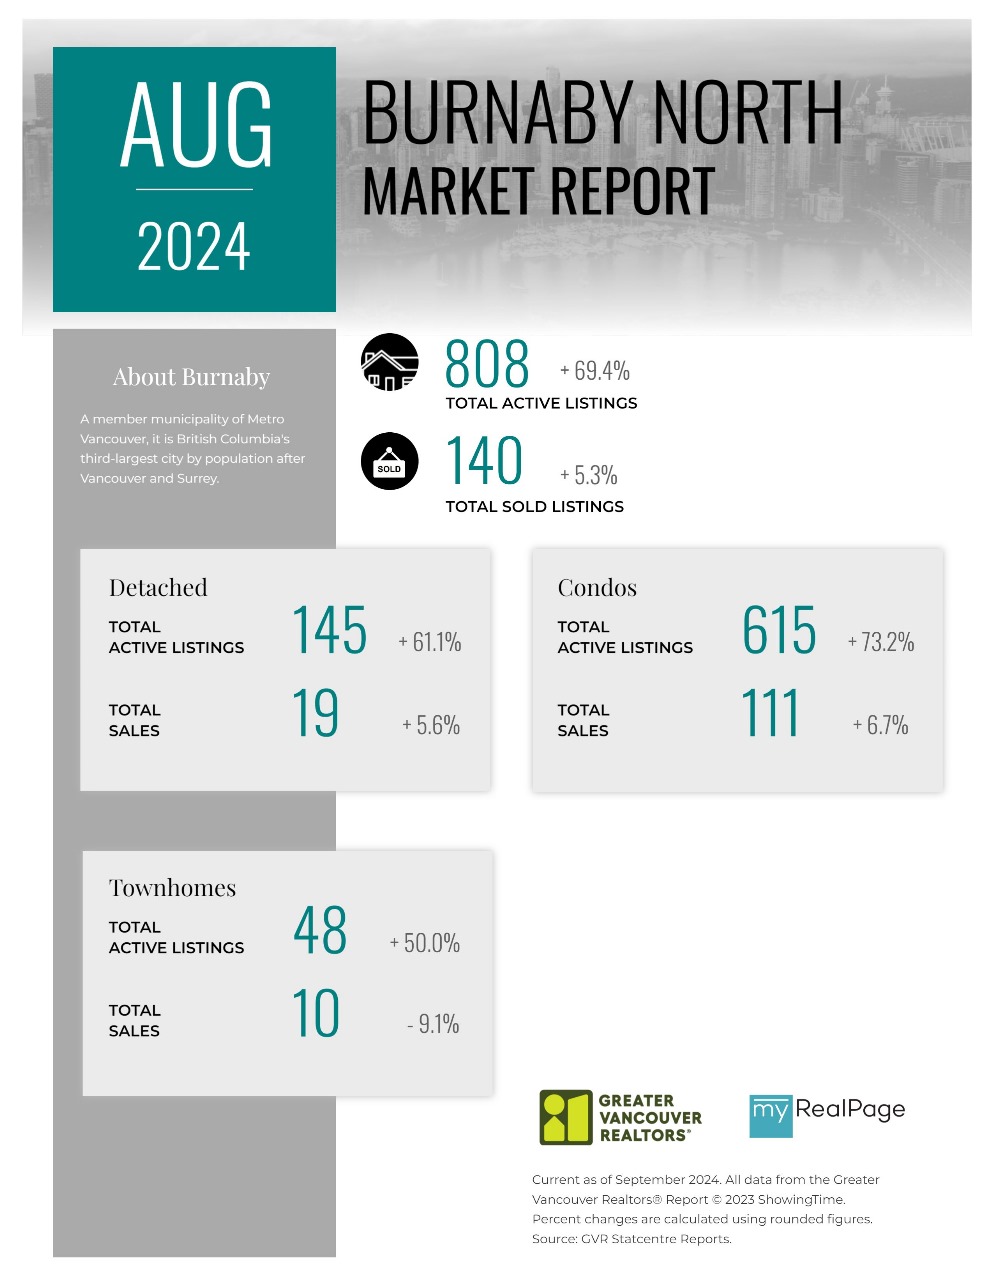
Printable Version – GVR August 2024 Data Infographic Report Burnaby North
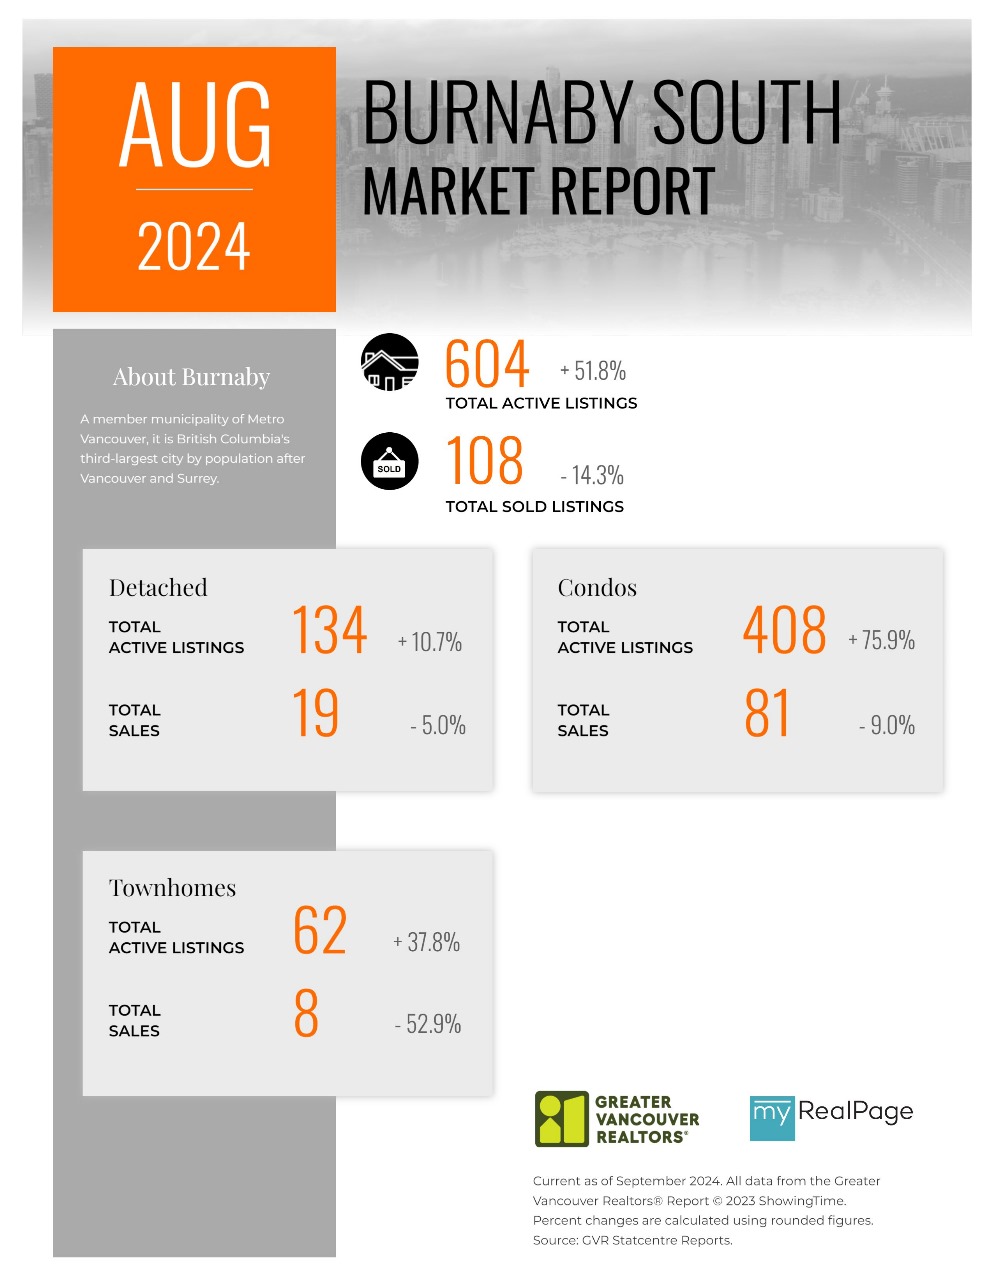
Printable Version – GVR August 2024 Data Infographics Report Burnaby South
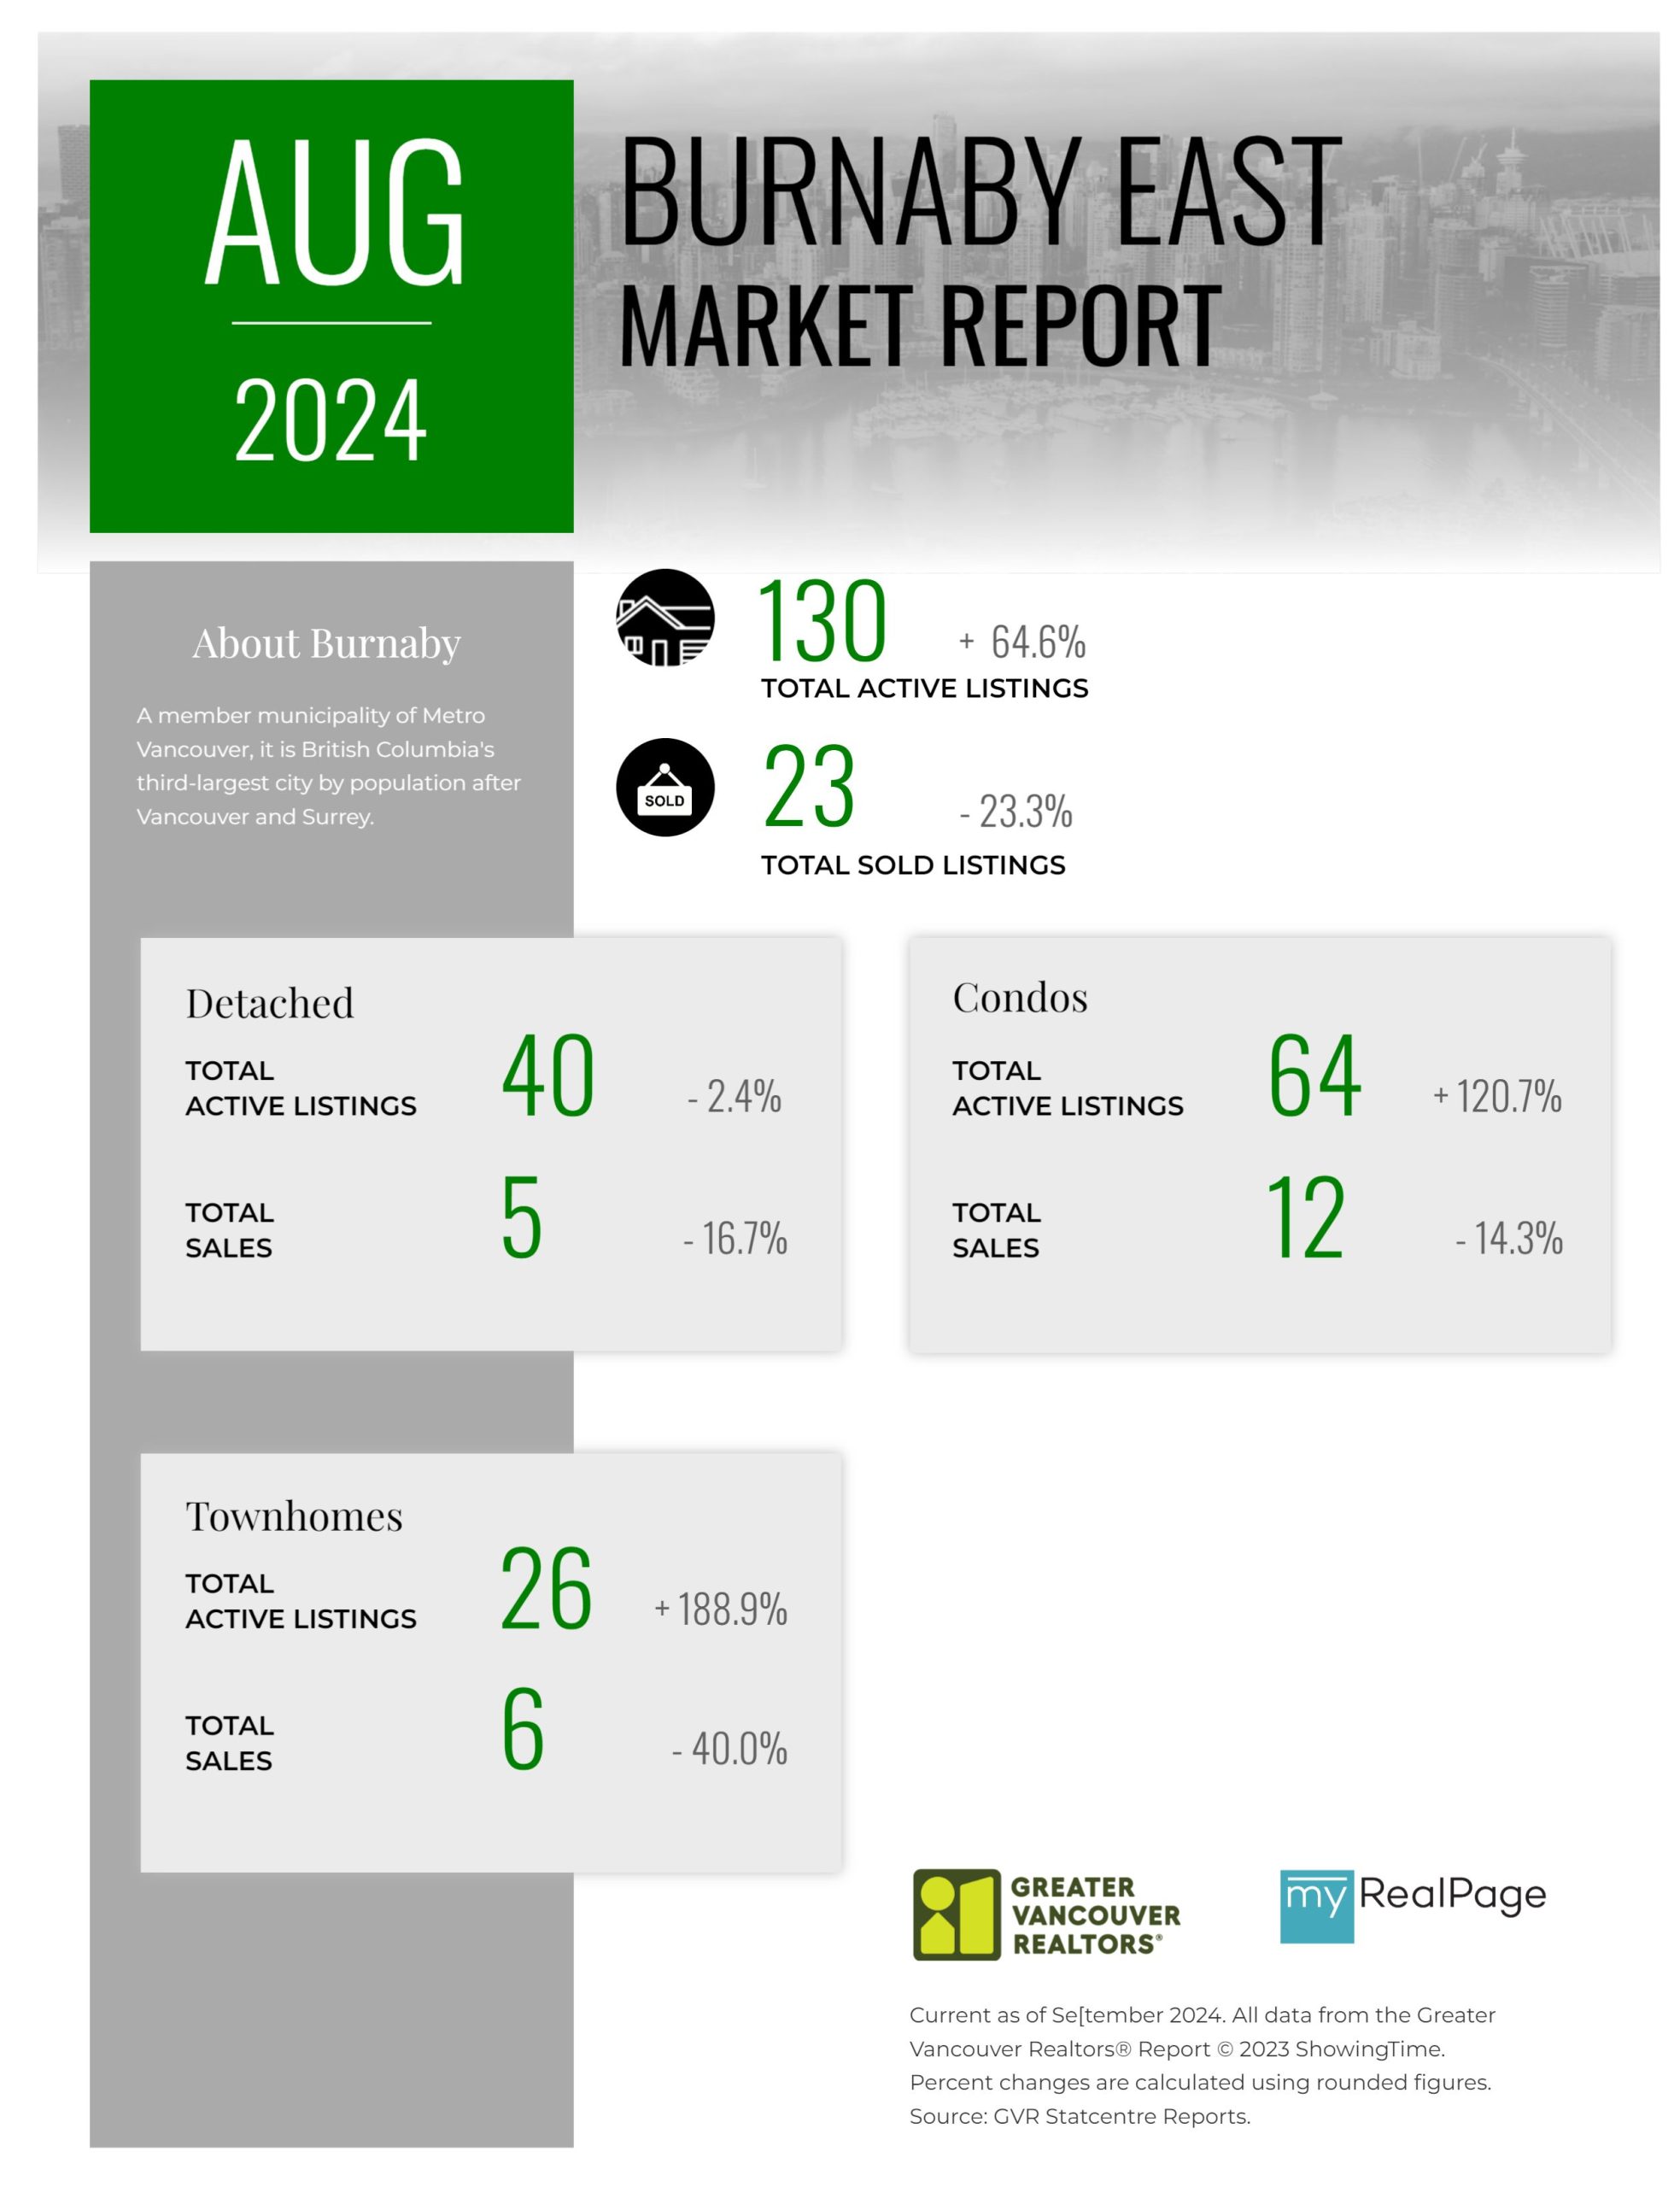
Printable Version – GVR August 2024 Data Infographics Report Burnaby East
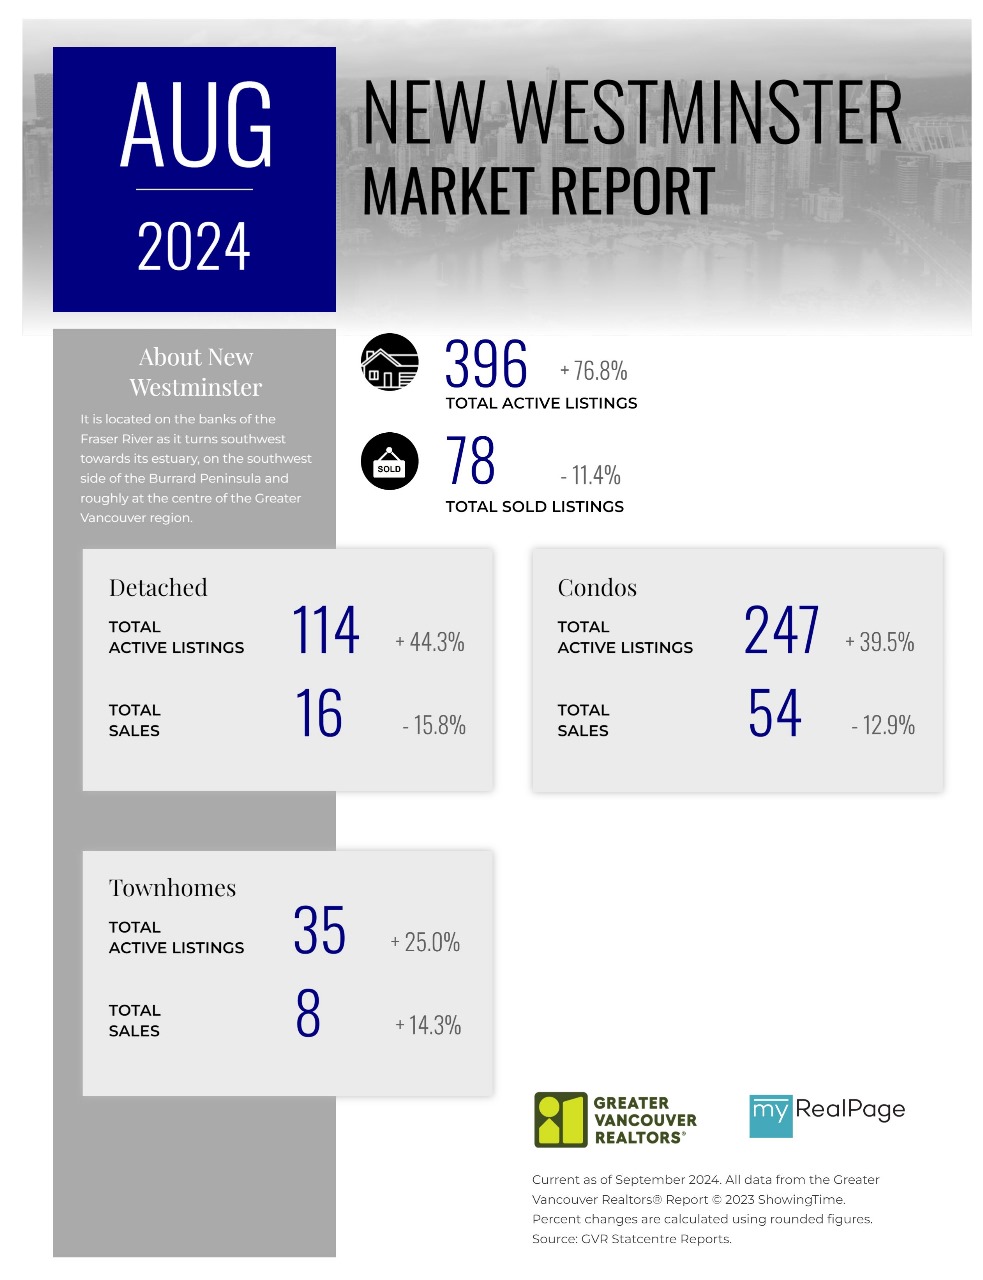
Printable Version – GVR August 2024 Data Infographics Report New Westminster
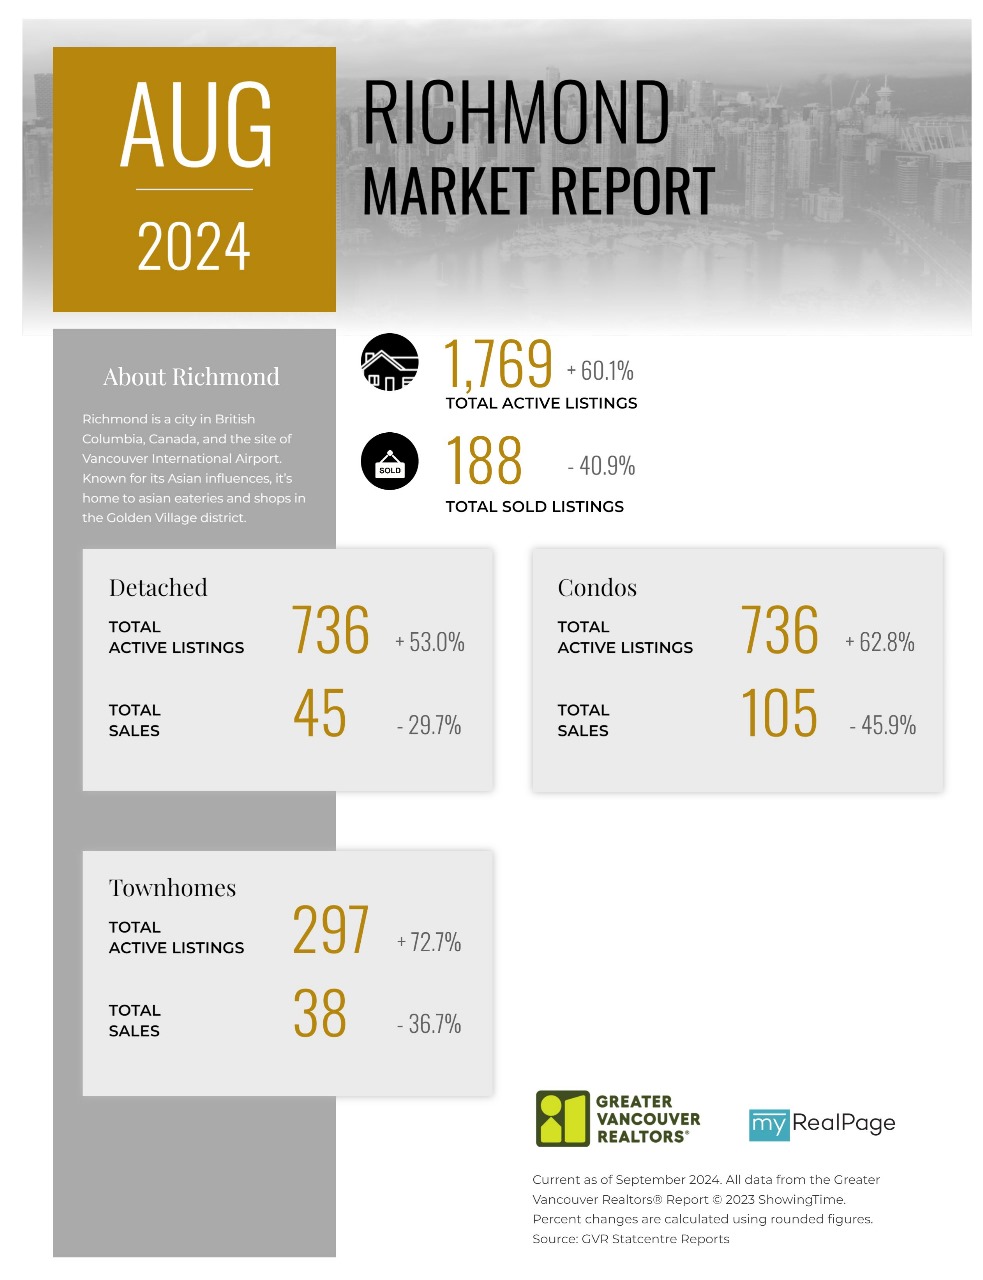
Printable Version – GVR August 2024 Data Infographics Report Richmond
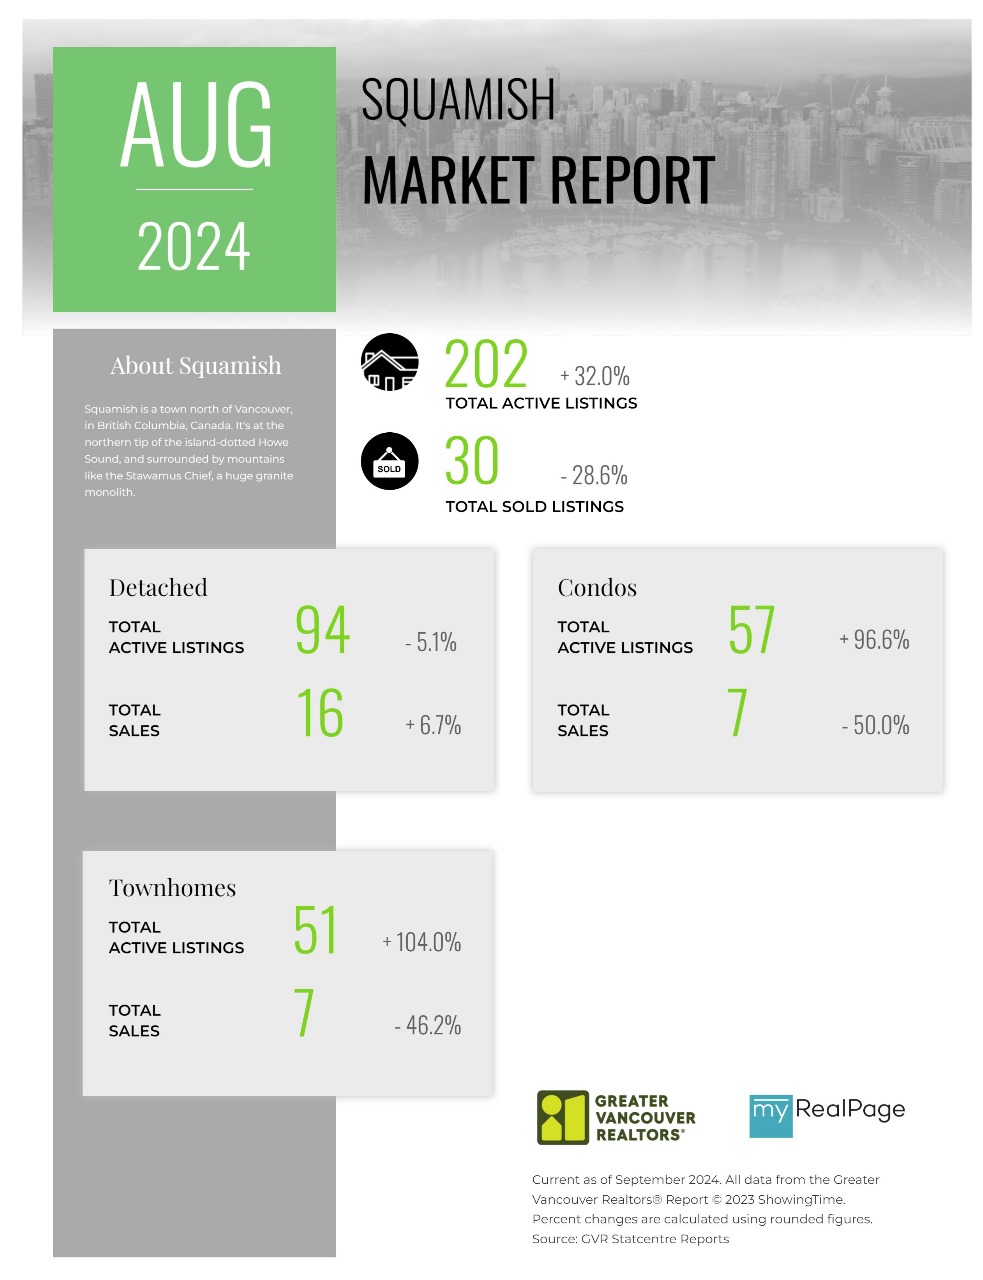
Printable Version – GVR August 2024 Data Infographics Report Squamish
Last Updated on September 11, 2024 by myRealPage
