INFOGRAPHICS: July 2023 REBGV Greater Vancouver Market Reports

Strong sales push Metro Vancouver home prices past July rate hike
Home prices across all home types in Metro Vancouver1 rose again in July, as strong sales figures continue to push up against low levels of housing inventory in the region.
The Real Estate Board of Greater Vancouver (REBGV) reports that residential home sales2 in the region totalled 2,455 in July 2023, a 28.9 per cent increase from the 1,904 sales recorded in July 2022. This was 15.6 per cent below the 10-year seasonal average (2,909).
“While sales remain about 15 per cent below the ten-year average, they are also up about 30 per cent year-over-year, which is not insignificant. Looking under the hood of these figures, it’s easy to see why sales are posting such a large year-over-year percentage increase. Last July marked the point when the Bank of Canada announced their ‘super-sized’ increase to the policy rate of one full per cent, catching buyers and sellers off guard, and putting a chill on market activity at that time.”
Andrew Lis, REBGV director of economics and data analytics
Read the full report on the REBGV website!
The following data is a comparison between July 2023 and July 2022 numbers, and is current as of August 2023. For last month’s update, you can check out our previous post!
Or follow this link for all our REBGV Infographics!
These infographics cover current trends in several areas within the Greater Vancouver region. Click on the images for a larger view!
Printable Version – REBGV July 2023 Data Infographic Report North Vancouver
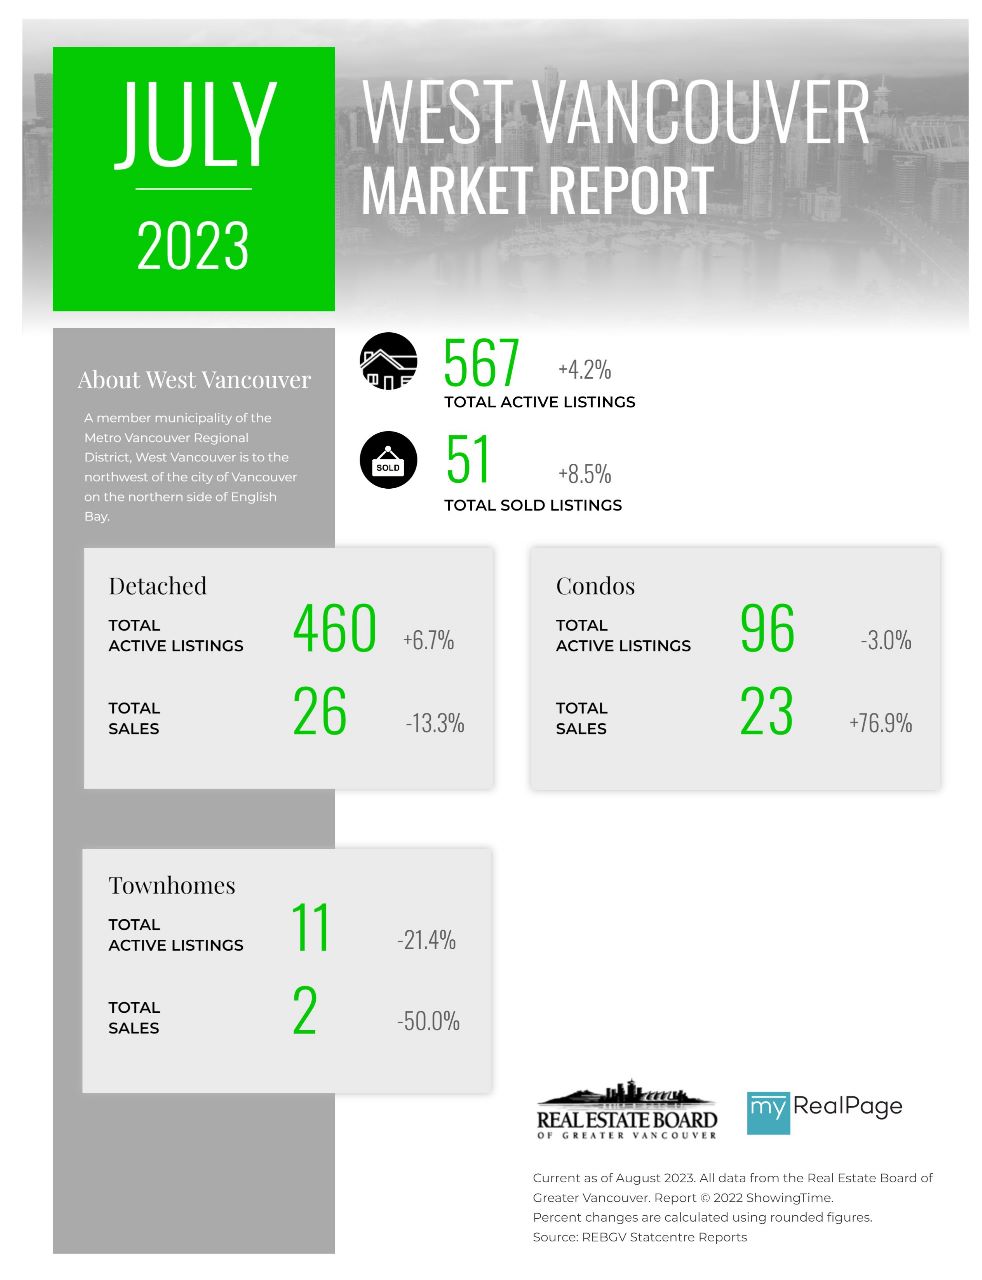
Printable Version – REBGV July 2023 Data Infographics Report West Vancouver
Printable Version – REBGV July 2023 Data Infographics Report Vancouver West
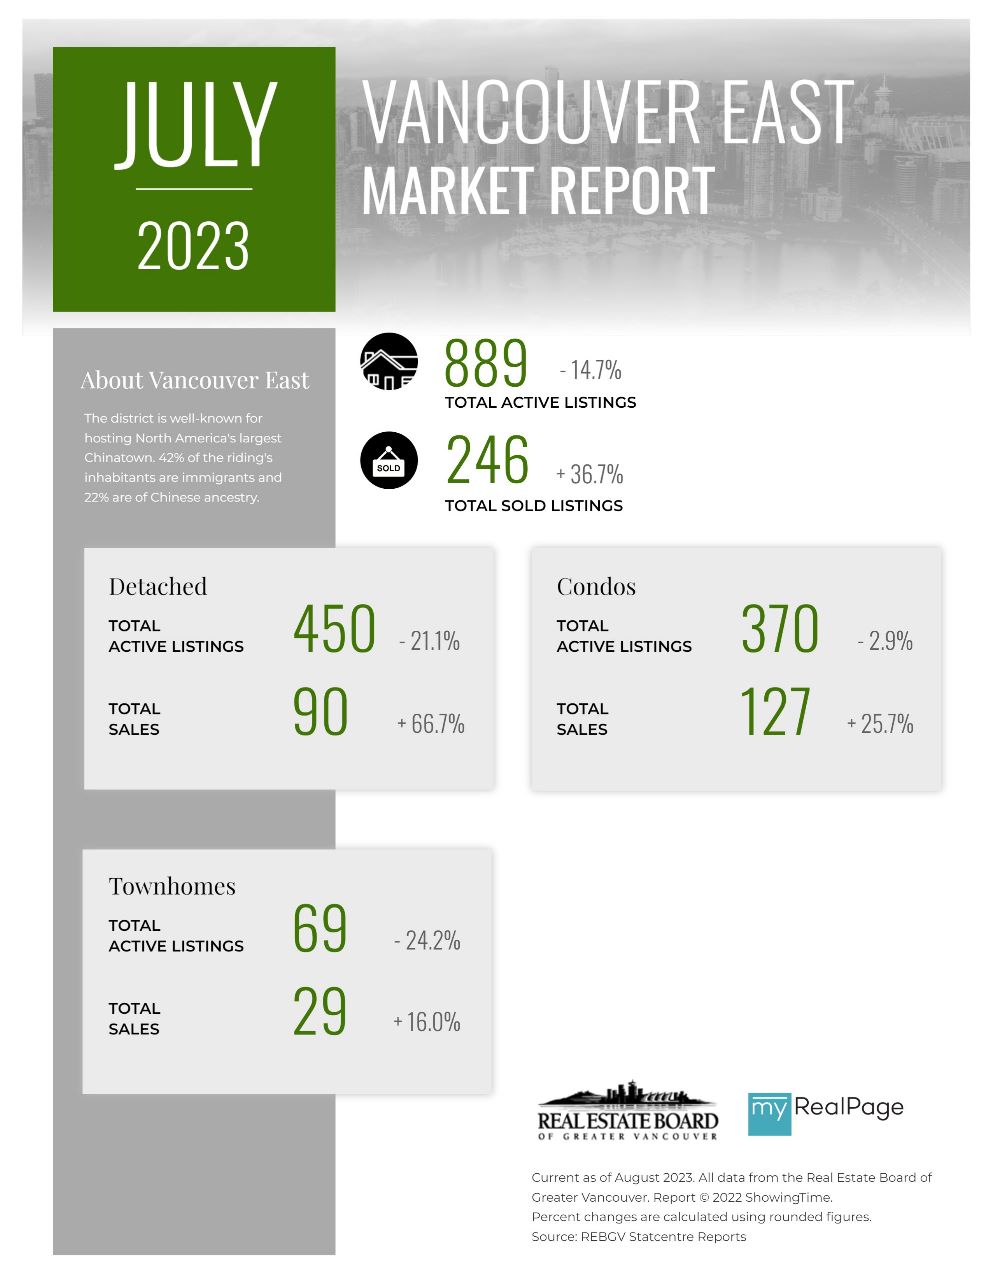
Printable Version – REBGV July 2023 Data Infographics Report Vancouver East
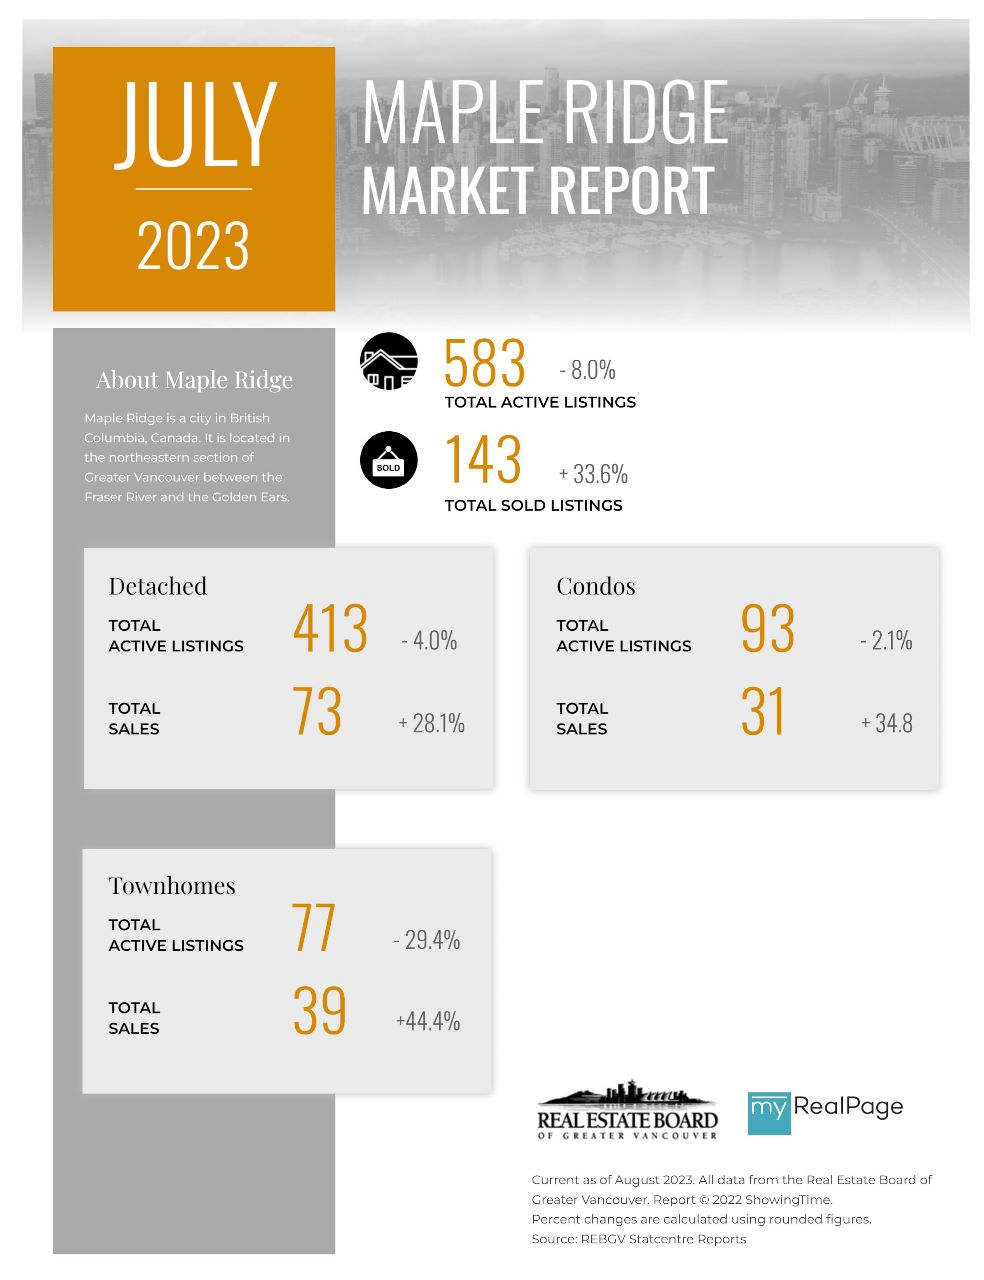
Printable Version – REBGV July 2023 Data Infographic Report Maple Ridge
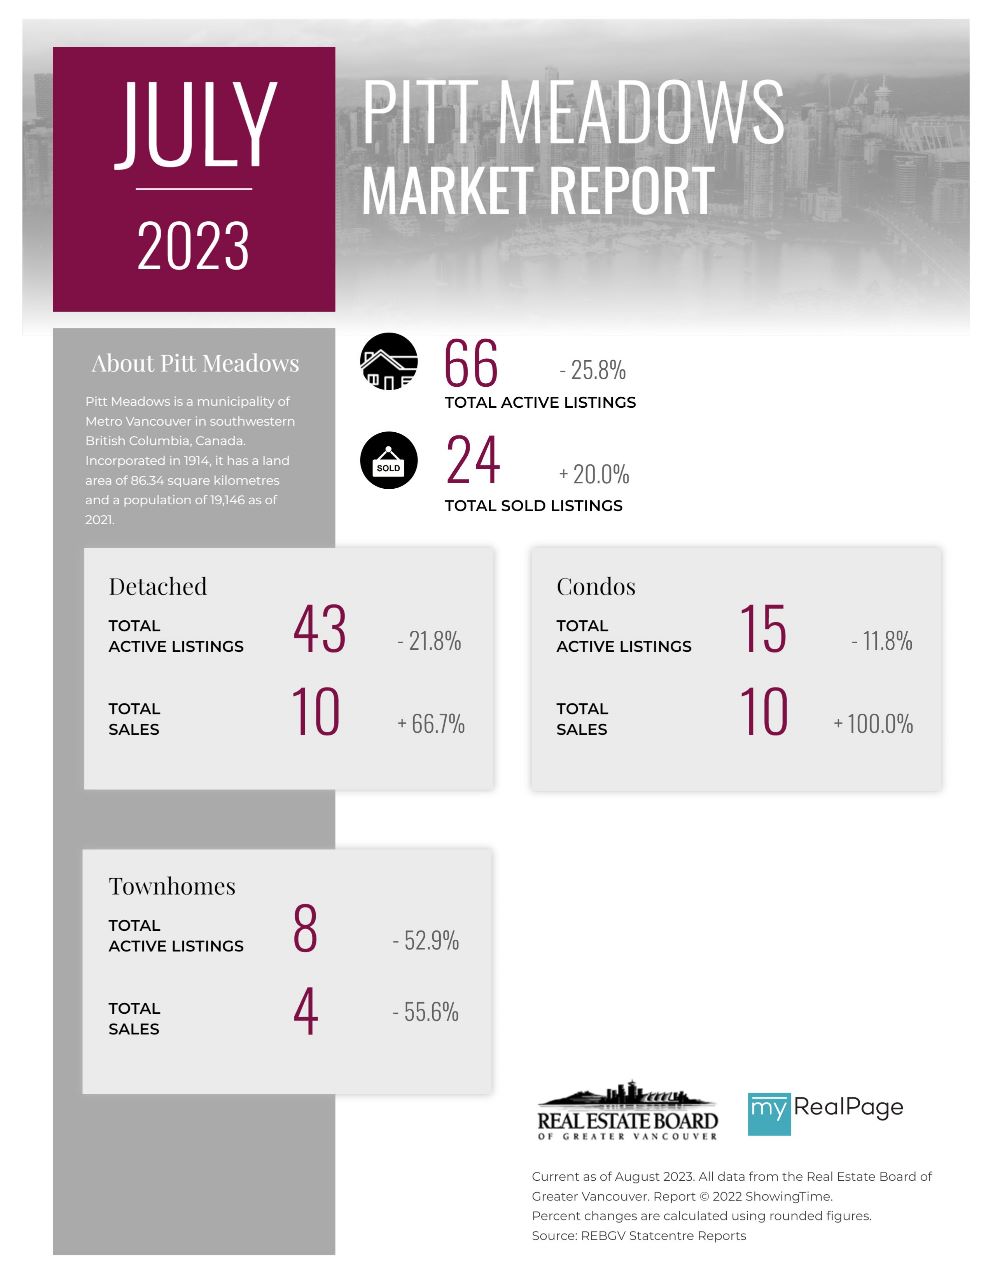
Printable Version – REBGV July 2023 Data Infographics Report Pitt Meadows
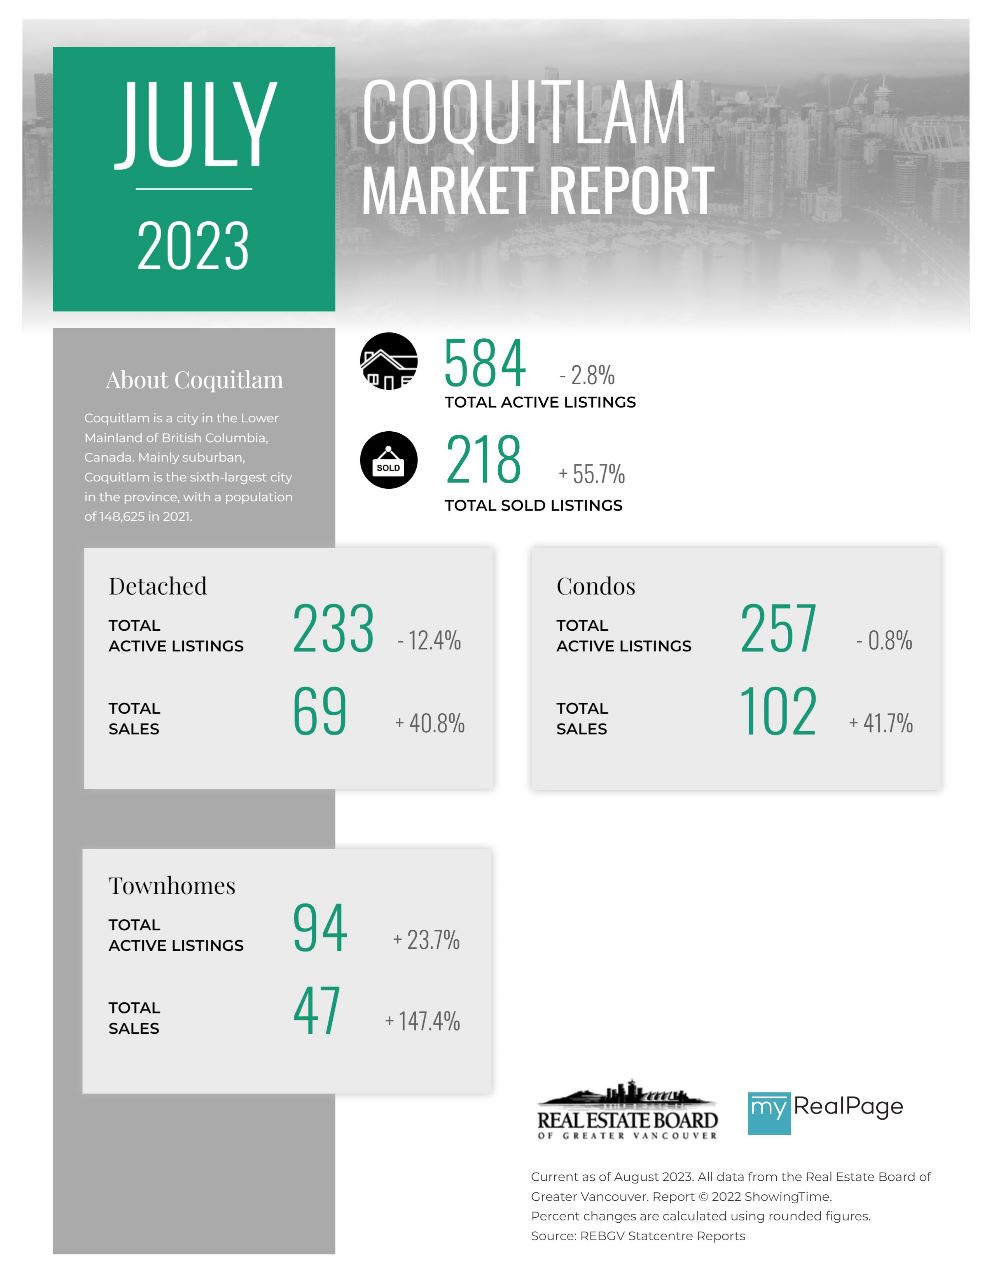
Printable Version – REBGV July 2023 Data Infographics Report Coquitlam
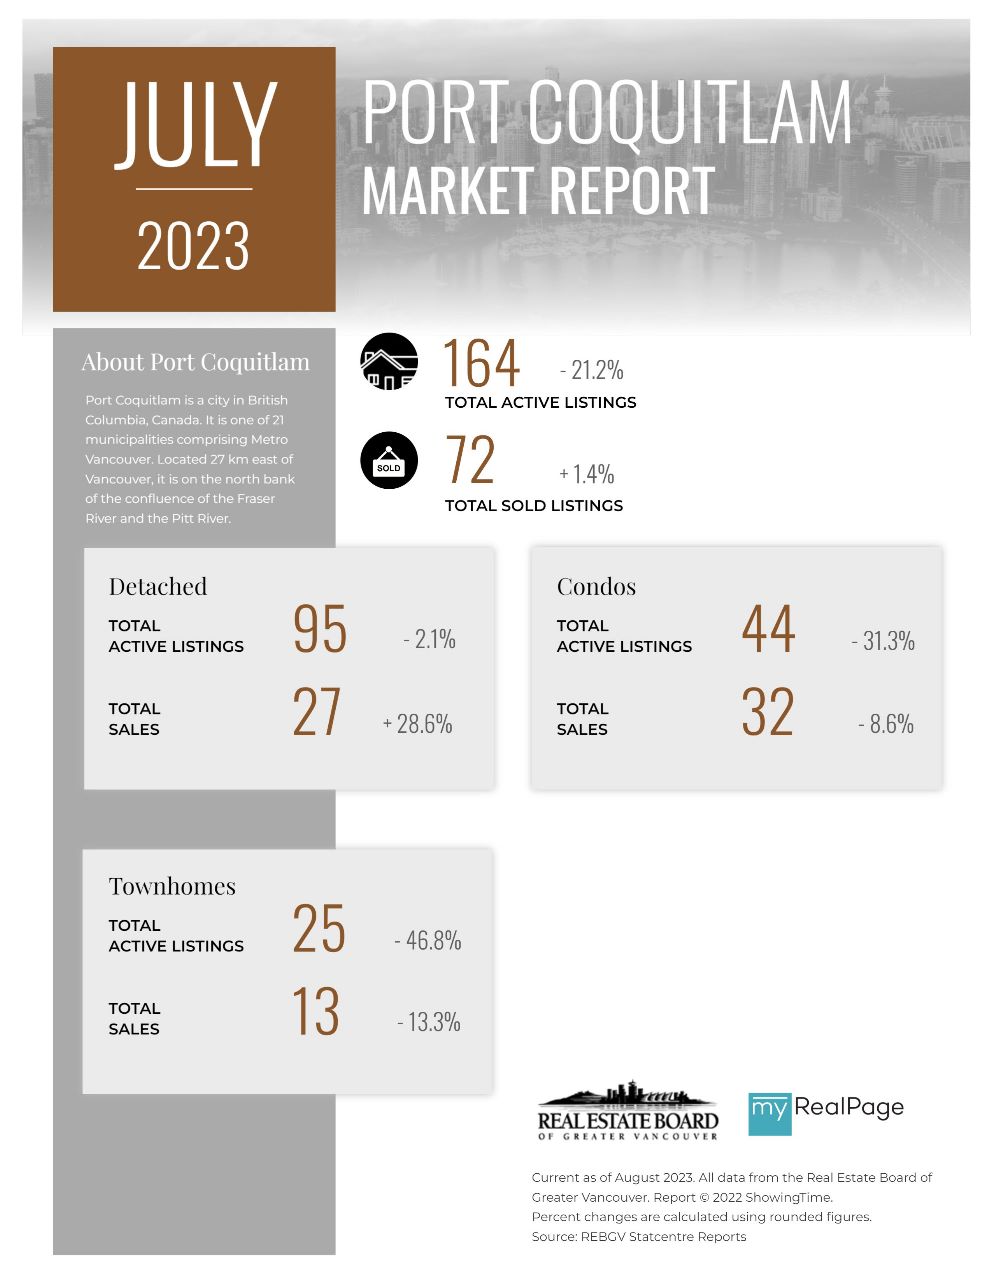
Printable Version – REBGV July 2023 Data Infographics Report Port Coquitlam
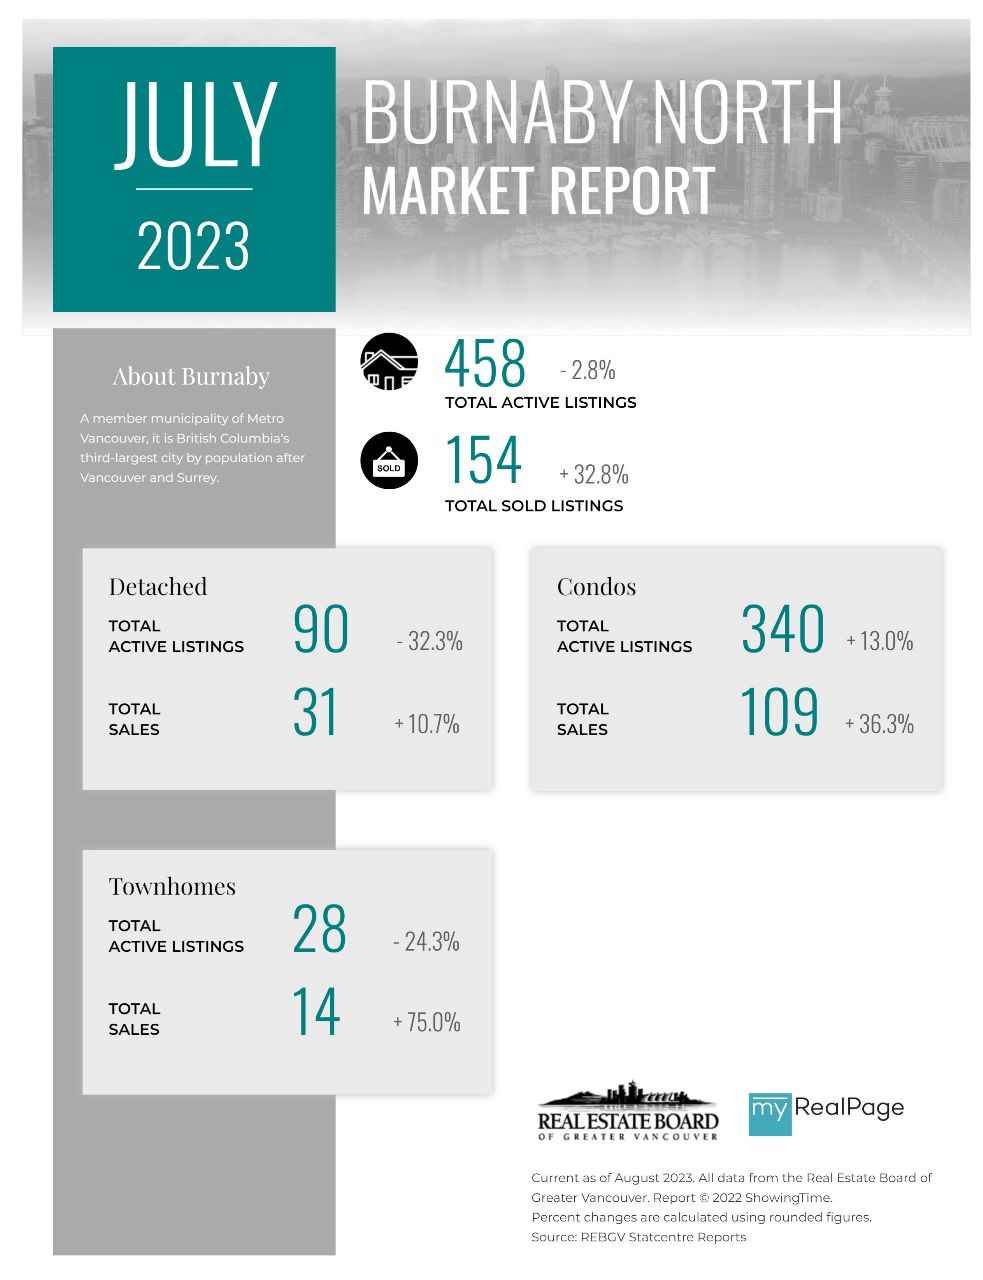
Printable Version – REBGV July 2023 Data Infographic Report Burnaby North
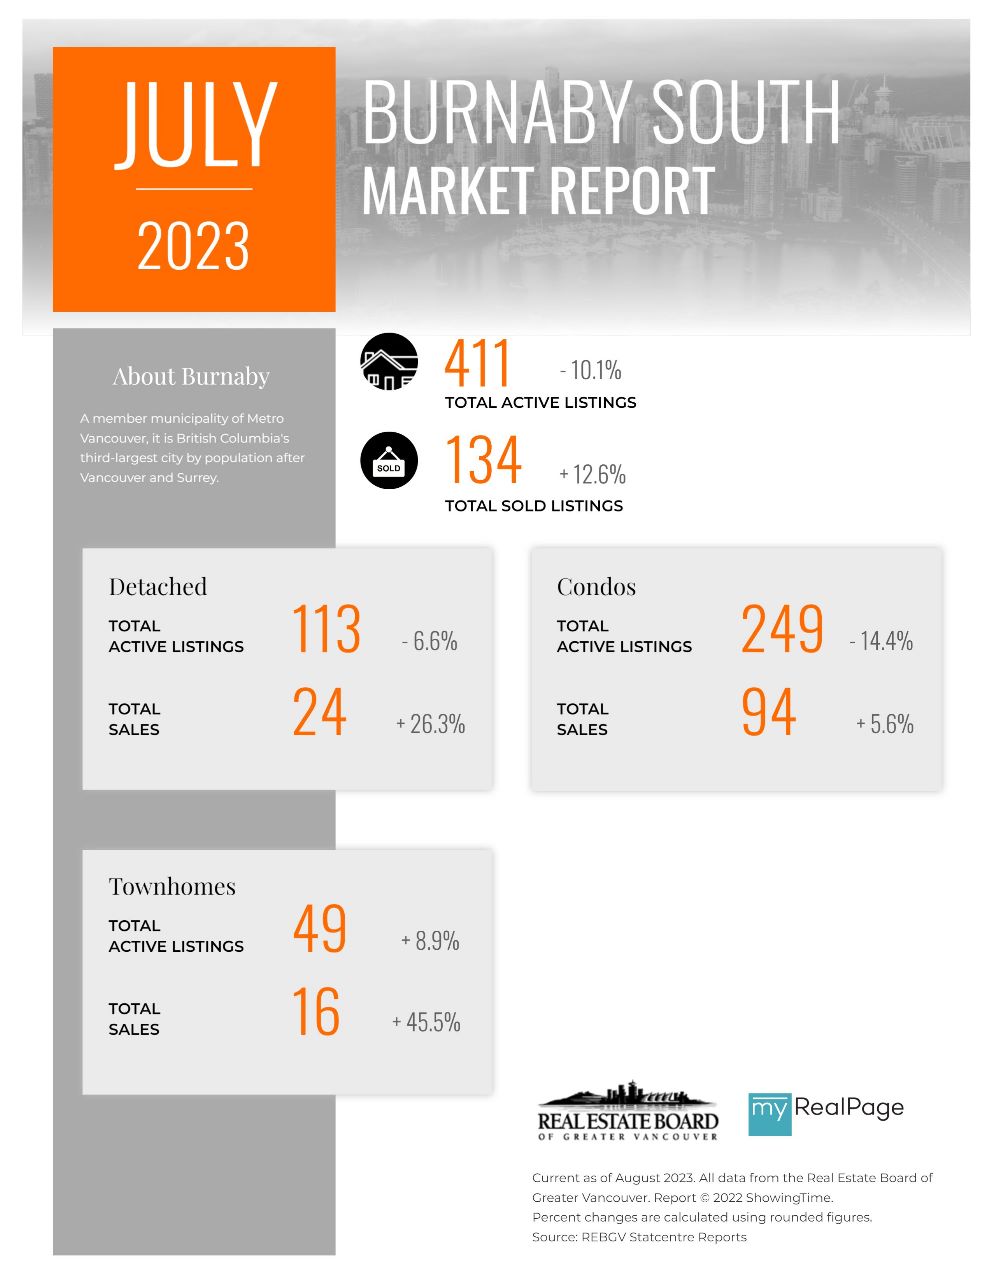
Printable Version – REBGV July 2023 Data Infographics Report Burnaby South
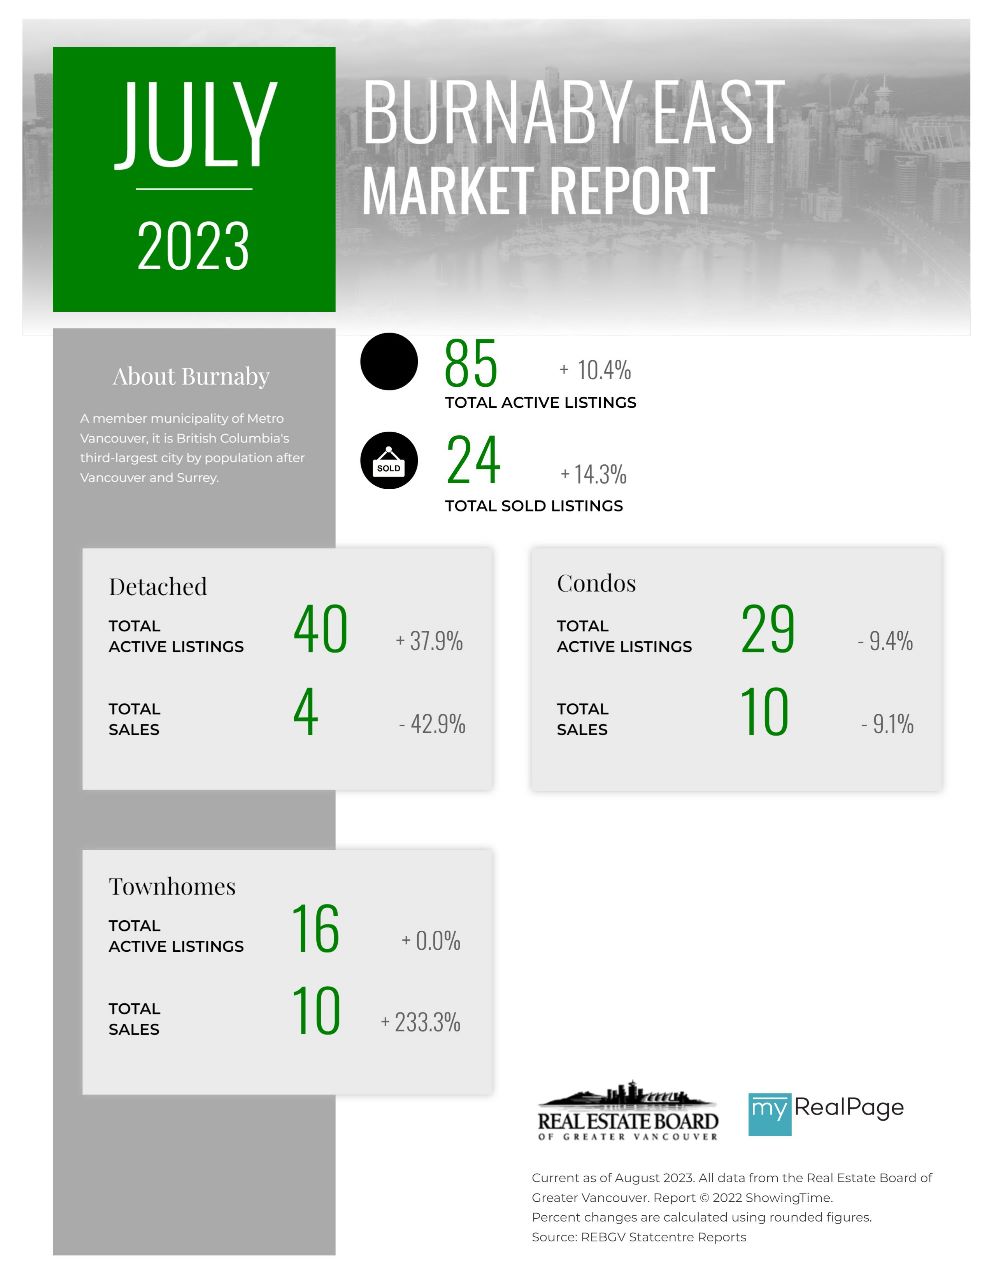
Printable Version – REBGV July 2023 Data Infographics Report Burnaby East
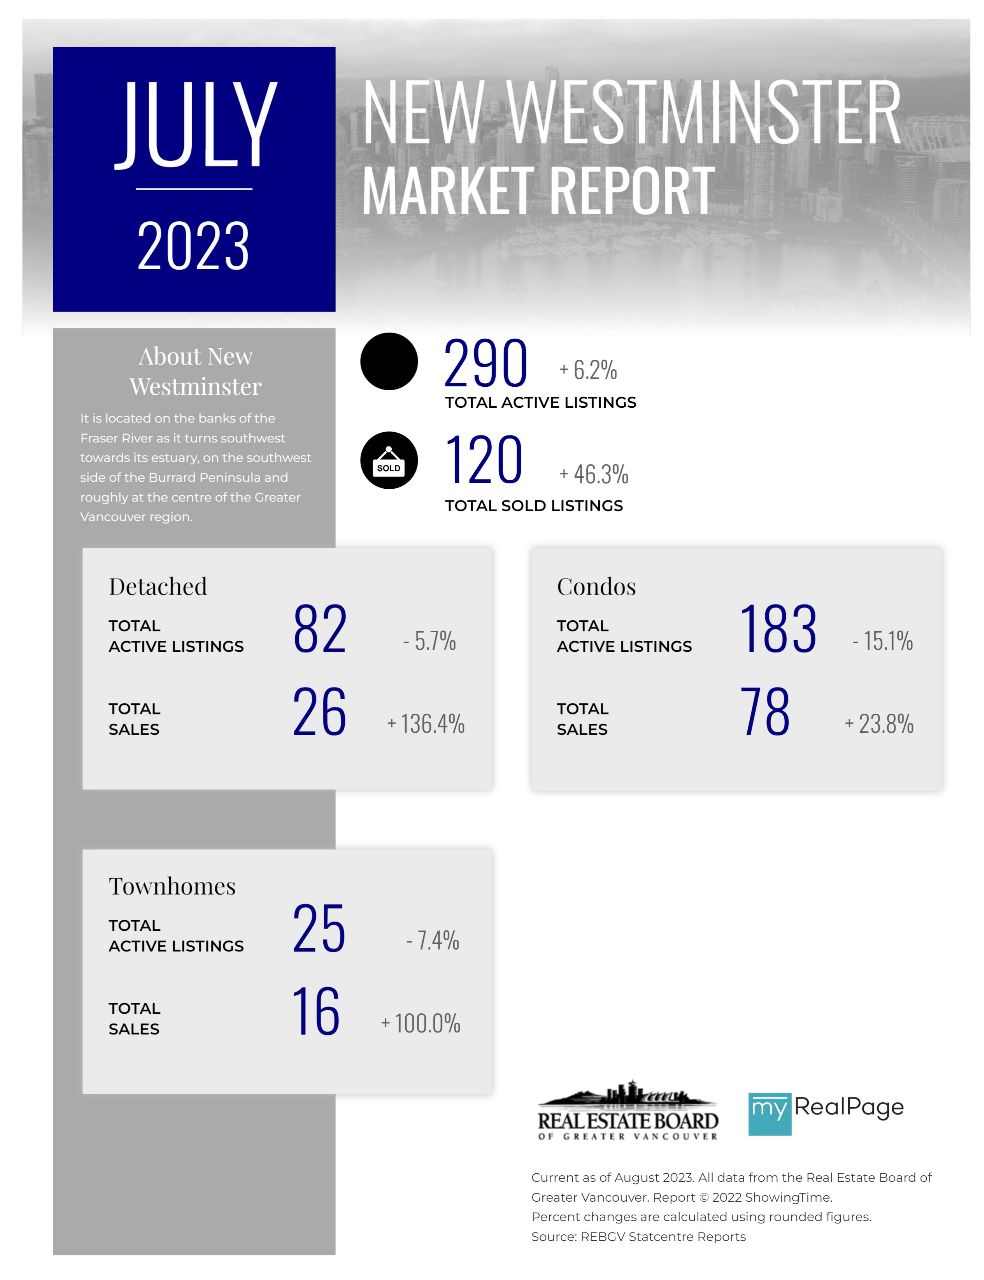
Printable Version – REBGV July 2023 Data Infographics Report New Westminster
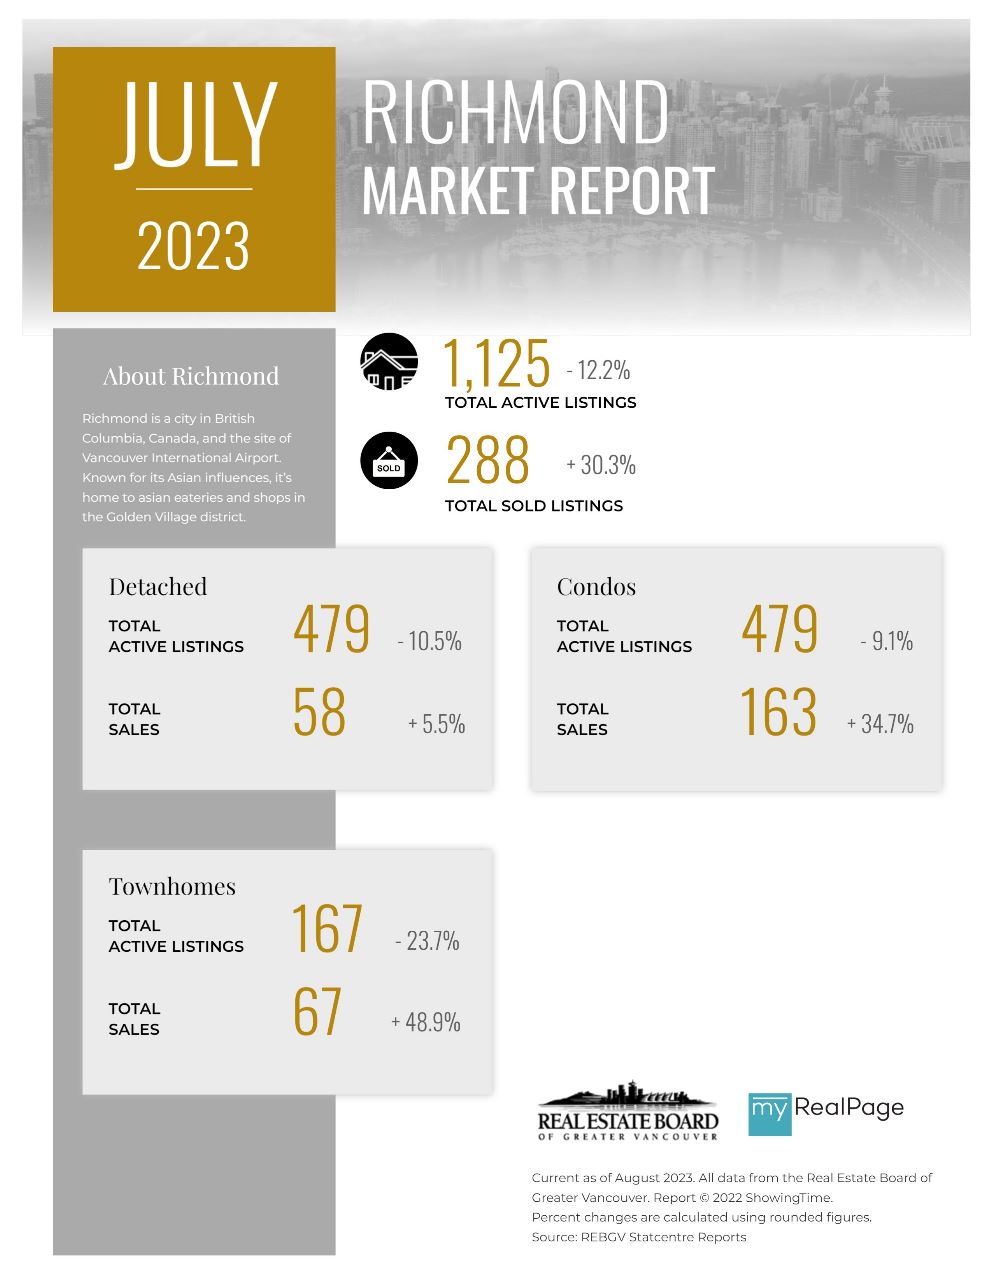
Printable Version – REBGV July 2023 Data Infographics Report Richmond


Last Updated on August 7, 2023 by myRealPage
