INFOGRAPHICS: June 2023 REBGV Greater Vancouver Market Reports

Home prices continue to rise in housing market to kick off summer
Continuing the trend that has emerged in the housing market this year, the benchmark price for all home types in Metro Vancouver1 increased in June as home buyer demand butted up against a limited inventory of homes for sale in the region.
The Real Estate Board of Greater Vancouver (REBGV) reports that residential home sales2 in the region totalled 2,988 in June 2023, a 21.1 per cent increase from the 2,467 sales recorded in June 2022. This was 8.6 per cent below the 10-year seasonal average (3,269).
“The market continues to outperform expectations across all segments, but the apartment segment showed the most relative strength in June. The benchmark price of apartment homes is almost cresting the peak reached in 2022, while sales of apartments are now above the region’s ten-year seasonal average. This uniquely positions the apartment segment relative to the attached and detached segments where sales remained below the ten-year seasonal averages.”
Andrew Lis, REBGV director of economics and data analytics
Read the full report on the REBGV website!
The following data is a comparison between June 2023 and June 2022 numbers, and is current as of July 2023. For last month’s update, you can check out our previous post!
Or follow this link for all our REBGV Infographics!
These infographics cover current trends in several areas within the Greater Vancouver region. Click on the images for a larger view!
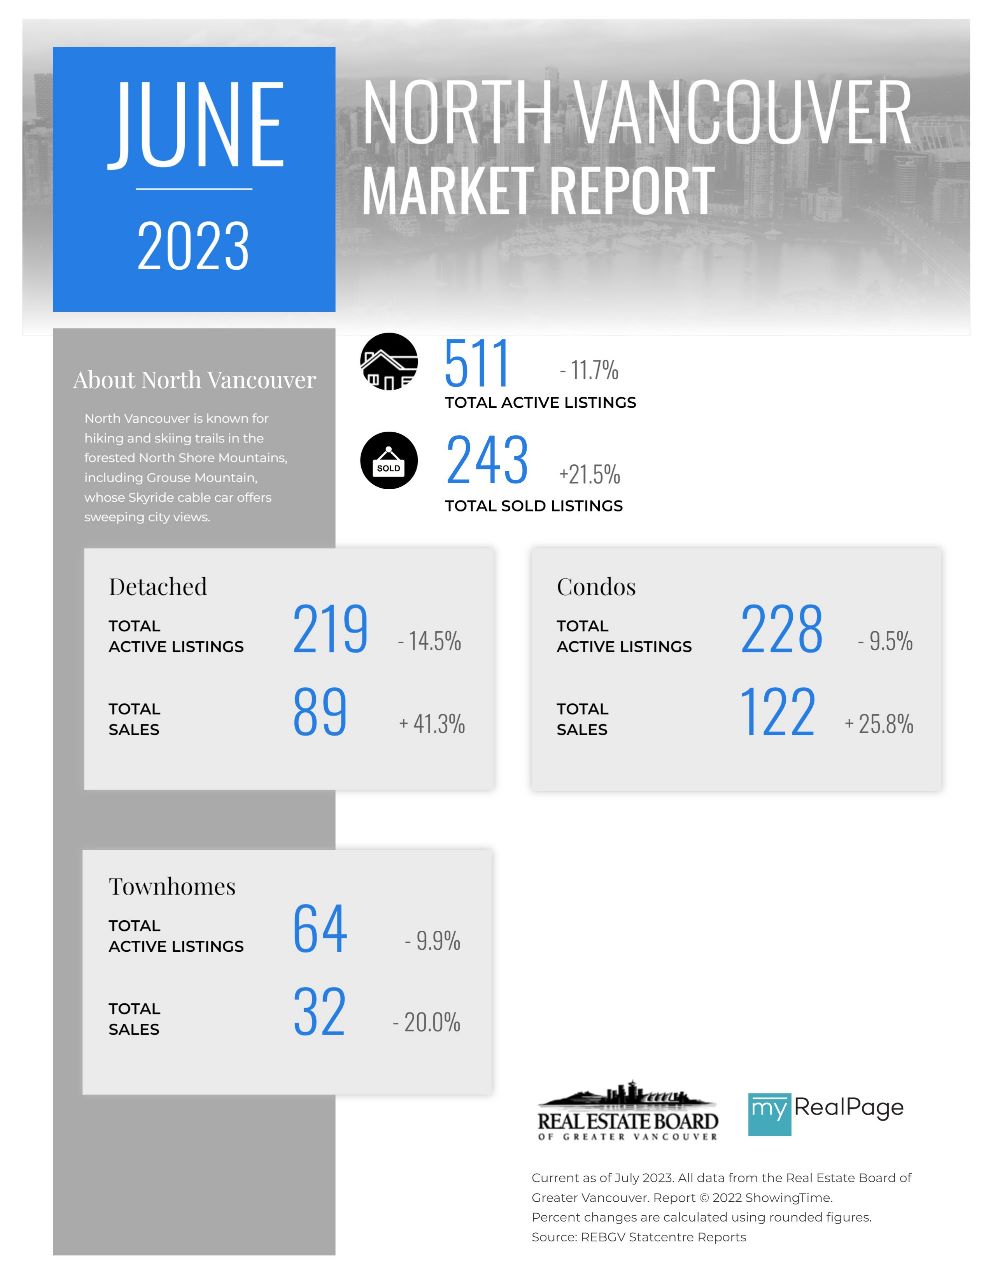
Printable Version – REBGV June 2023 Data Infographic Report North Vancouver
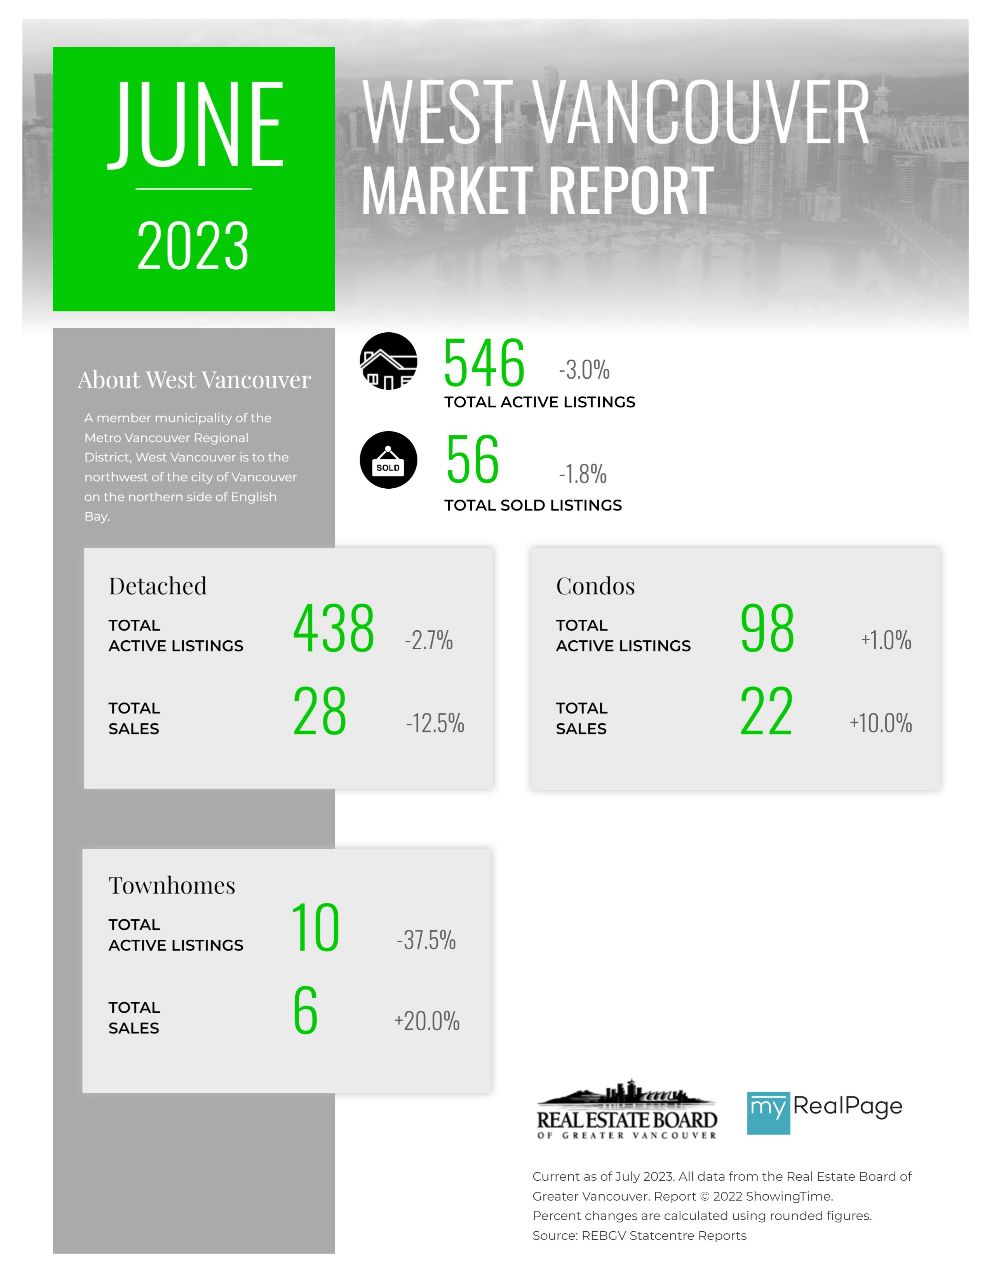
Printable Version – REBGV June 2023 Data Infographics Report West Vancouver
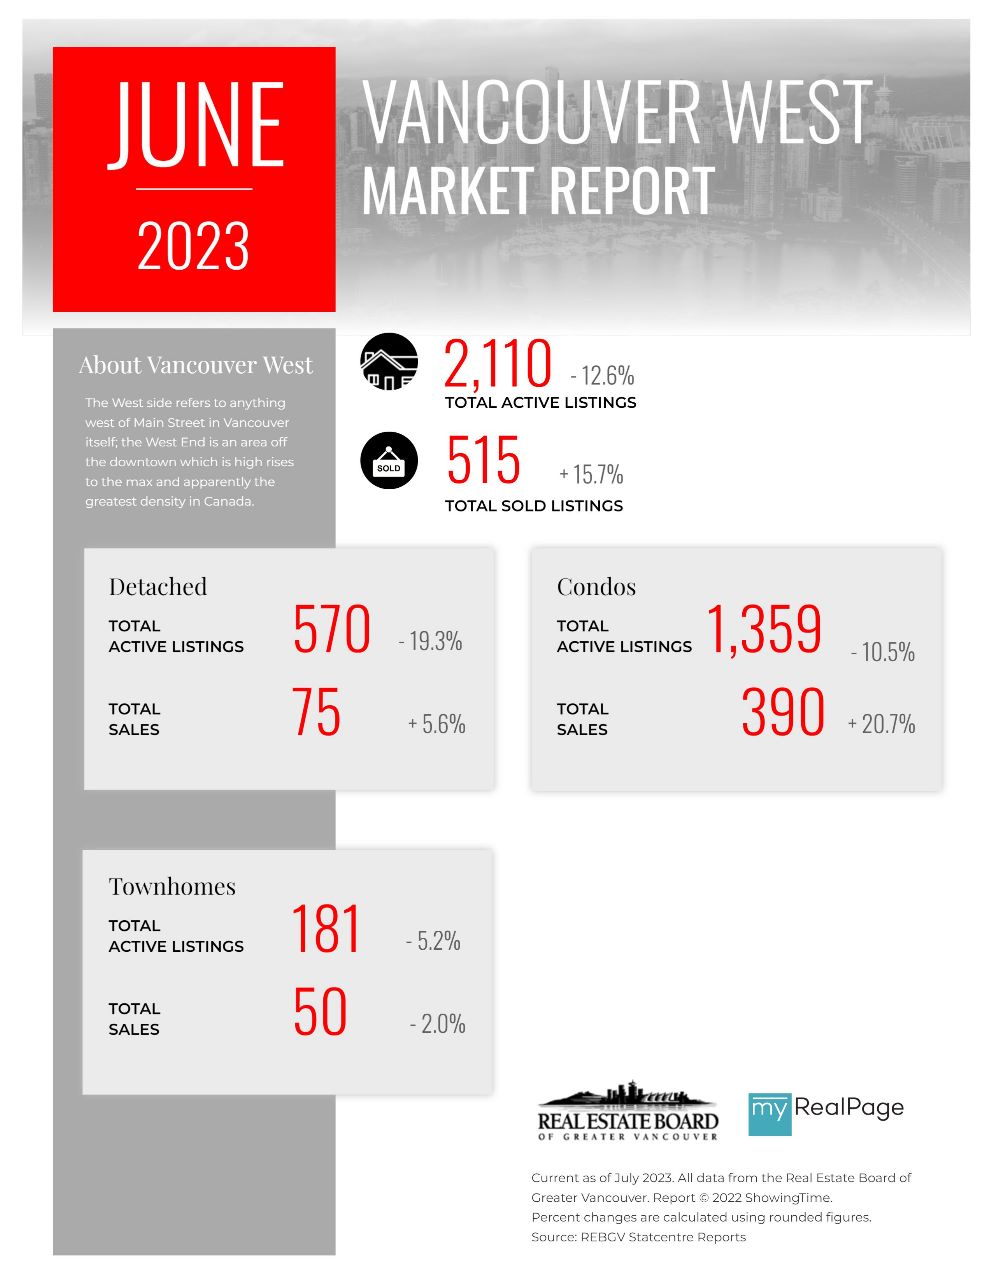
Printable Version – REBGV June 2023 Data Infographics Report Vancouver West
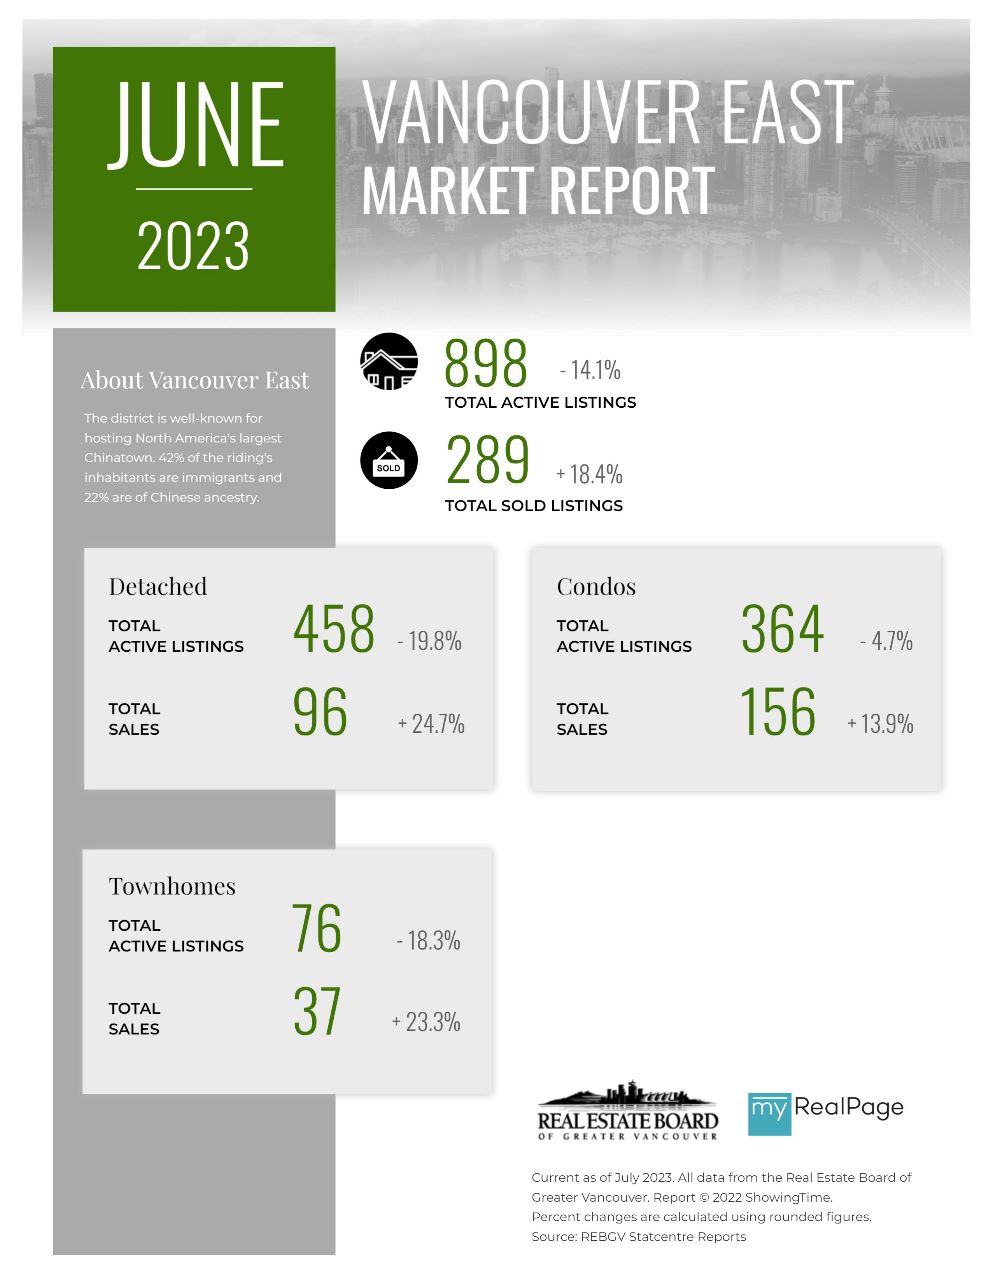
Printable Version – REBGV June 2023 Data Infographics Report Vancouver East
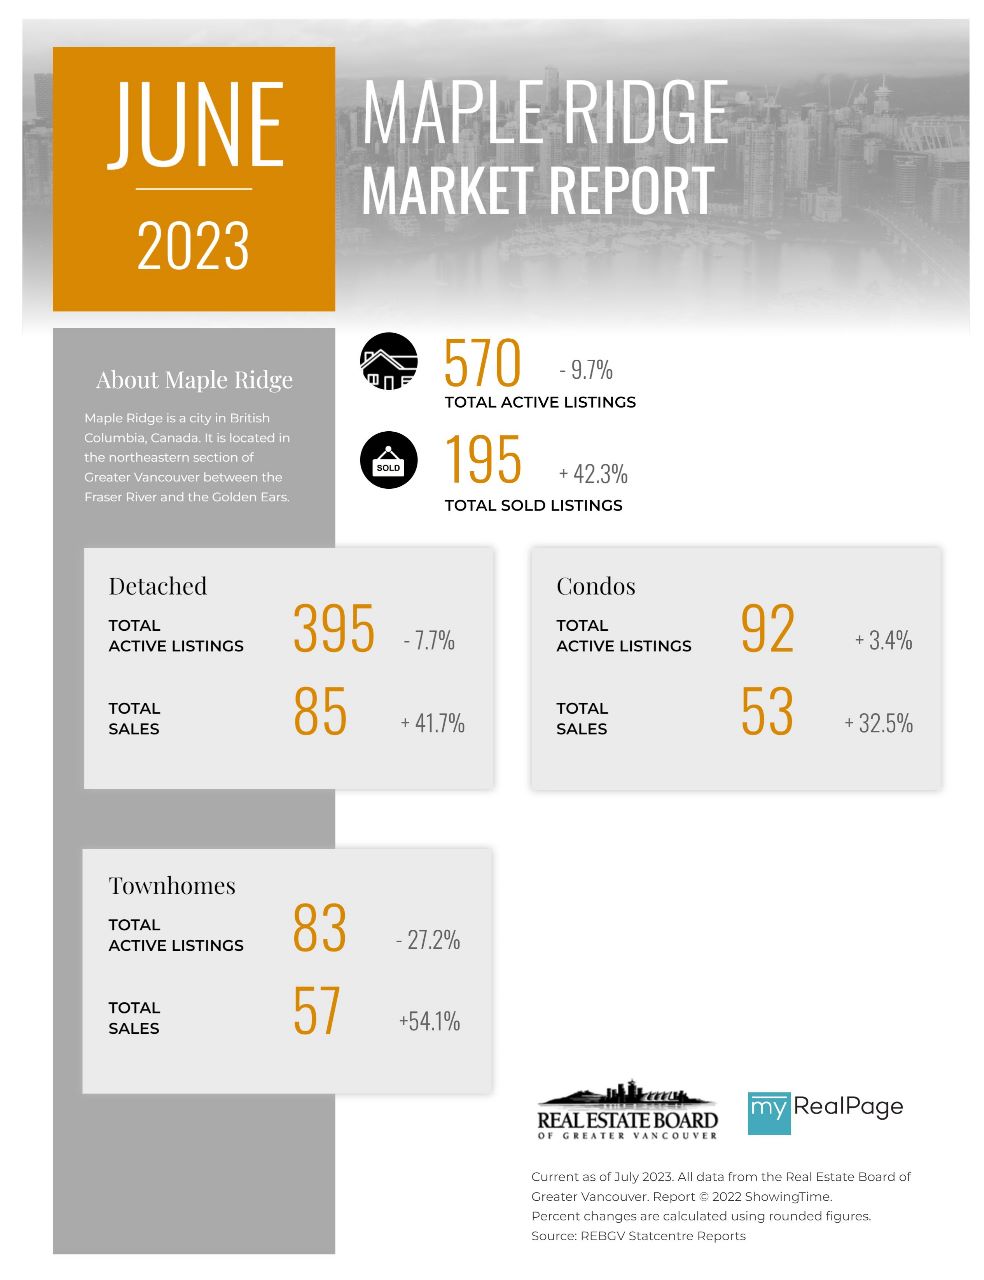
Printable Version – REBGV June 2023 Data Infographic Report Maple Ridge
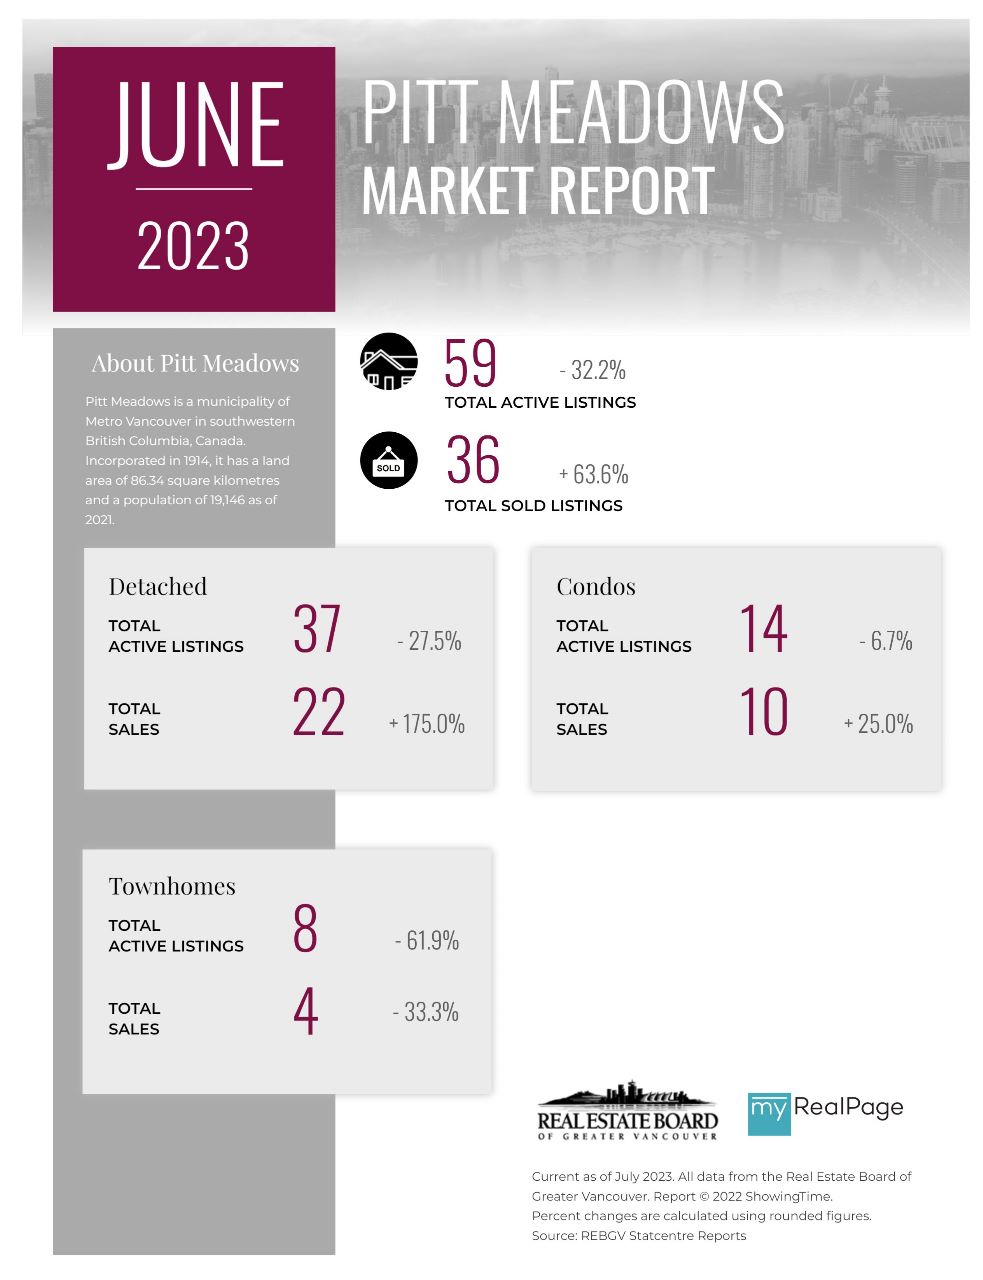
Printable Version – REBGV June 2023 Data Infographics Report Pitt Meadows
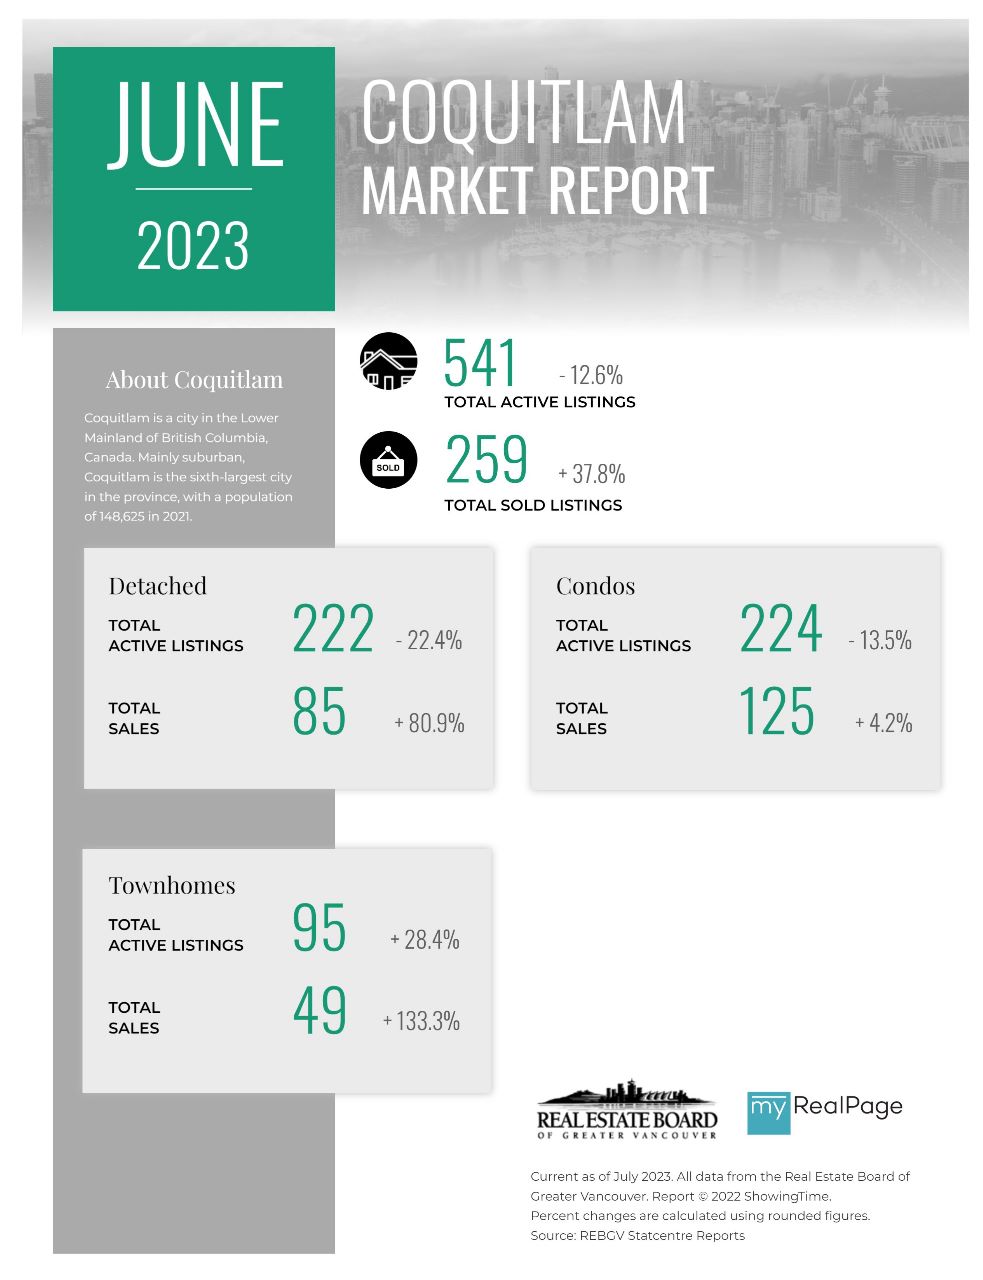
Printable Version – REBGV June 2023 Data Infographics Report Coquitlam
Printable Version – REBGV June 2023 Data Infographics Report Port Coquitlam
Printable Version – REBGV June 2023 Data Infographic Report Burnaby North
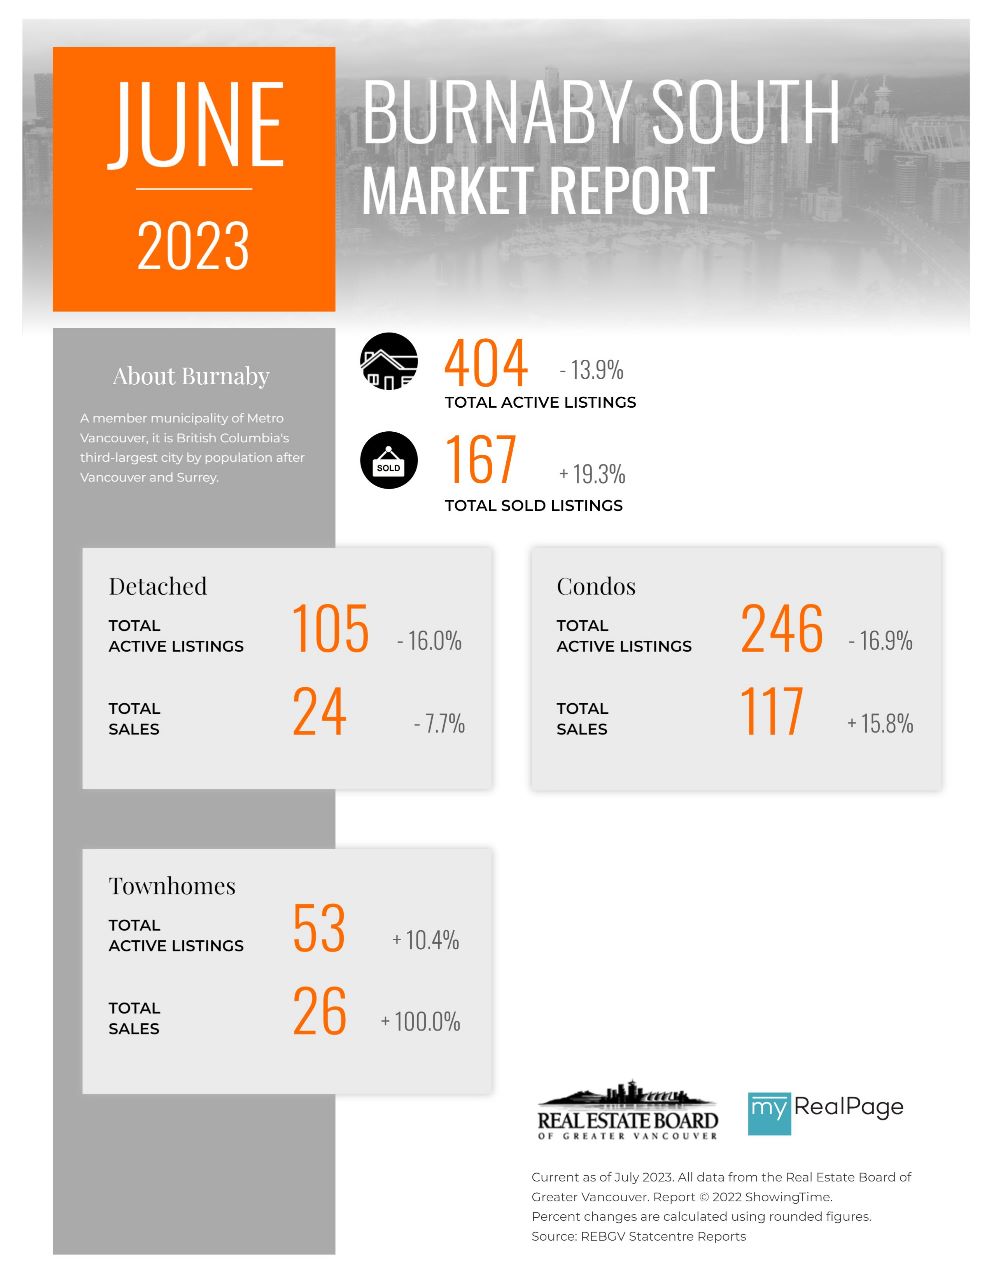
Printable Version – REBGV June 2023 Data Infographics Report Burnaby South
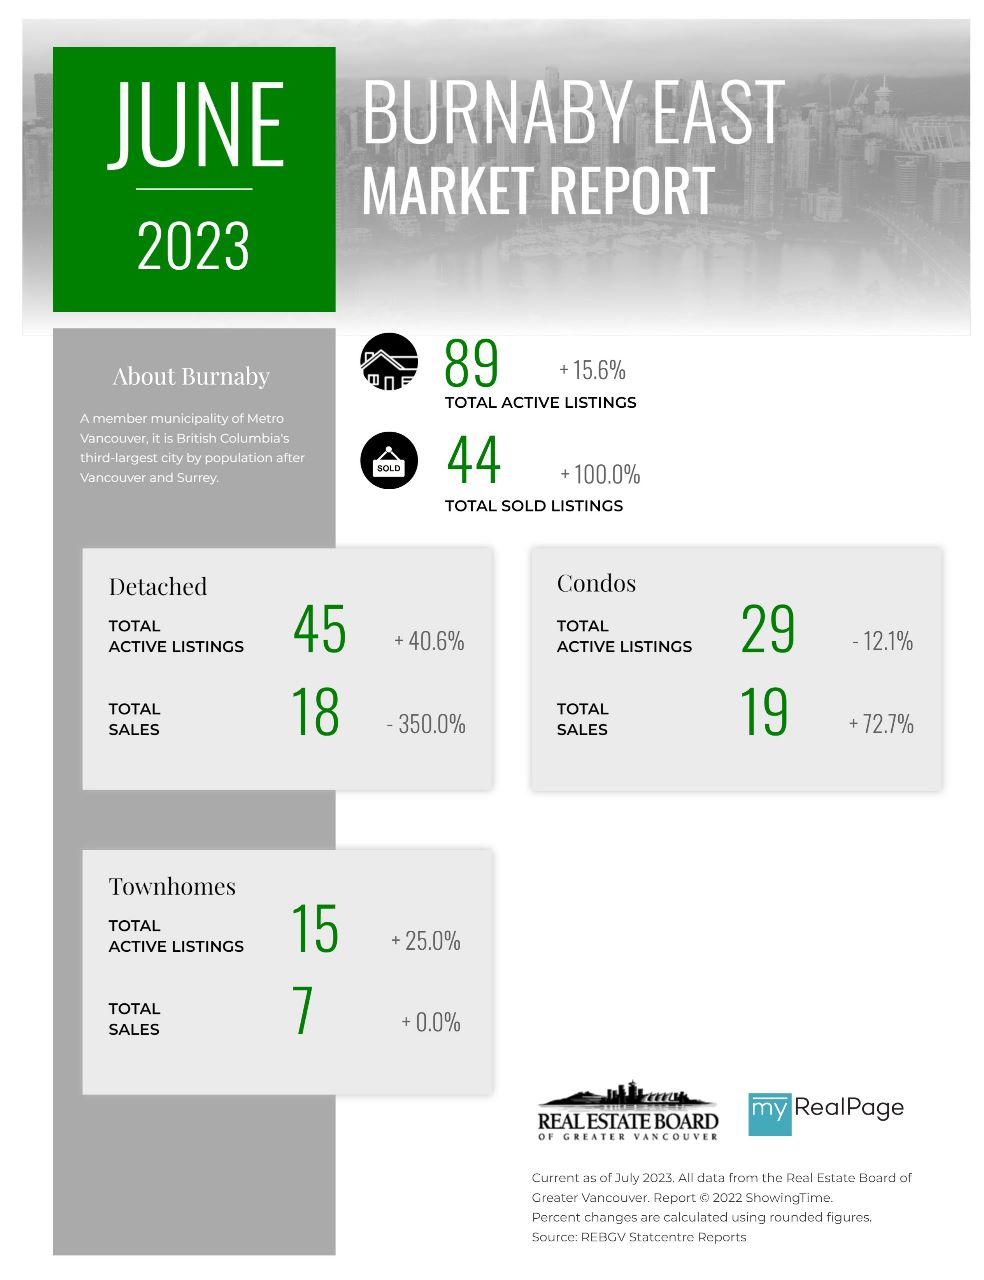
Printable Version – REBGV June 2023 Data Infographics Report Burnaby East
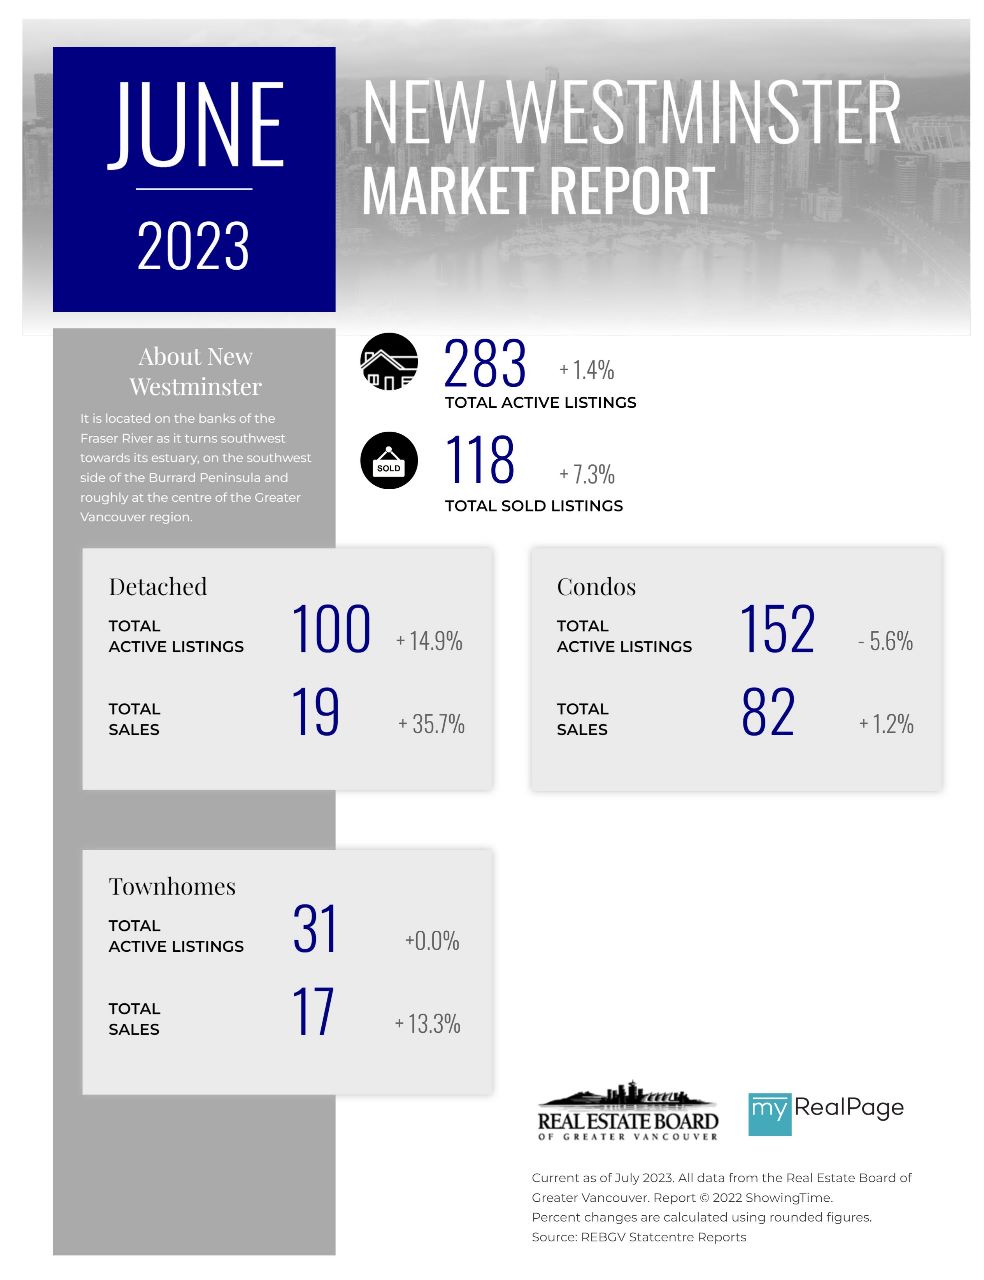
Printable Version – REBGV June 2023 Data Infographics Report New Westminster
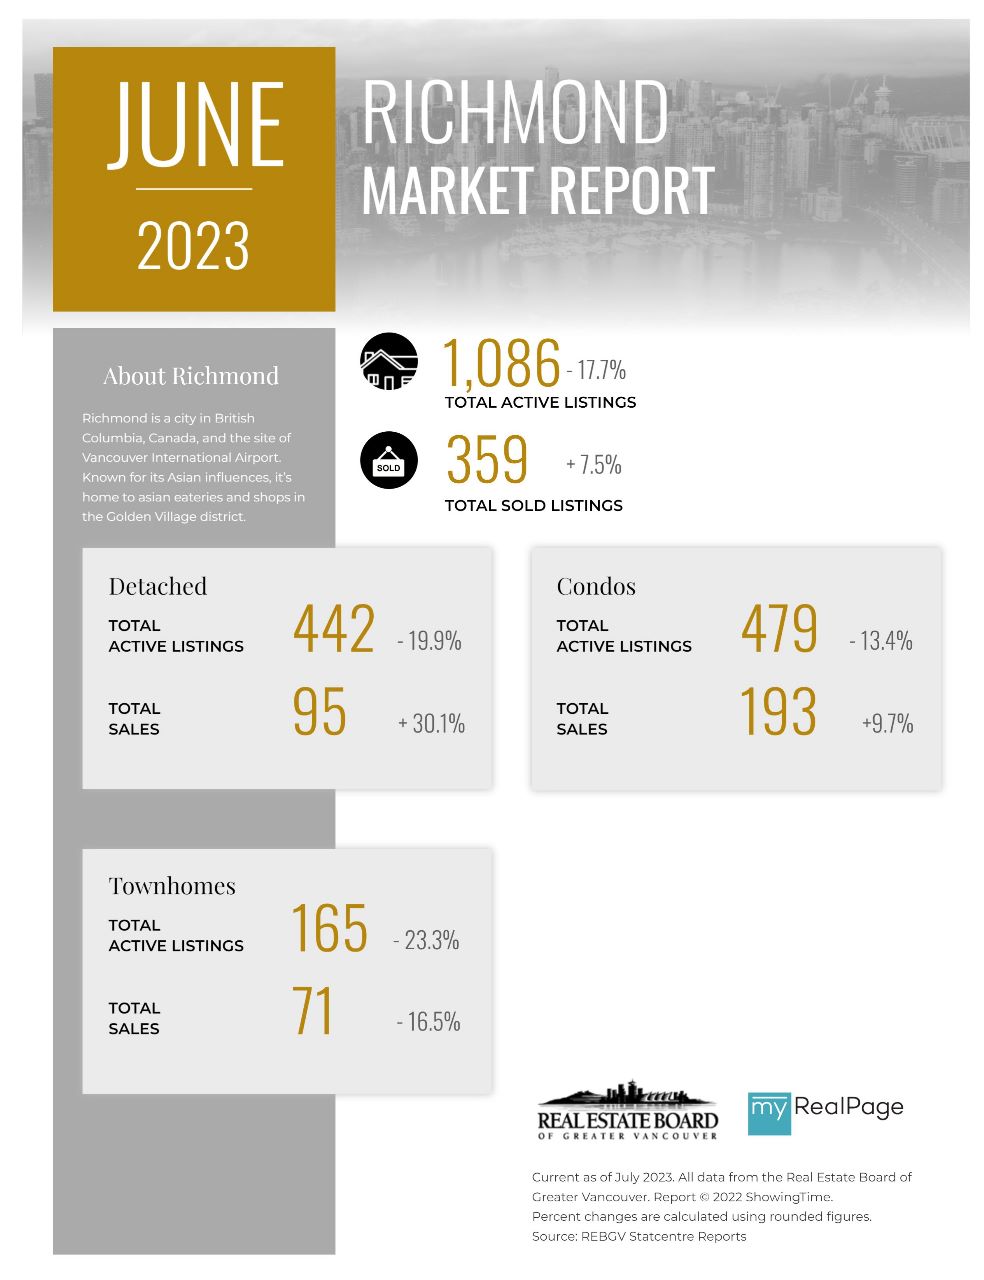
Printable Version – REBGV June 2023 Data Infographics Report Richmond


Last Updated on July 7, 2023 by myRealPage
