INFOGRAPHICS: February 2026 GVR Greater Vancouver Market Reports

Buyers and sellers adopting a wait-and-see approach to housing market
Home sales registered on the MLS® in Metro Vancouver continue evolving at a pace similar to last year, with the sales down roughly three per cent from last March.
The Greater Vancouver REALTORS® (GVR) reports that residential sales in the region totalled 2,032 in March 2026, a 2.8 per cent decrease from the 2,091 sales recorded in March 2025. This was 31.8 per cent below the 10-year seasonal average (2,981).
“Year-to-date, sales are tracking our forecast for the year closely, and the weakness in demand we continue to observe at the aggregate level is unsurprising. What’s interesting is that the aggregate total masks an emerging divergence among market segments. While the multifamily segment continues to see slower sales, the detached segment may be awakening with sales up, and new listings down from last year.” said Andrew Lis, GVR chief economist and vice-president data analytics
Read the full report on the REBGV website!
The following data is a comparison between March 2026 and March 2025 numbers, and is current as of April of 2026. For last month’s update, you can check out our previous post!
Or follow this link for all our GVR Infographics!
These infographics cover current trends in several areas within the Greater Vancouver region. Click on the images for a larger view!
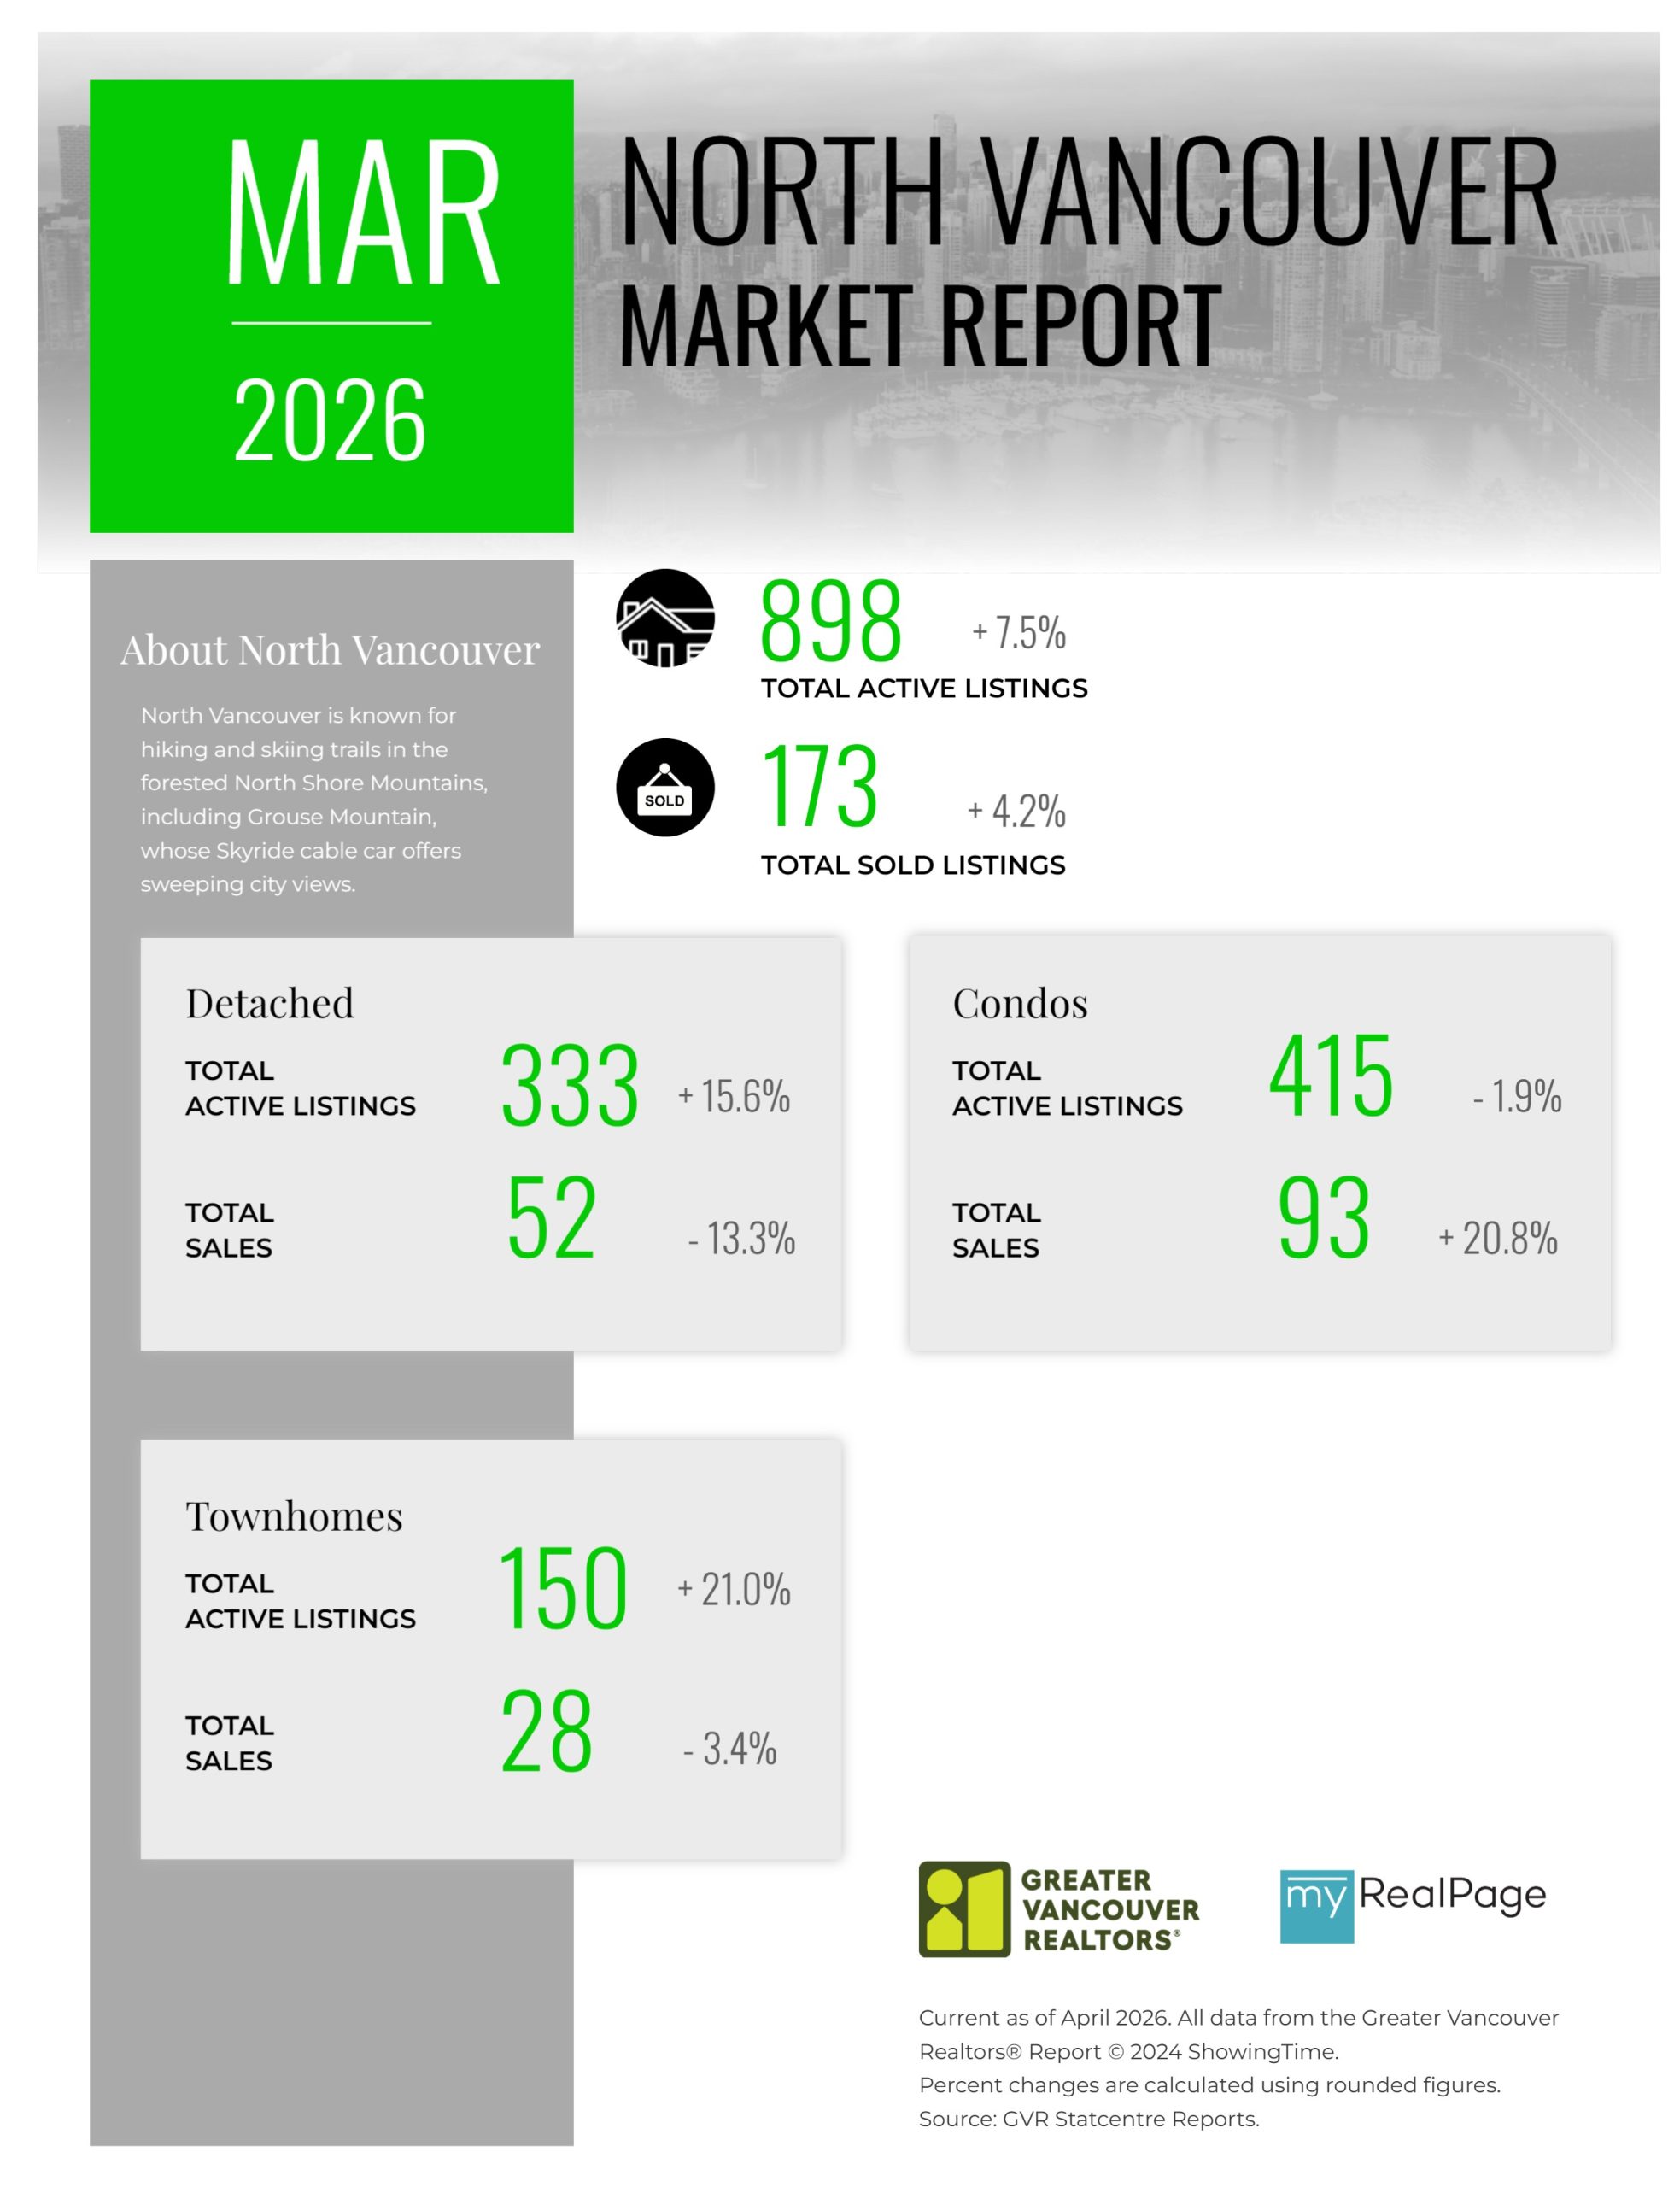
Printable Version – GVR March 2026 Data Infographic Report North Vancouver
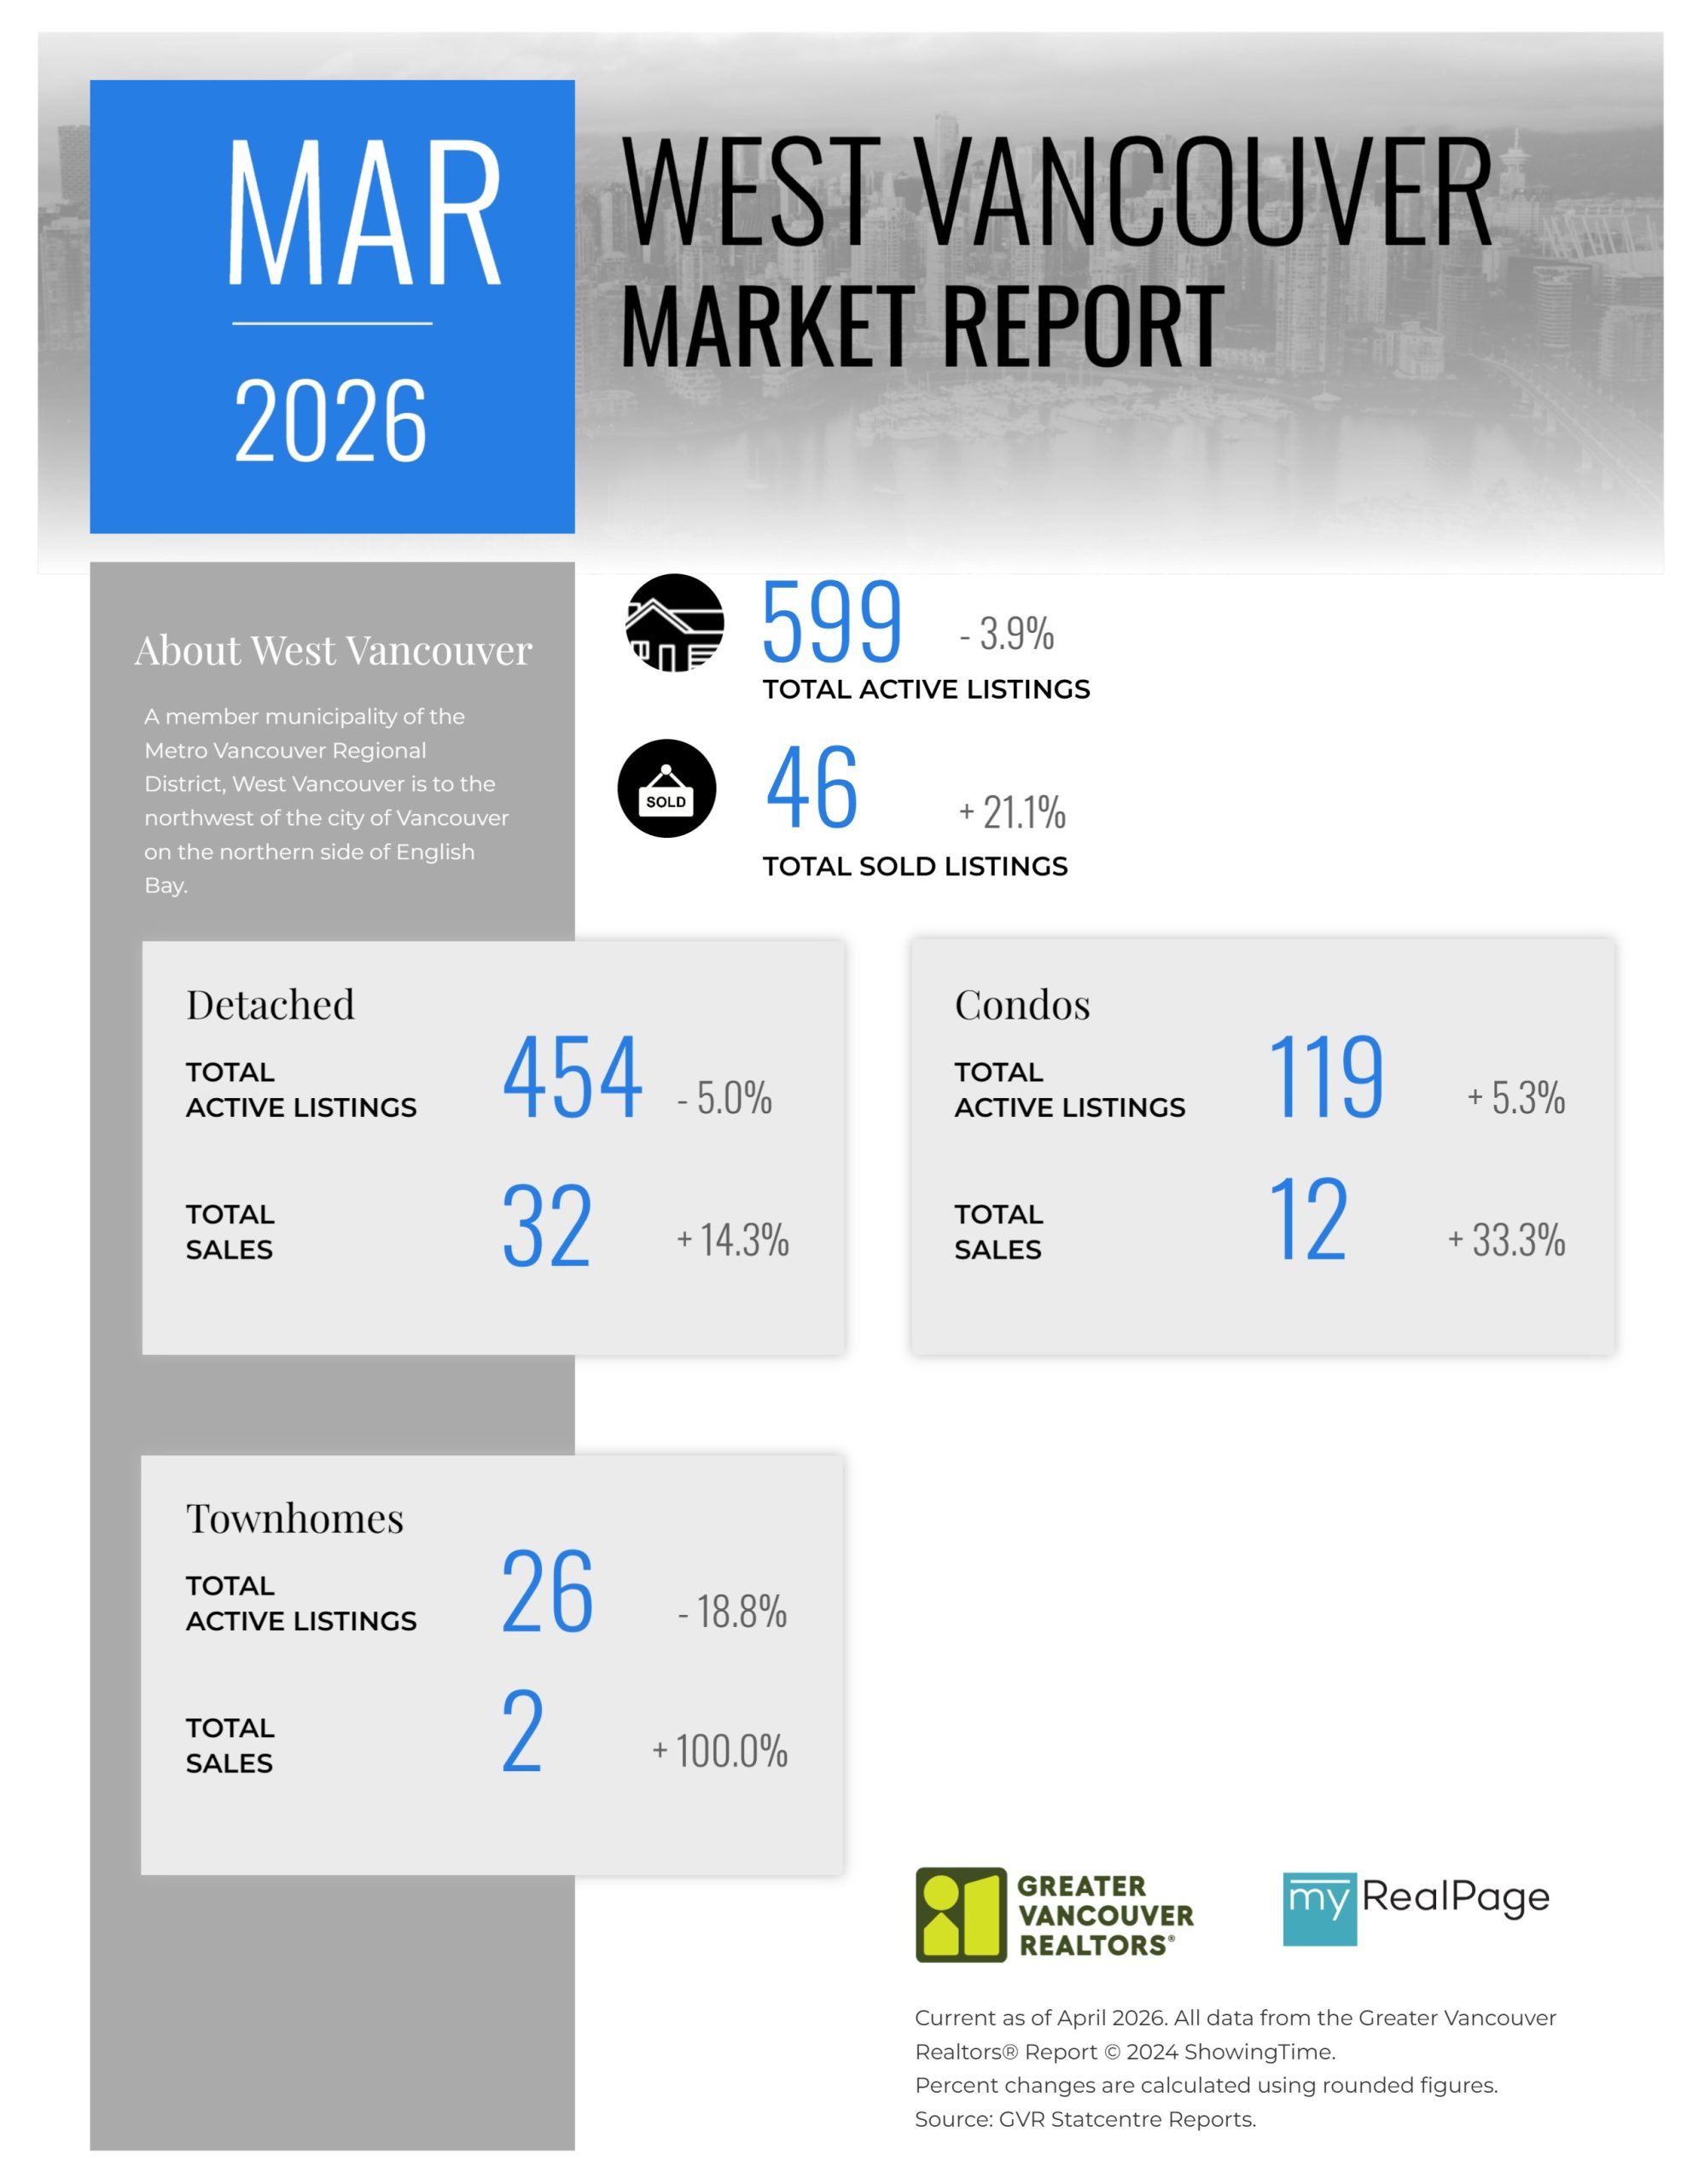
Printable Version – GVR March 2026 Data Infographics Report West Vancouver
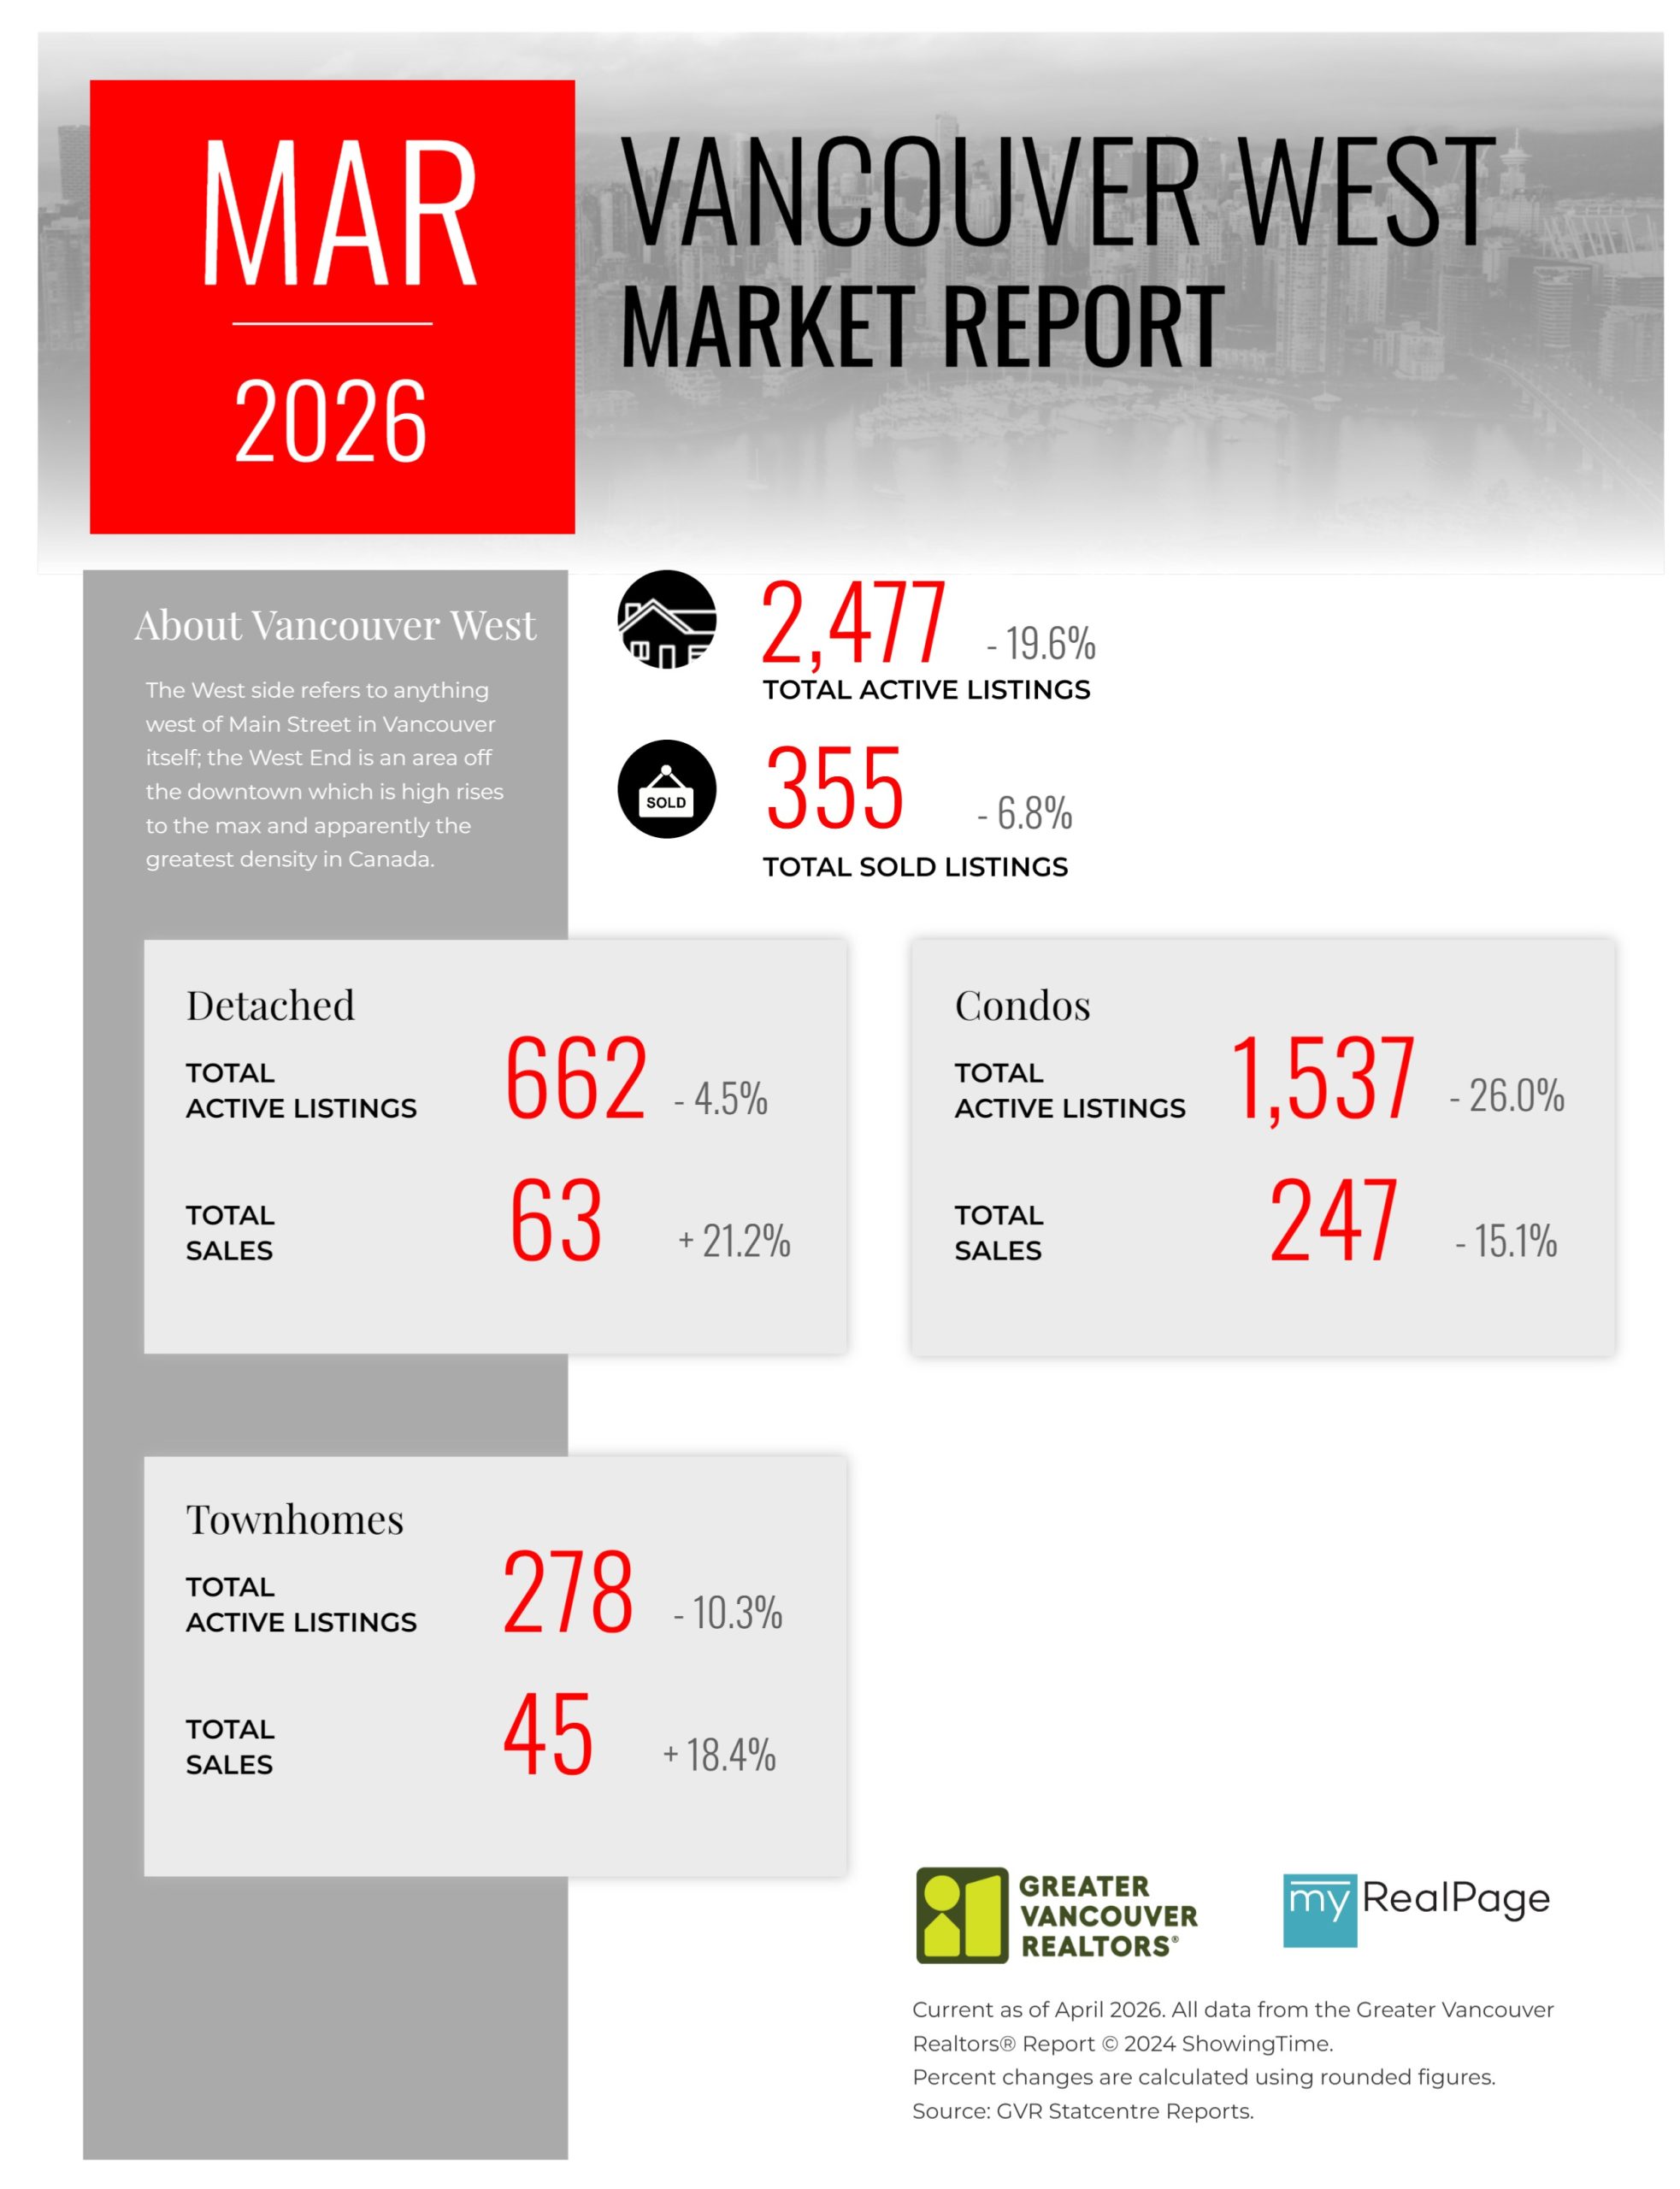
Printable Version – GVR March 2026 Data Infographics Report Vancouver West
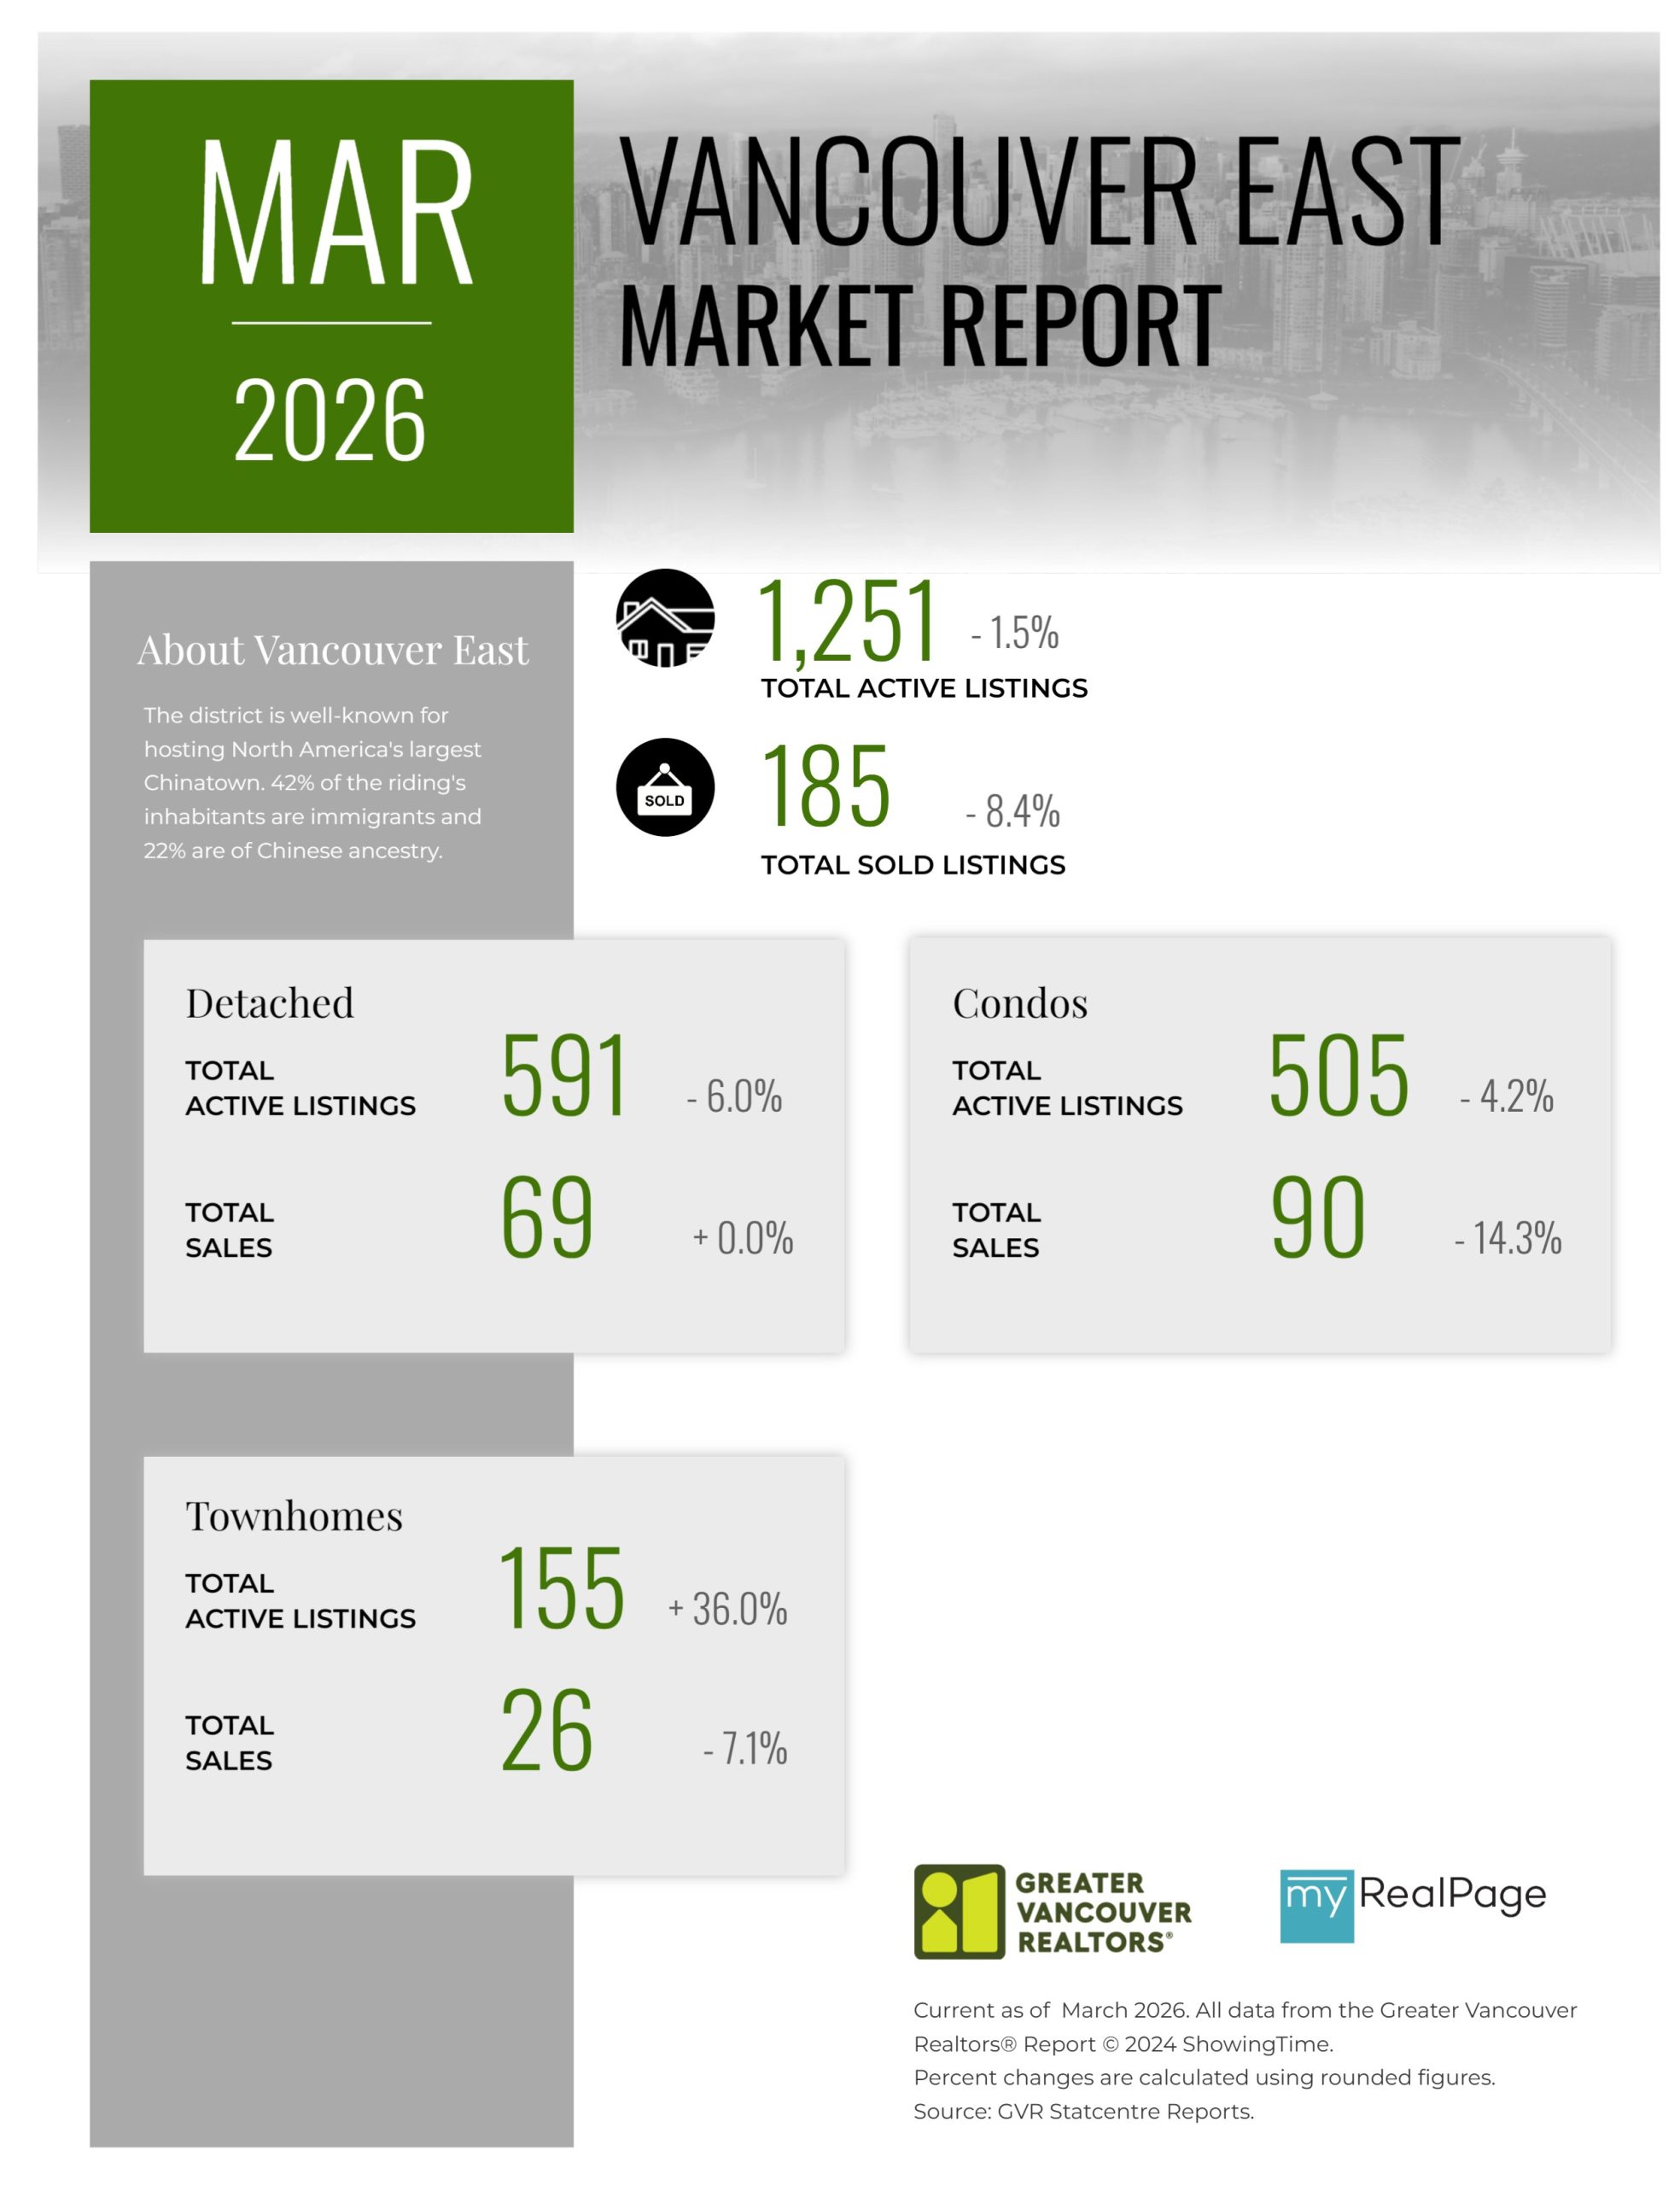
Printable Version – GVR March 2026 Data Infographics Report Vancouver East
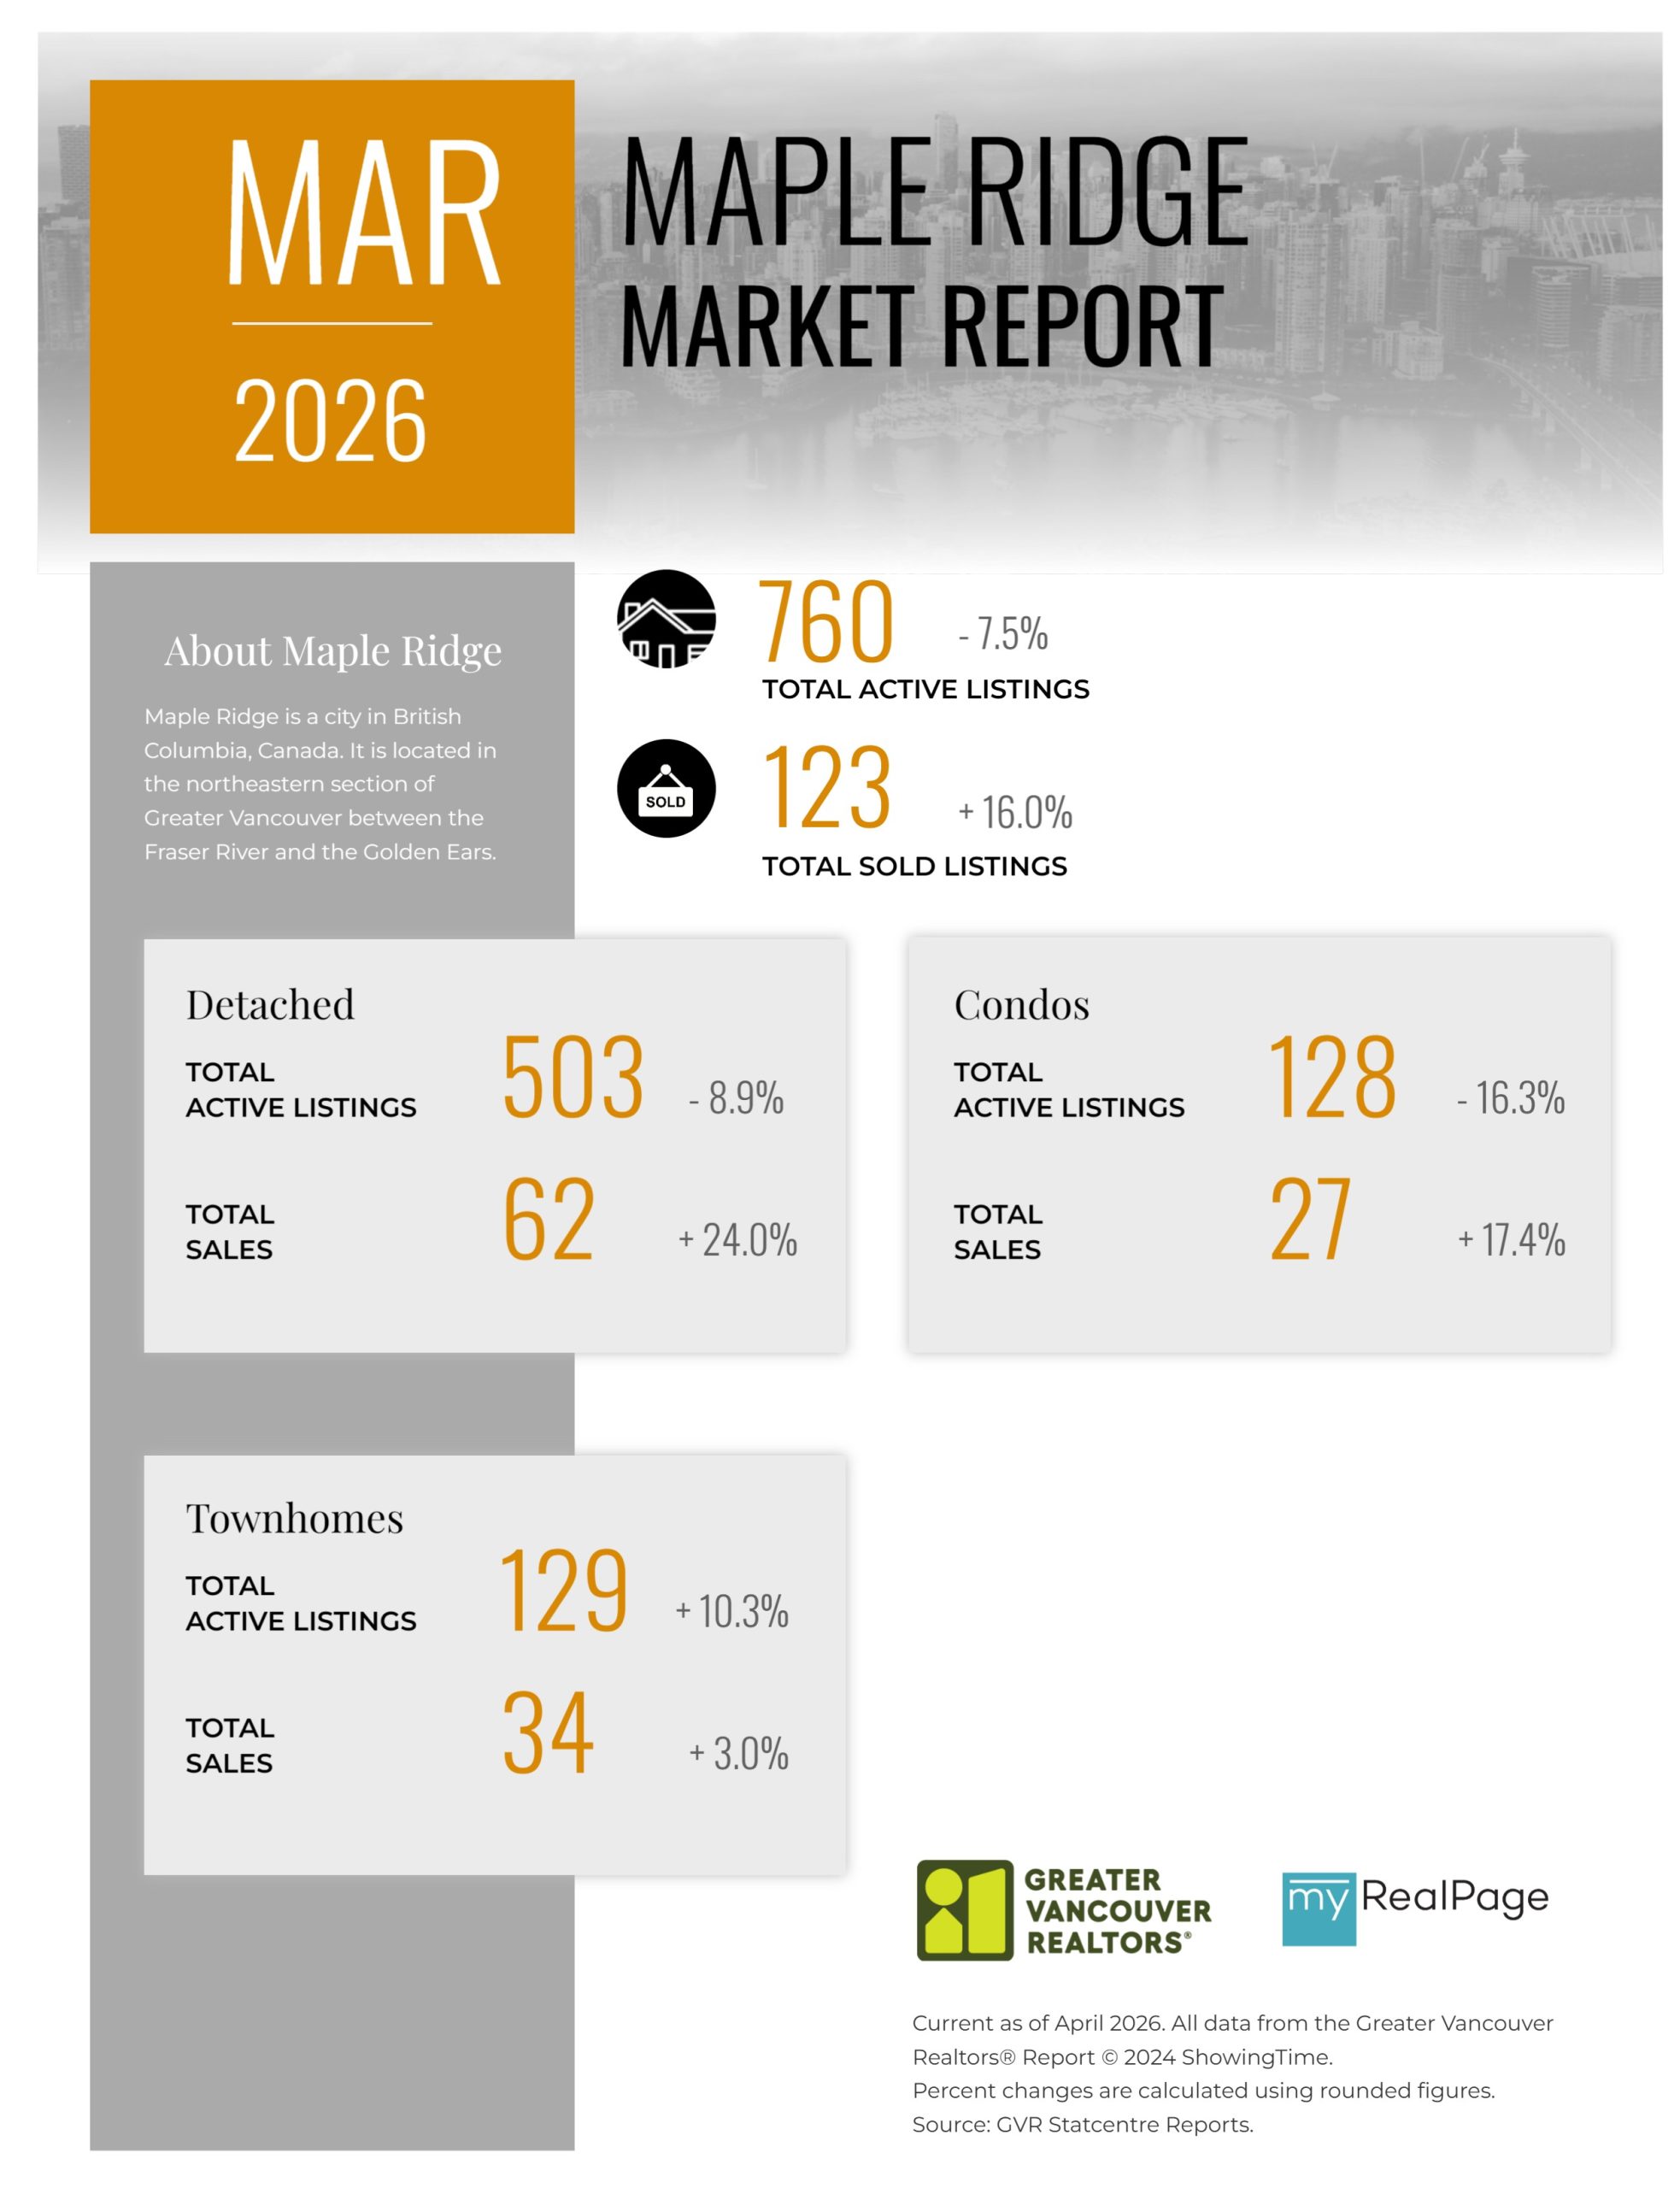
Printable Version – GVR March 2026 Data Infographic Report Maple Ridge
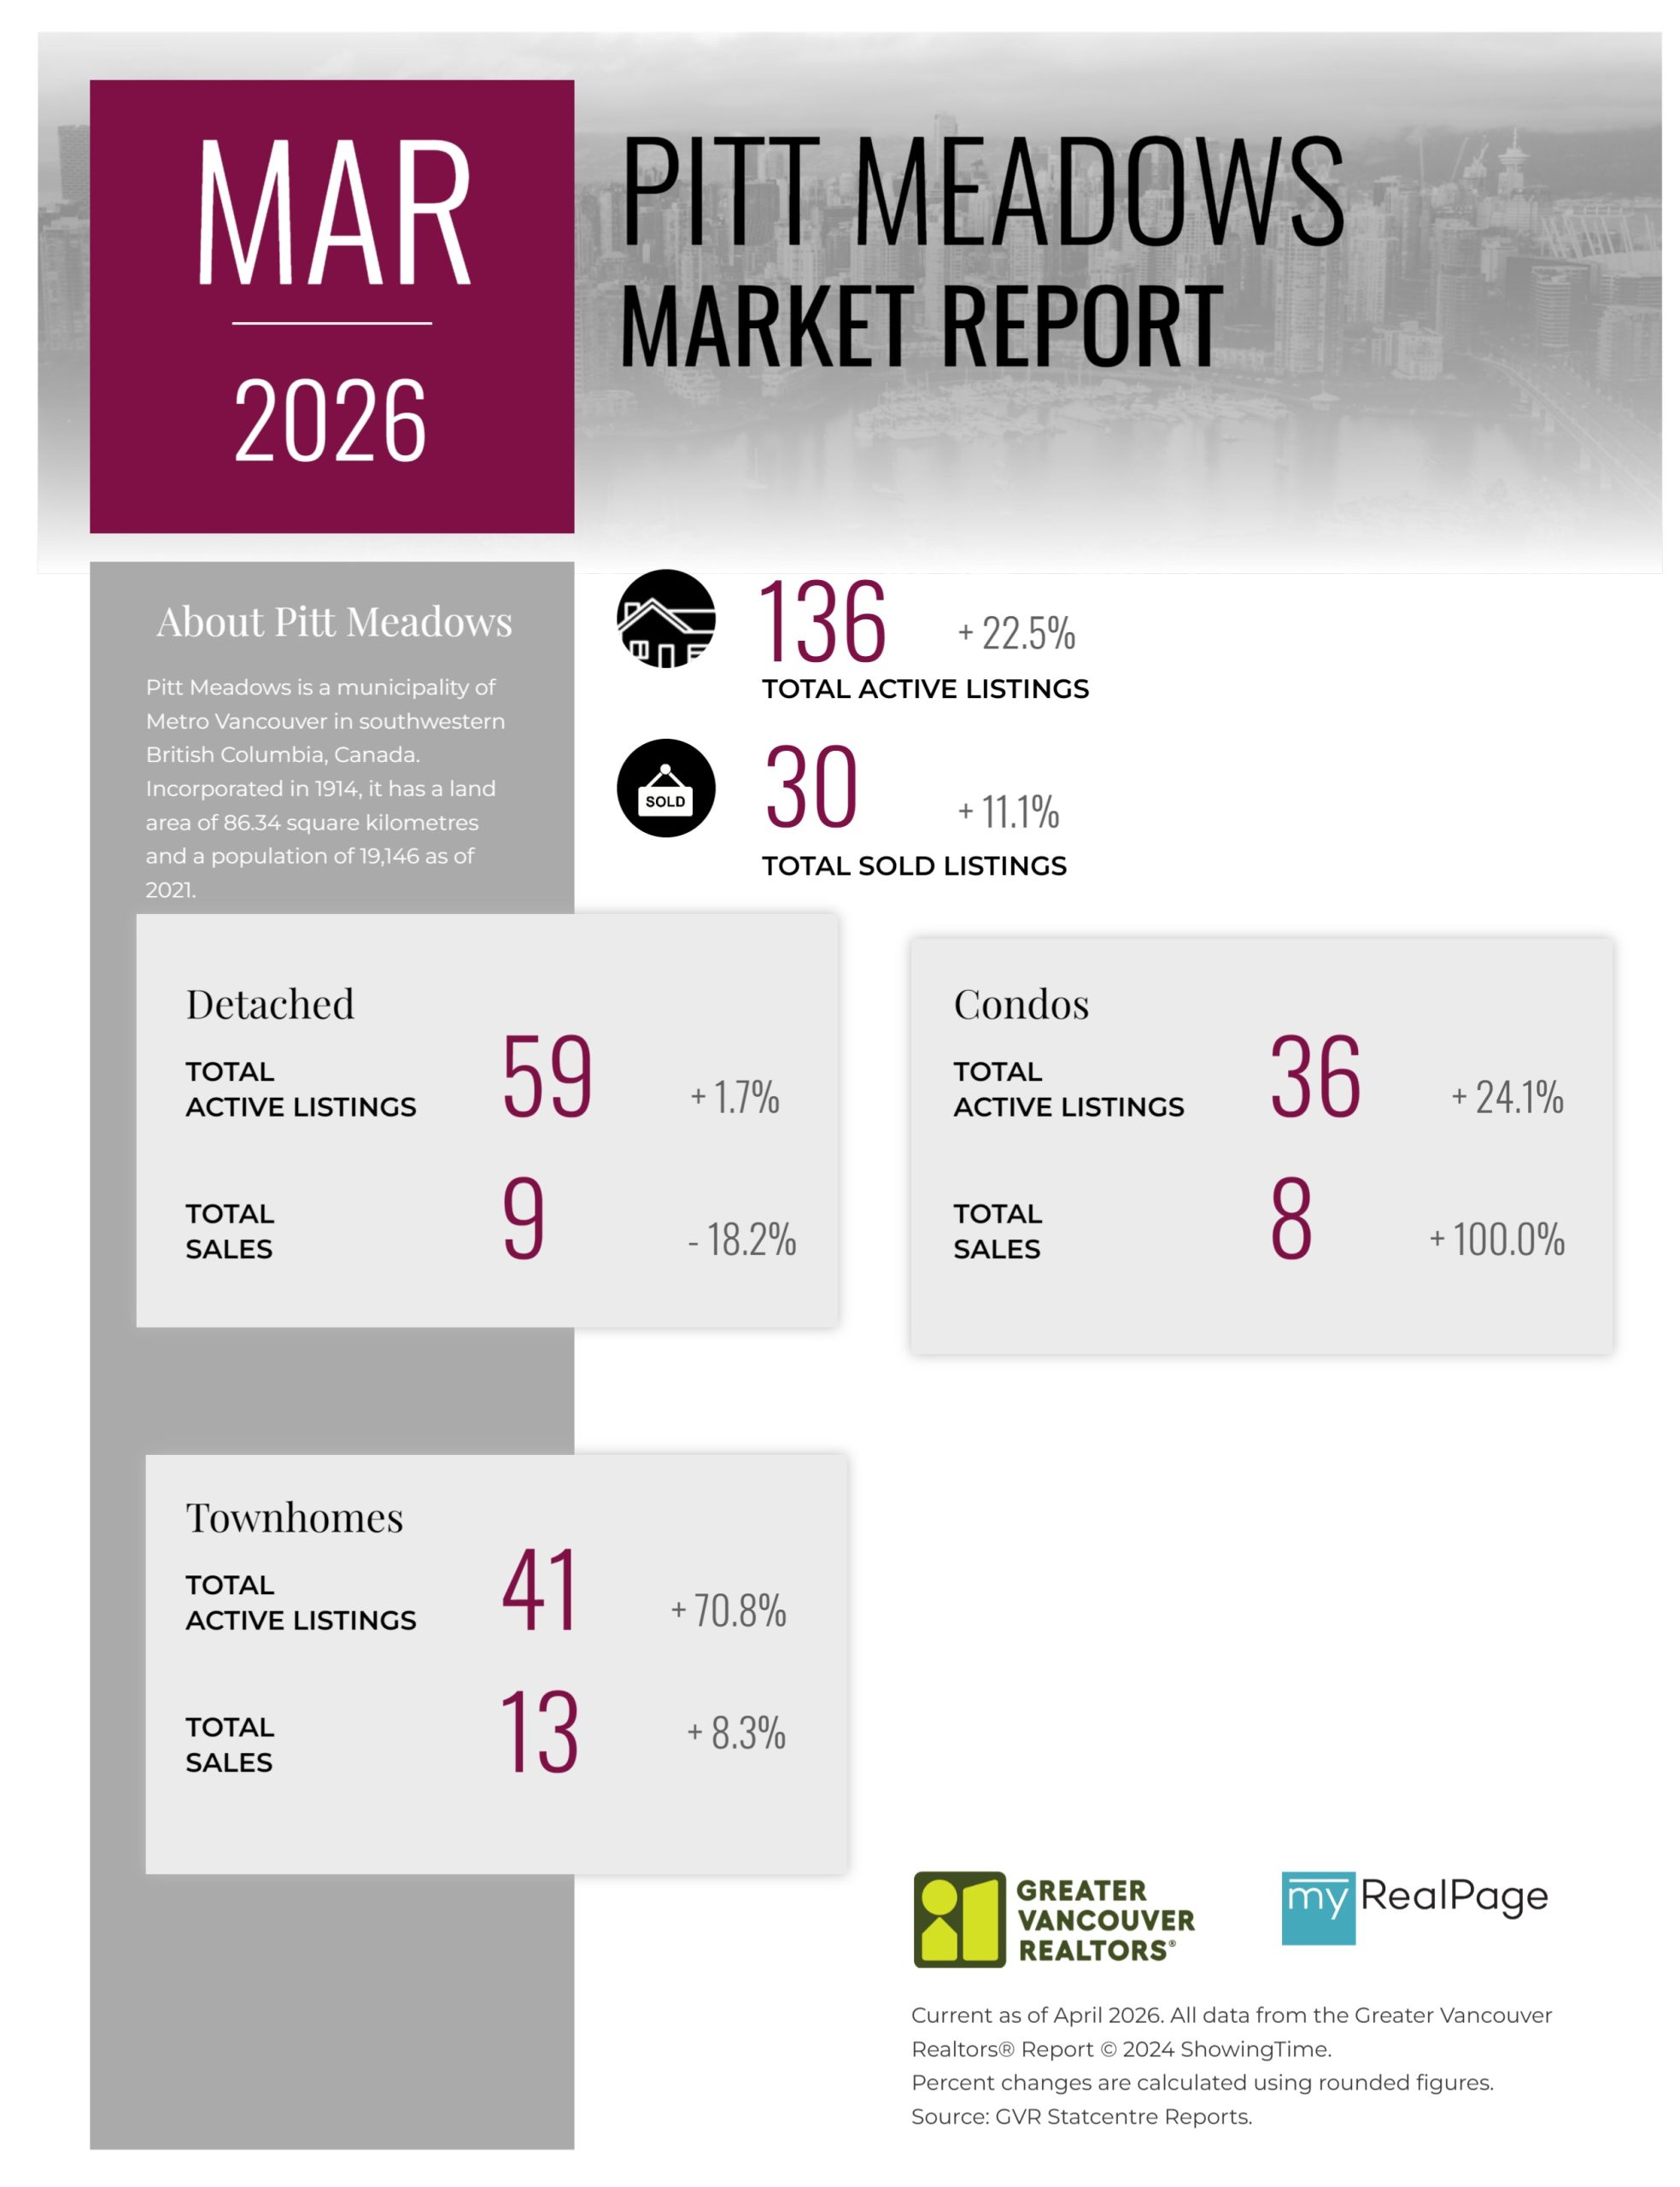
Printable Version – GVR March 2026 Data Infographics Report Pitt Meadows
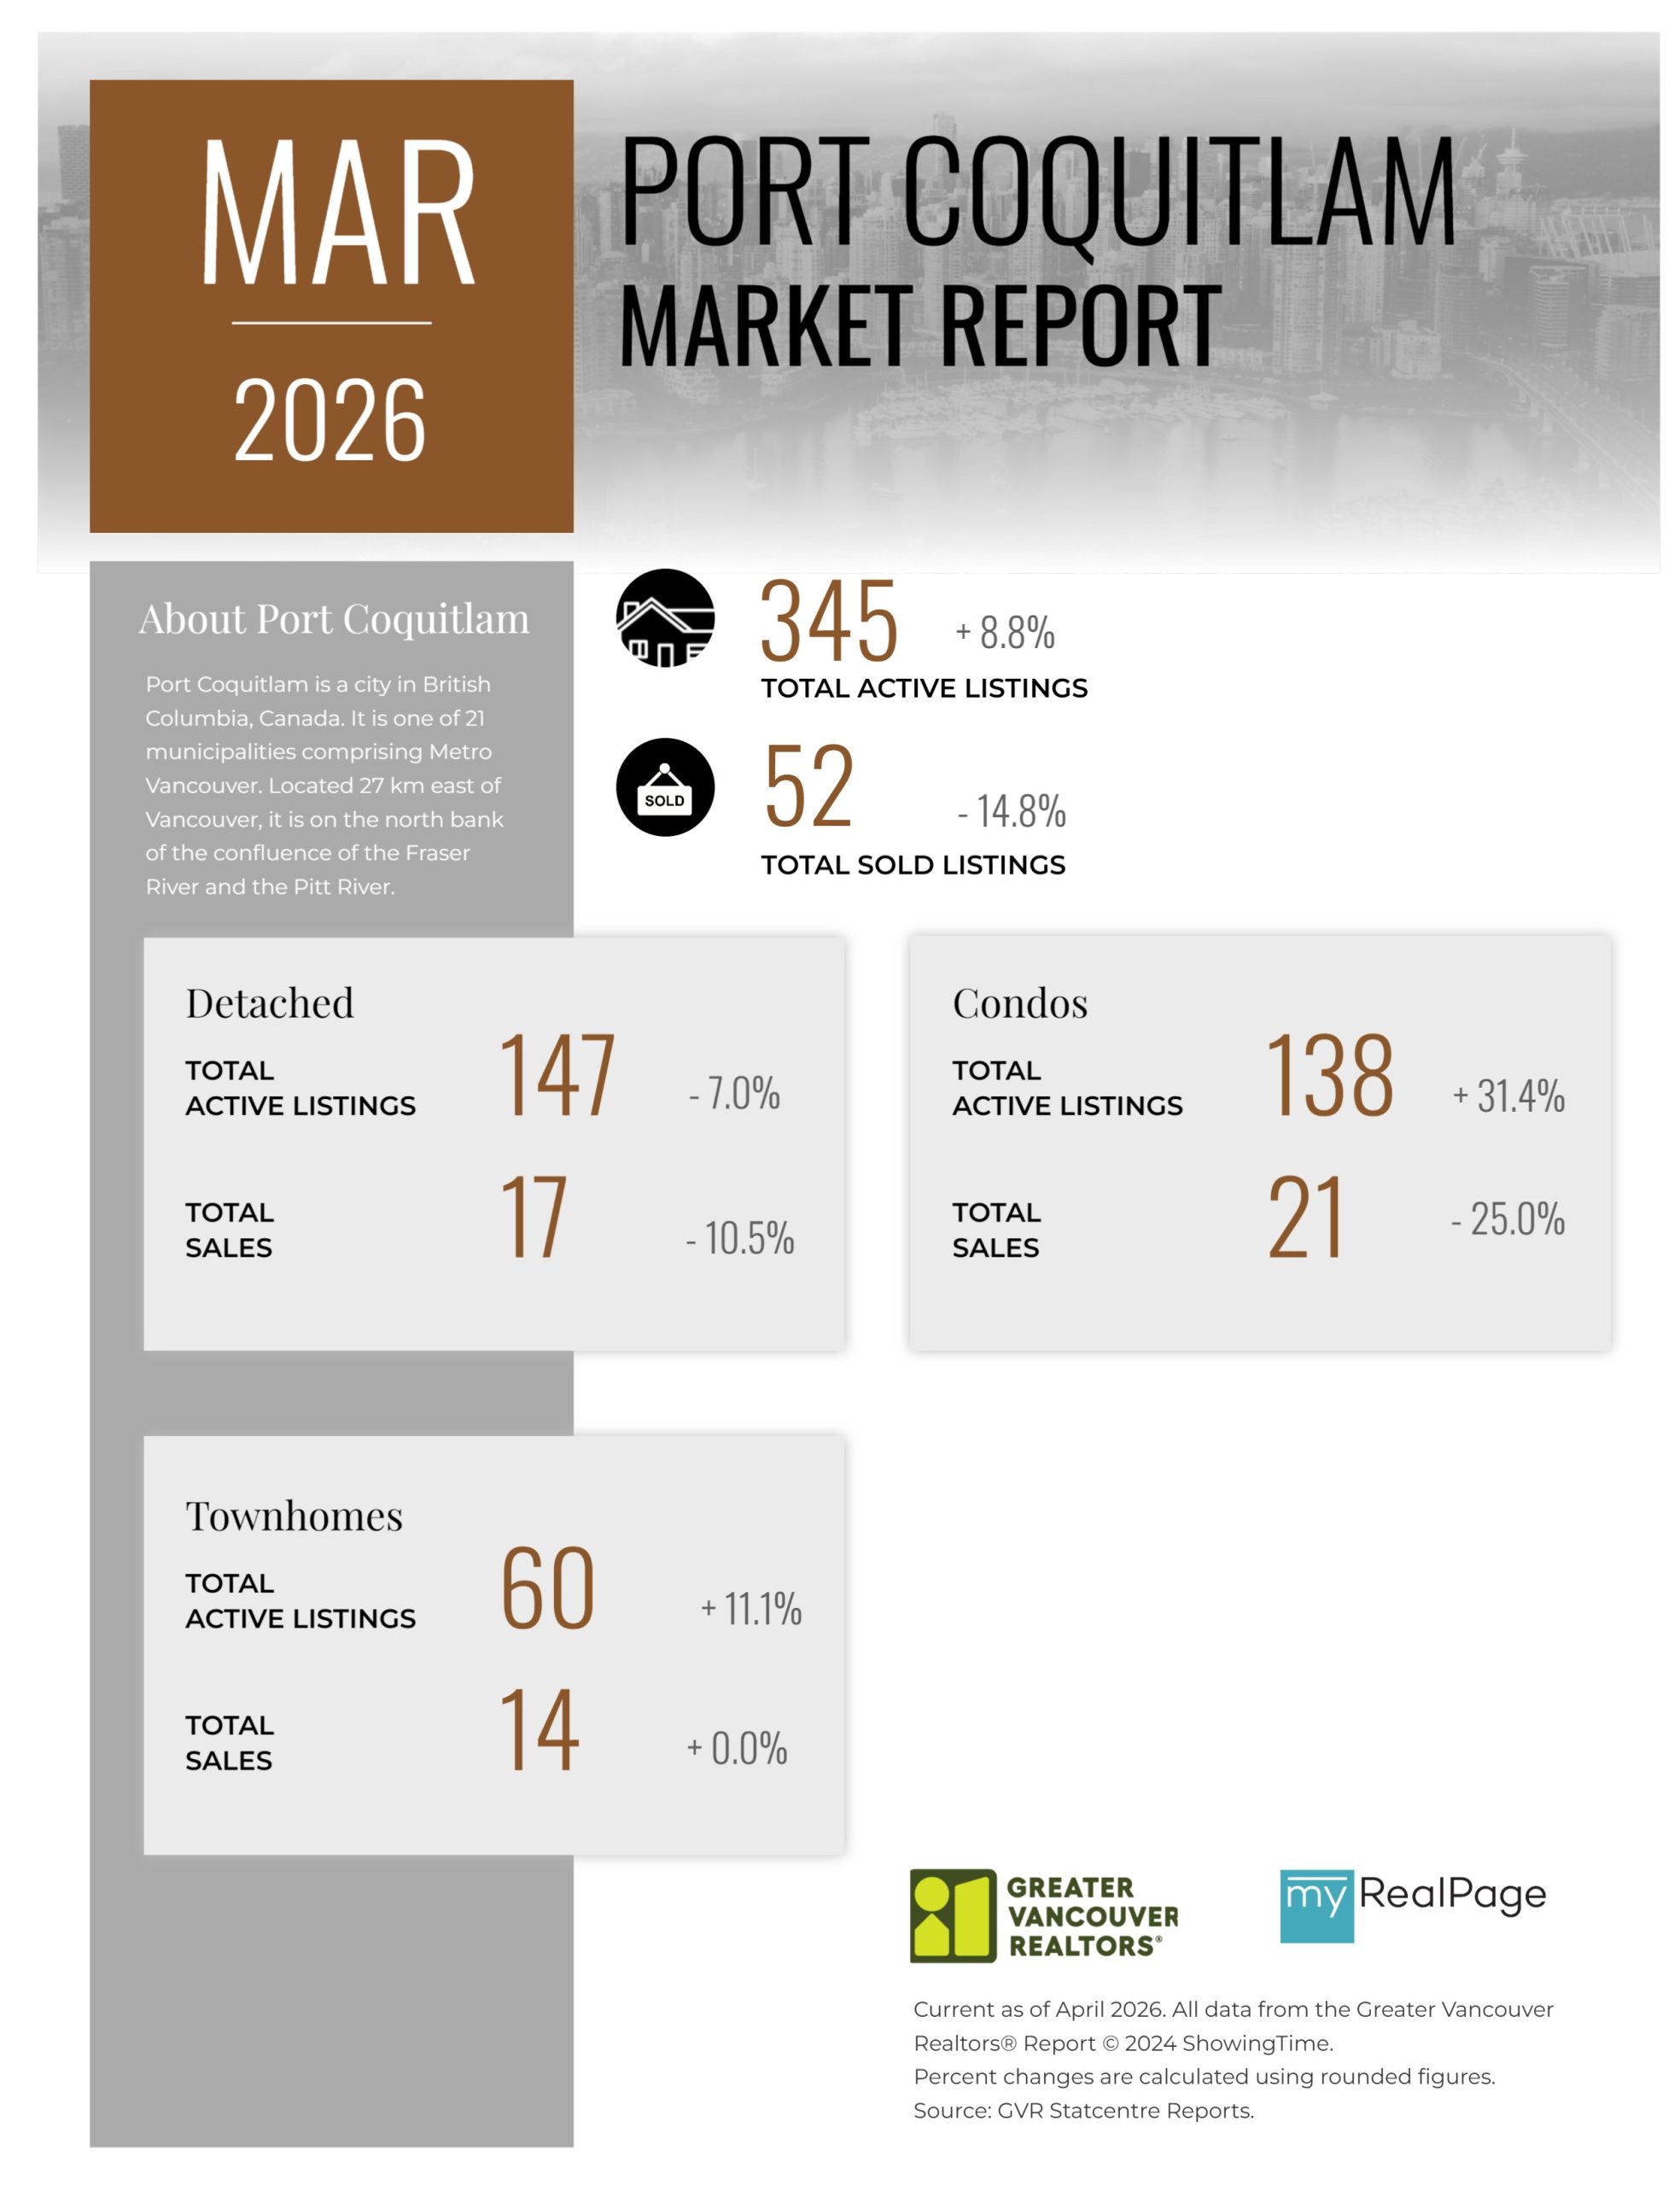
Printable Version – GVR March 2026 Data Infographics Report Port Coquitlam
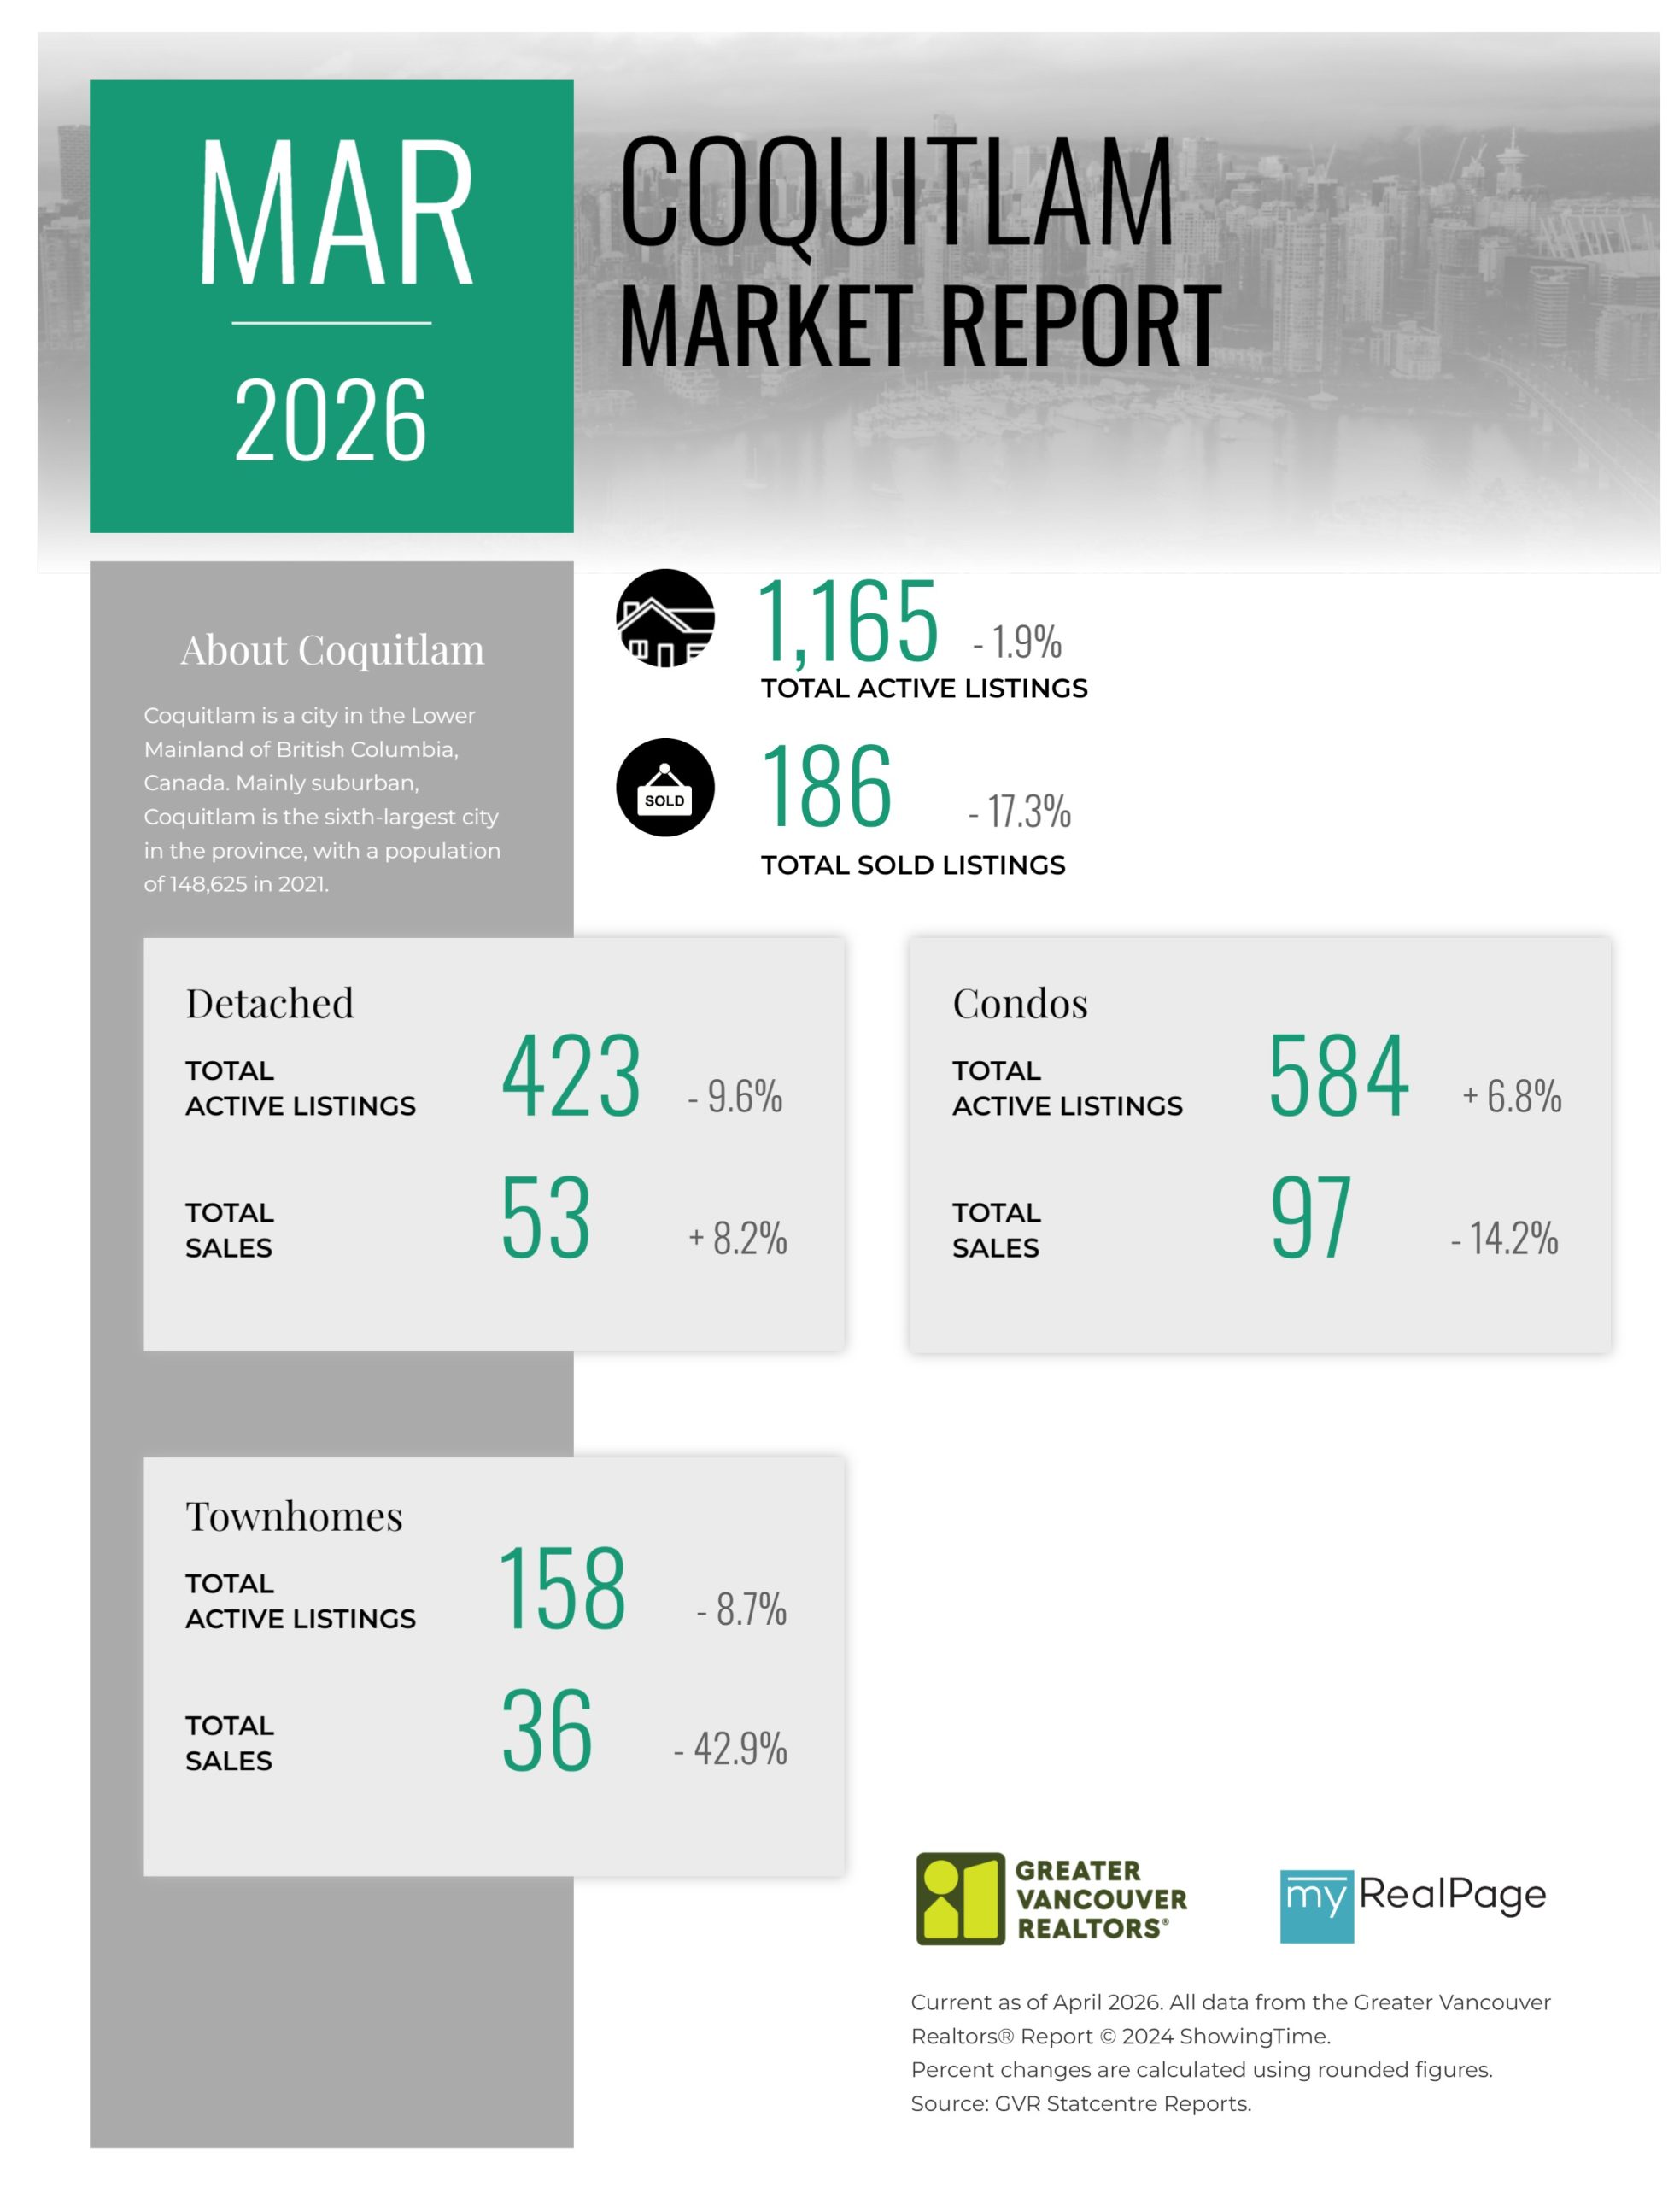
Printable Version – GVR March 2026 Data Infographics Report Coquitlam
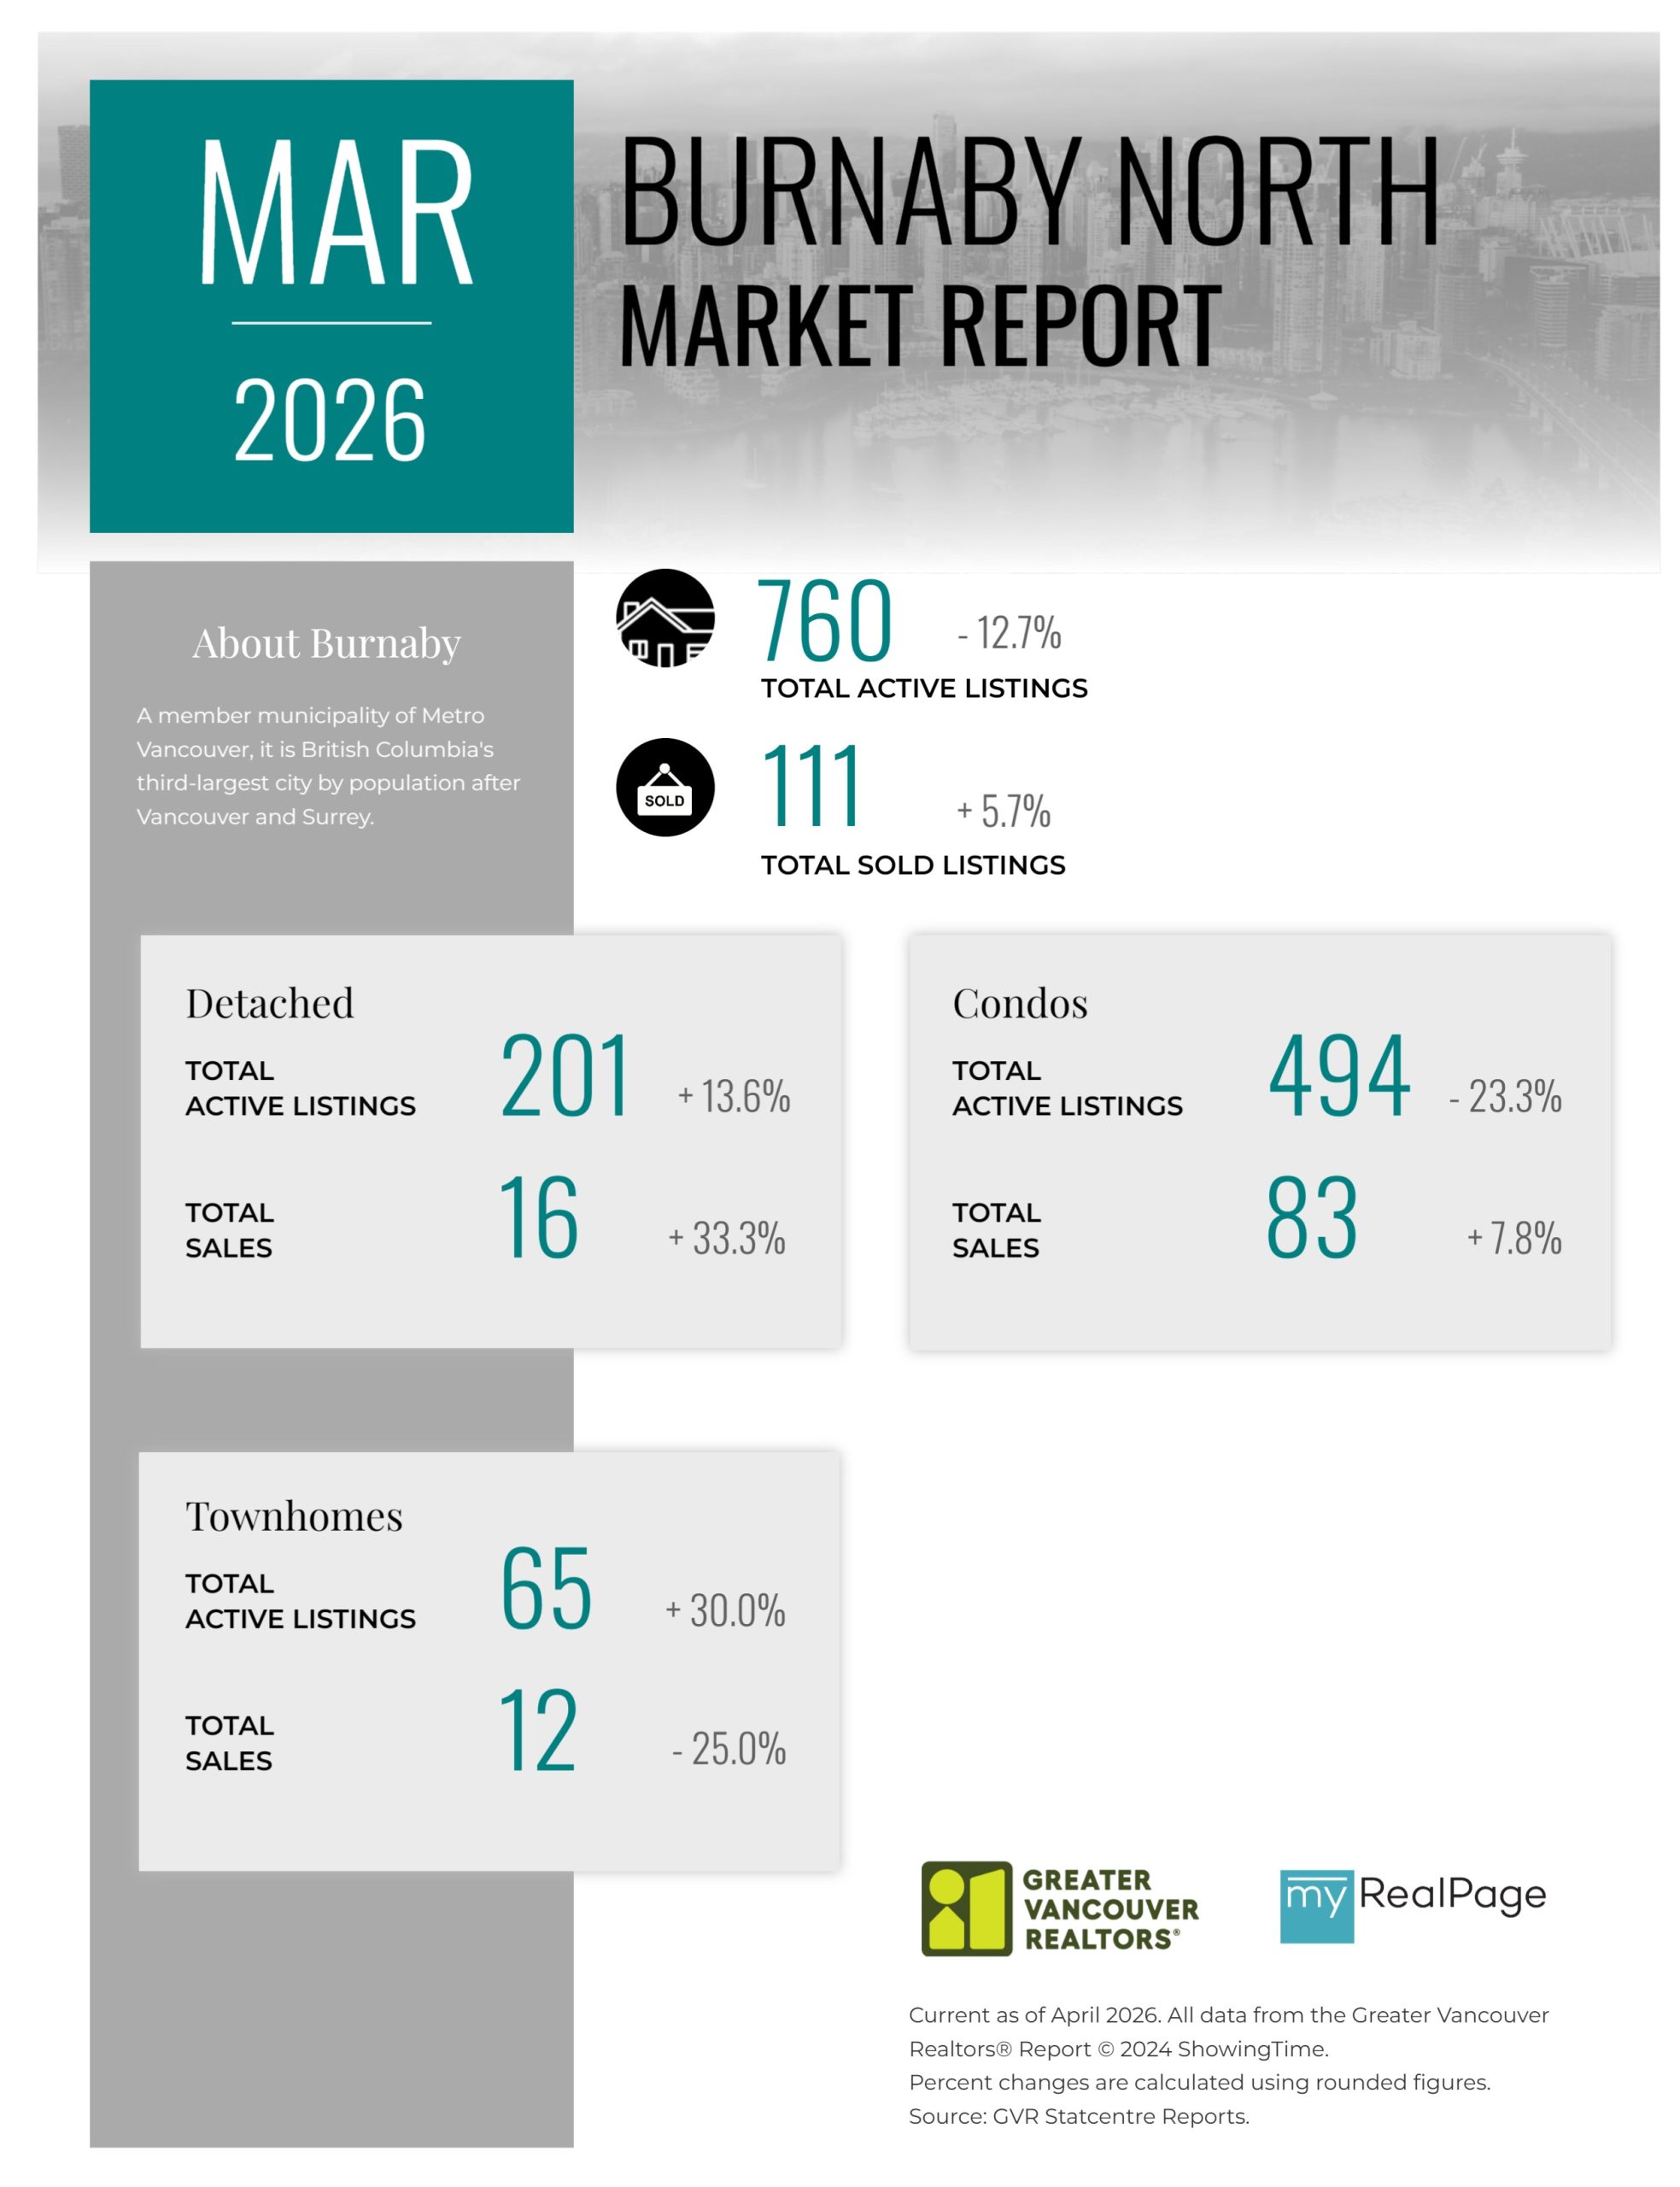
Printable Version – GVR March 2026 Data Infographic Report Burnaby North
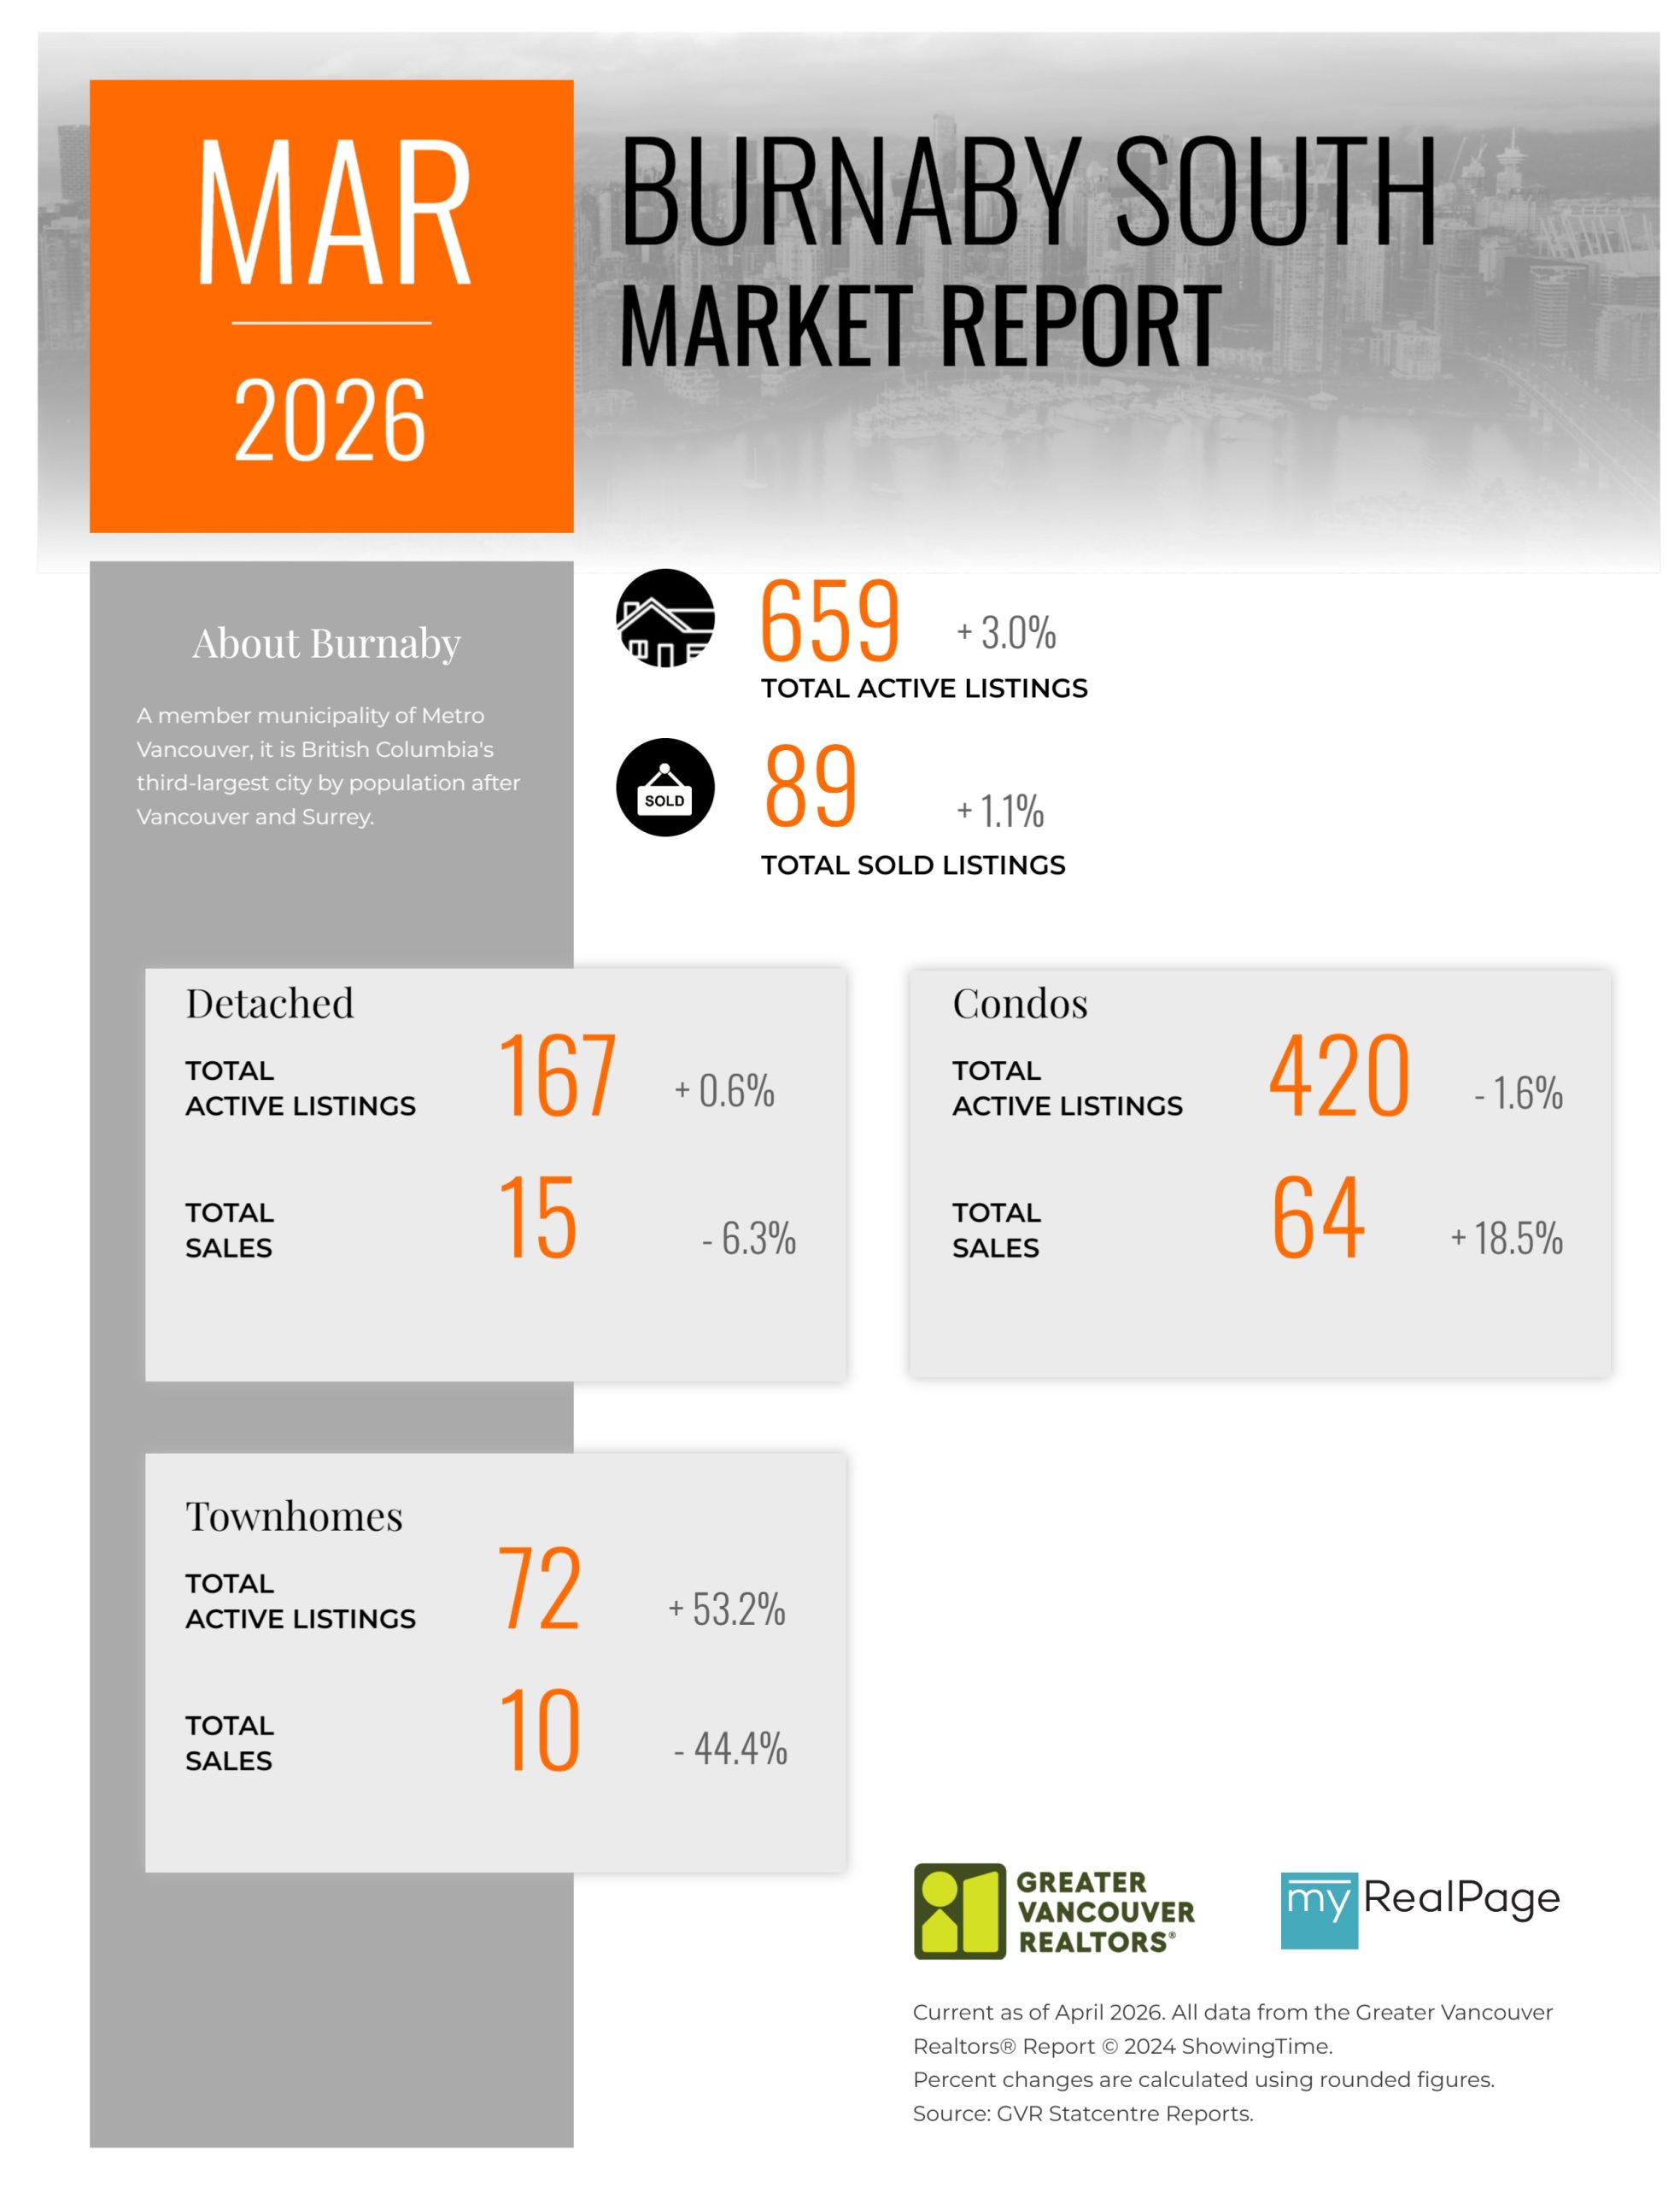
Printable Version – GVR March 2026 Data Infographics Report Burnaby South
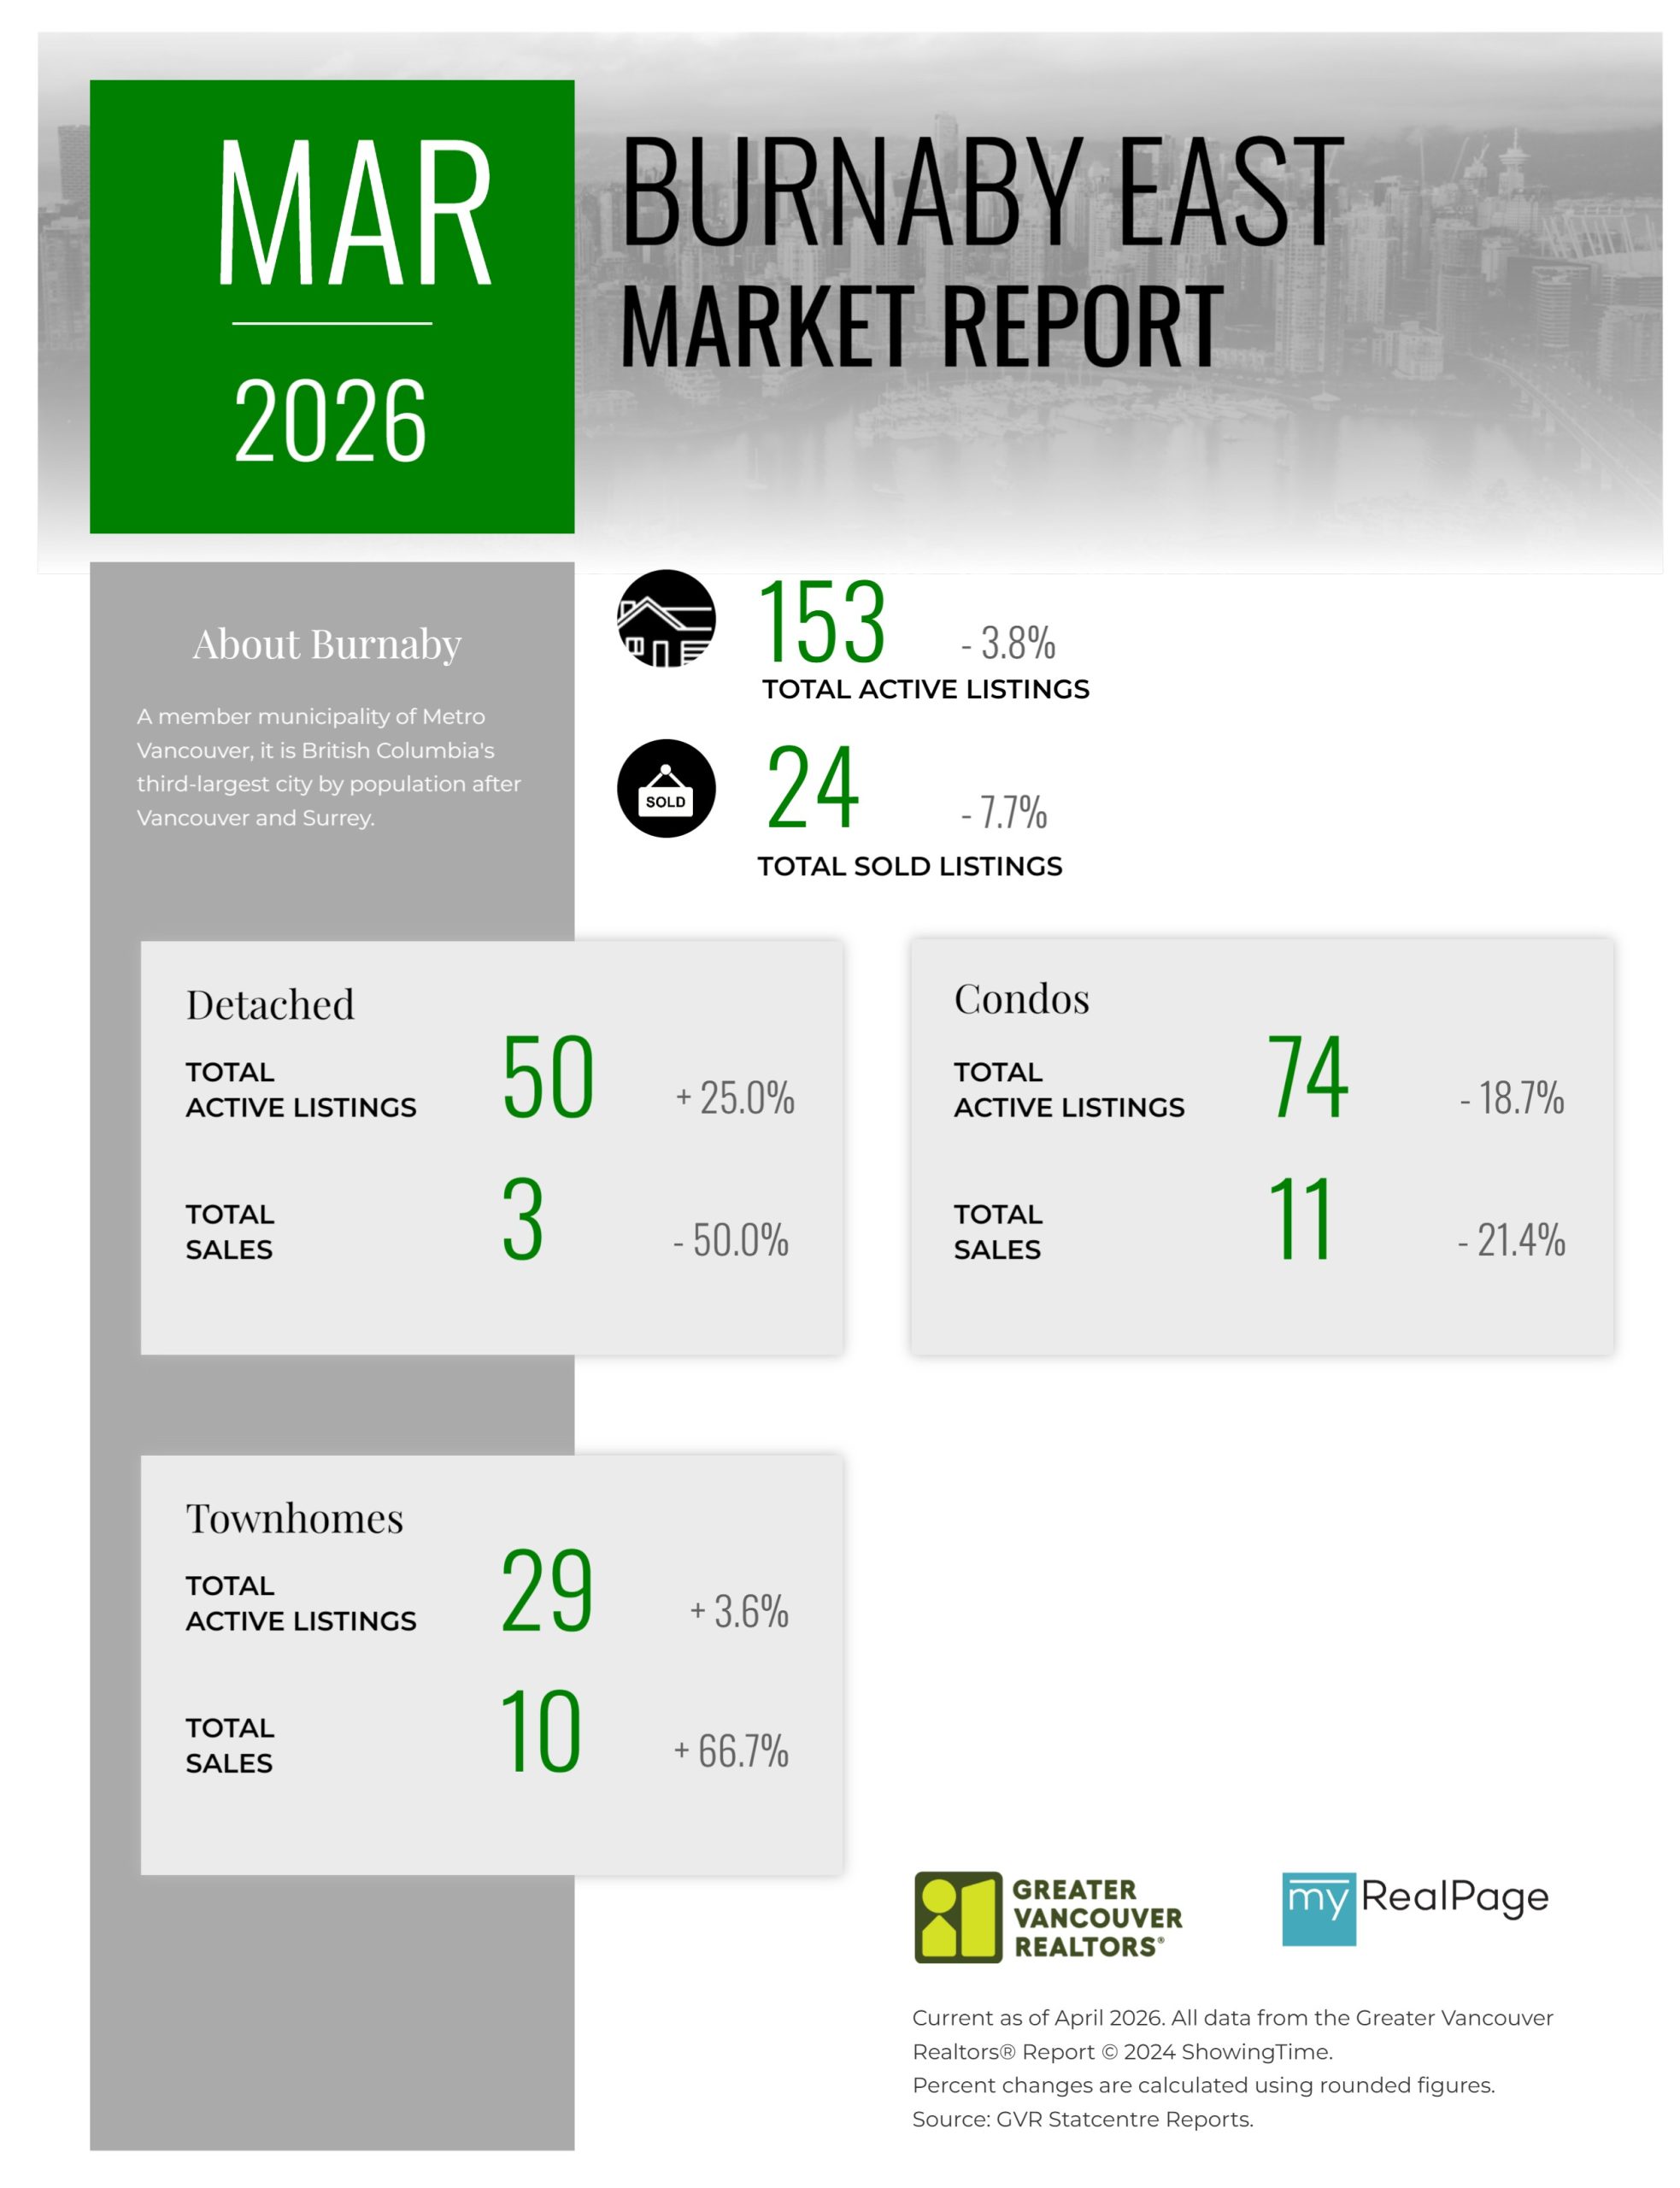
Printable Version – GVR March 2026 Data Infographics Report Burnaby East
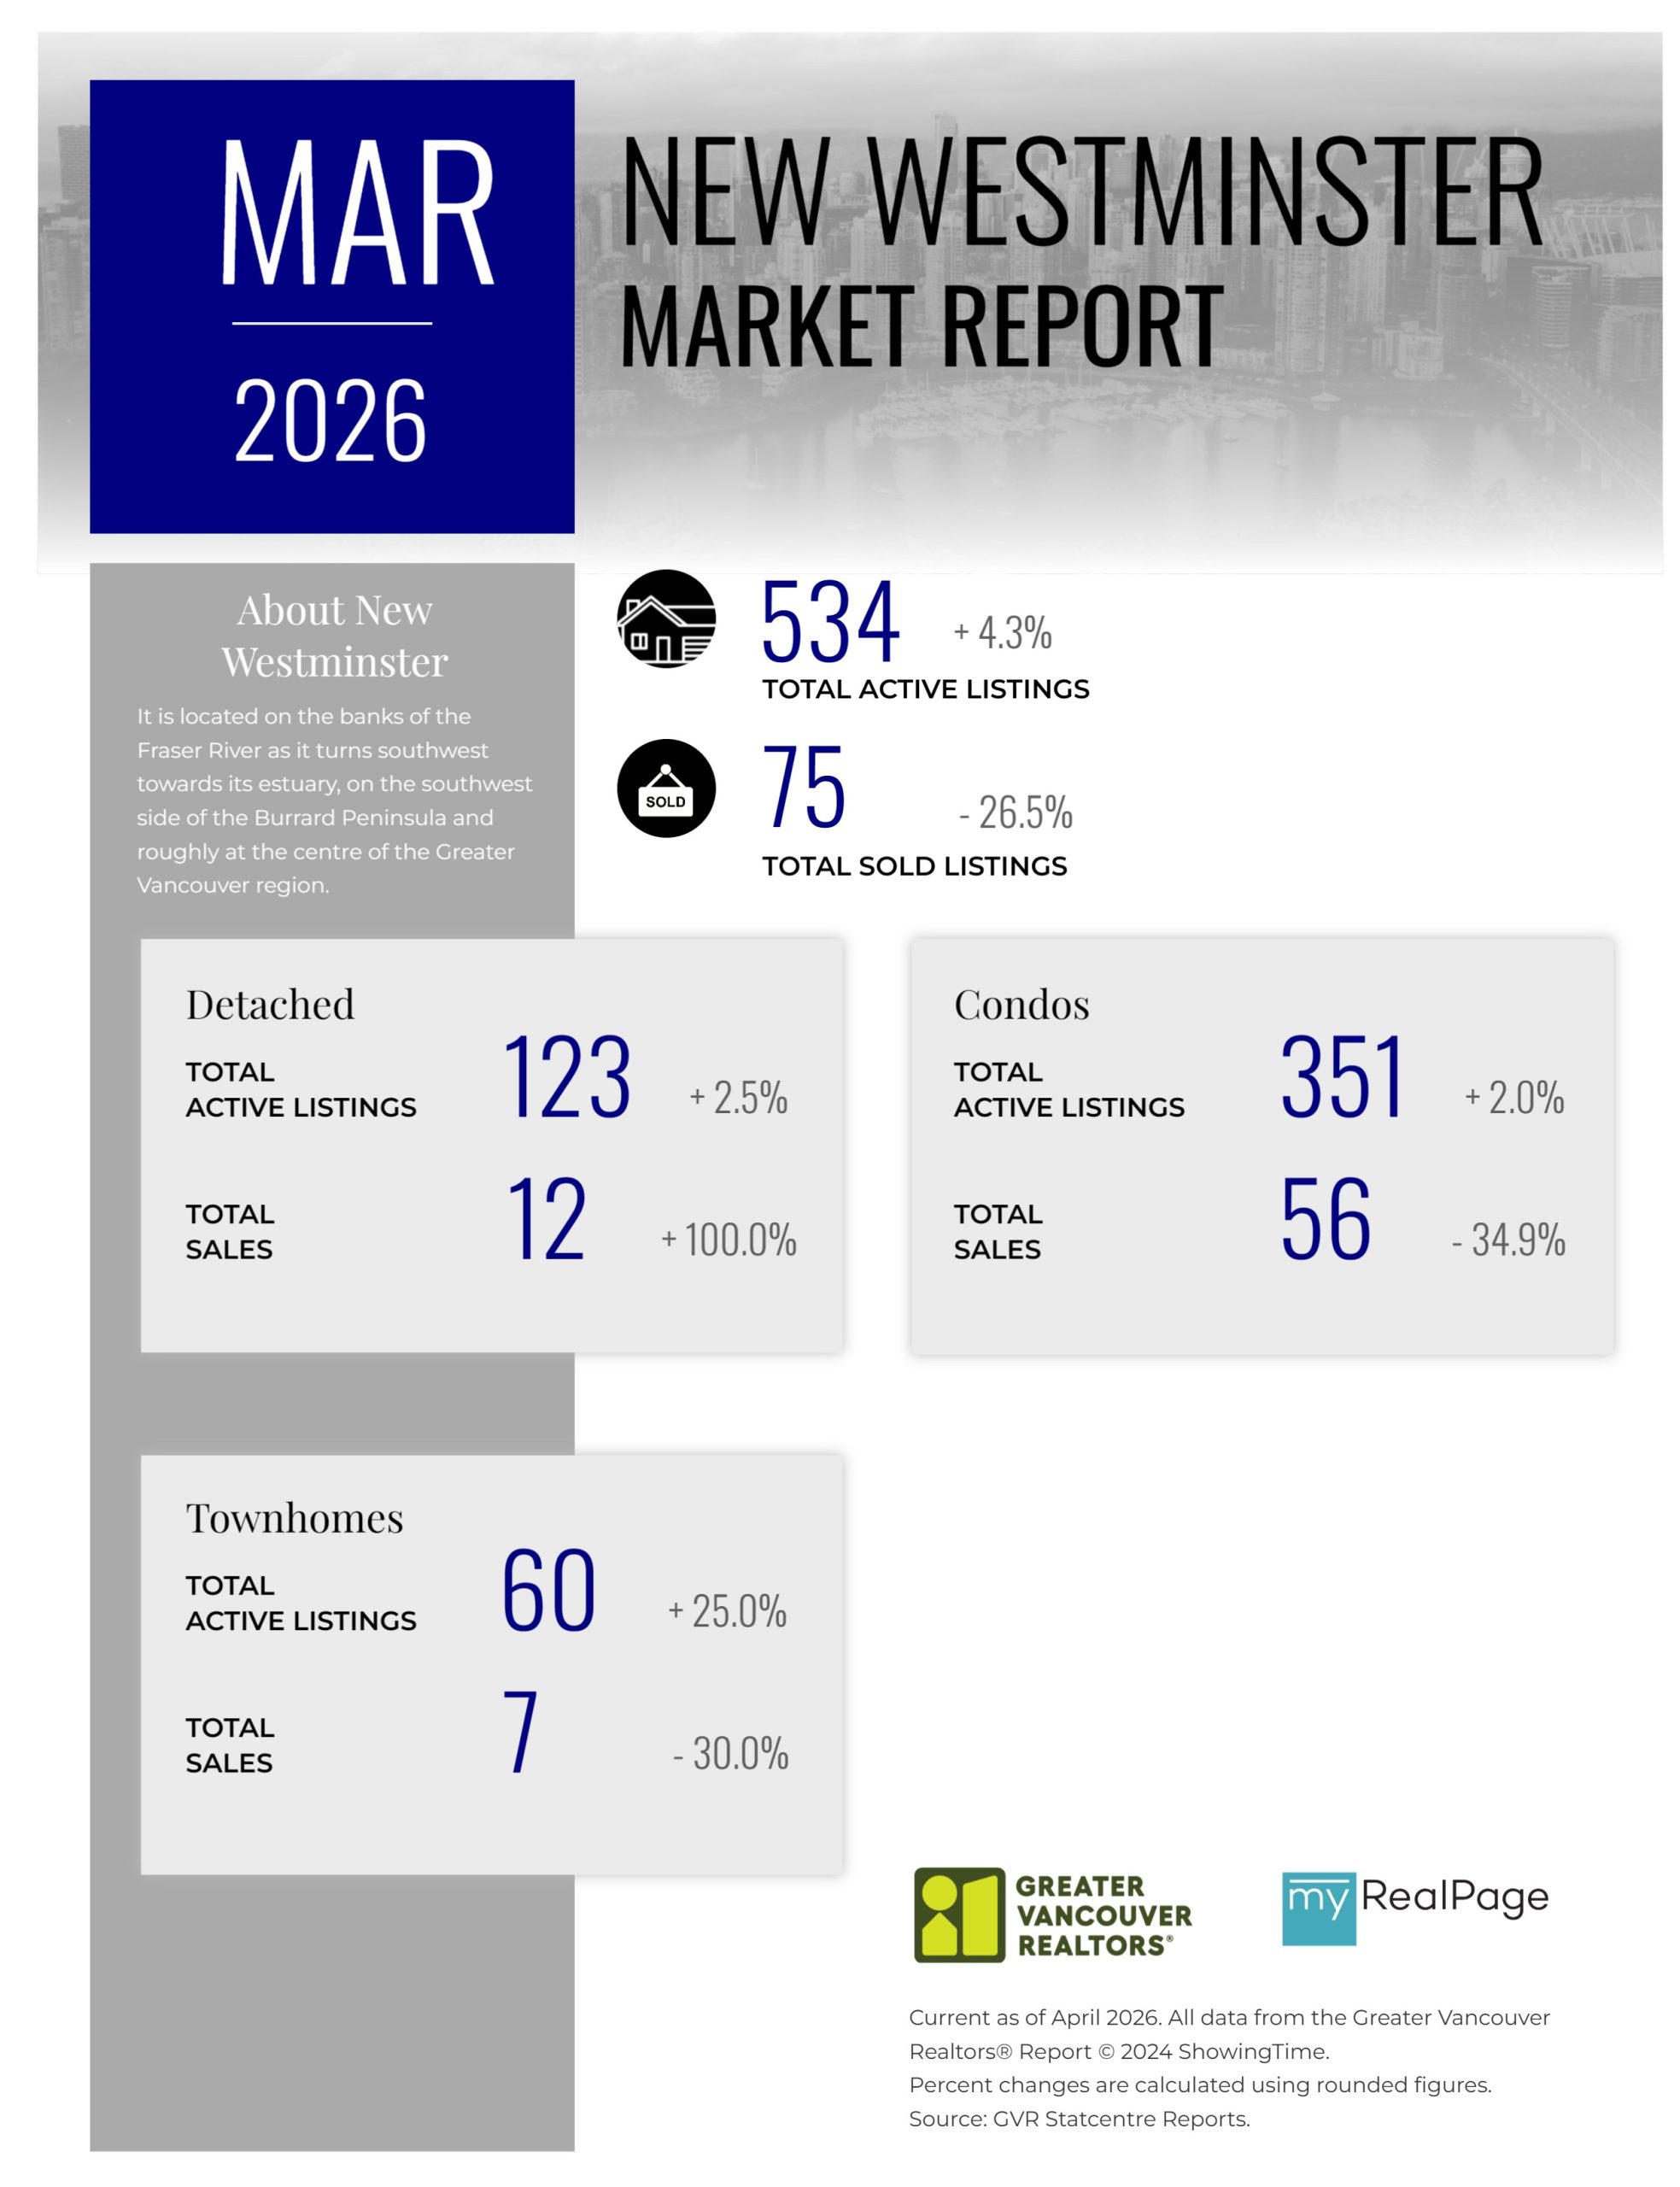
Printable Version – GVR March 2026 Data Infographics Report New Westminster
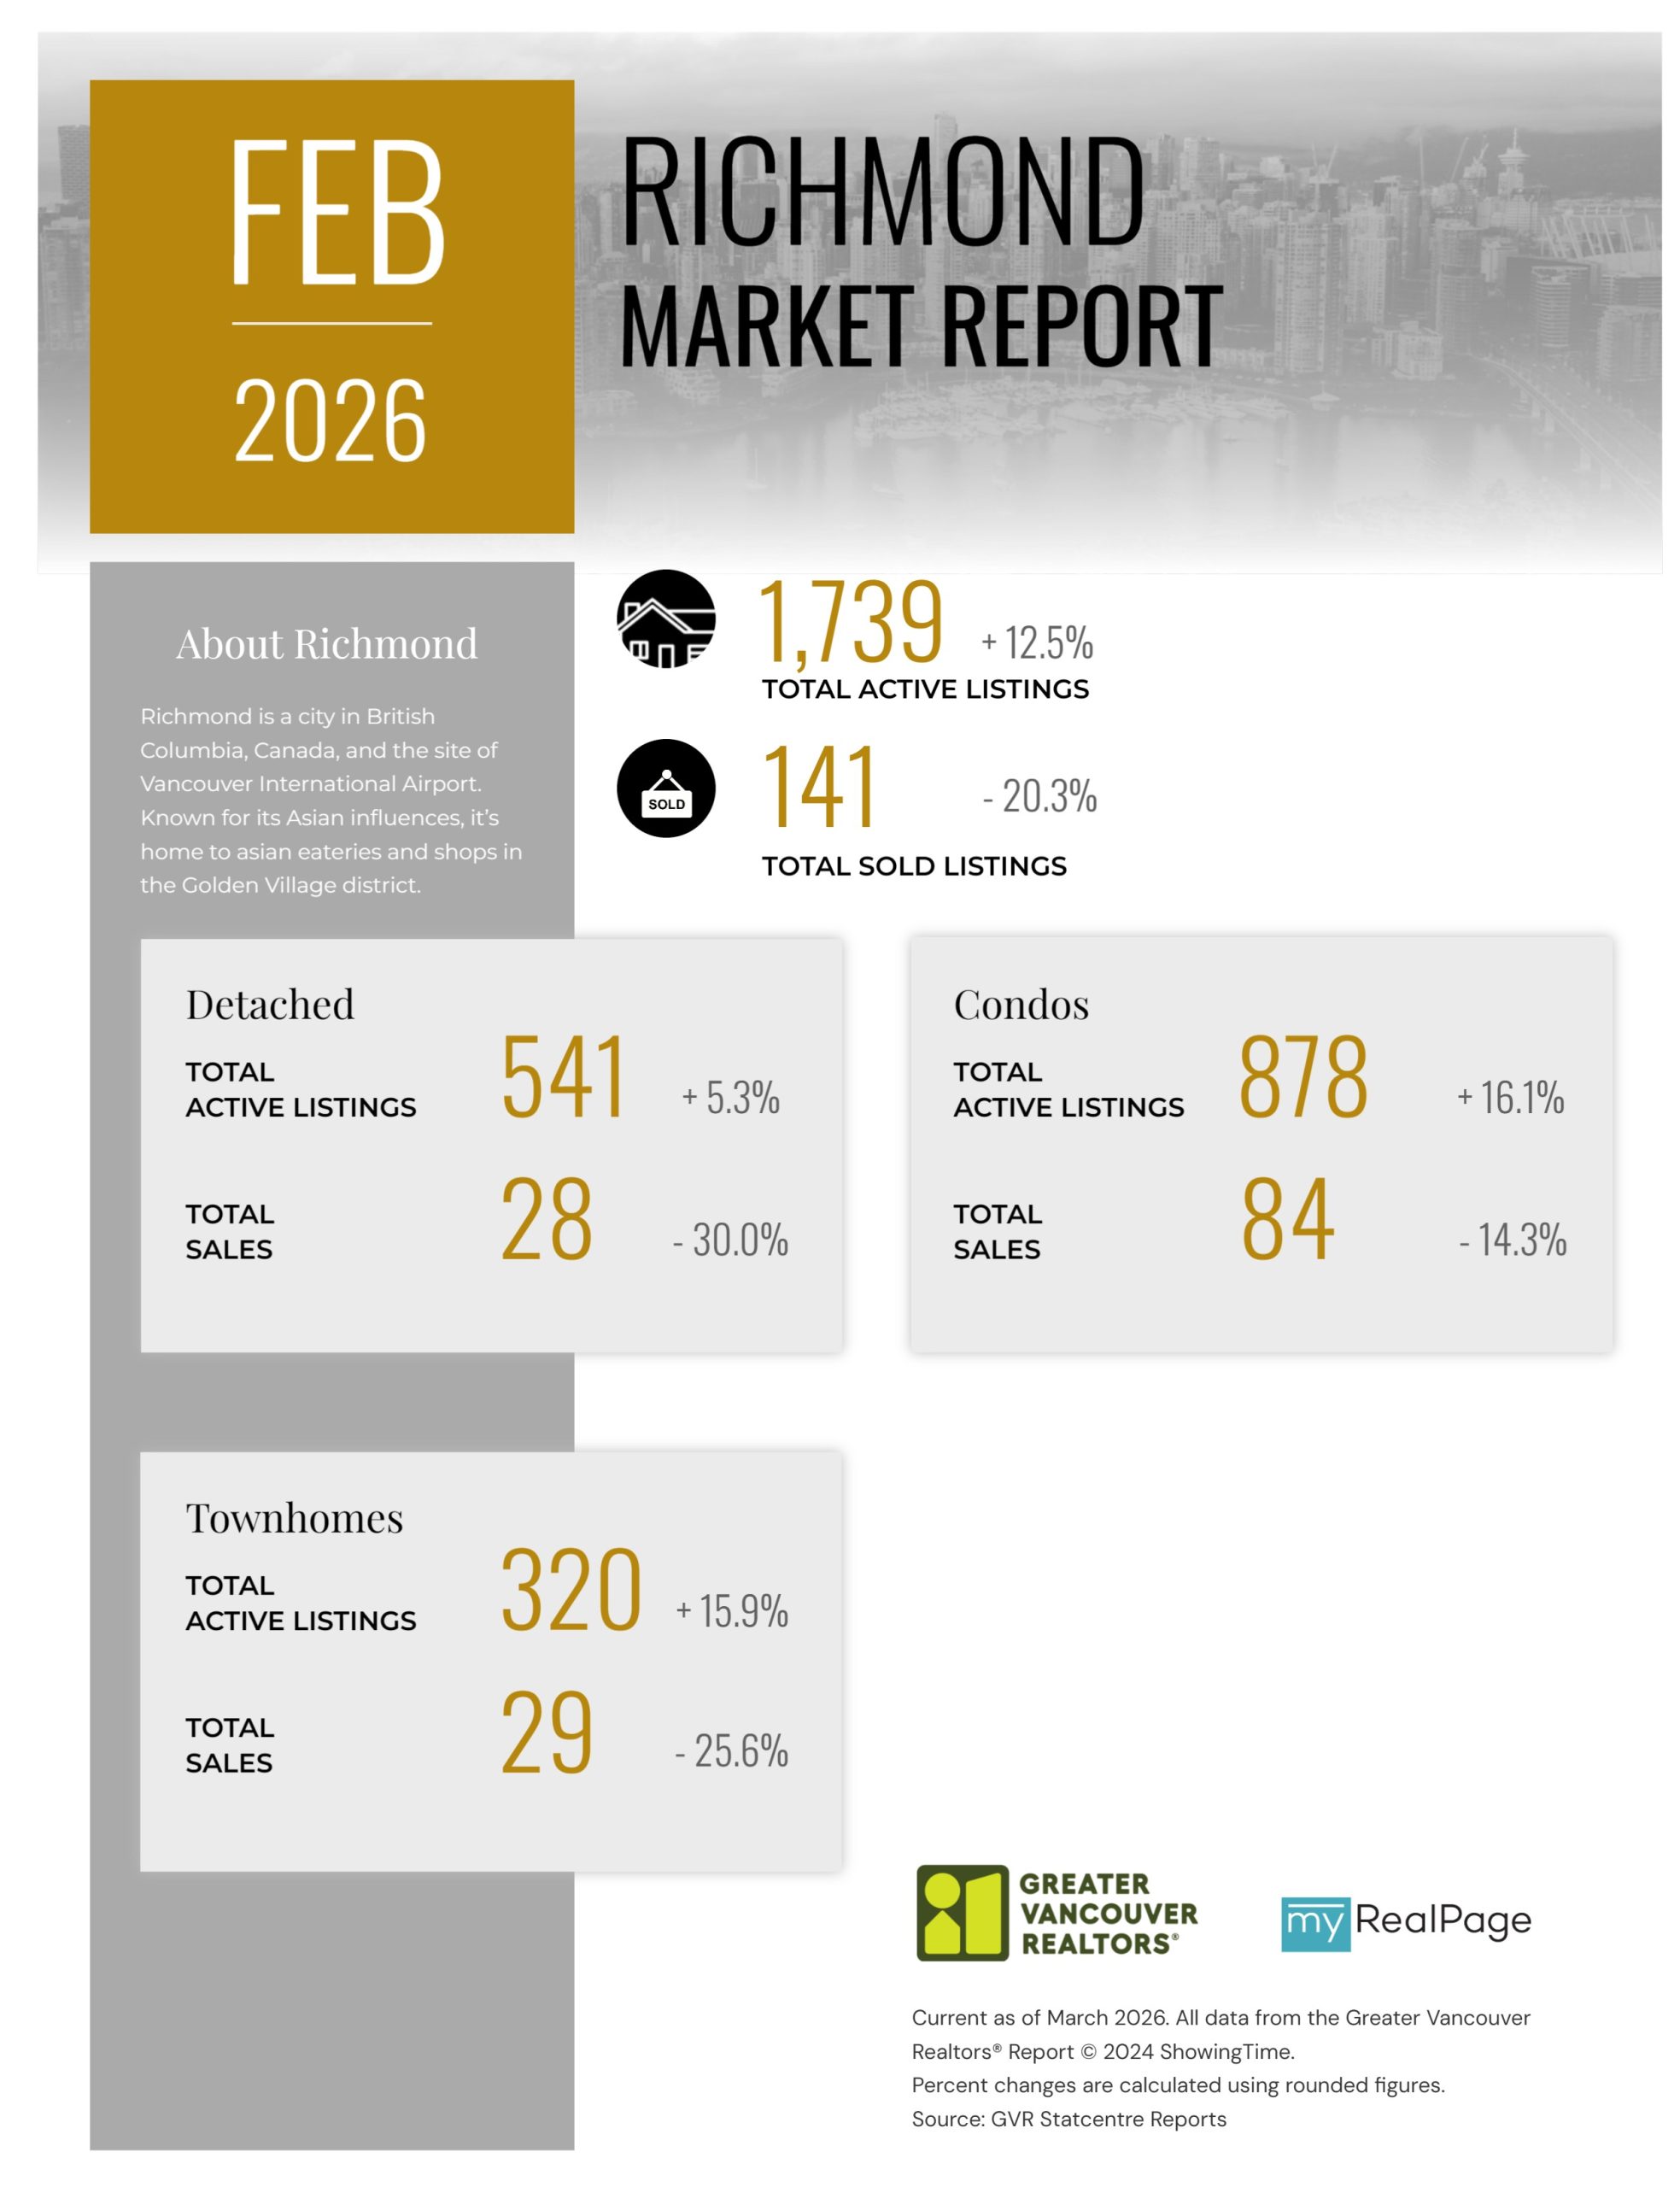
Printable Version – GVR March 2026 Data Infographics Report Richmond
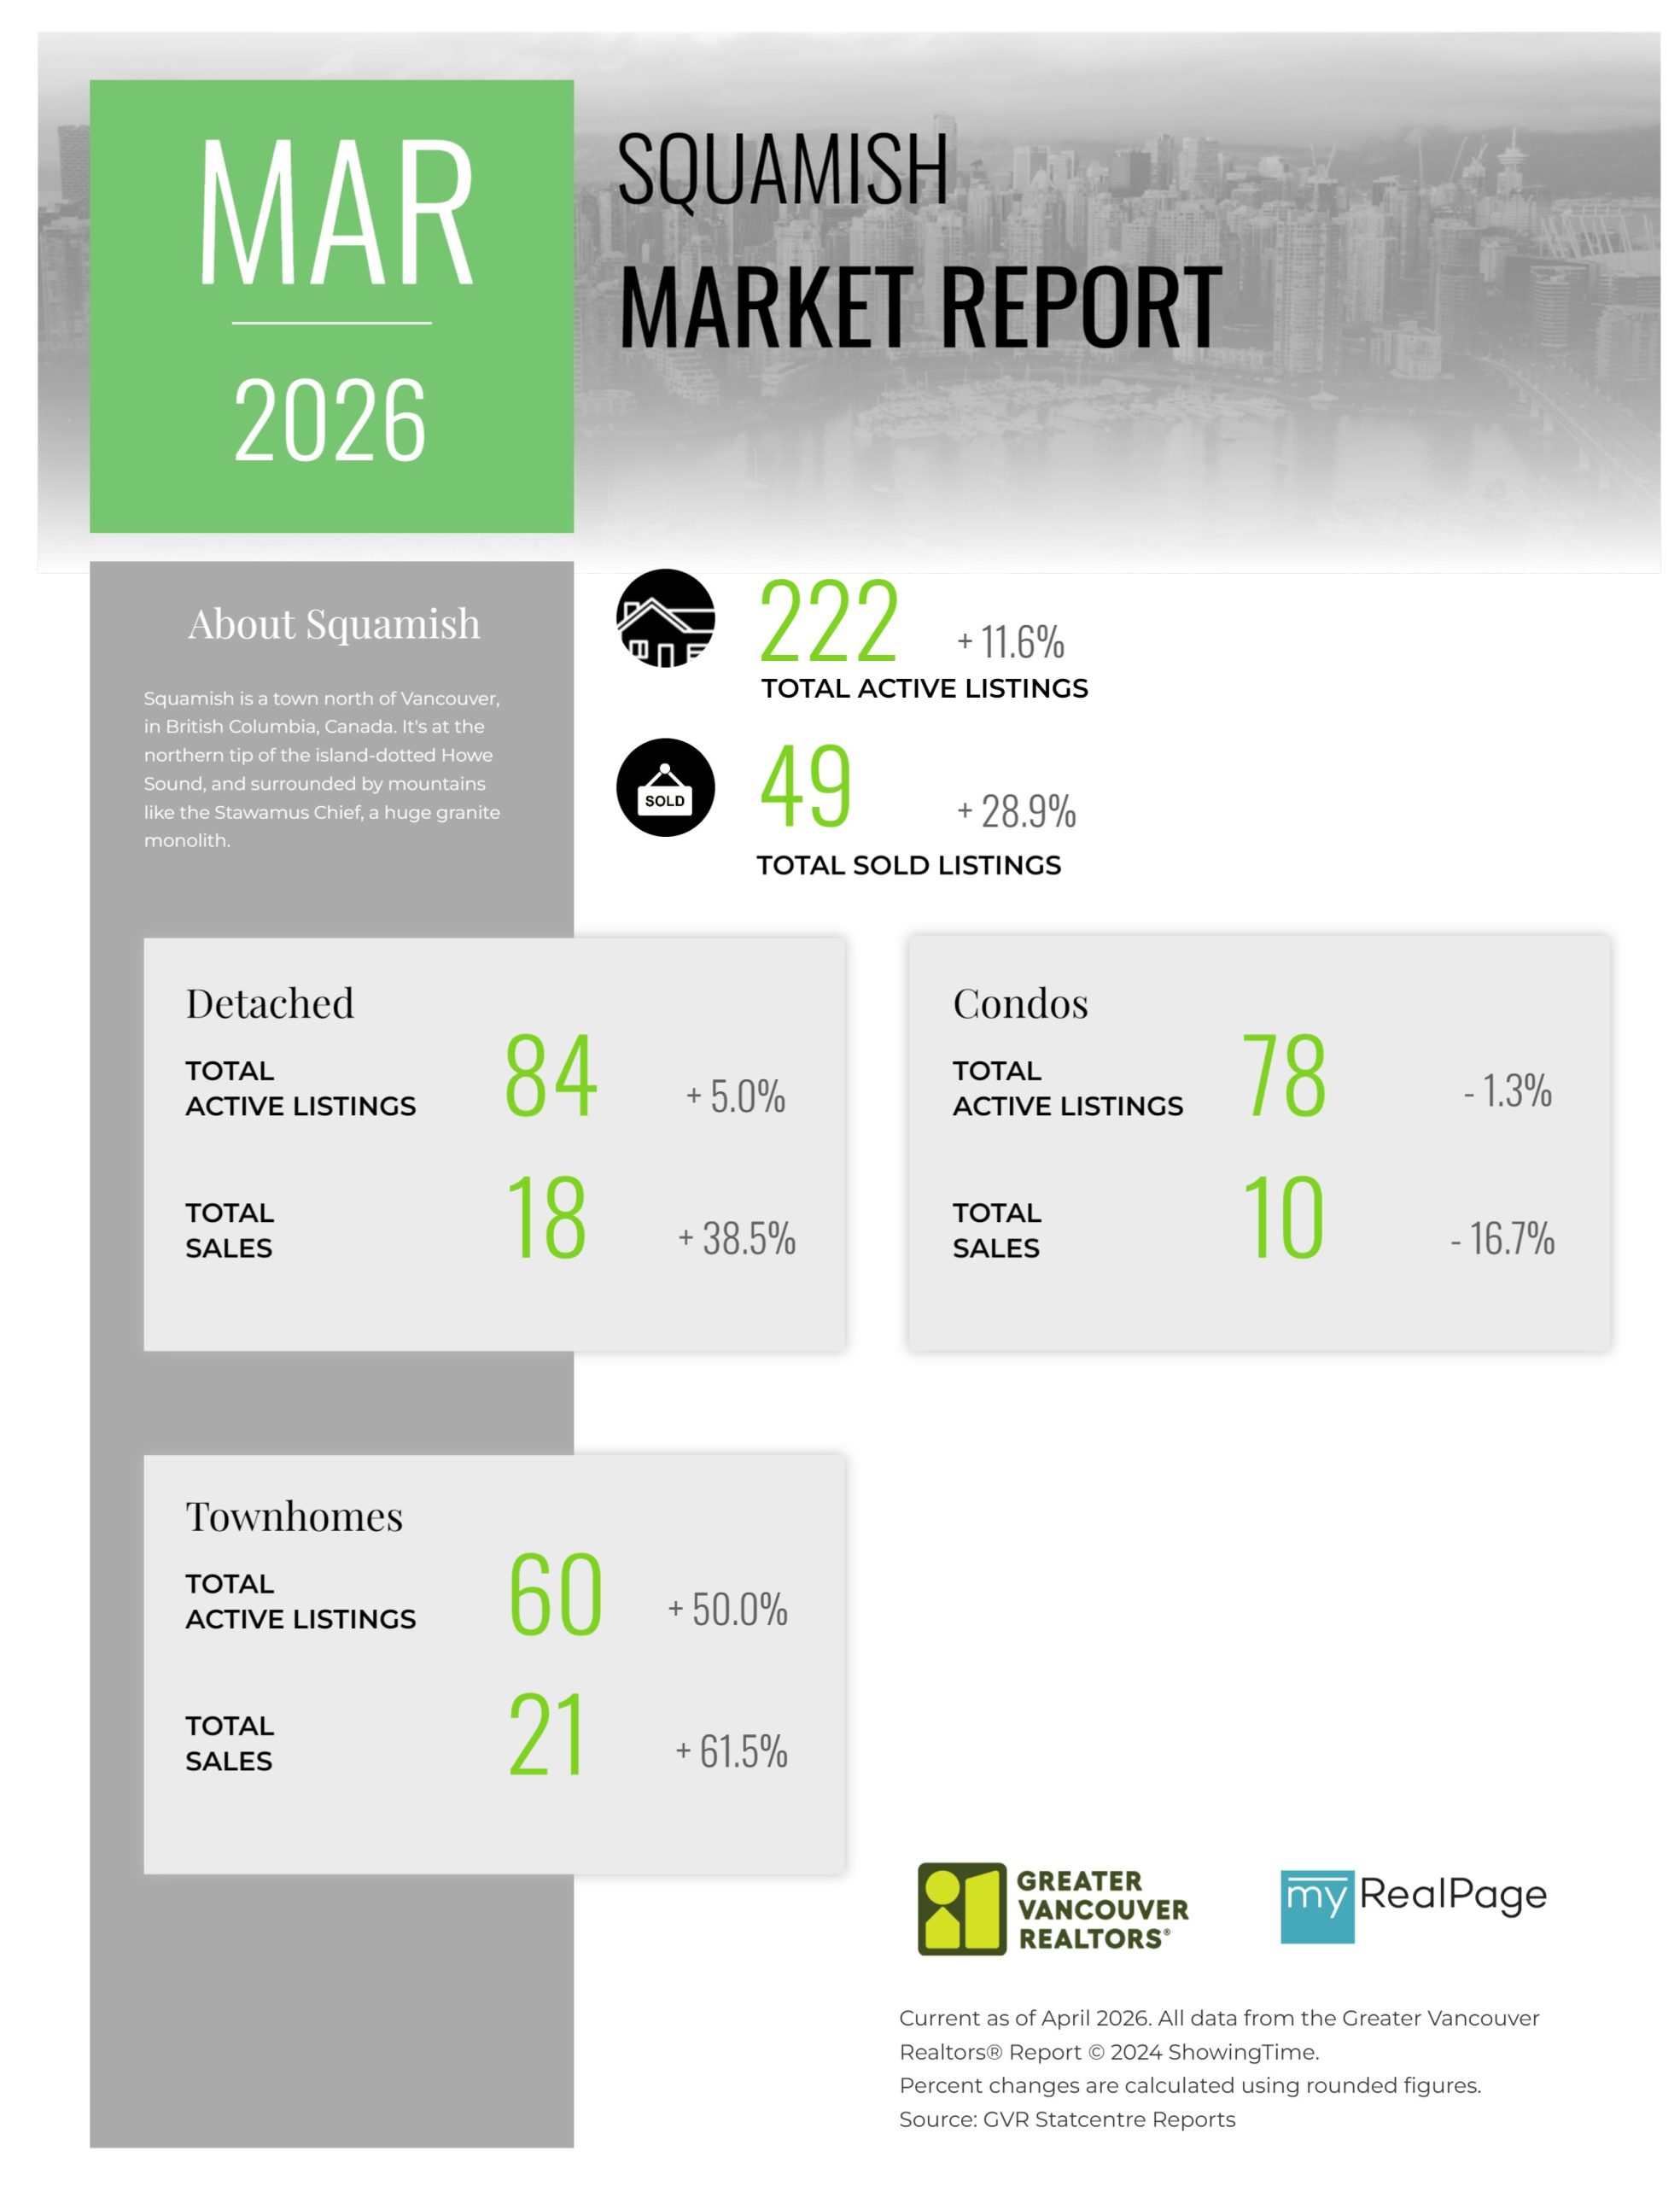
Printable Version – GVR March 2026 Data Infographics Report Squamish
Last Updated on April 9, 2026 by myRealPage
