INFOGRAPHICS: November 2023 REBGV Greater Vancouver Market Reports

Balanced conditions come to the Metro Vancouver housing market for the holiday season
With one month left in 2023, a steady increase in housing inventory is offering home buyers across Metro Vancouver1 among the largest selection to choose from since 2021.
The Real Estate Board of Greater Vancouver (REBGV) reports that residential sales2 in the region totalled 1,702 in November 2023, a 4.7 per cent increase from the 1,625 sales recorded in November 2022. This was 33 per cent below the 10-year seasonal average (2,538).
“We’ve been watching the number of active listings in our market increase over the past few months, which is giving buyers more to choose from than they’ve been used to seeing over the past few years. When paired with the seasonal slowdown in sales we typically see this time of year, this increase in supply is creating balanced conditions across Metro Vancouver’s housing market.”
Andrew Lis, REBGV director of economics and data analytics
Read the full report on the REBGV website!
The following data is a comparison between November 2023 and November 2022 numbers, and is current as of December 2023. For last month’s update, you can check out our previous post!
Or follow this link for all our REBGV Infographics!
These infographics cover current trends in several areas within the Greater Vancouver region. Click on the images for a larger view!
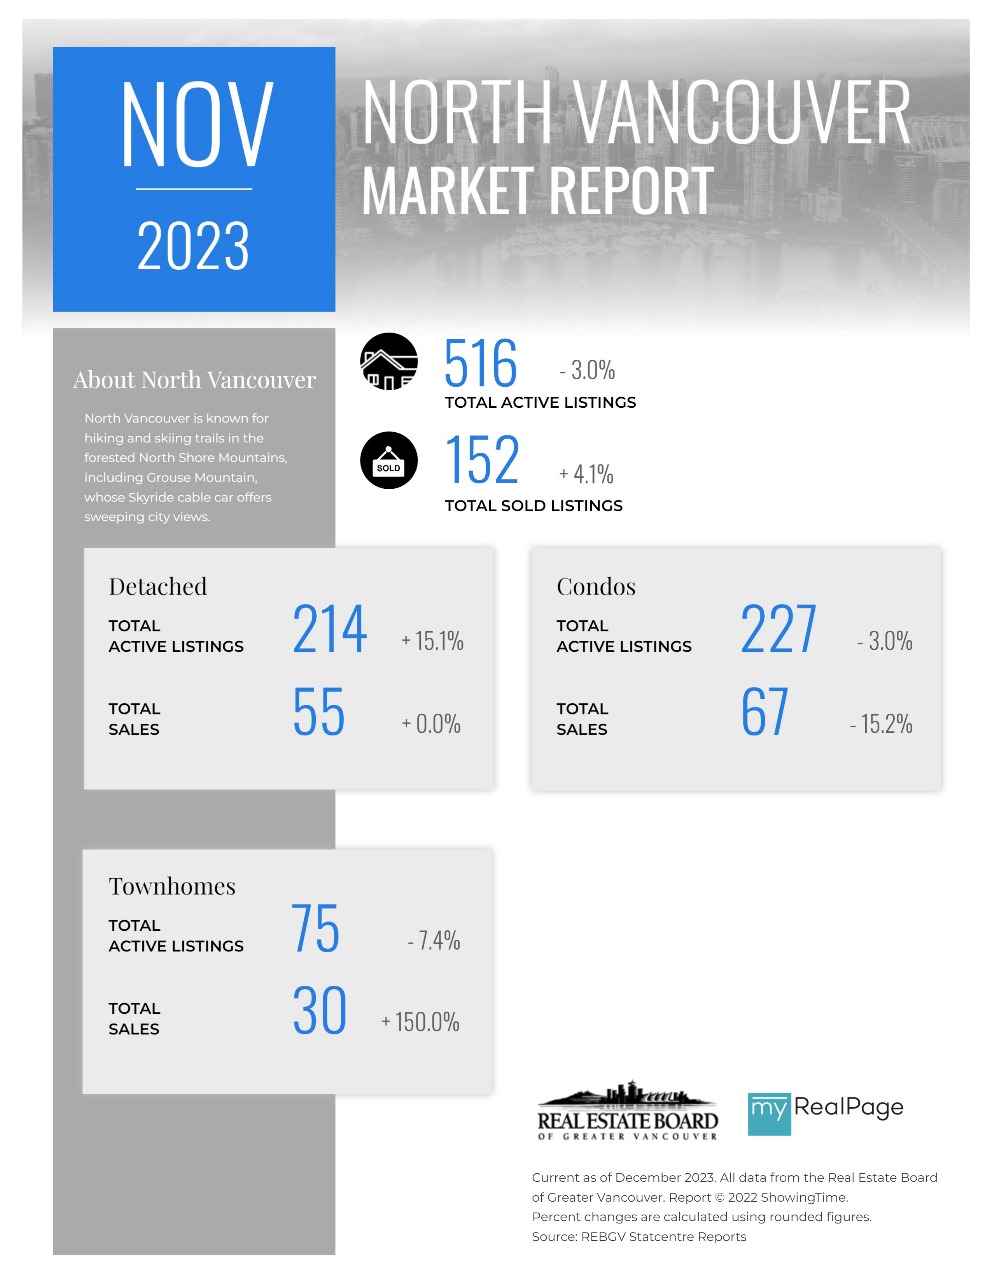
Printable Version – REBGV November 2023 Data Infographic Report North Vancouver
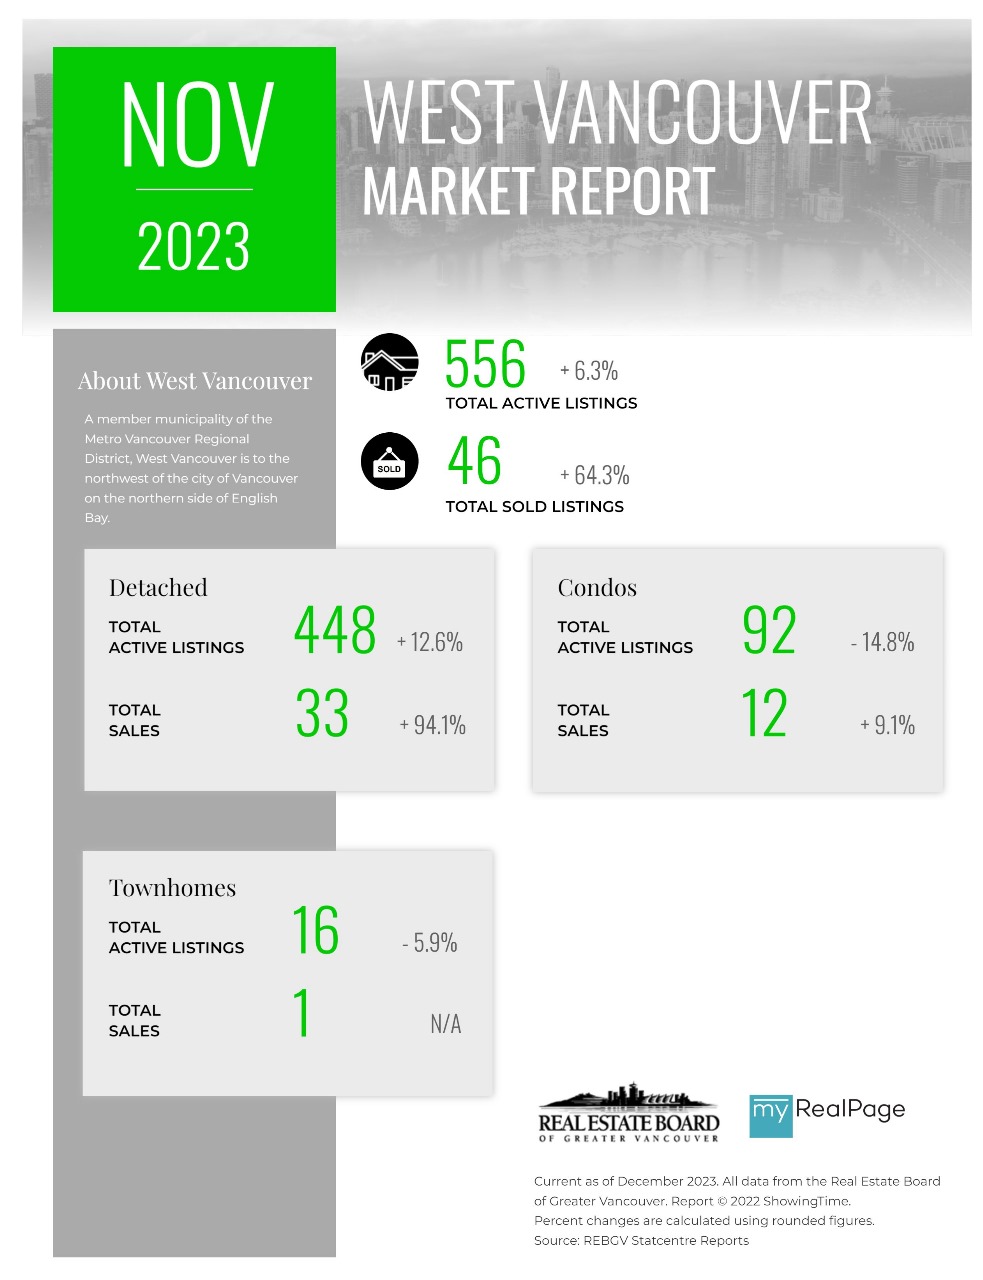
Printable Version – REBGV November 2023 Data Infographics Report West Vancouver
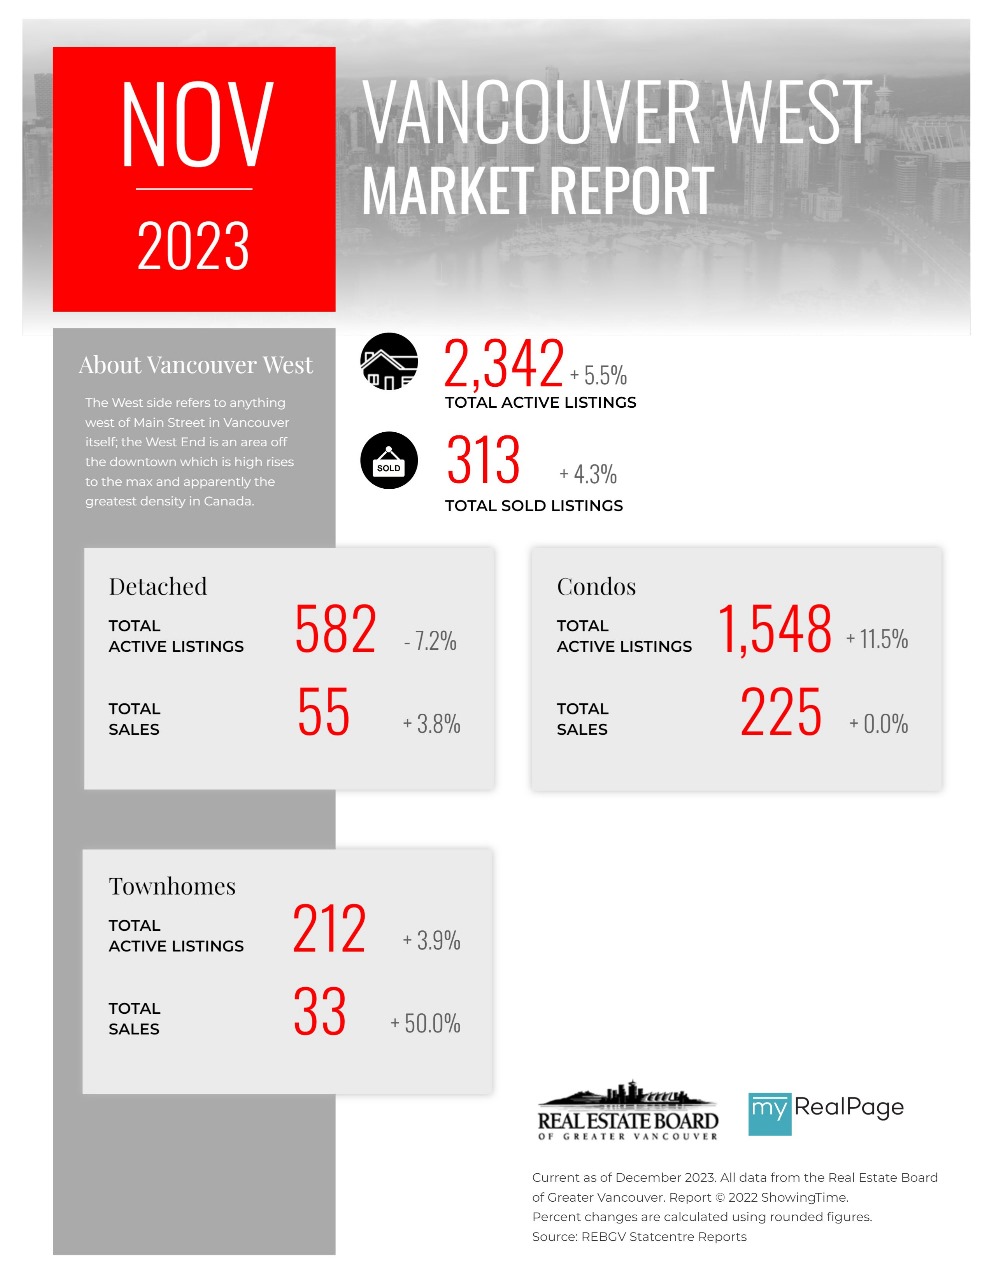
Printable Version – REBGV November 2023 Data Infographics Report Vancouver West
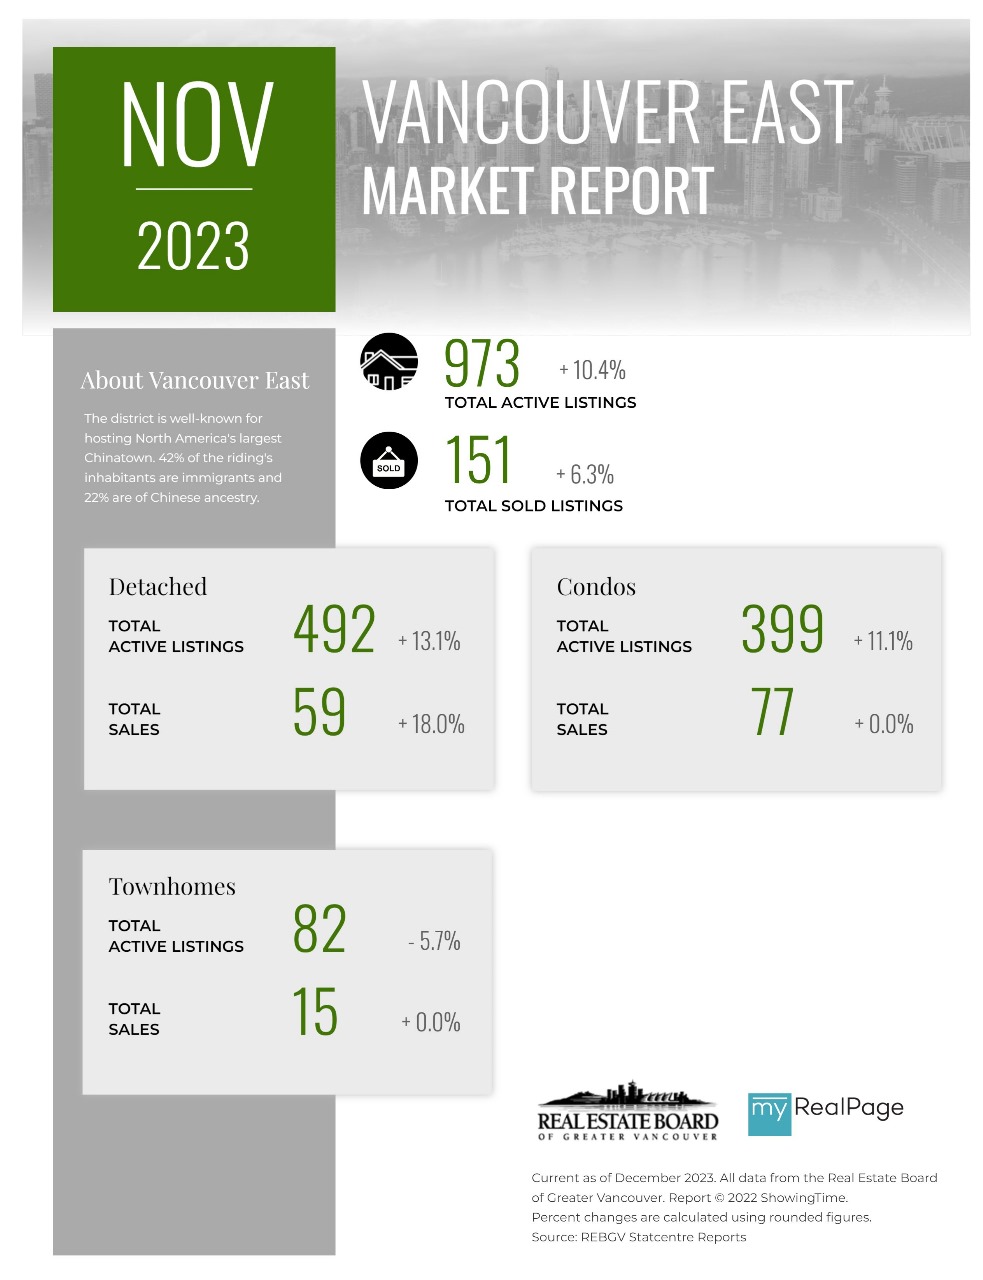
Printable Version – REBGV November 2023 Data Infographics Report Vancouver East
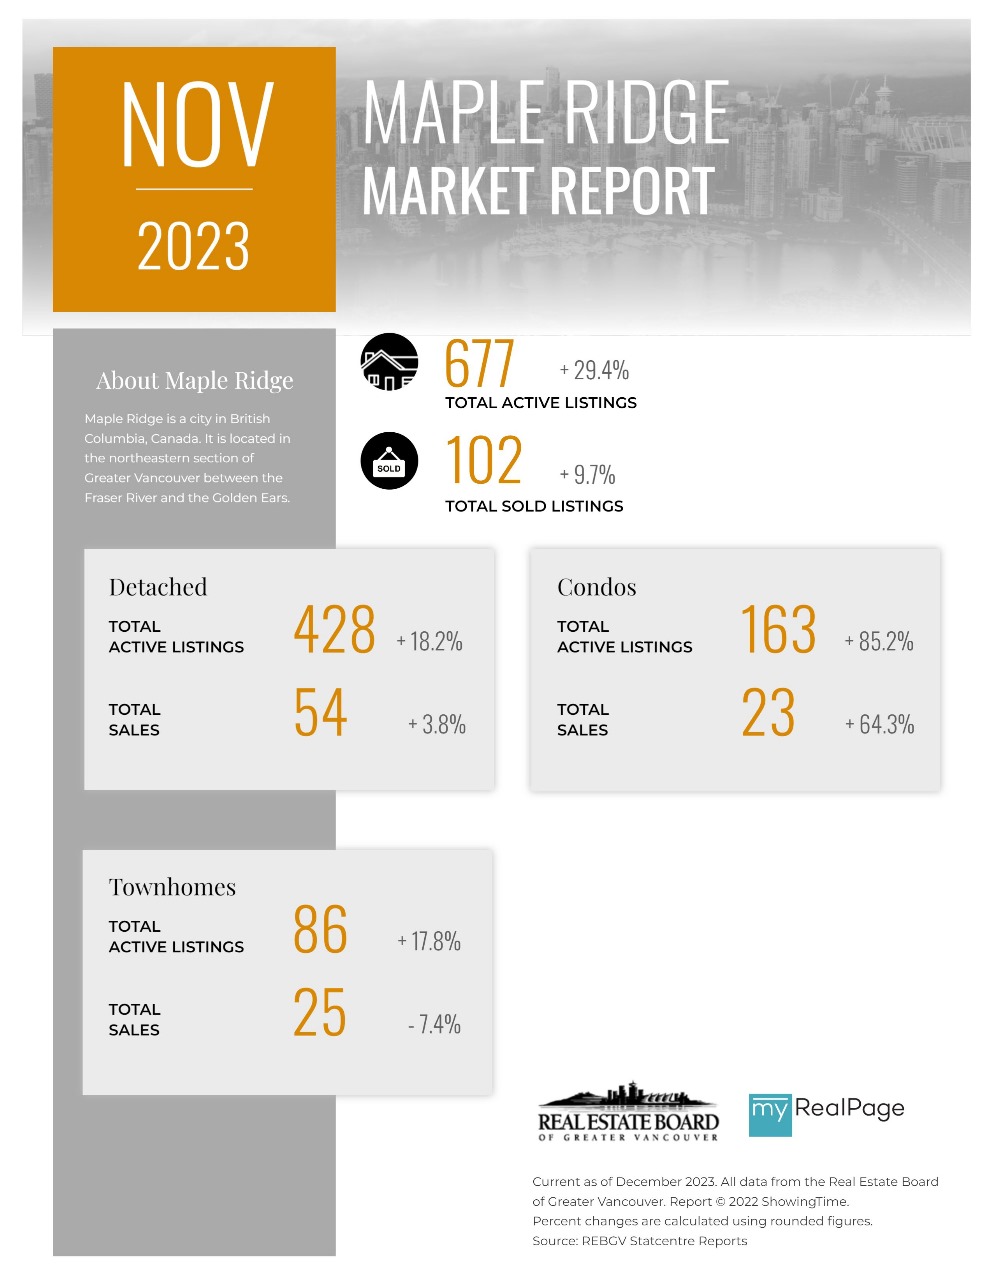
Printable Version – REBGV November 2023 Data Infographic Report Maple Ridge
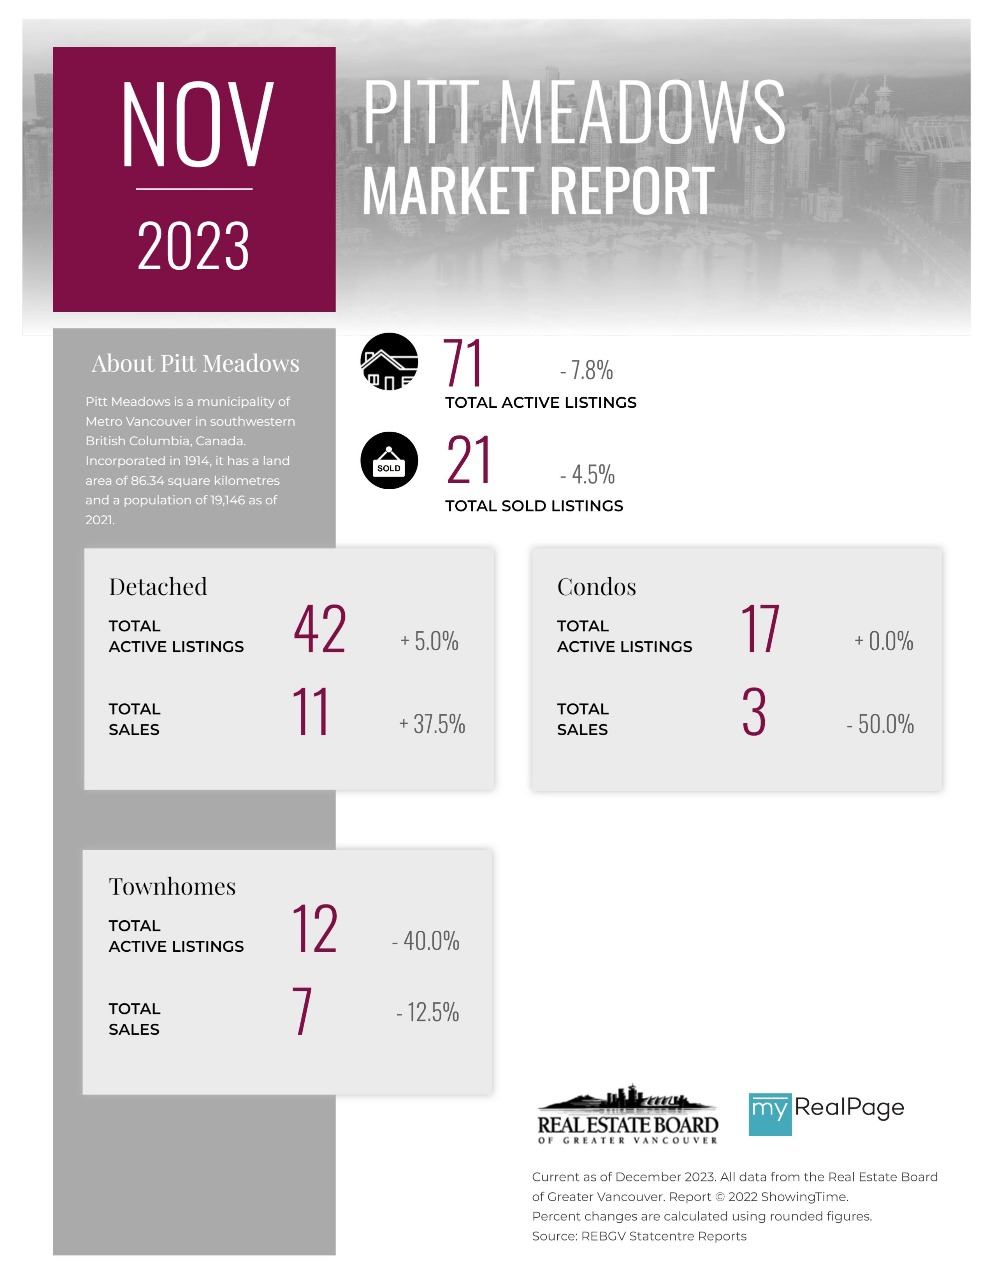
Printable Version – REBGV November 2023 Data Infographics Report Pitt Meadows
Printable Version – REBGV November 2023 Data Infographics Report Port Coquitlam
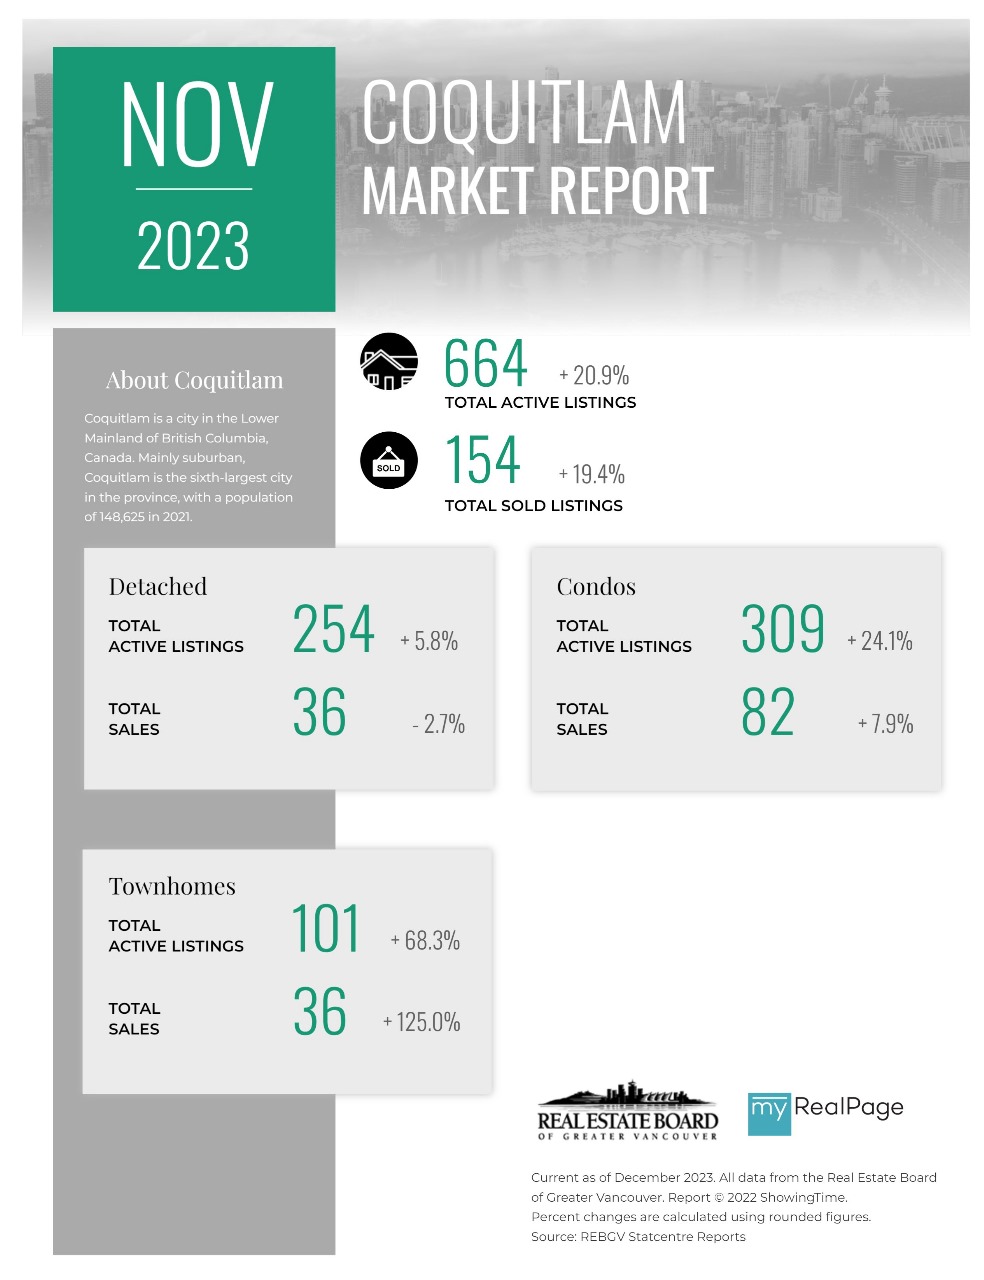
Printable Version – REBGV November 2023 Data Infographics Report Coquitlam
Printable Version – REBGV November 2023 Data Infographic Report Burnaby North
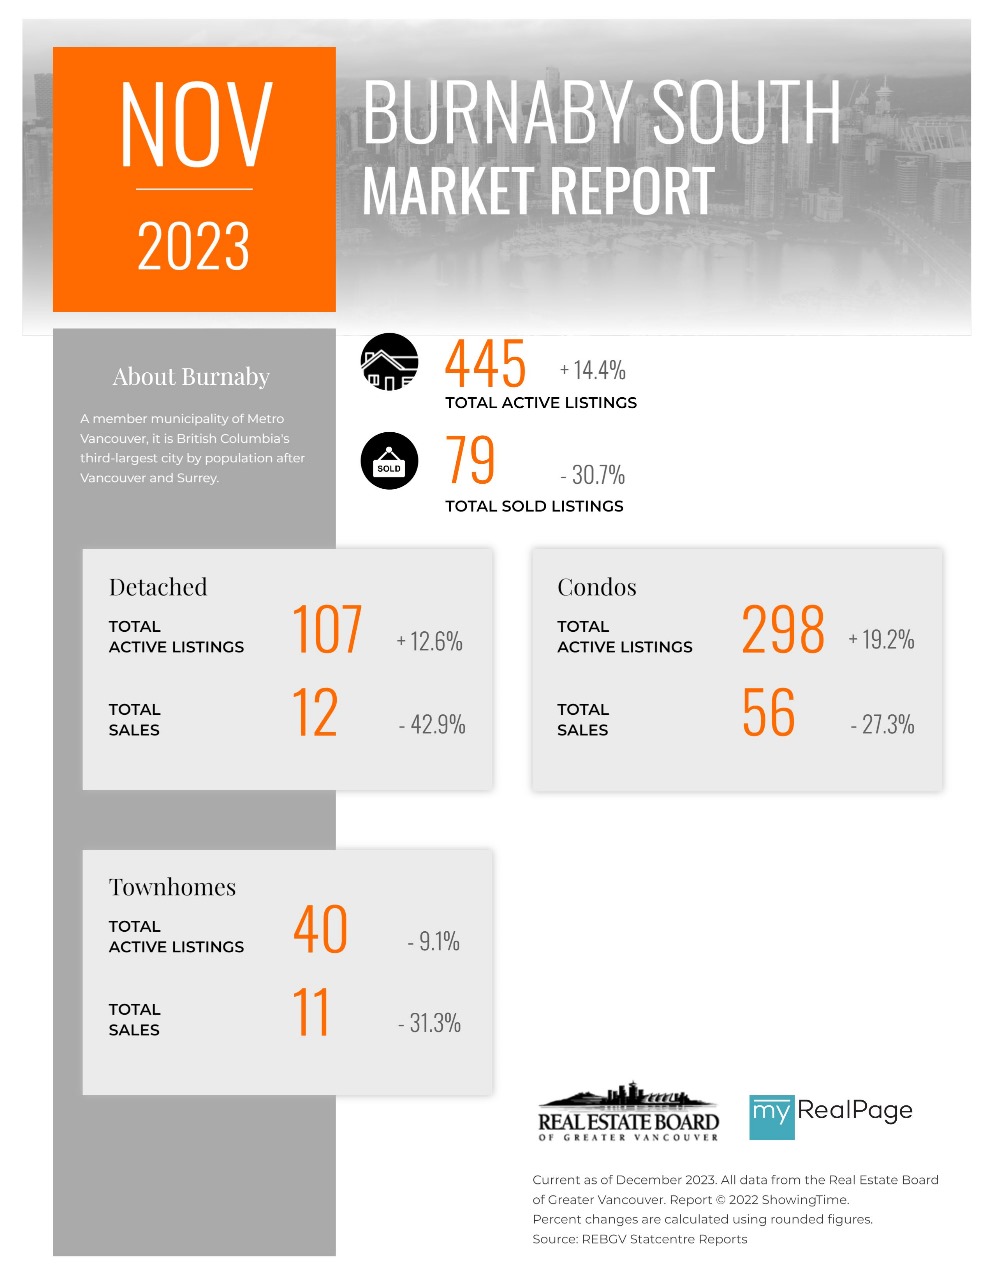
Printable Version – REBGV November 2023 Data Infographics Report Burnaby South
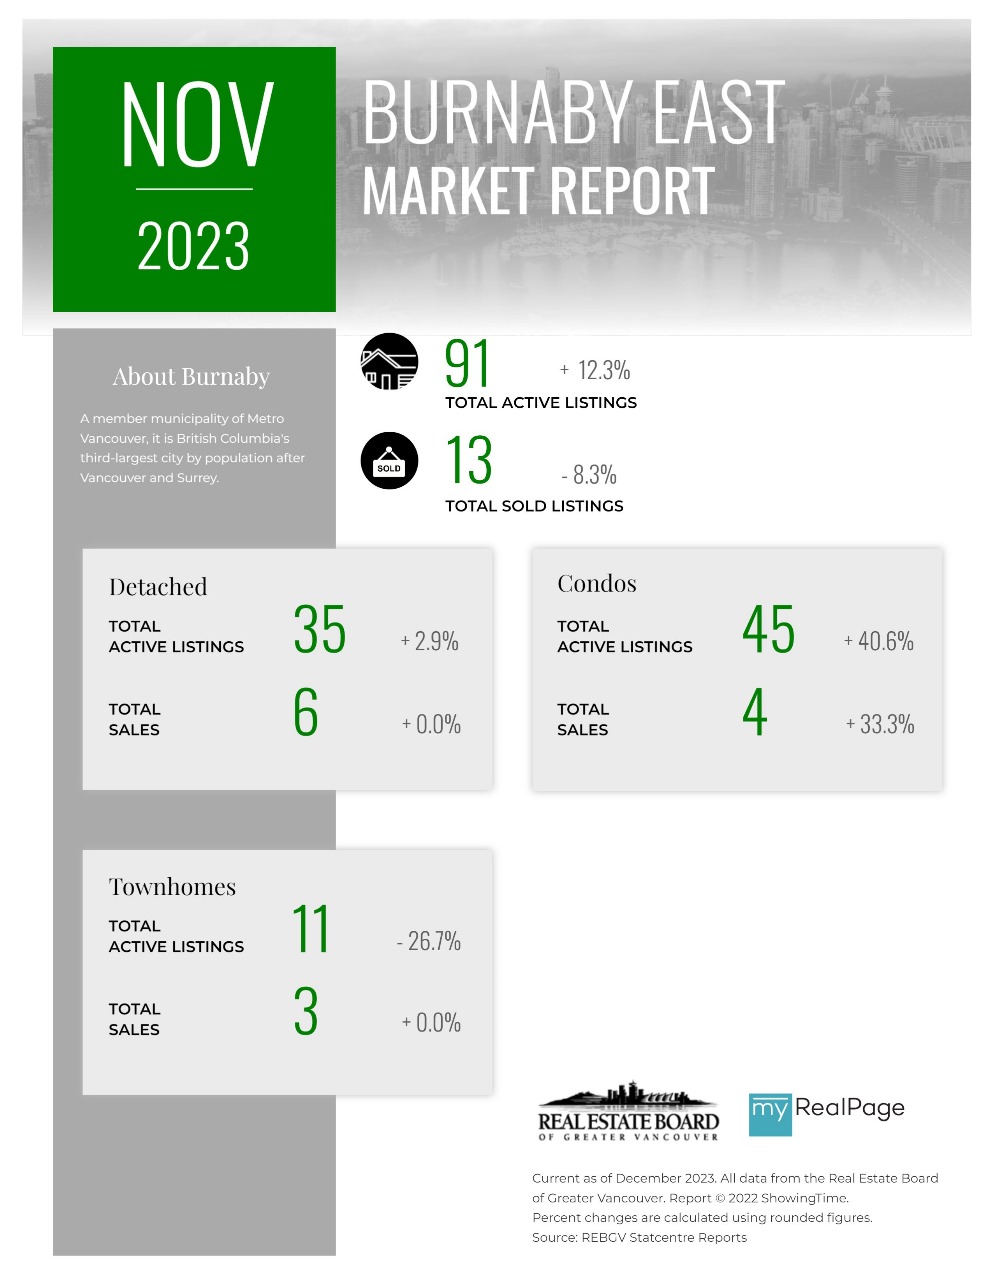
Printable Version – REBGV November 2023 Data Infographics Report Burnaby East
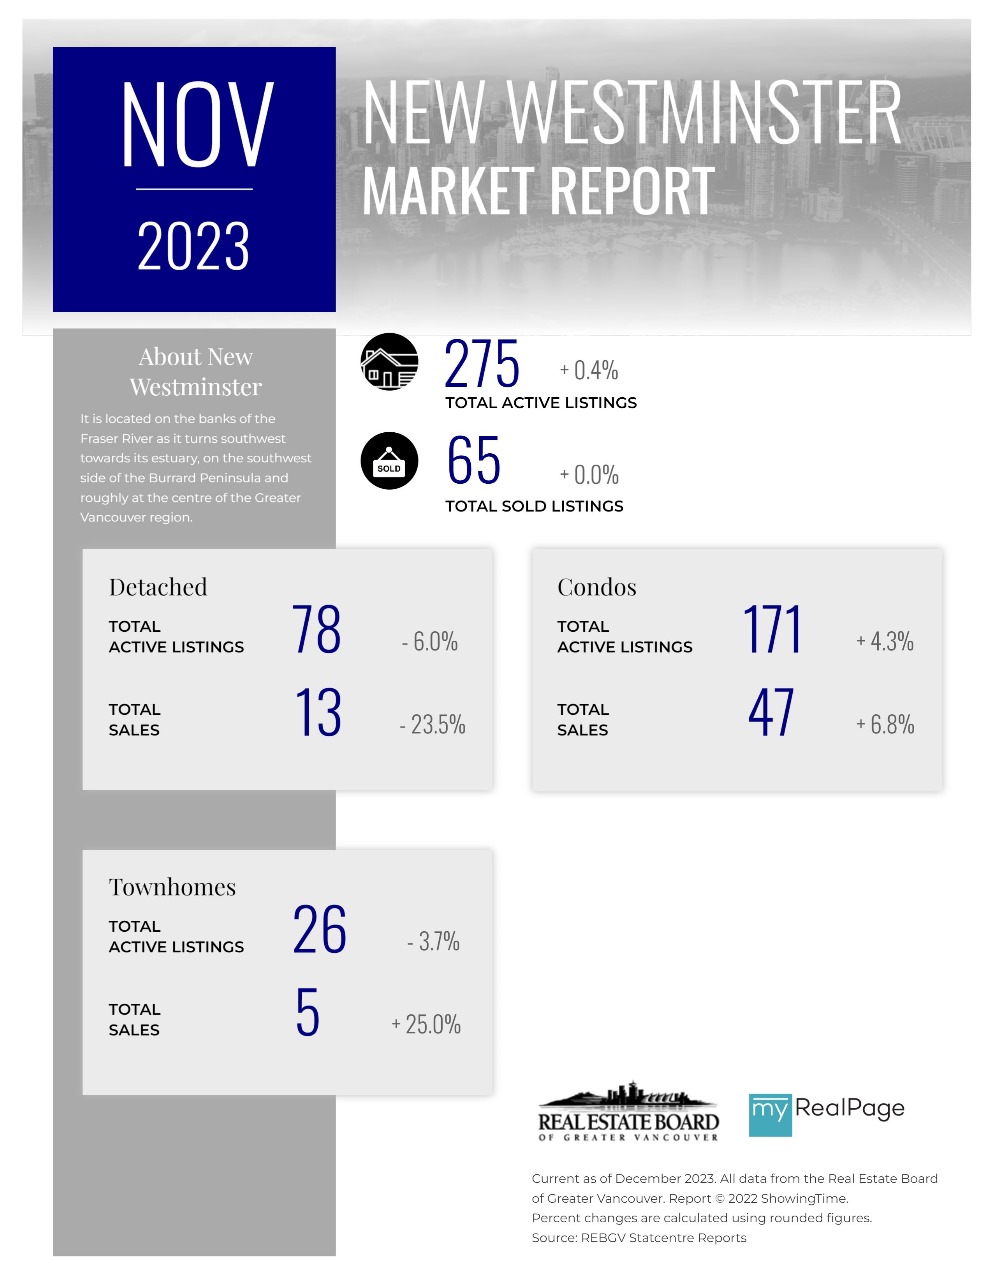
Printable Version – REBGV November 2023 Data Infographics Report New Westminster
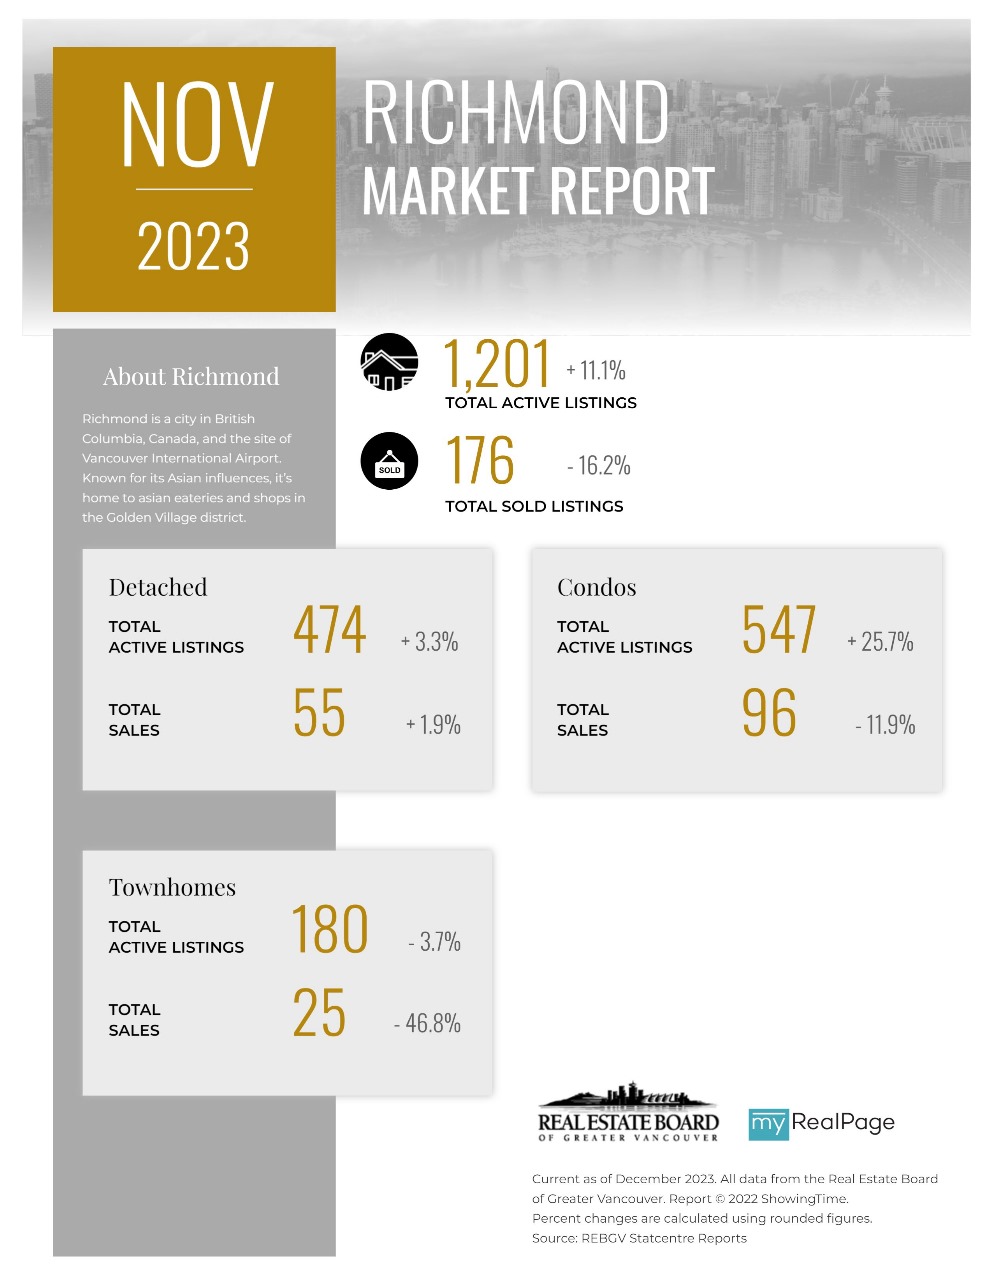
Printable Version – REBGV November 2023 Data Infographics Report Richmond
Printable Version – REBGV November 2023 Data Infographics Report South Surrey / White Rock


Last Updated on December 6, 2023 by myRealPage
