INFOGRAPHICS: December 2023 REBGV Greater Vancouver Market Reports

Housing market resilient in 2023, ends year in balanced territory
Metro Vancouver’s housing market closed out 2023 with balanced market conditions, but the year-end totals mask a story of surprising resilience in the face of the highest borrowing costs seen in over a decade.
The Real Estate Board of Greater Vancouver (REBGV) reports that residential sales in the region totalled 26,249 in 2023, a 10.3 per cent decrease from the 29,261 sales recorded in 2022, and a 41.5 per cent decrease from the 44,884 sales in 2021.
“You could miss it by just looking at the year-end totals, but 2023 was a strong year for the Metro Vancouver housing market considering that mortgage rates were the highest they’ve been in over a decade.”
Andrew Lis, REBGV director of economics and data analytics
Read the full report on the REBGV website!
The following data is a comparison between December 2023 and December 2022 numbers, and is current as of January 2024. For last month’s update, you can check out our previous post!
Or follow this link for all our REBGV Infographics!
These infographics cover current trends in several areas within the Greater Vancouver region. Click on the images for a larger view!
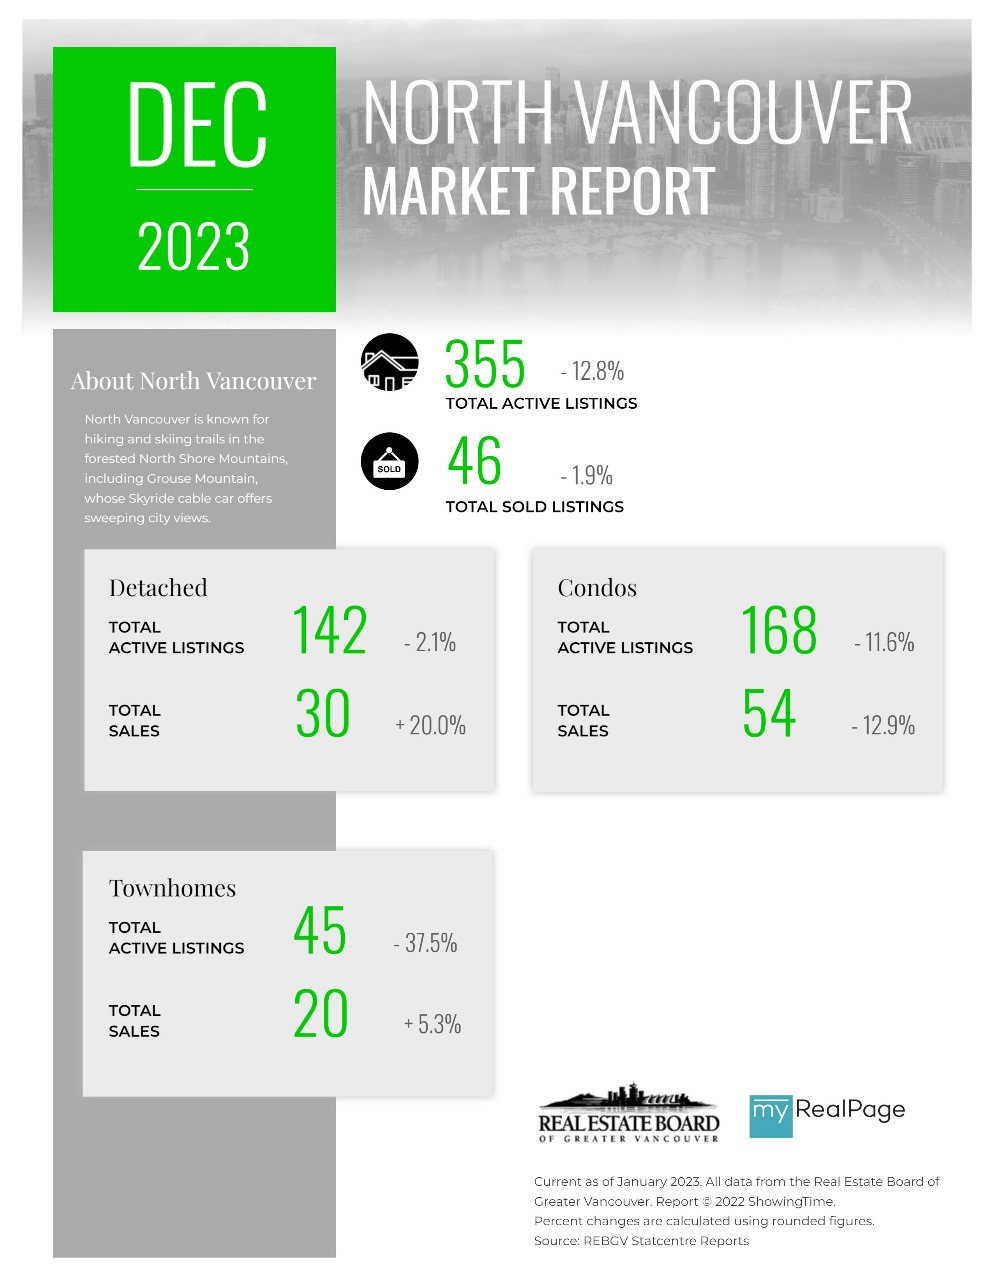
Printable Version – REBGV December 2023 Data Infographic Report North Vancouver
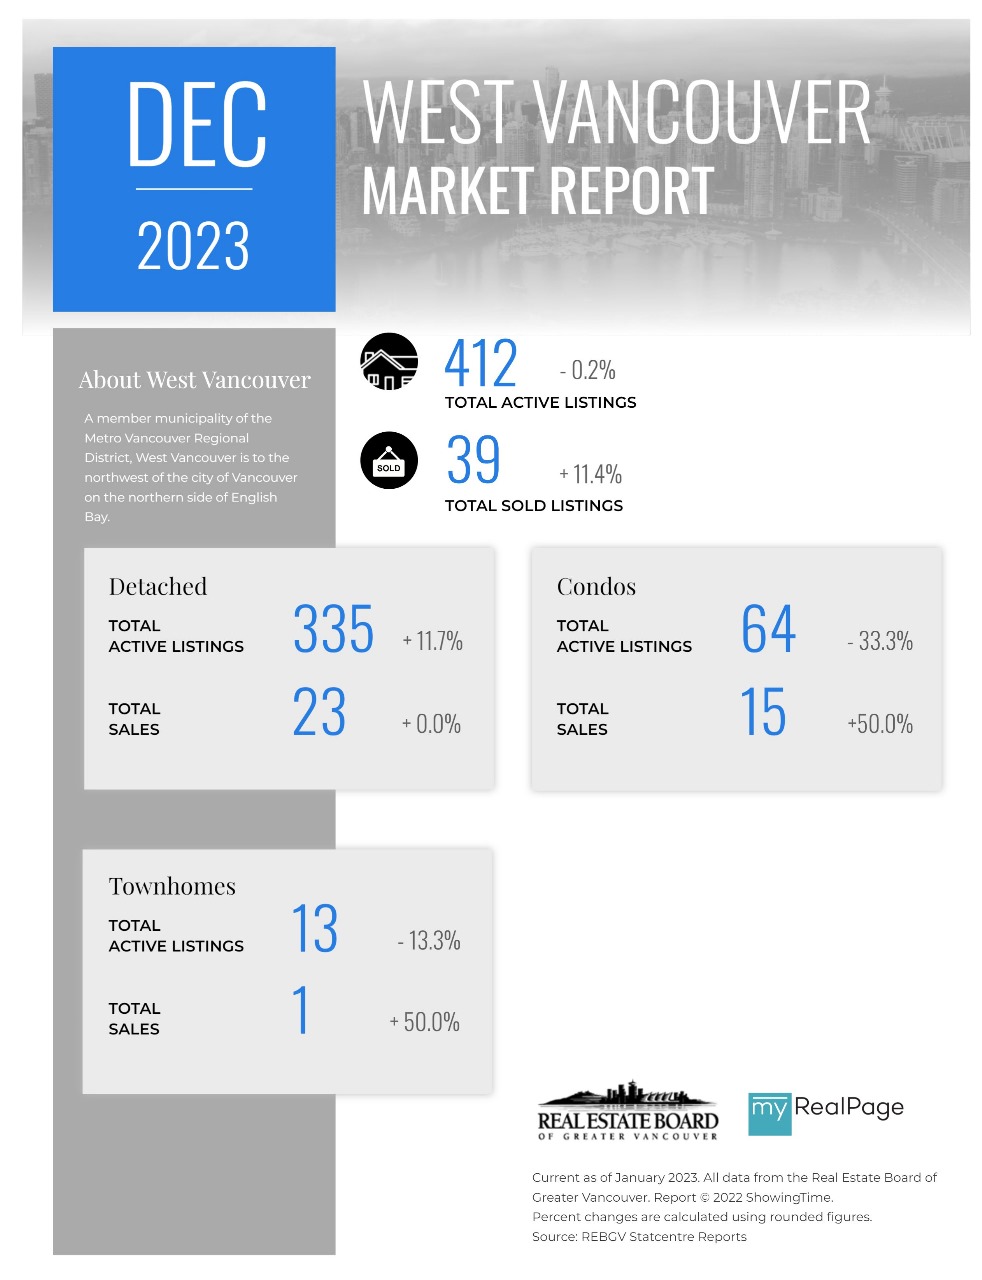
Printable Version – REBGV December 2023 Data Infographics Report West Vancouver
Printable Version – REBGV December 2023 Data Infographics Report Vancouver West
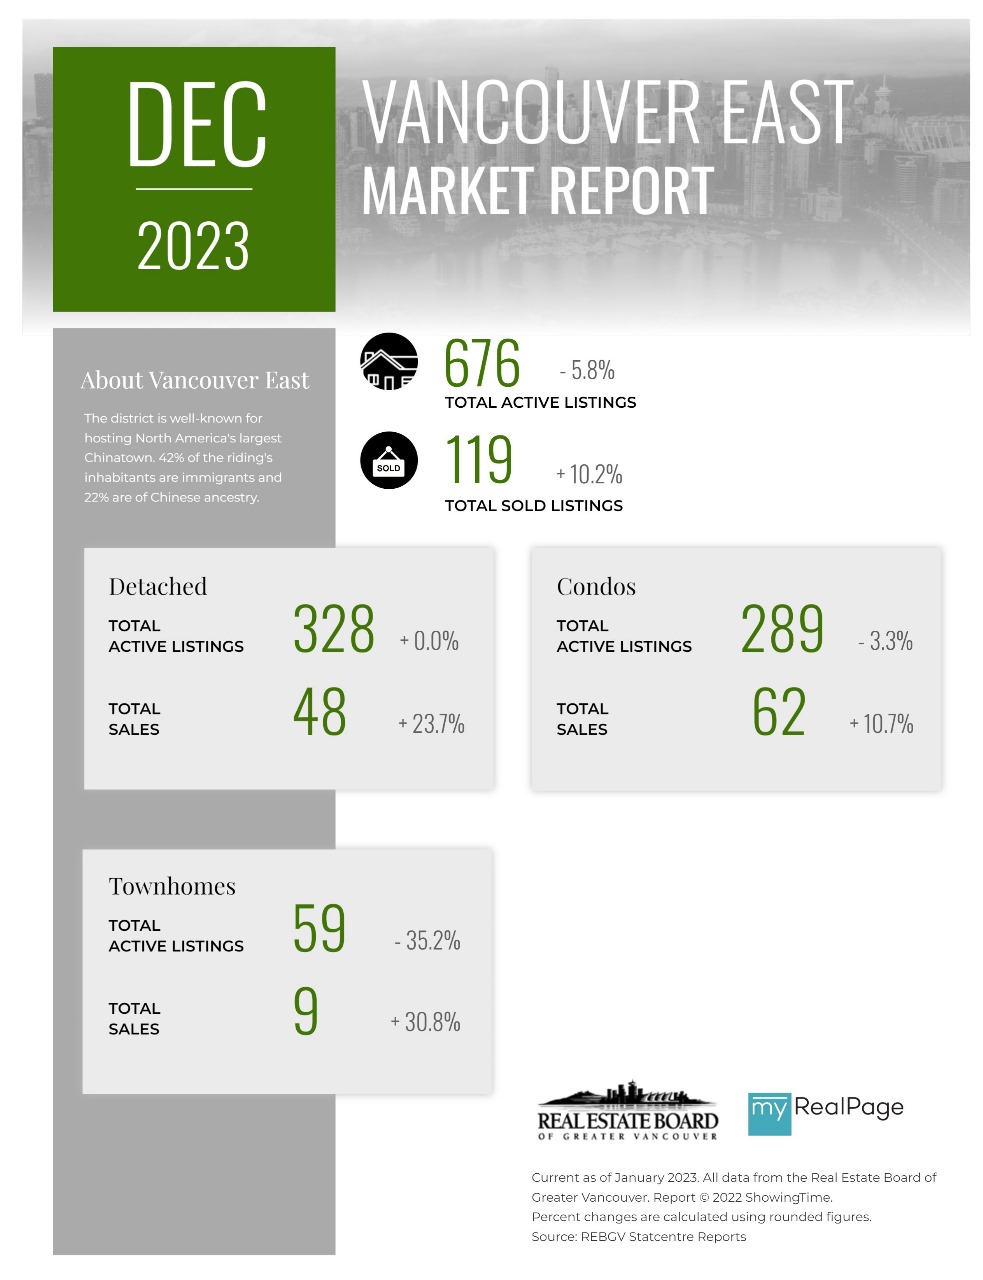
Printable Version – REBGV December 2023 Data Infographics Report Vancouver East
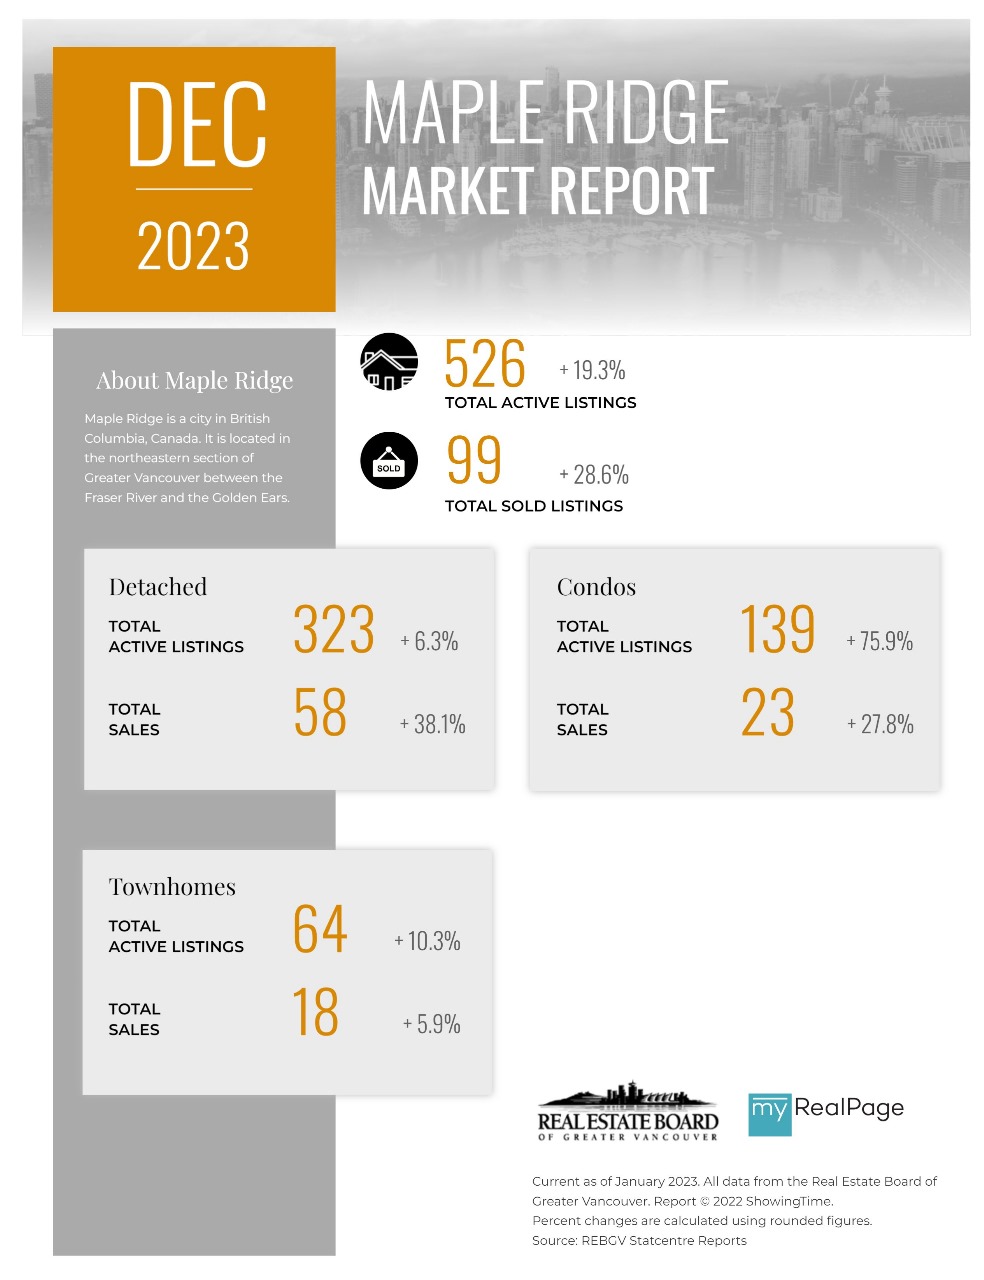
Printable Version – REBGV December 2023 Data Infographic Report Maple Ridge
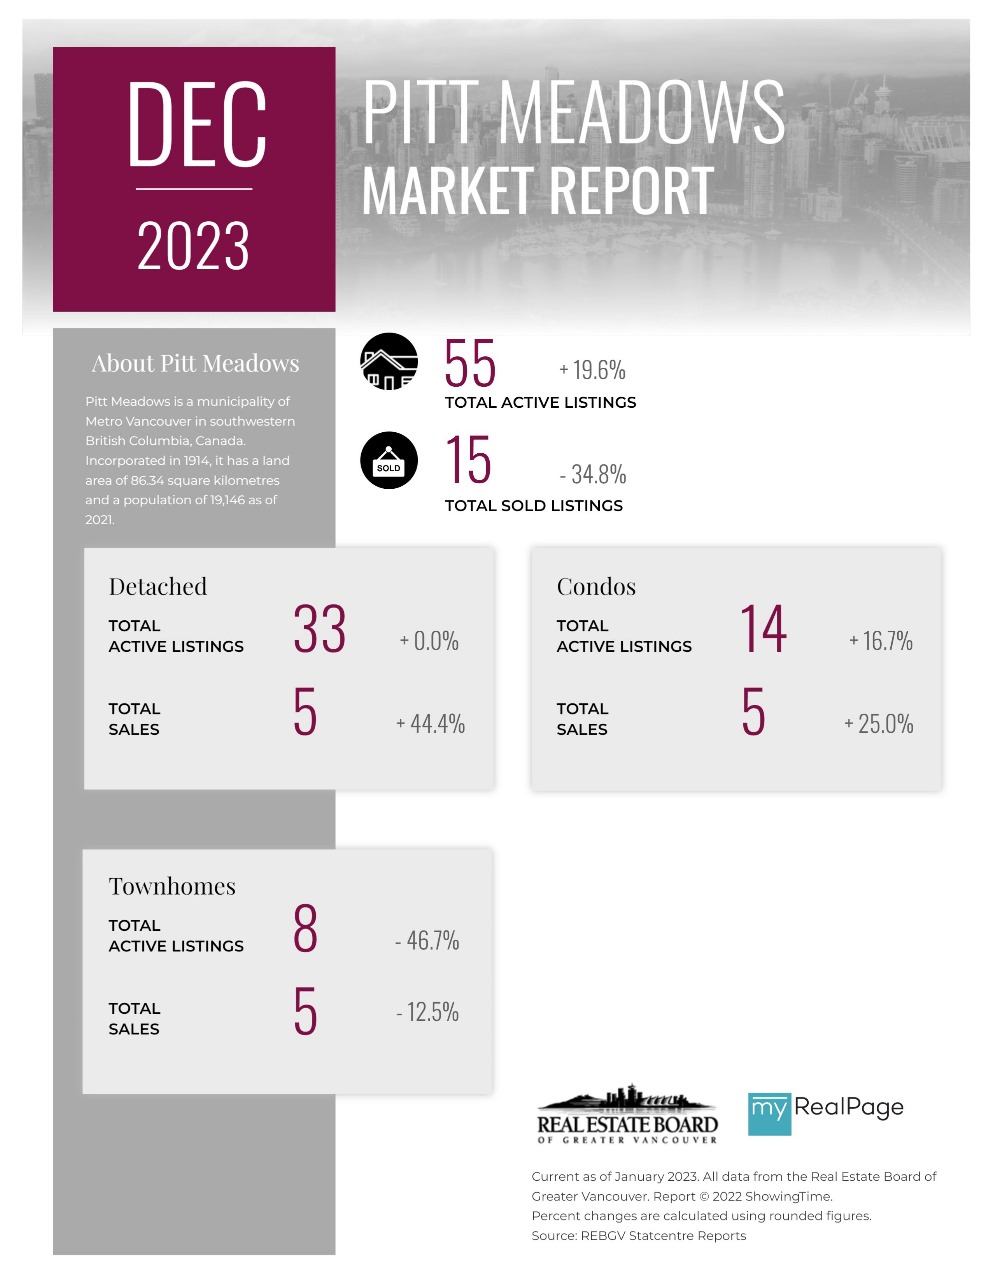
Printable Version – REBGV December 2023 Data Infographics Report Pitt Meadows
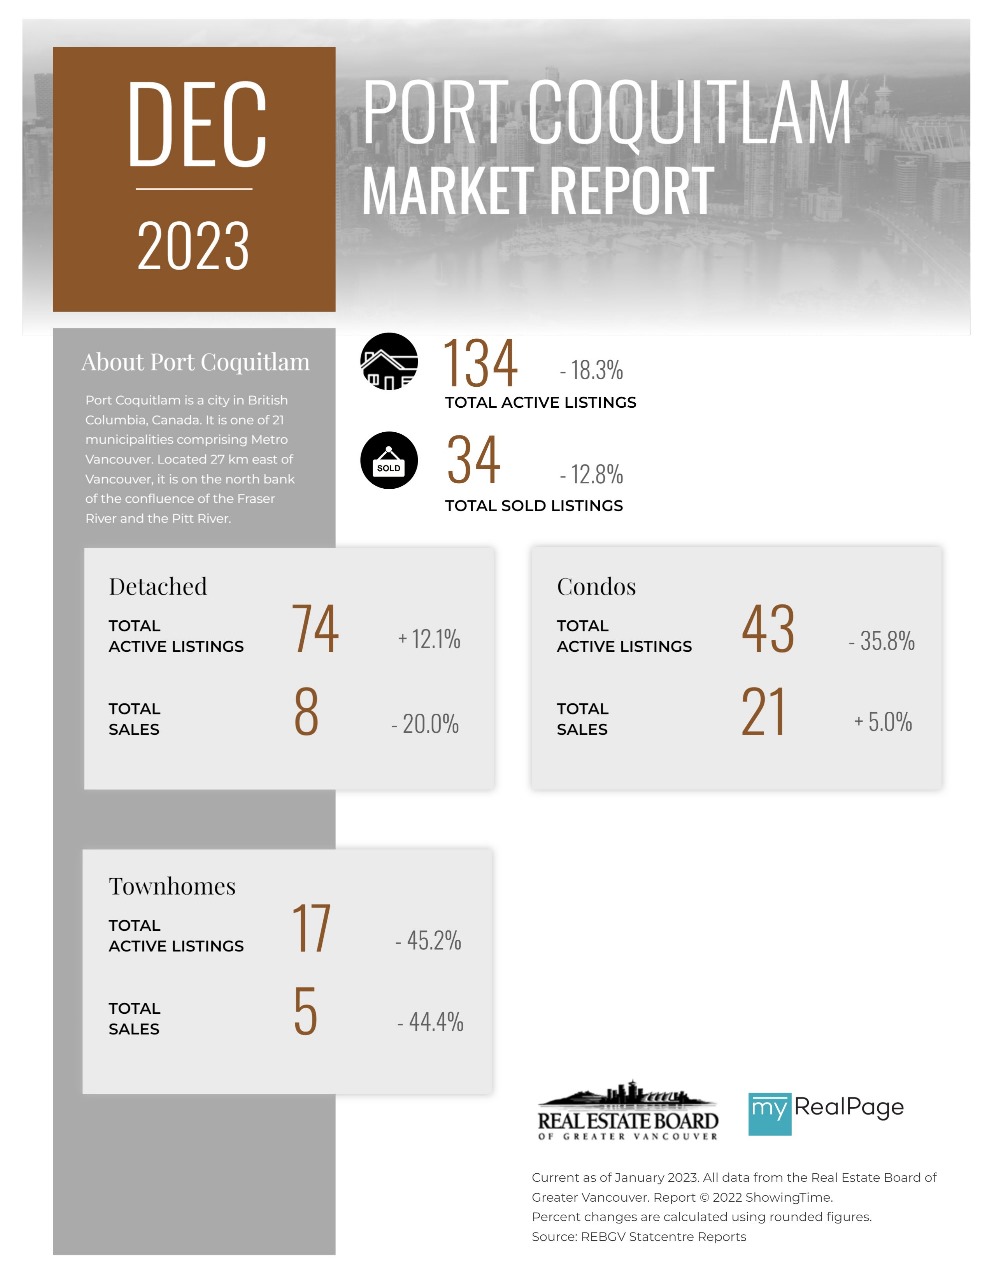
Printable Version – REBGV December 2023 Data Infographics Report Port Coquitlam
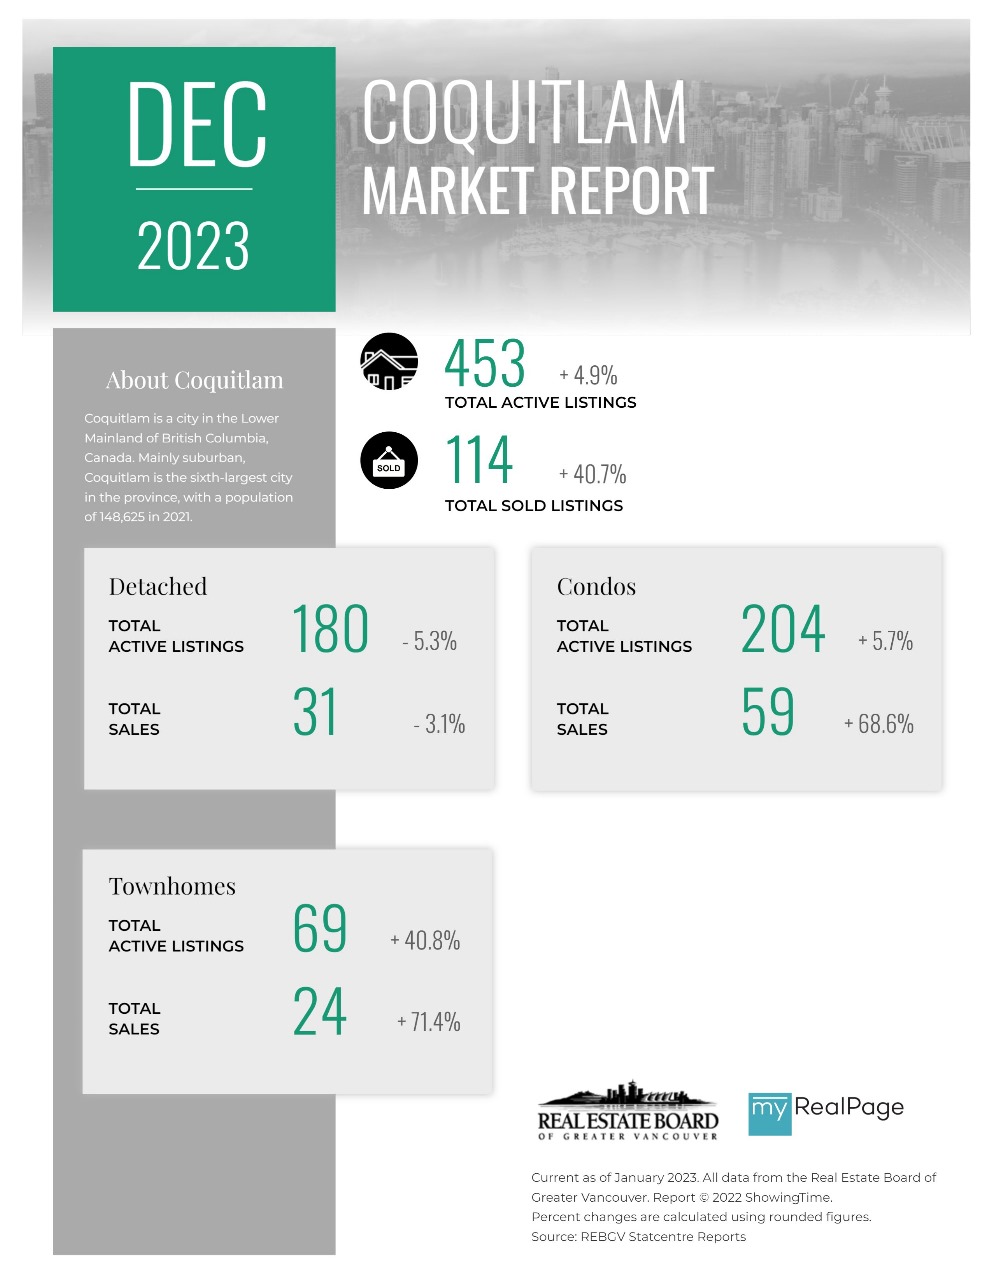
Printable Version – REBGV December 2023 Data Infographics Report Coquitlam
Printable Version – REBGV December 2023 Data Infographic Report Burnaby North
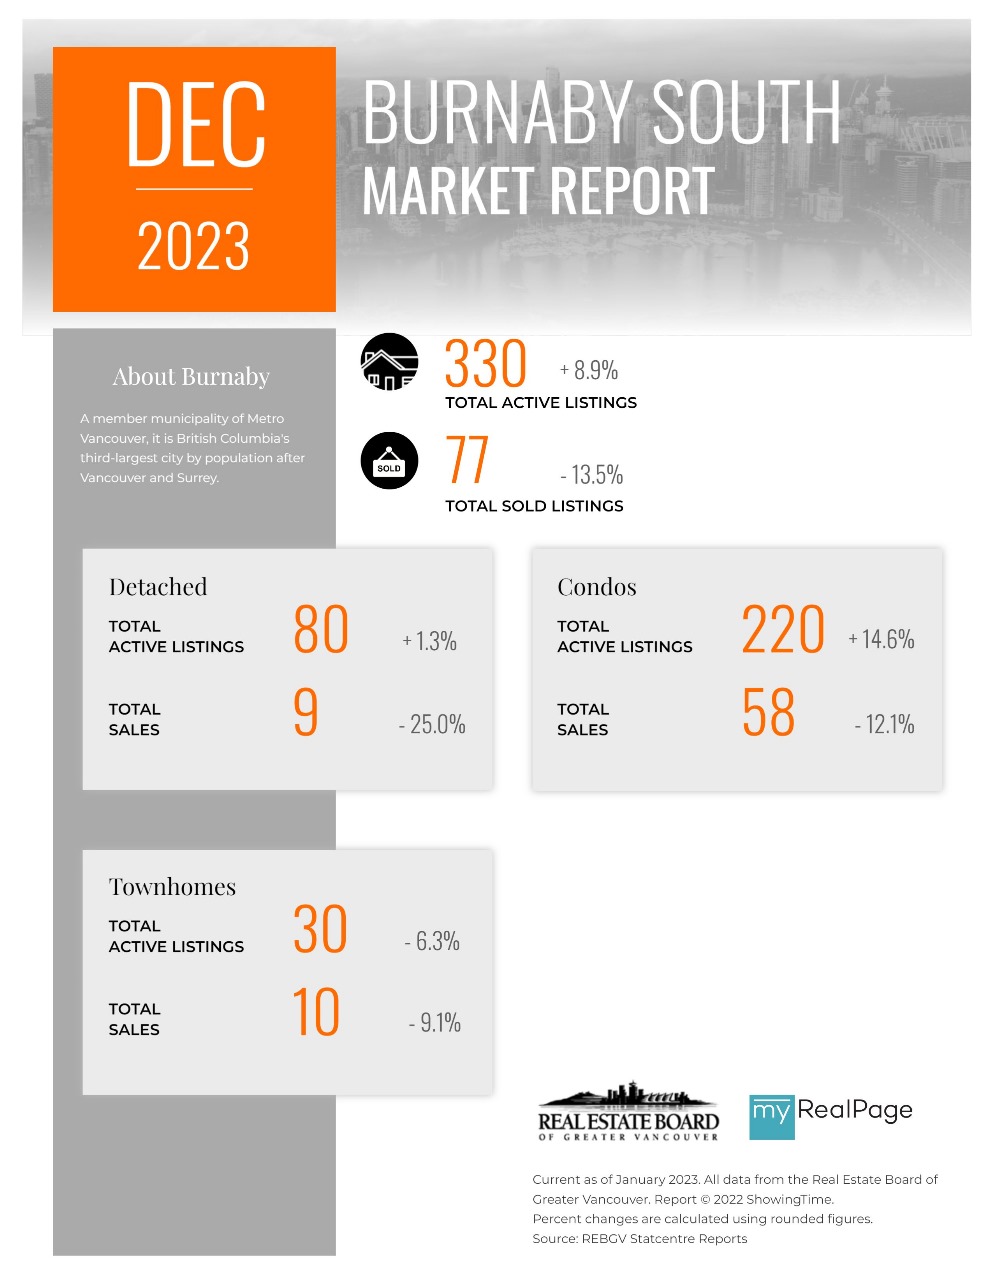
Printable Version – REBGV December 2023 Data Infographics Report Burnaby South
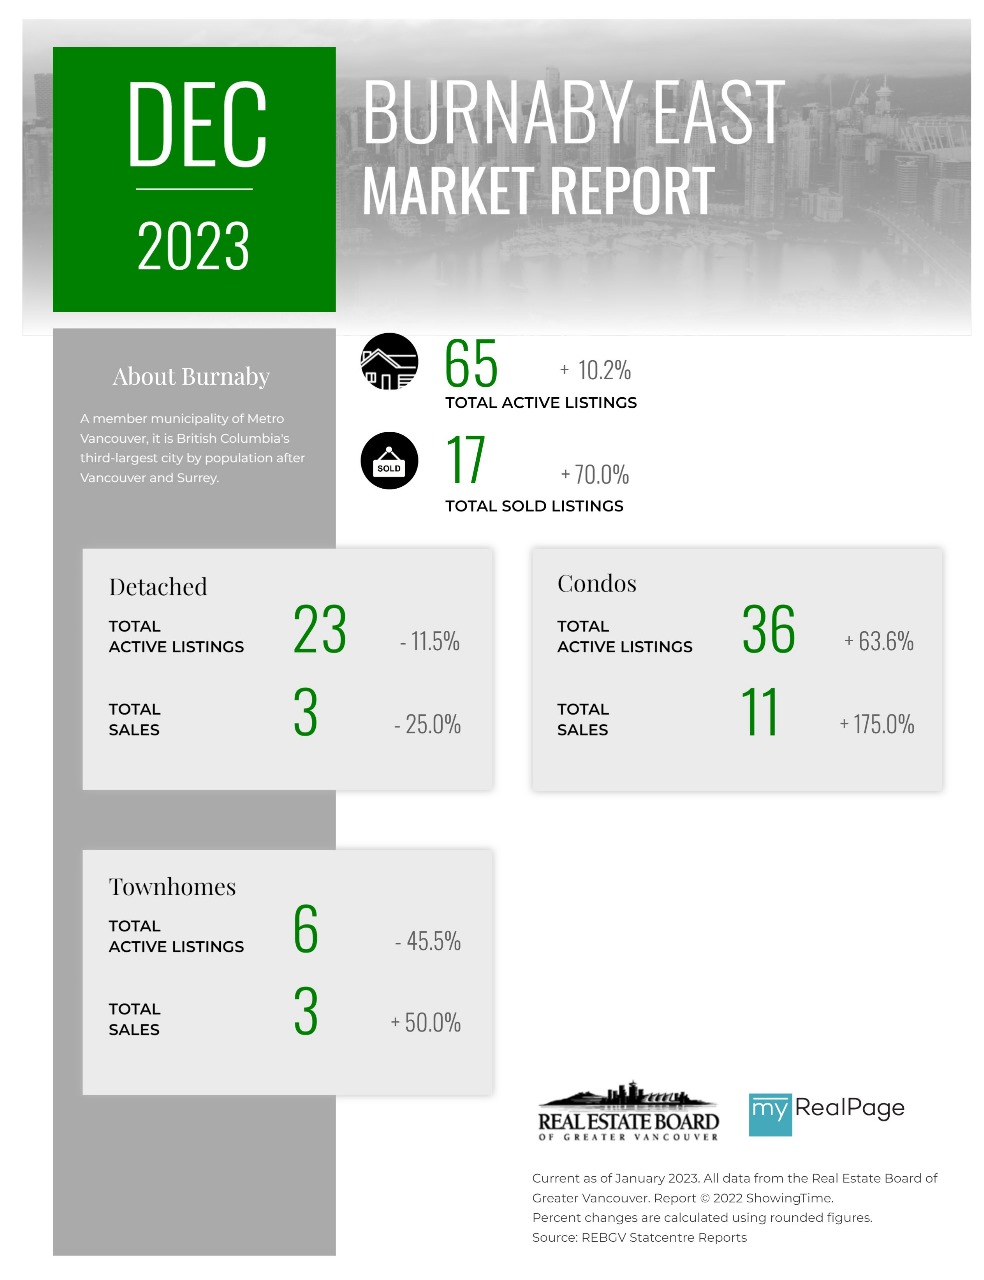
Printable Version – REBGV December 2023 Data Infographics Report Burnaby East
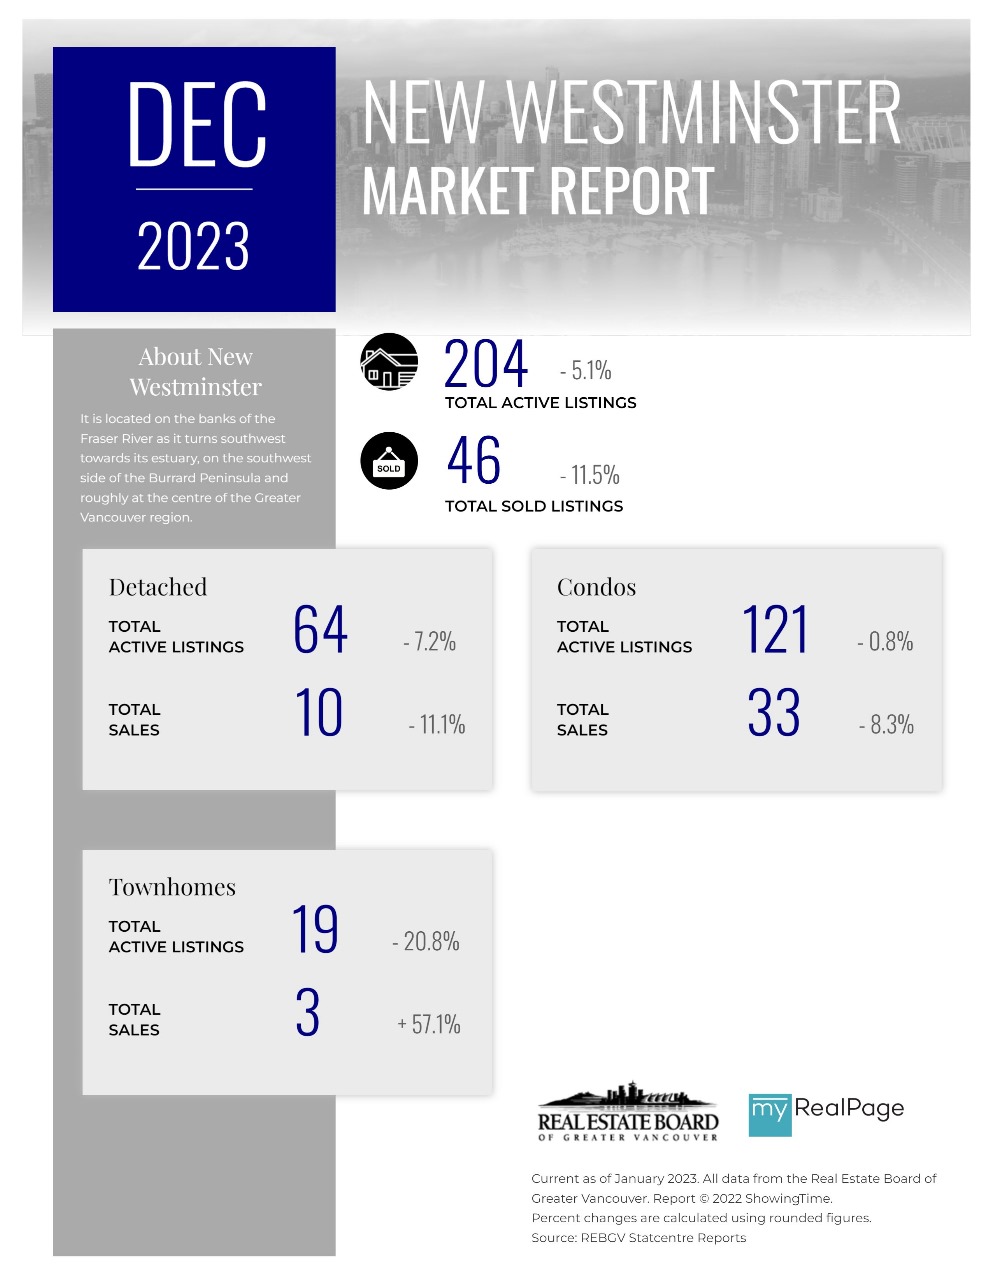
Printable Version – REBGV December 2023 Data Infographics Report New Westminster
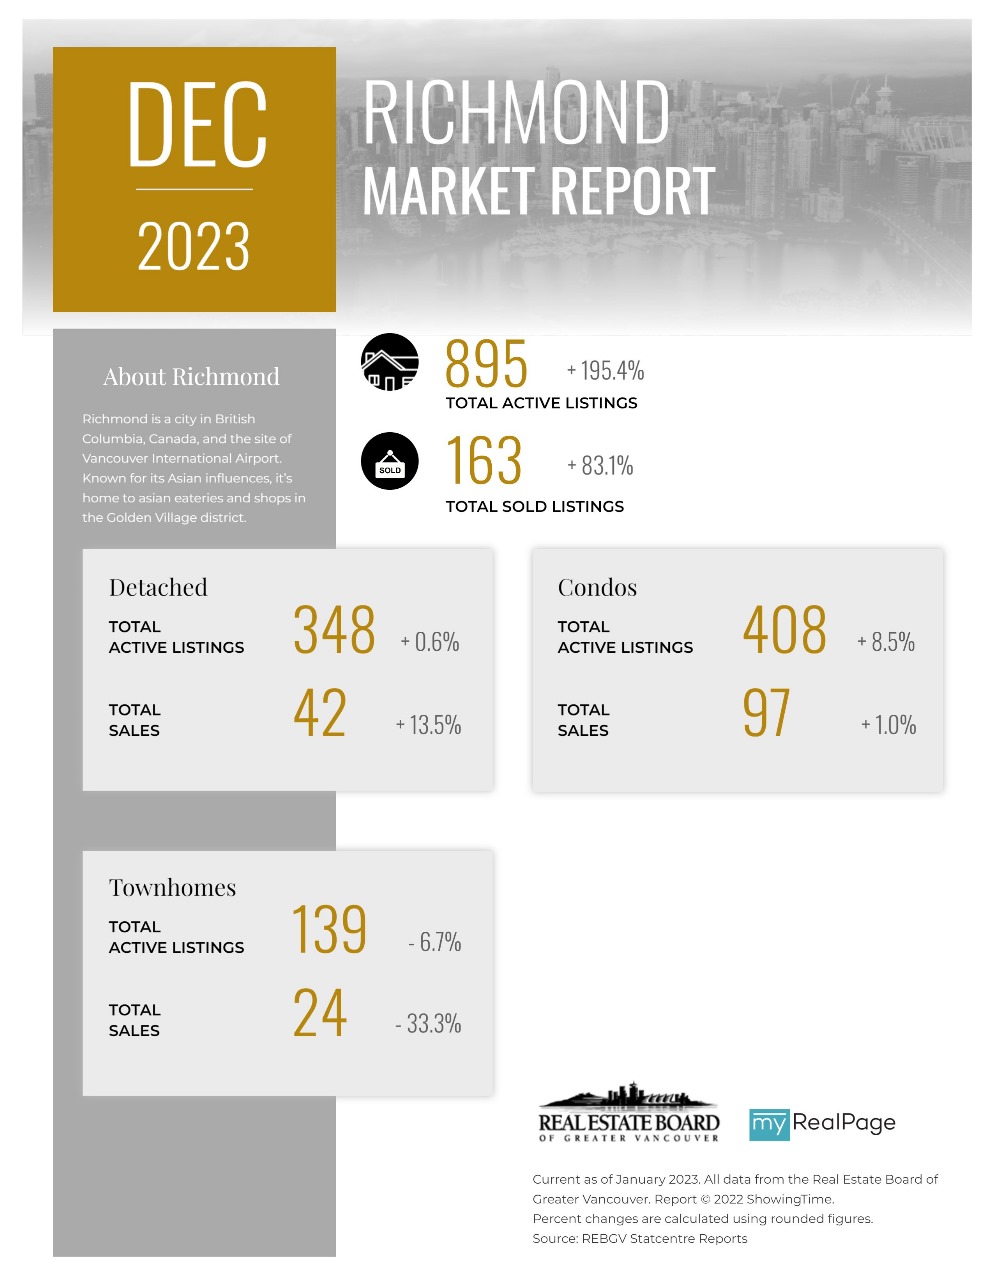
Printable Version – REBGV December 2023 Data Infographics Report Richmond

Last Updated on January 9, 2024 by myRealPage
