INFOGRAPHICS: April 2024 GVR Greater Vancouver Market Reports

Inventory reaches highest level since the pandemic summer of 2020
Actively listed homes for sale on the MLS® in Metro Vancouver continued climbing in April, up 42 per cent year-over-year, breaching the 12,000 mark, a number not seen in the region since the summer of 2020.
Greater Vancouver REALTORS® (GVR) reports that residential sales in the region totalled 2,831 in April 2024, a 3.3 per cent increase from the 2,741 sales recorded in April 2023. This was 12.2 per cent below the 10-year seasonal average (3,223).
“It’s a feat to see inventory finally climb above 12,000. Many were predicting higher inventory levels would materialize quickly when the Bank of Canada began its aggressive rate hikes, but we’re only seeing a steady climb in inventory in the more recent data. The surprise for many market watchers has been the continued strength of demand along with the fact few homeowners have been forced to sell in the face of the highest borrowing costs experienced in over a decade.” Andrew Lis, GVR director of economics and data analytics
Read the full report on the REBGV website!
The following data is a comparison between April 2024 and April 2023 numbers, and is current as of May 2024. For last month’s update, you can check out our previous post!
Or follow this link for all our GVR Infographics!
These infographics cover current trends in several areas within the Greater Vancouver region. Click on the images for a larger view!
Printable Version – GVR April 2024 Data Infographic Report North Vancouver
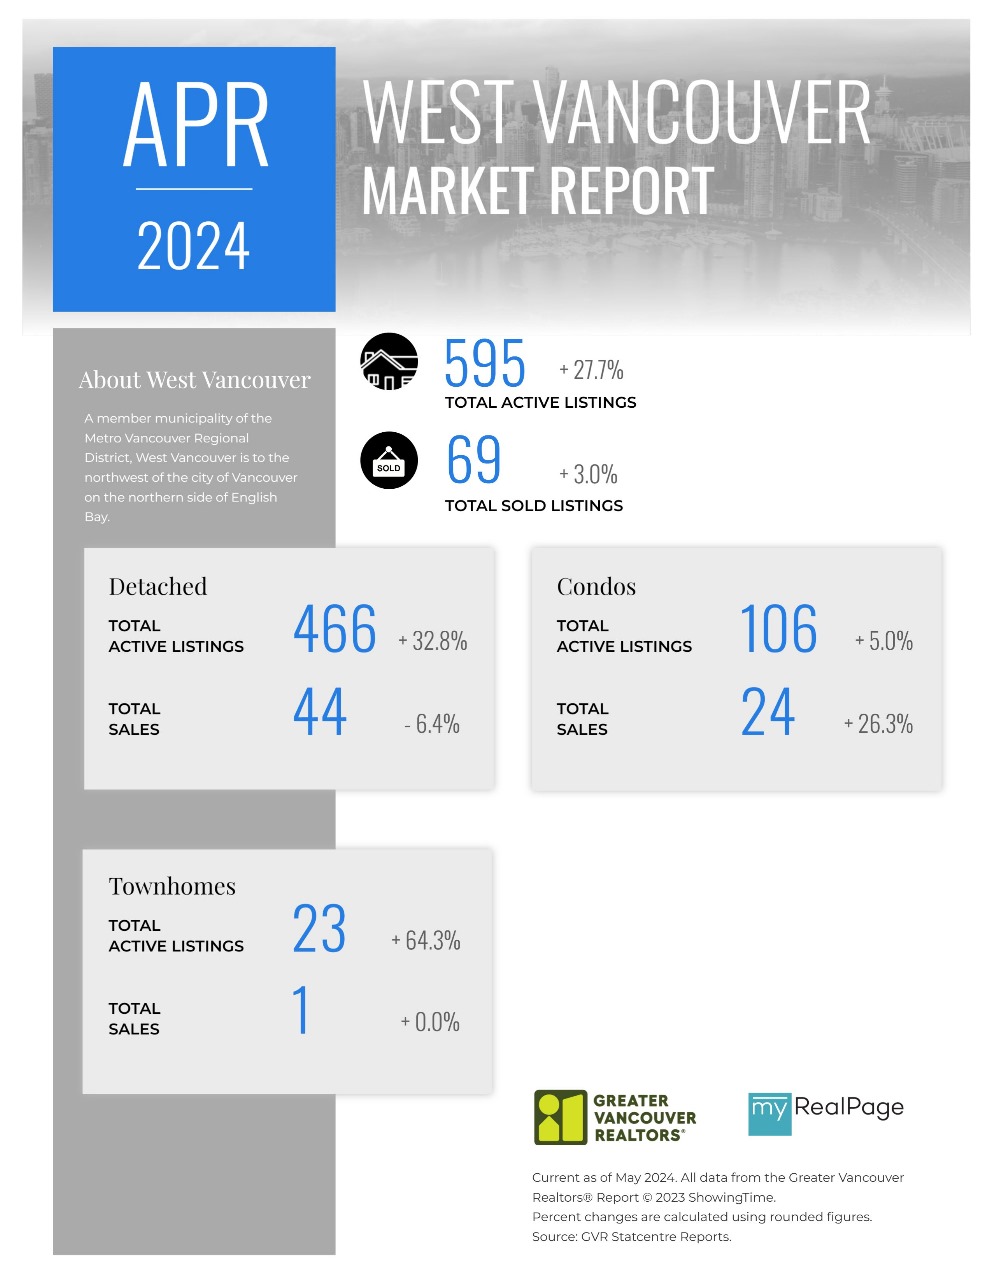
Printable Version – GVR April 2024 Data Infographics Report West Vancouver
Printable Version – GVR April 2024 Data Infographics Report Vancouver West
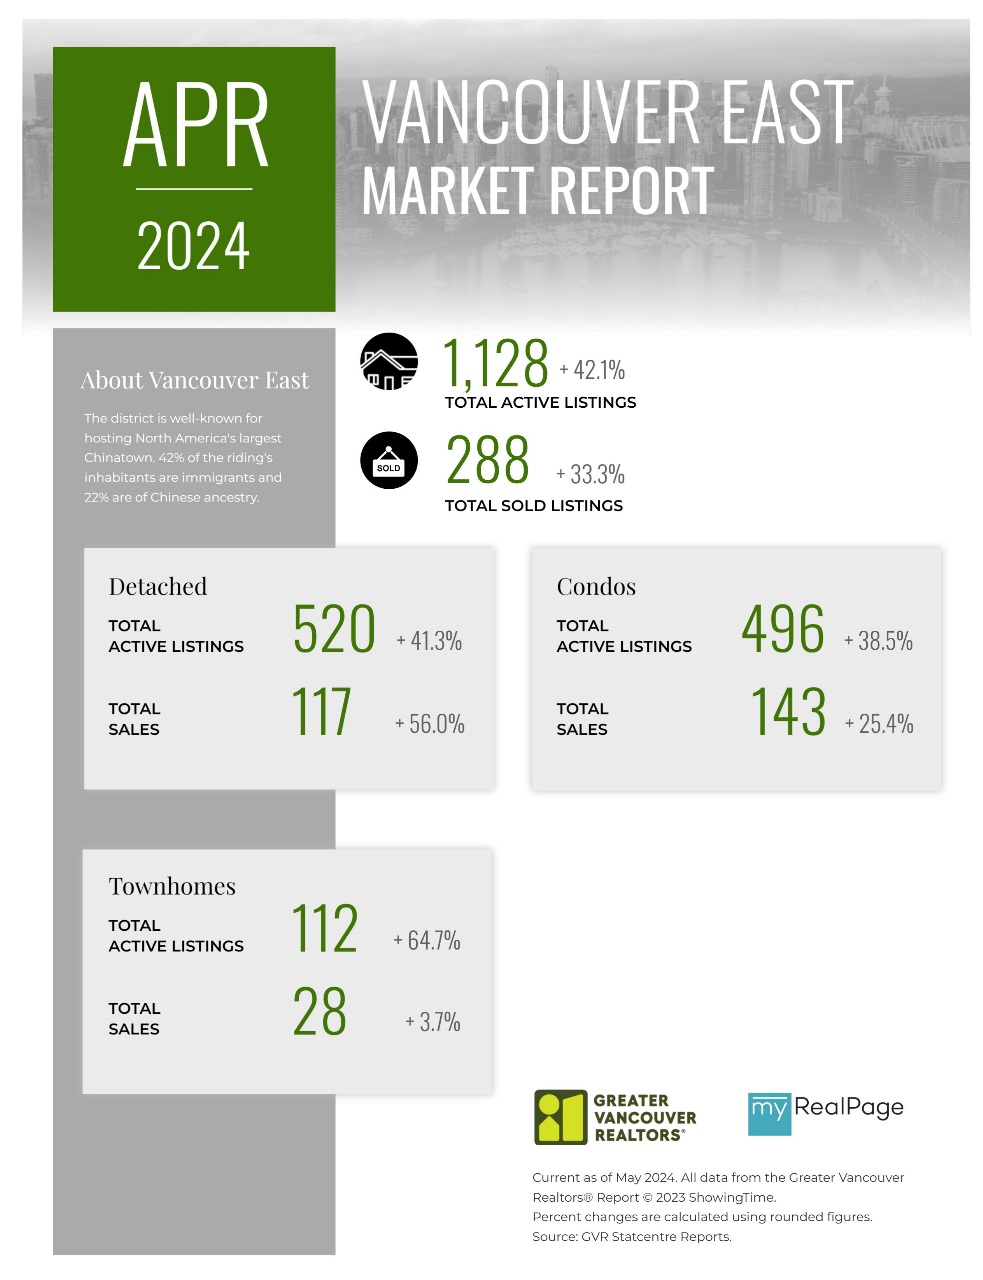
Printable Version – GVR April 2024 Data Infographics Report Vancouver East
Printable Version – GVR April 2024 Data Infographic Report Maple Ridge
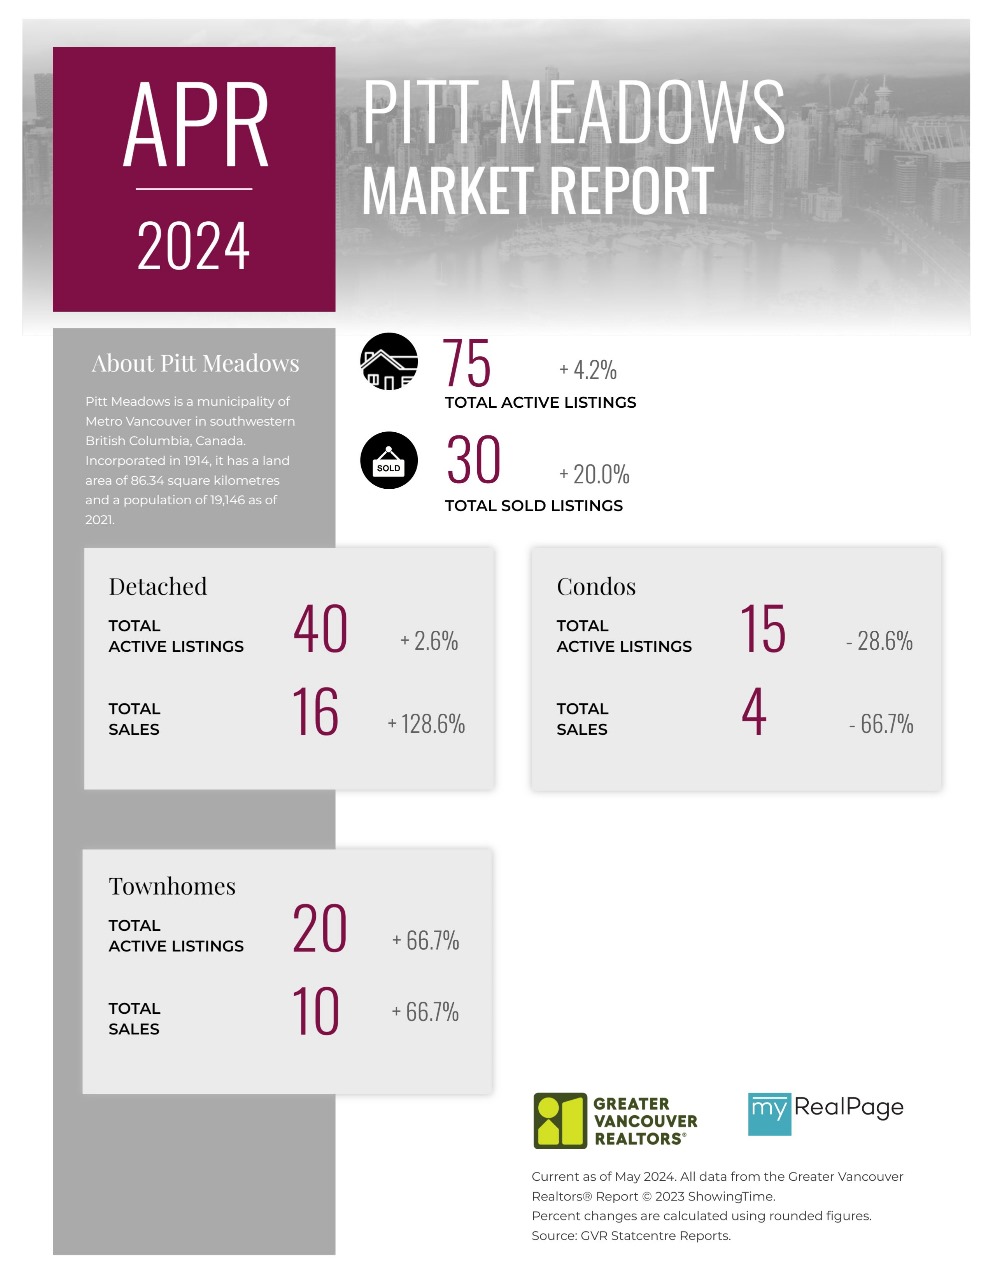
Printable Version – GVR April 2024 Data Infographics Report Pitt Meadows
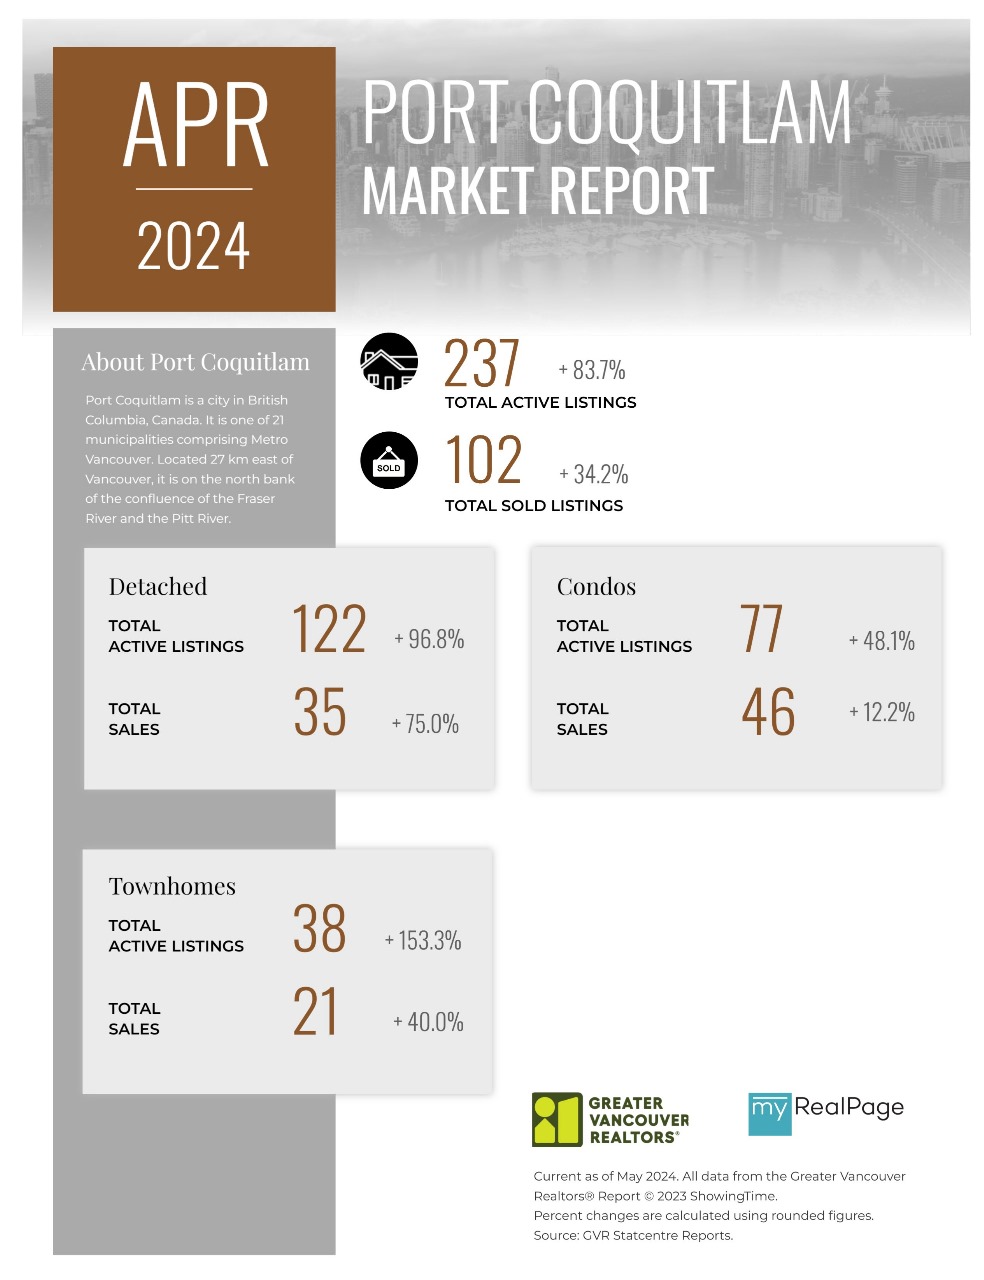
Printable Version – GVR April 2024 Data Infographics Report Port Coquitlam
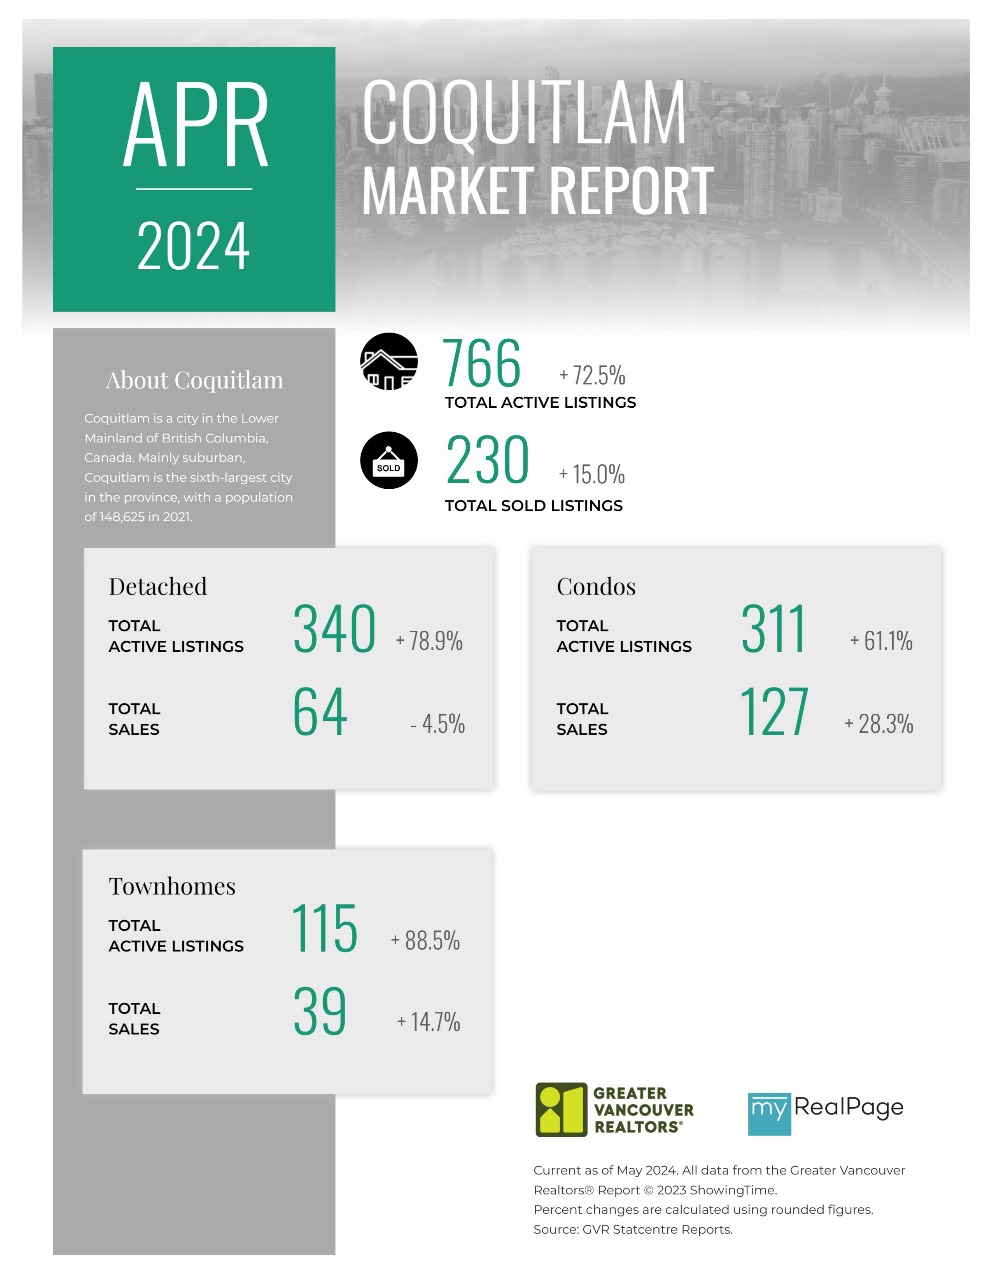
Printable Version – GVR April 2024 Data Infographics Report Coquitlam
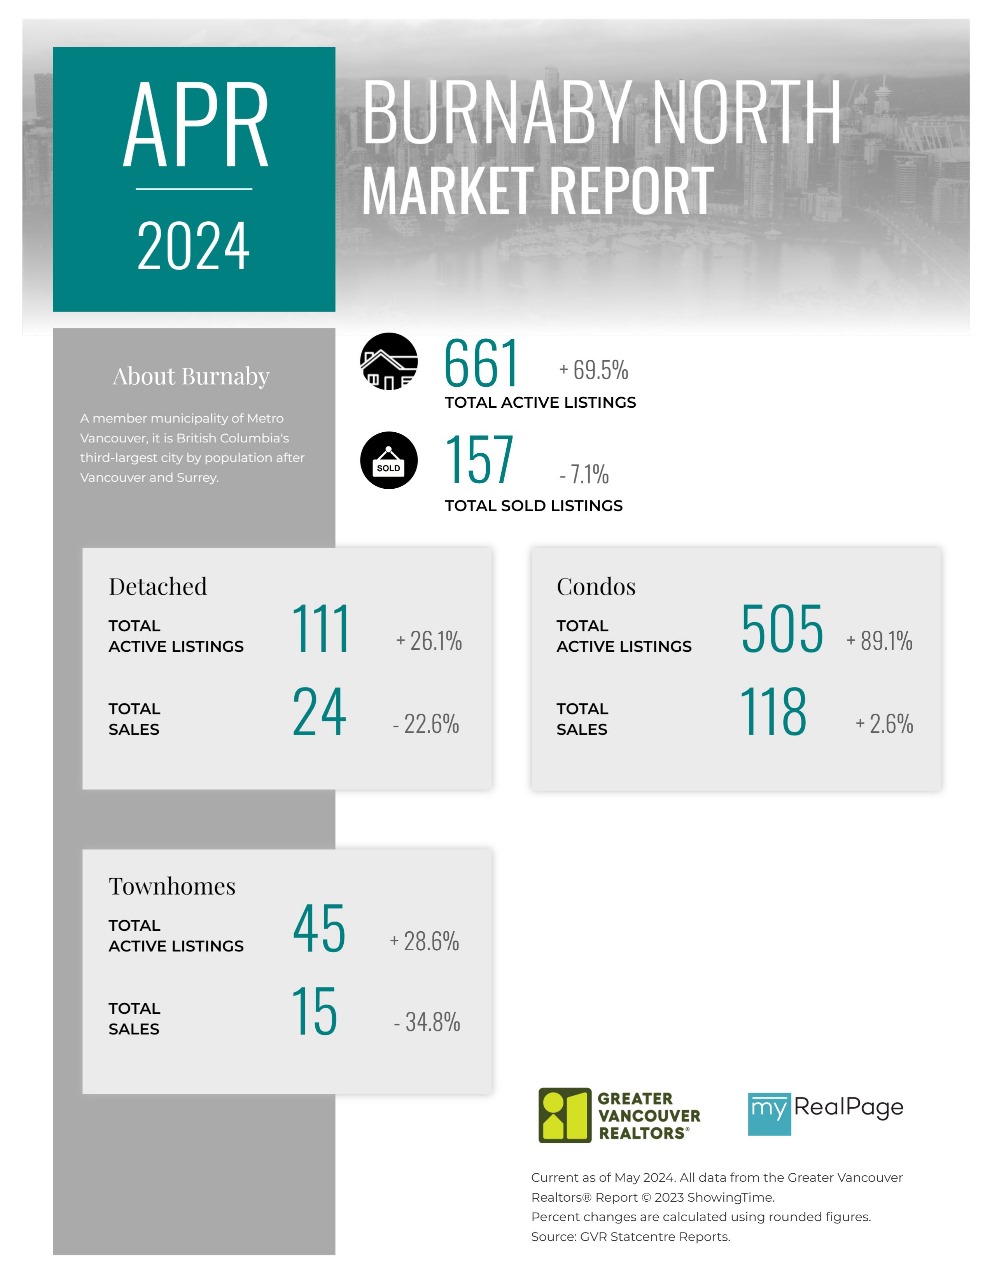
Printable Version – GVR April 2024 Data Infographic Report Burnaby North
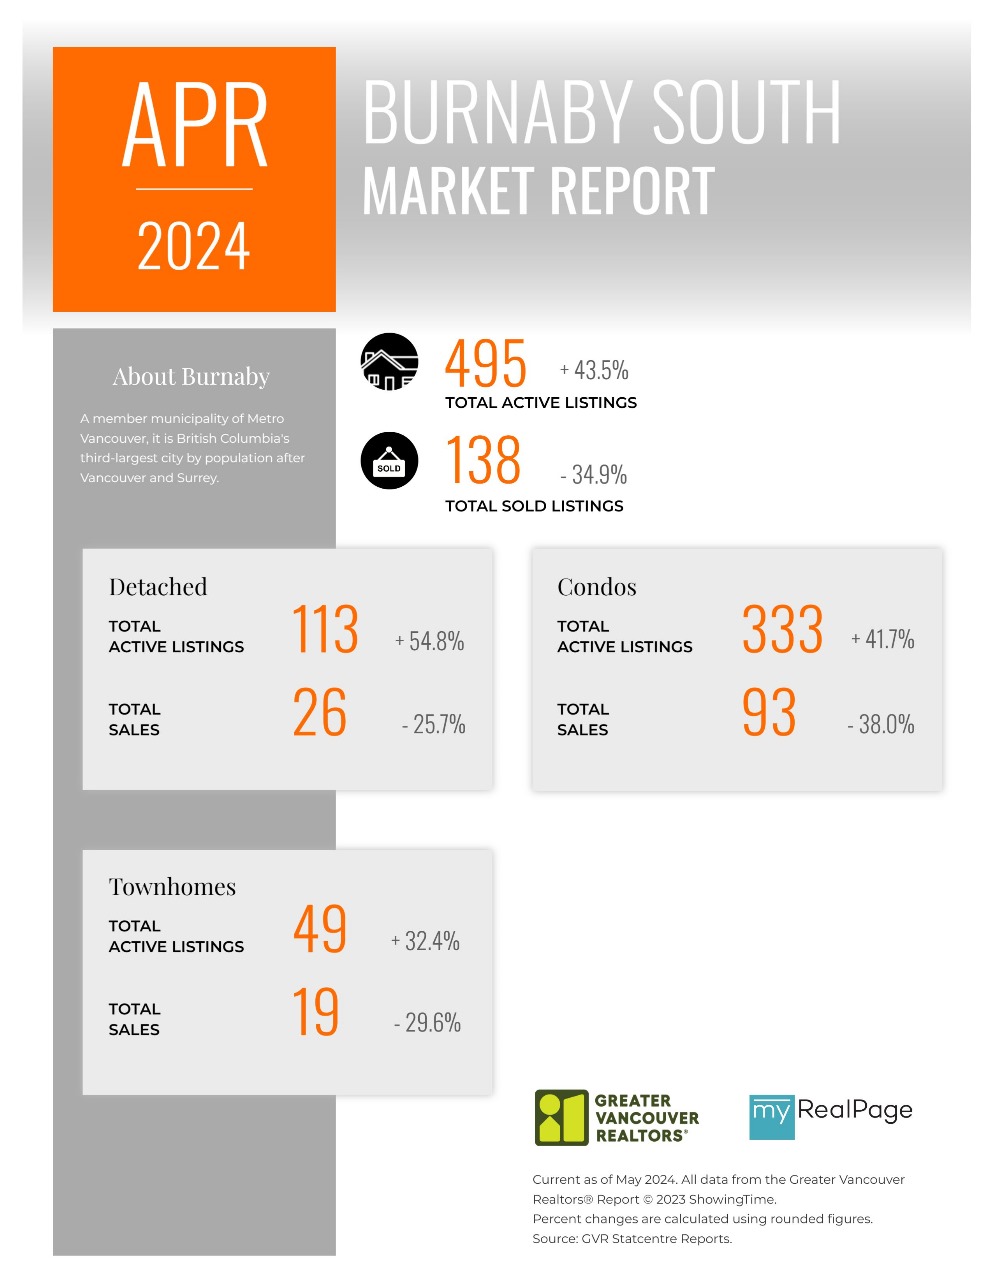
Printable Version – GVR April 2024 Data Infographics Report Burnaby South
Printable Version – GVR April 2024 Data Infographics Report Burnaby East
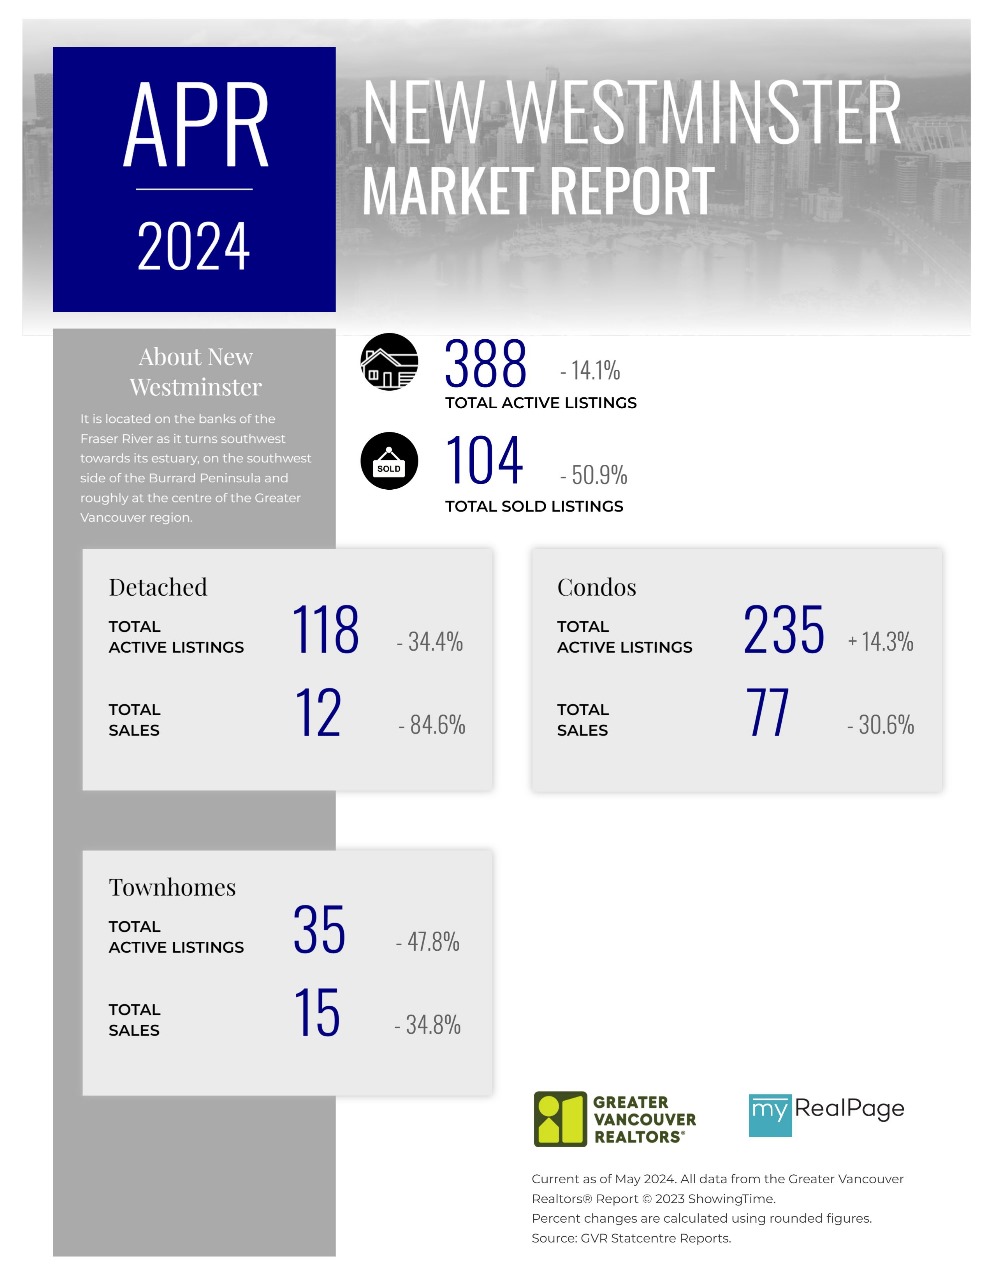
Printable Version – GVR April 2024 Data Infographics Report New Westminster
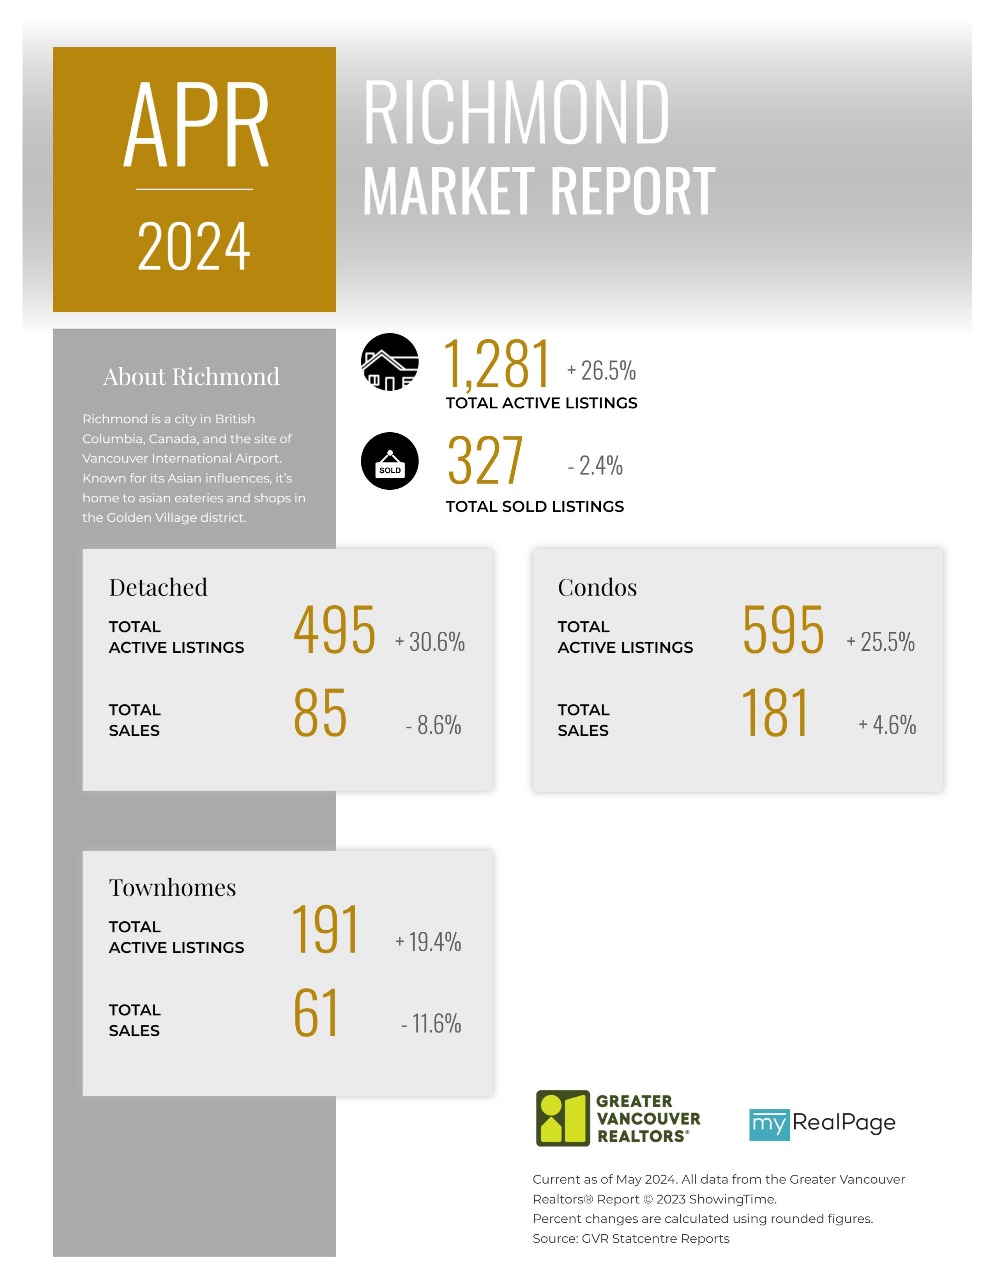
Printable Version – GVR April 2024 Data Infographics Report Richmond
Printable Version – GVR April 2024 Data Infographics Report Squamish


Last Updated on June 10, 2024 by myRealPage
