INFOGRAPHICS: March 2025 GVR Greater Vancouver Market Reports

A market made for buyers is missing buyers
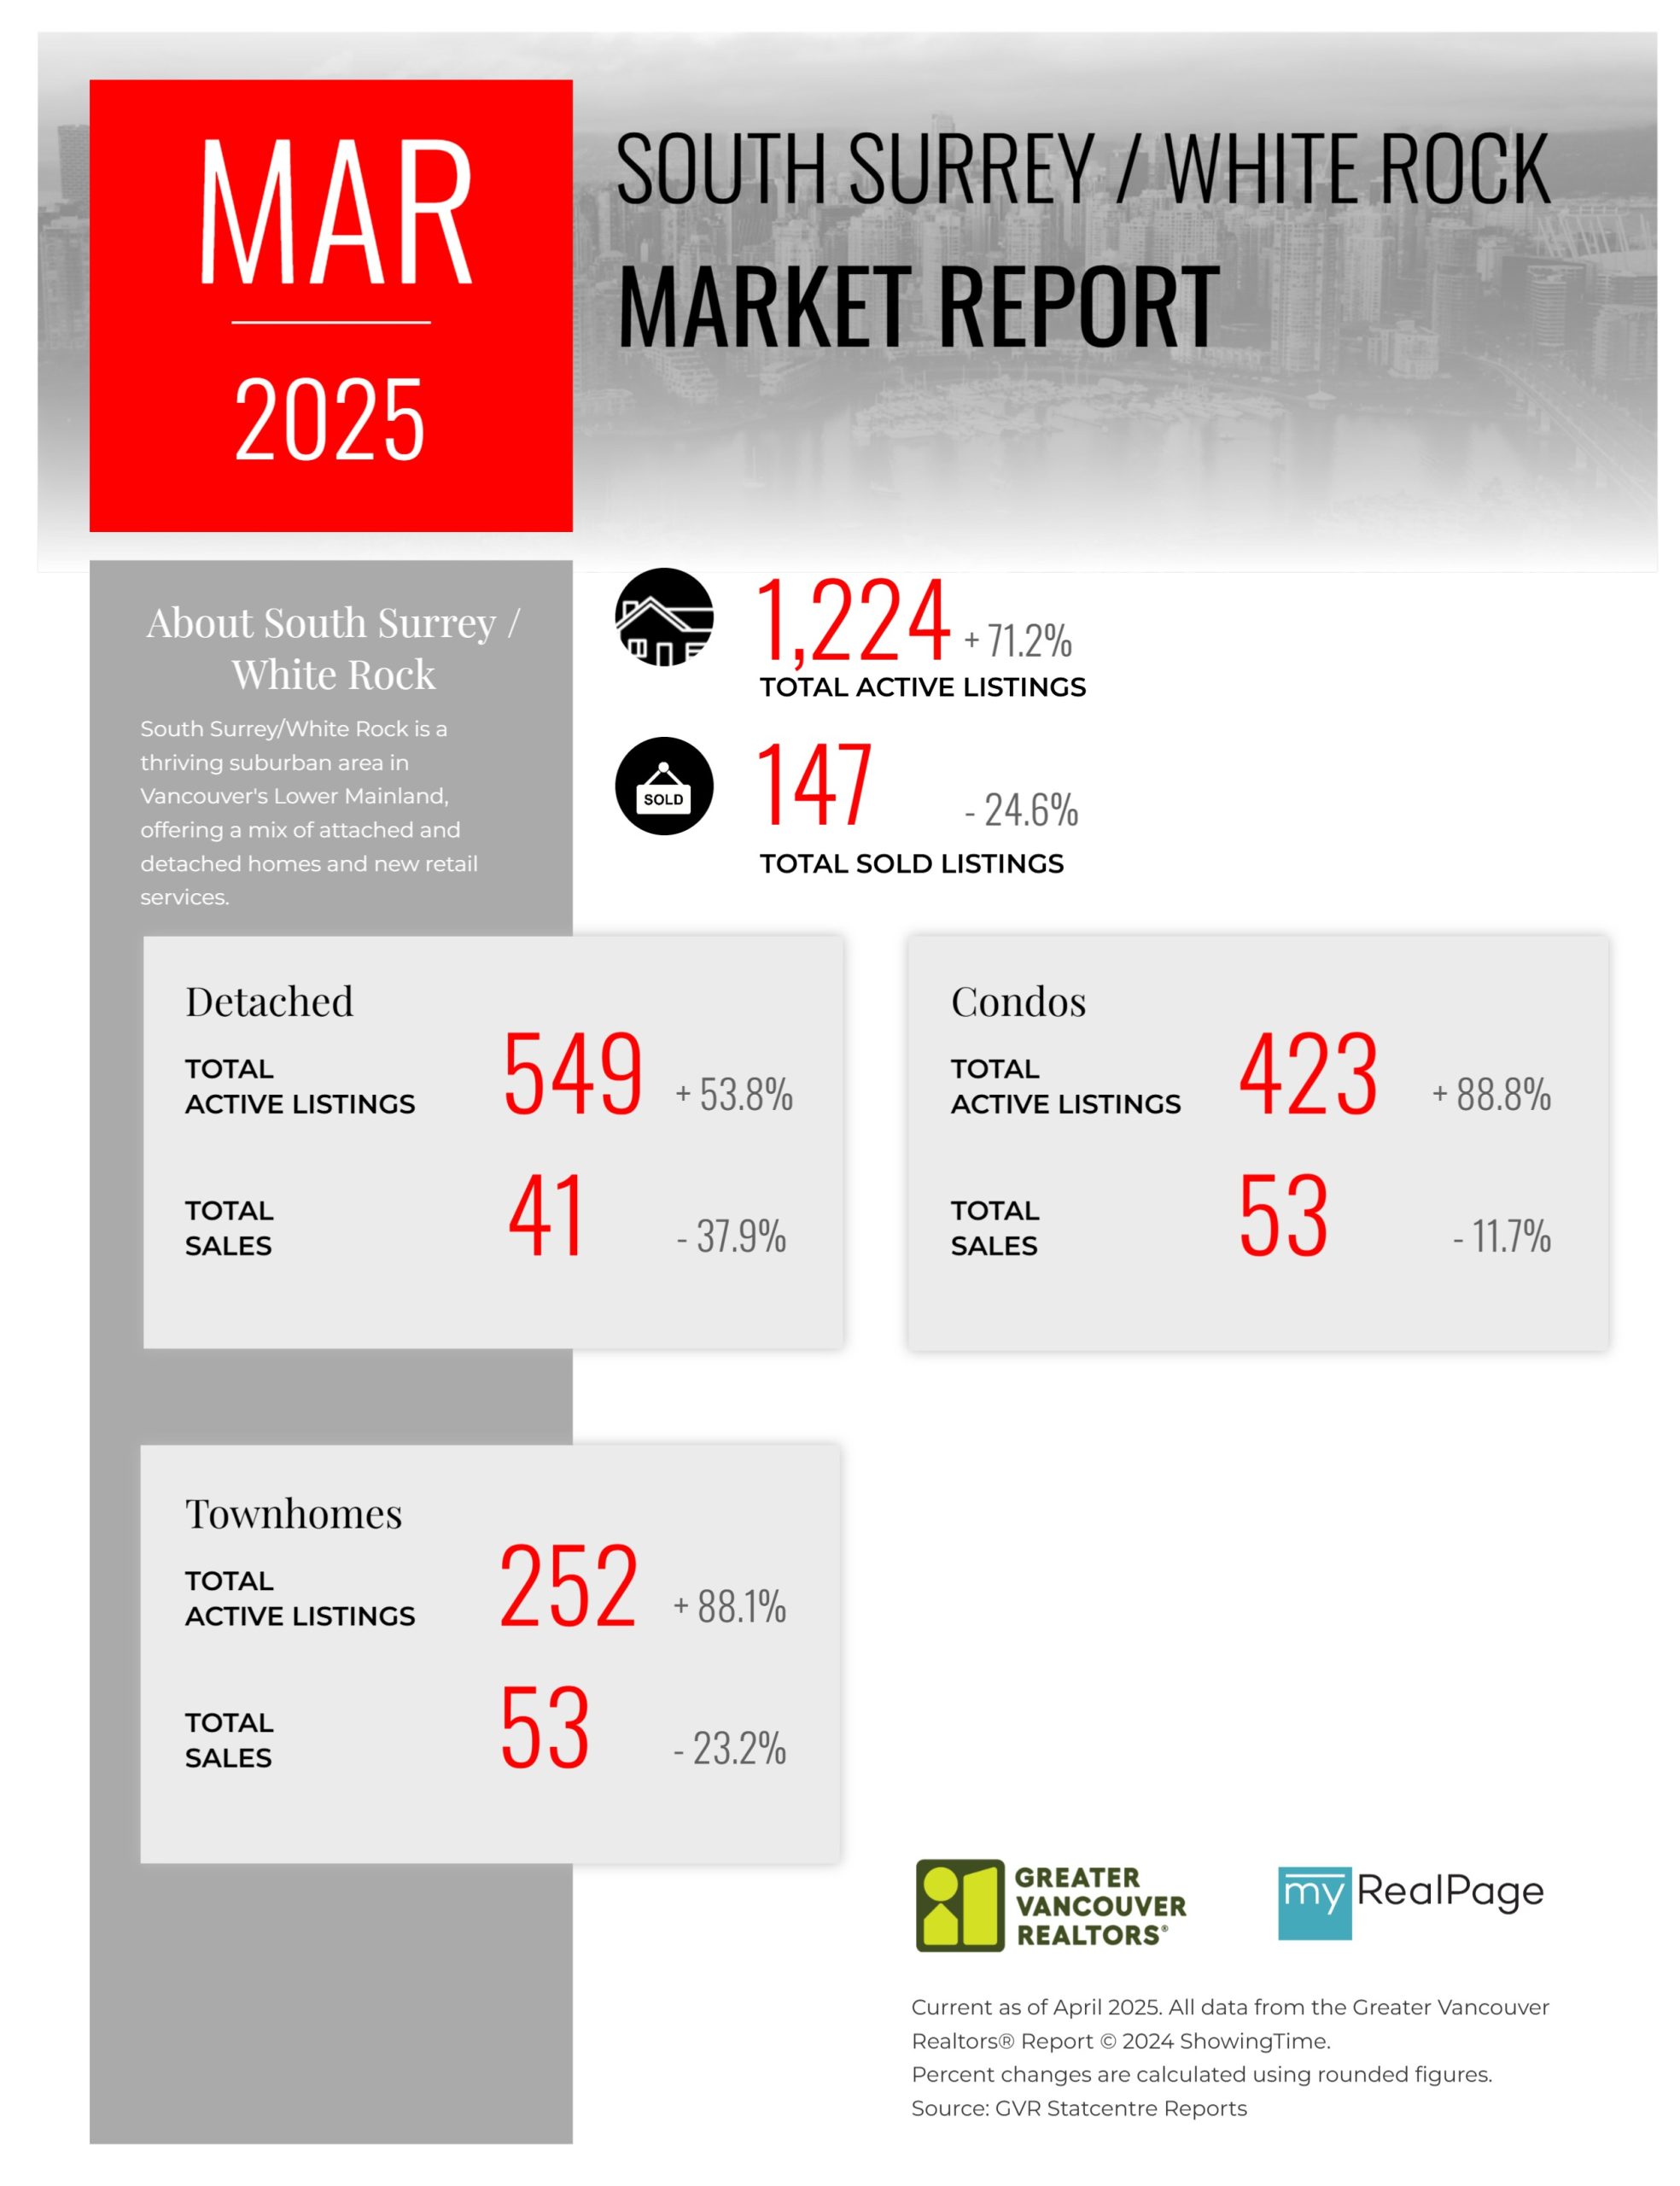
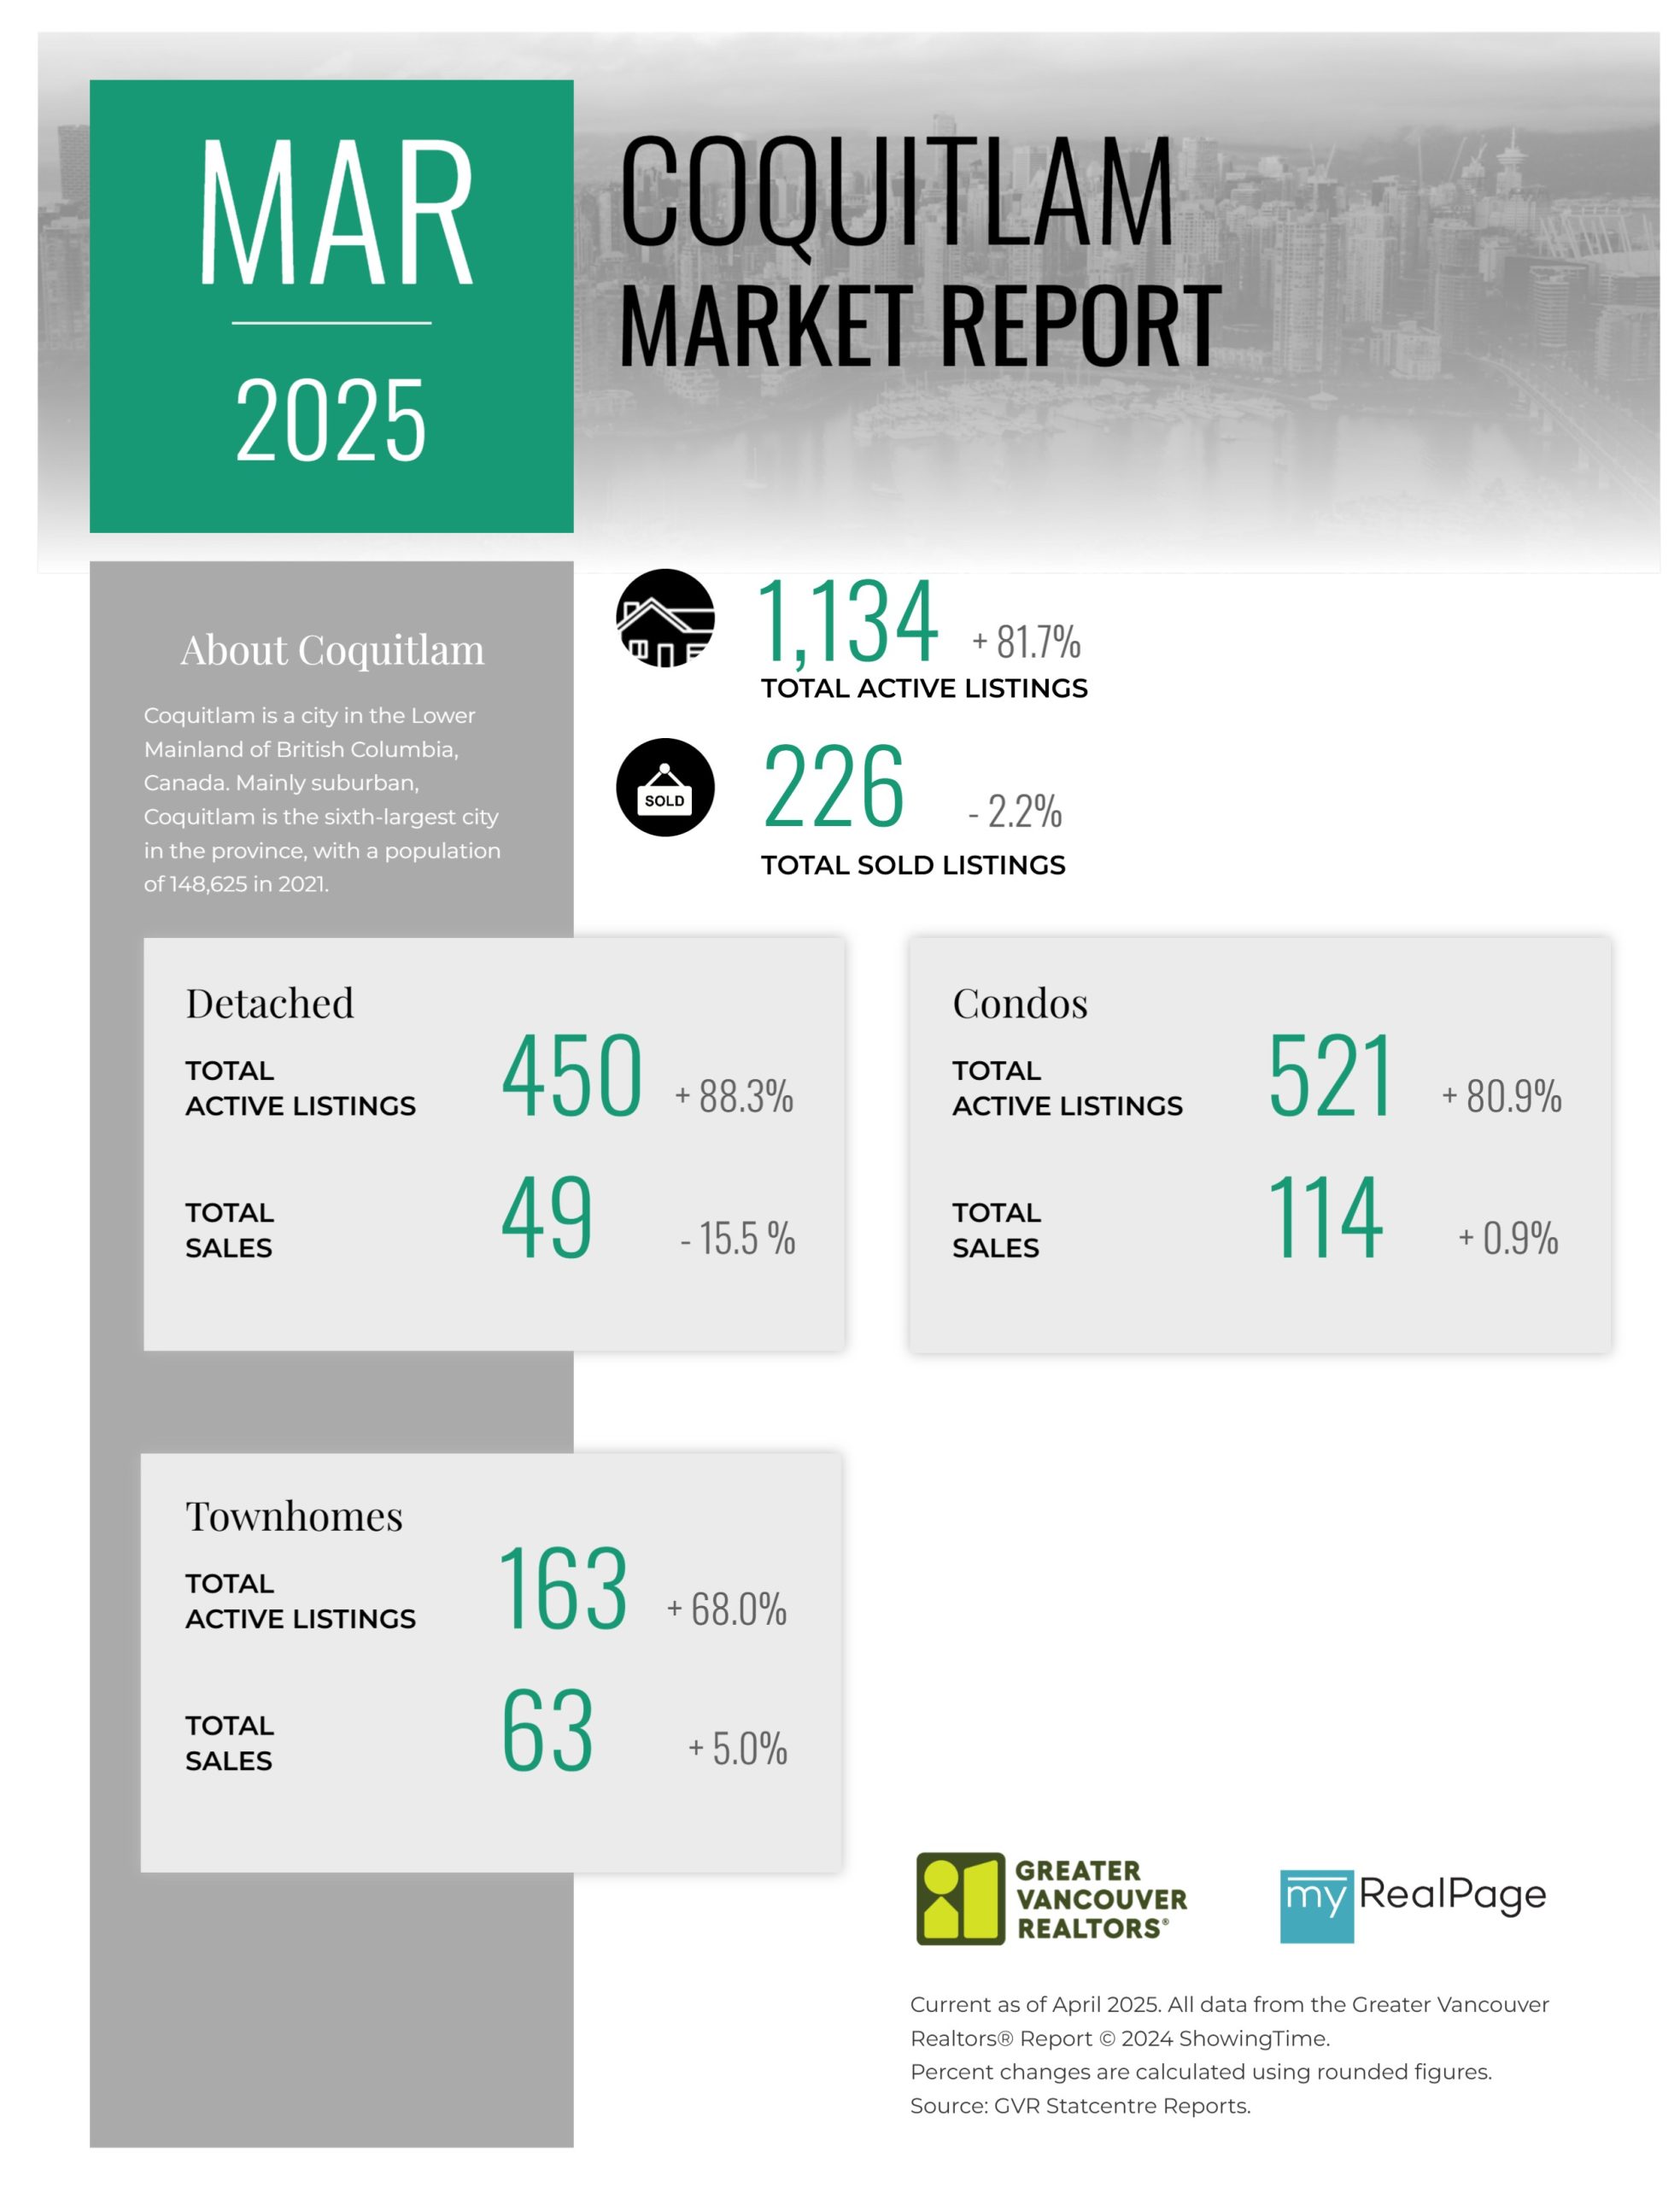
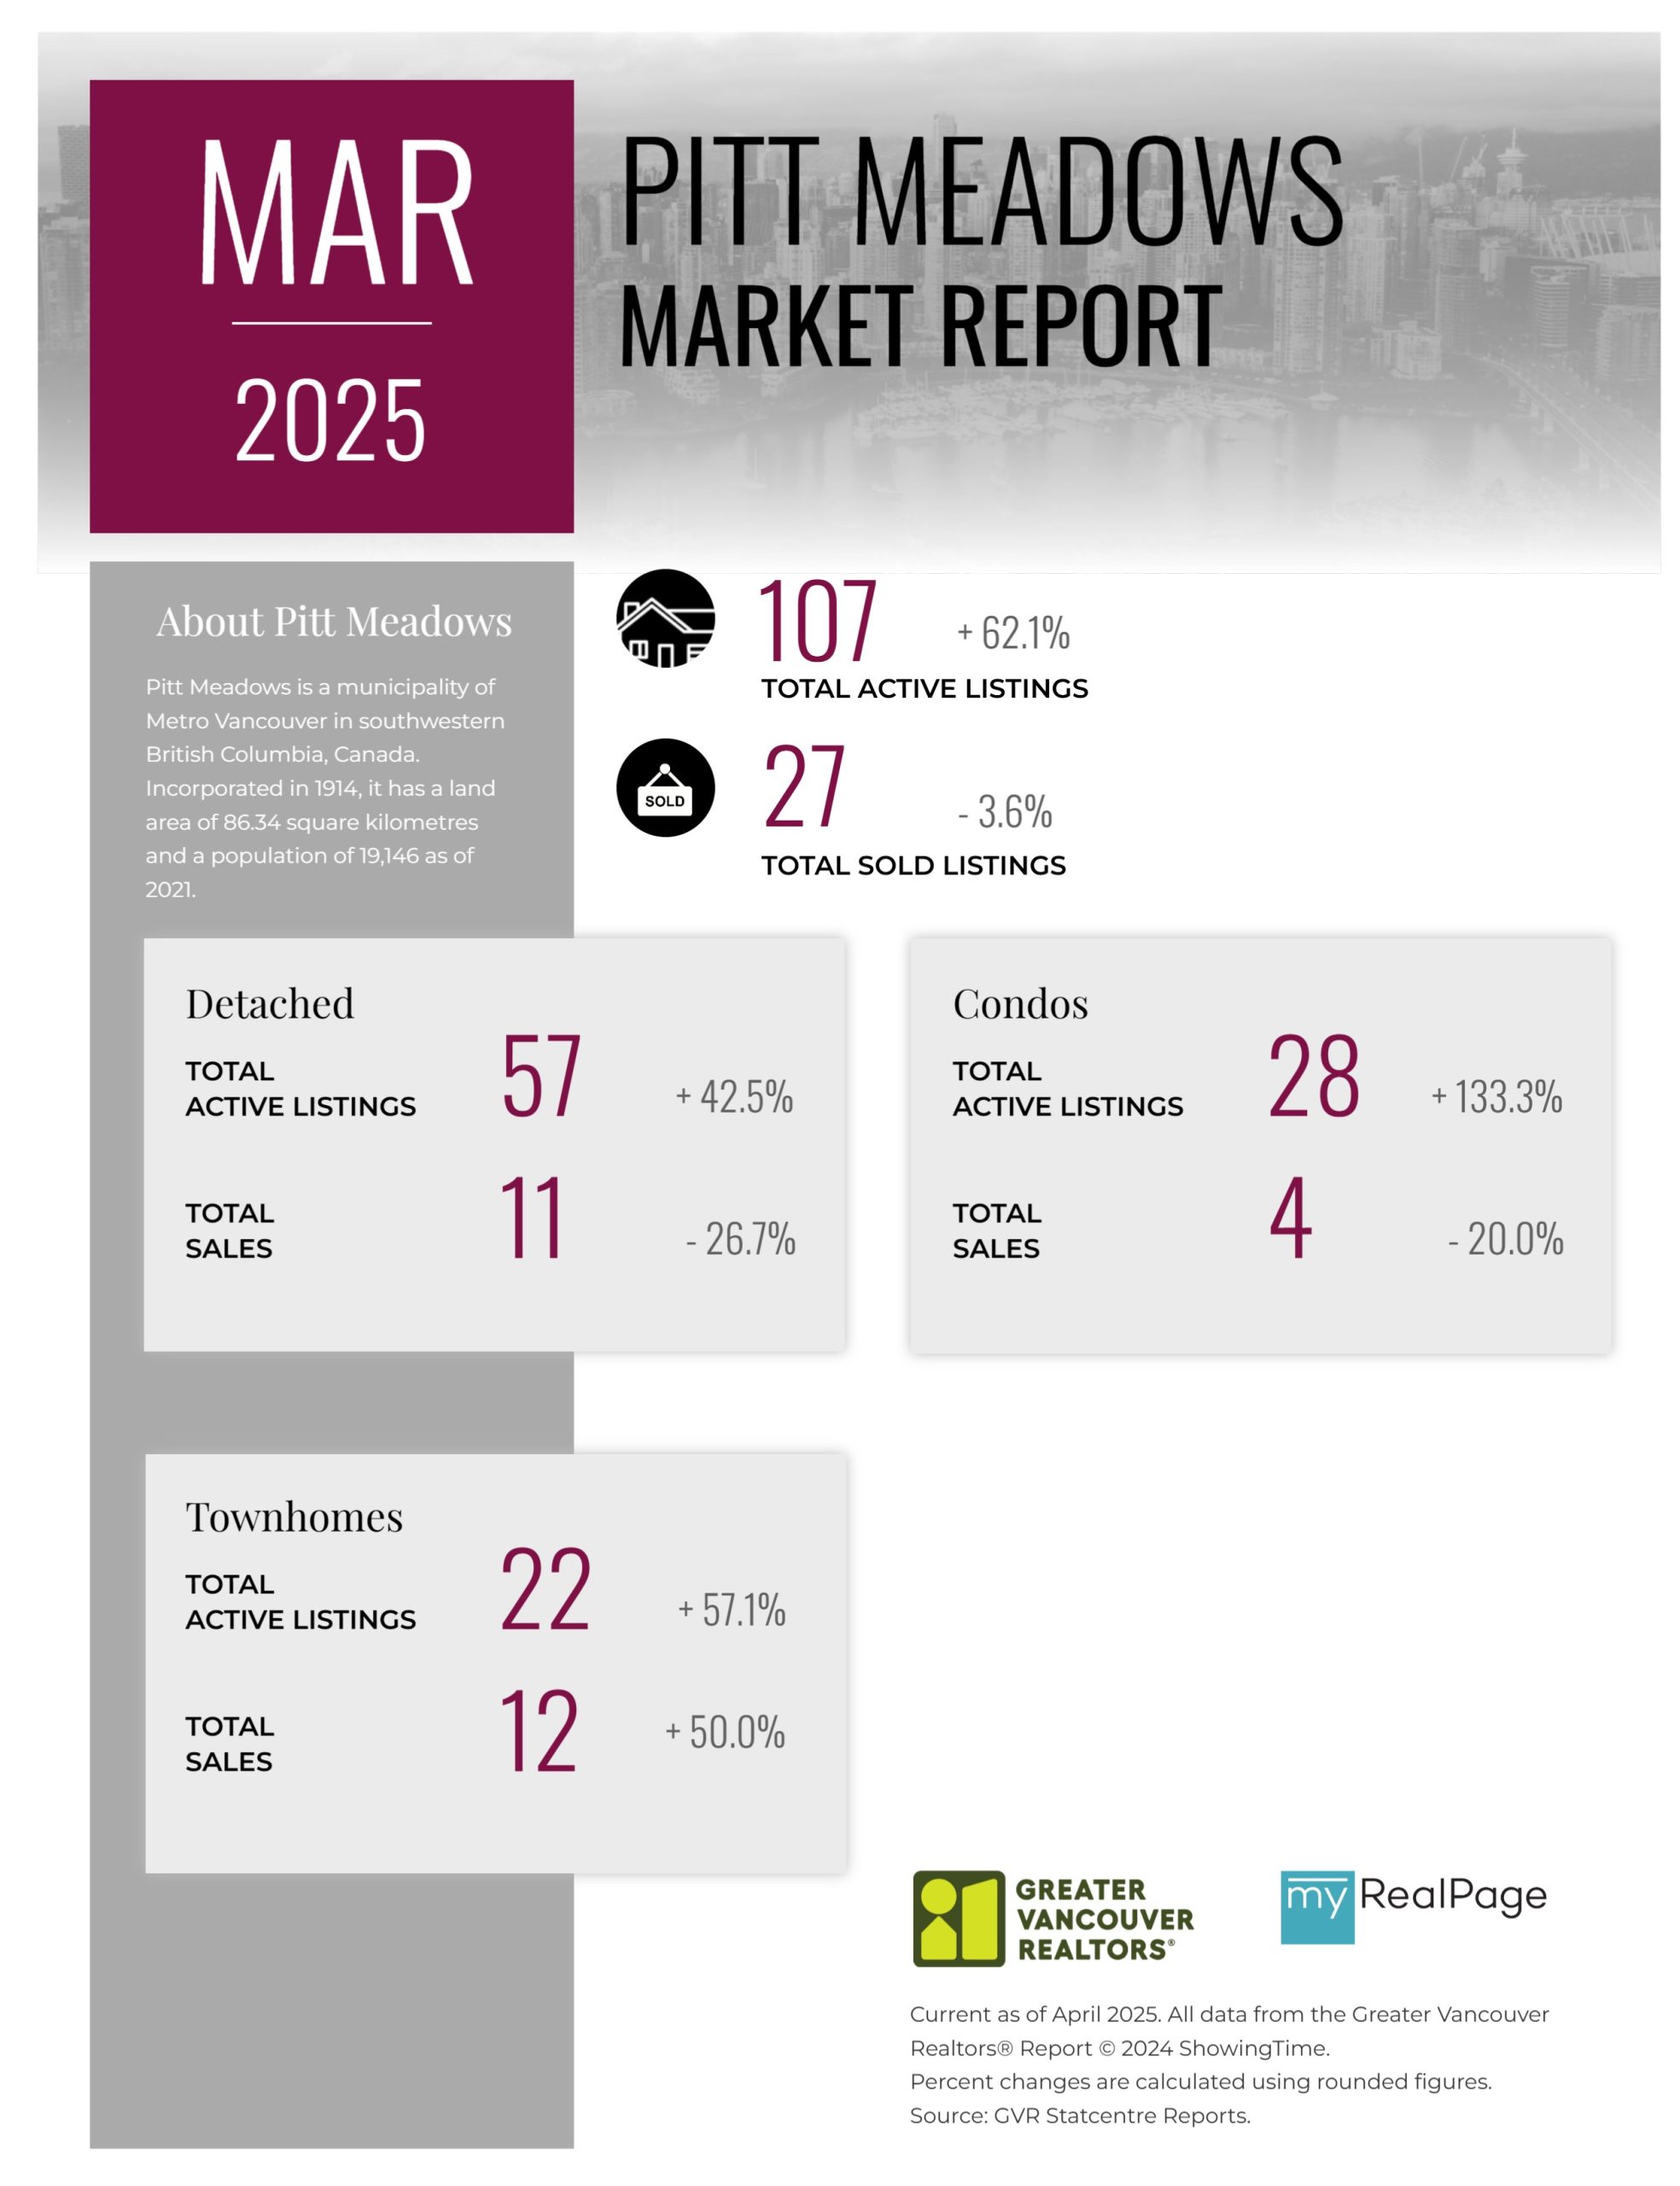
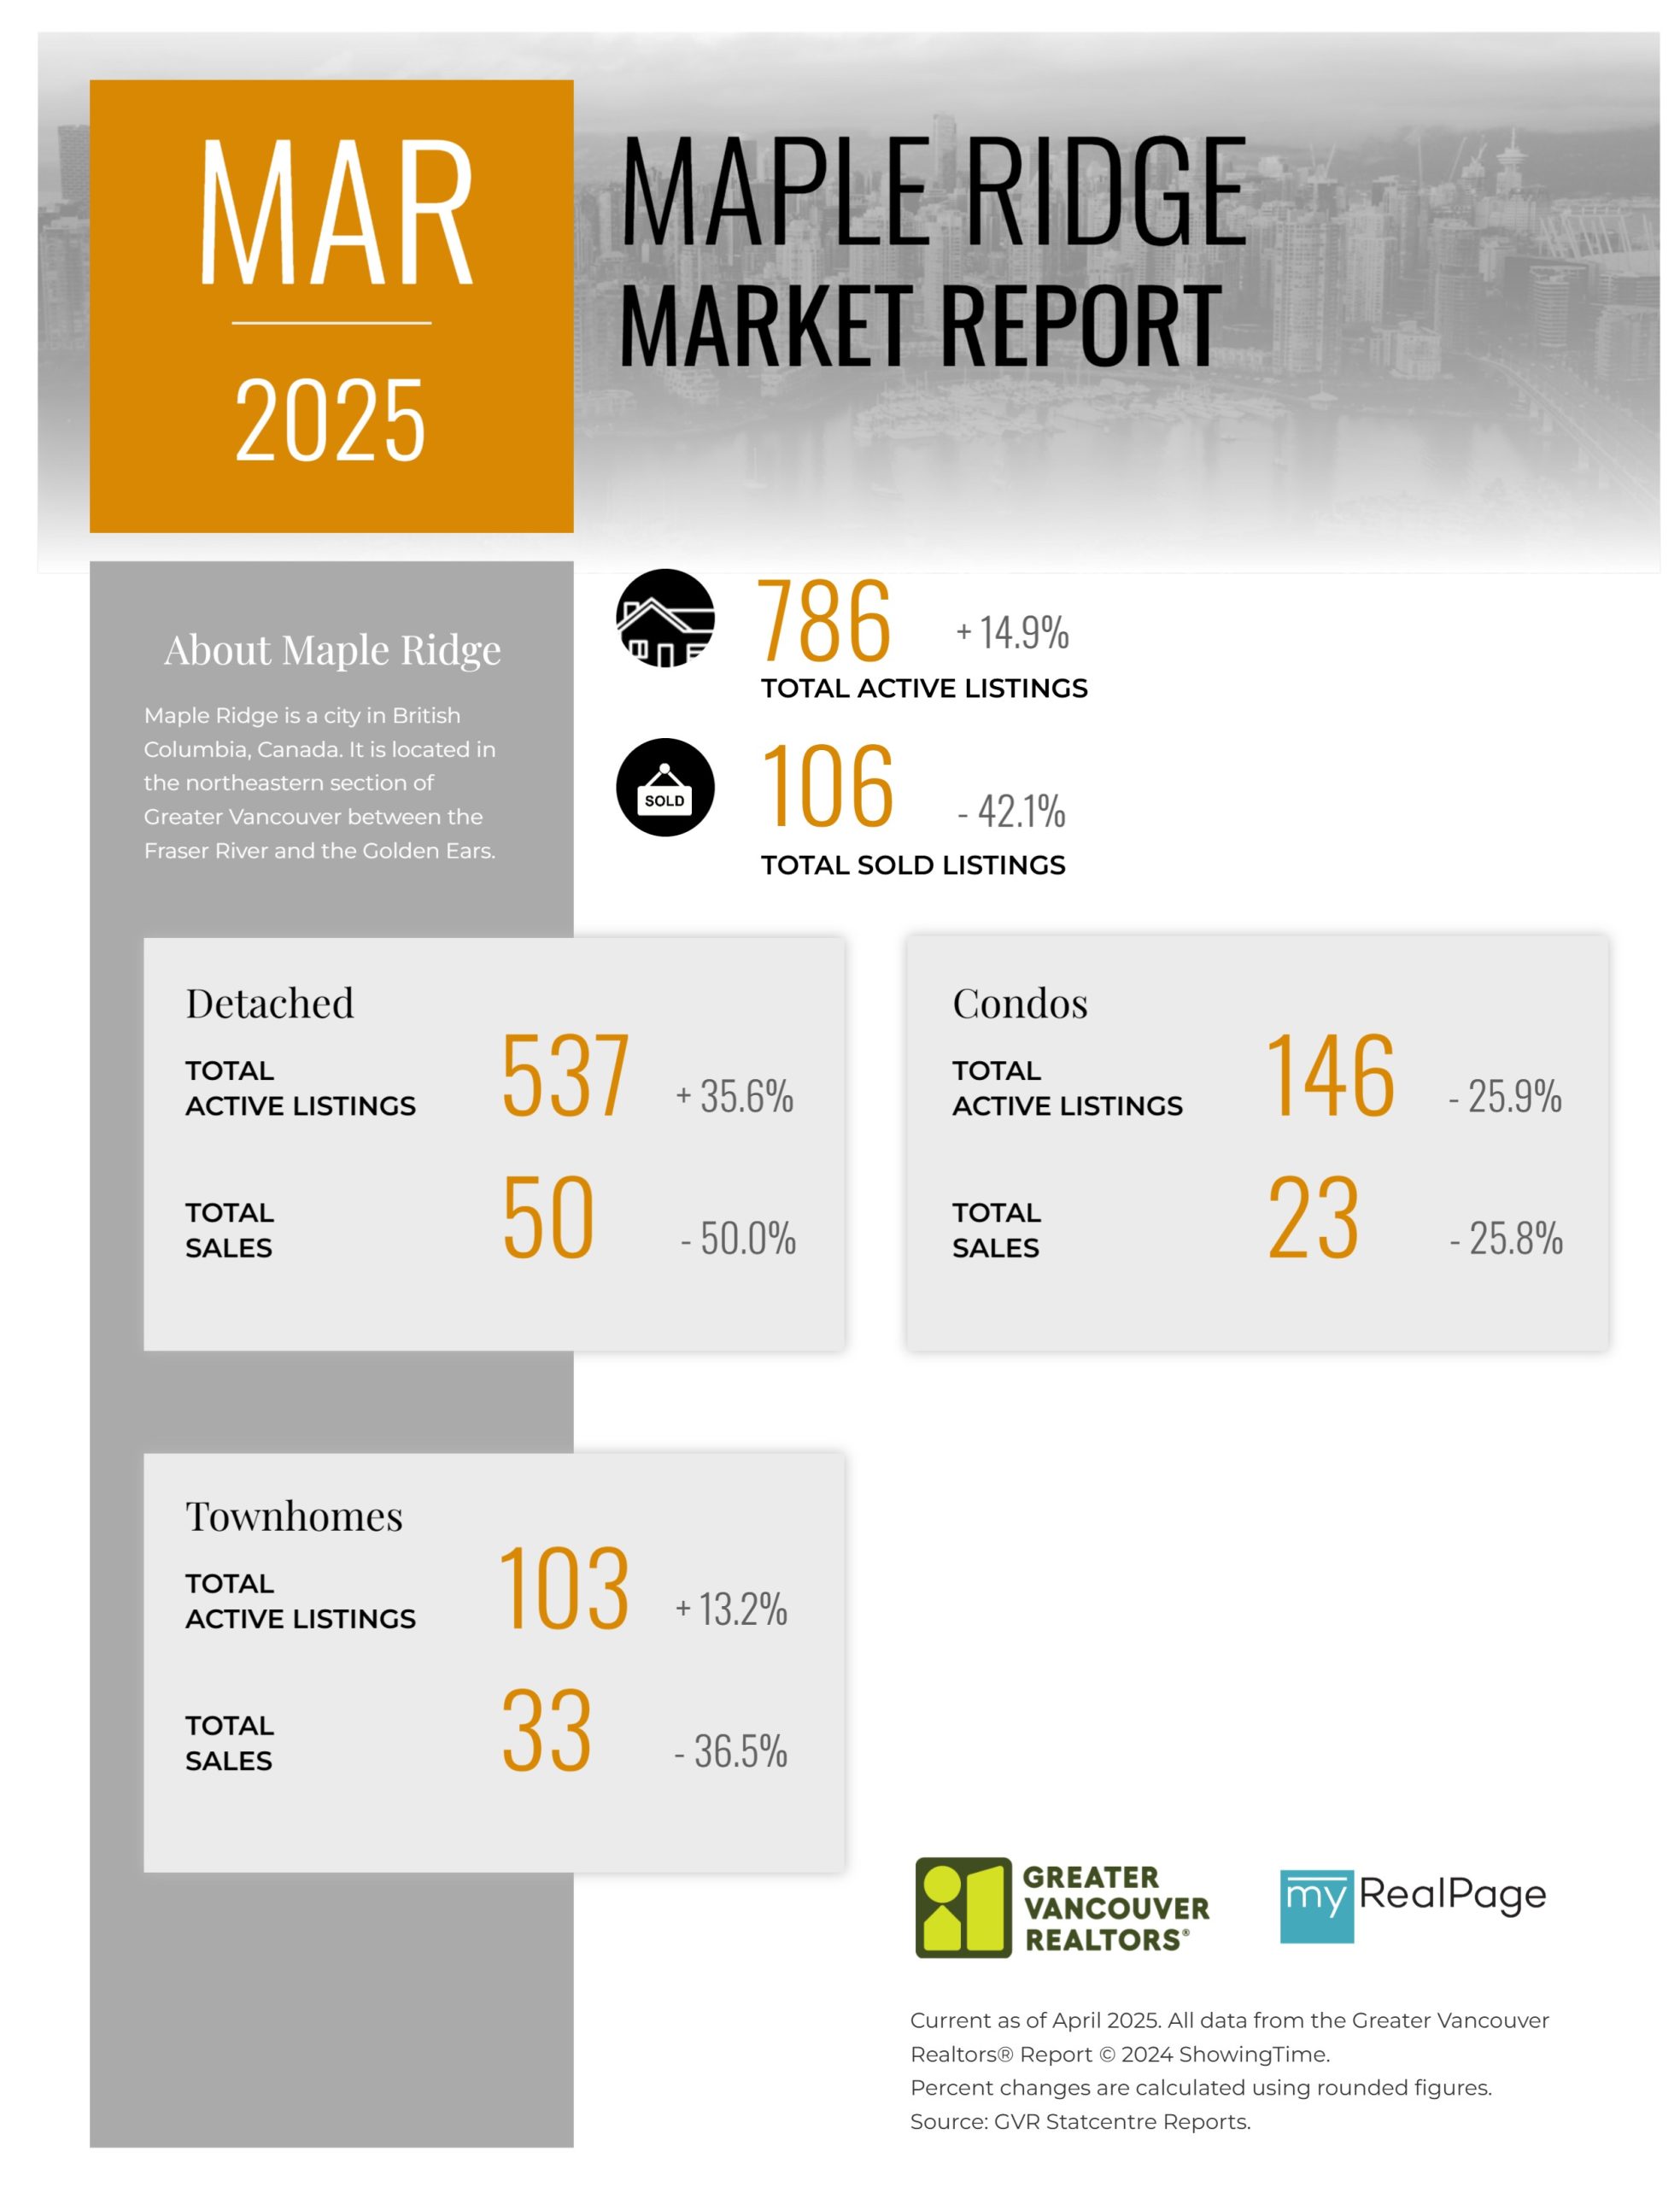
Home sales registered on the MLS® in the Metro Vancouver* for the month of March were the lowest going back to 2019 for the same month, while active listings continue to their upward trend.
The Greater Vancouver REALTORS® (GVR) reports that residential sales in the region totalled 2,091 in March 2025, a 13.4 per cent decrease from the 2,415 sales recorded in March 2024. This was 36.8 per cent below the 10-year seasonal average (3,308).
“If we can set aside the political and economic uncertainty tied to the new U.S. administration for a moment, buyers in Metro Vancouver haven’t seen market conditions this favourable in years. Prices have eased from recent highs, mortgage rates are among the lowest we’ve seen in years, and there are more active listings on the MLS® than we’ve seen in almost a decade. Sellers appear ready to engage — but so far, buyers have not shown up in the numbers we typically see at this time of year.”
Read the full report on the REBGV website!
The following data is a comparison between March 2025 and March 2024 numbers, and is current as of April of 2025. For last month’s update, you can check out our previous post!
Or follow this link for all our GVR Infographics!
These infographics cover current trends in several areas within the Greater Vancouver region. Click on the images for a larger view!
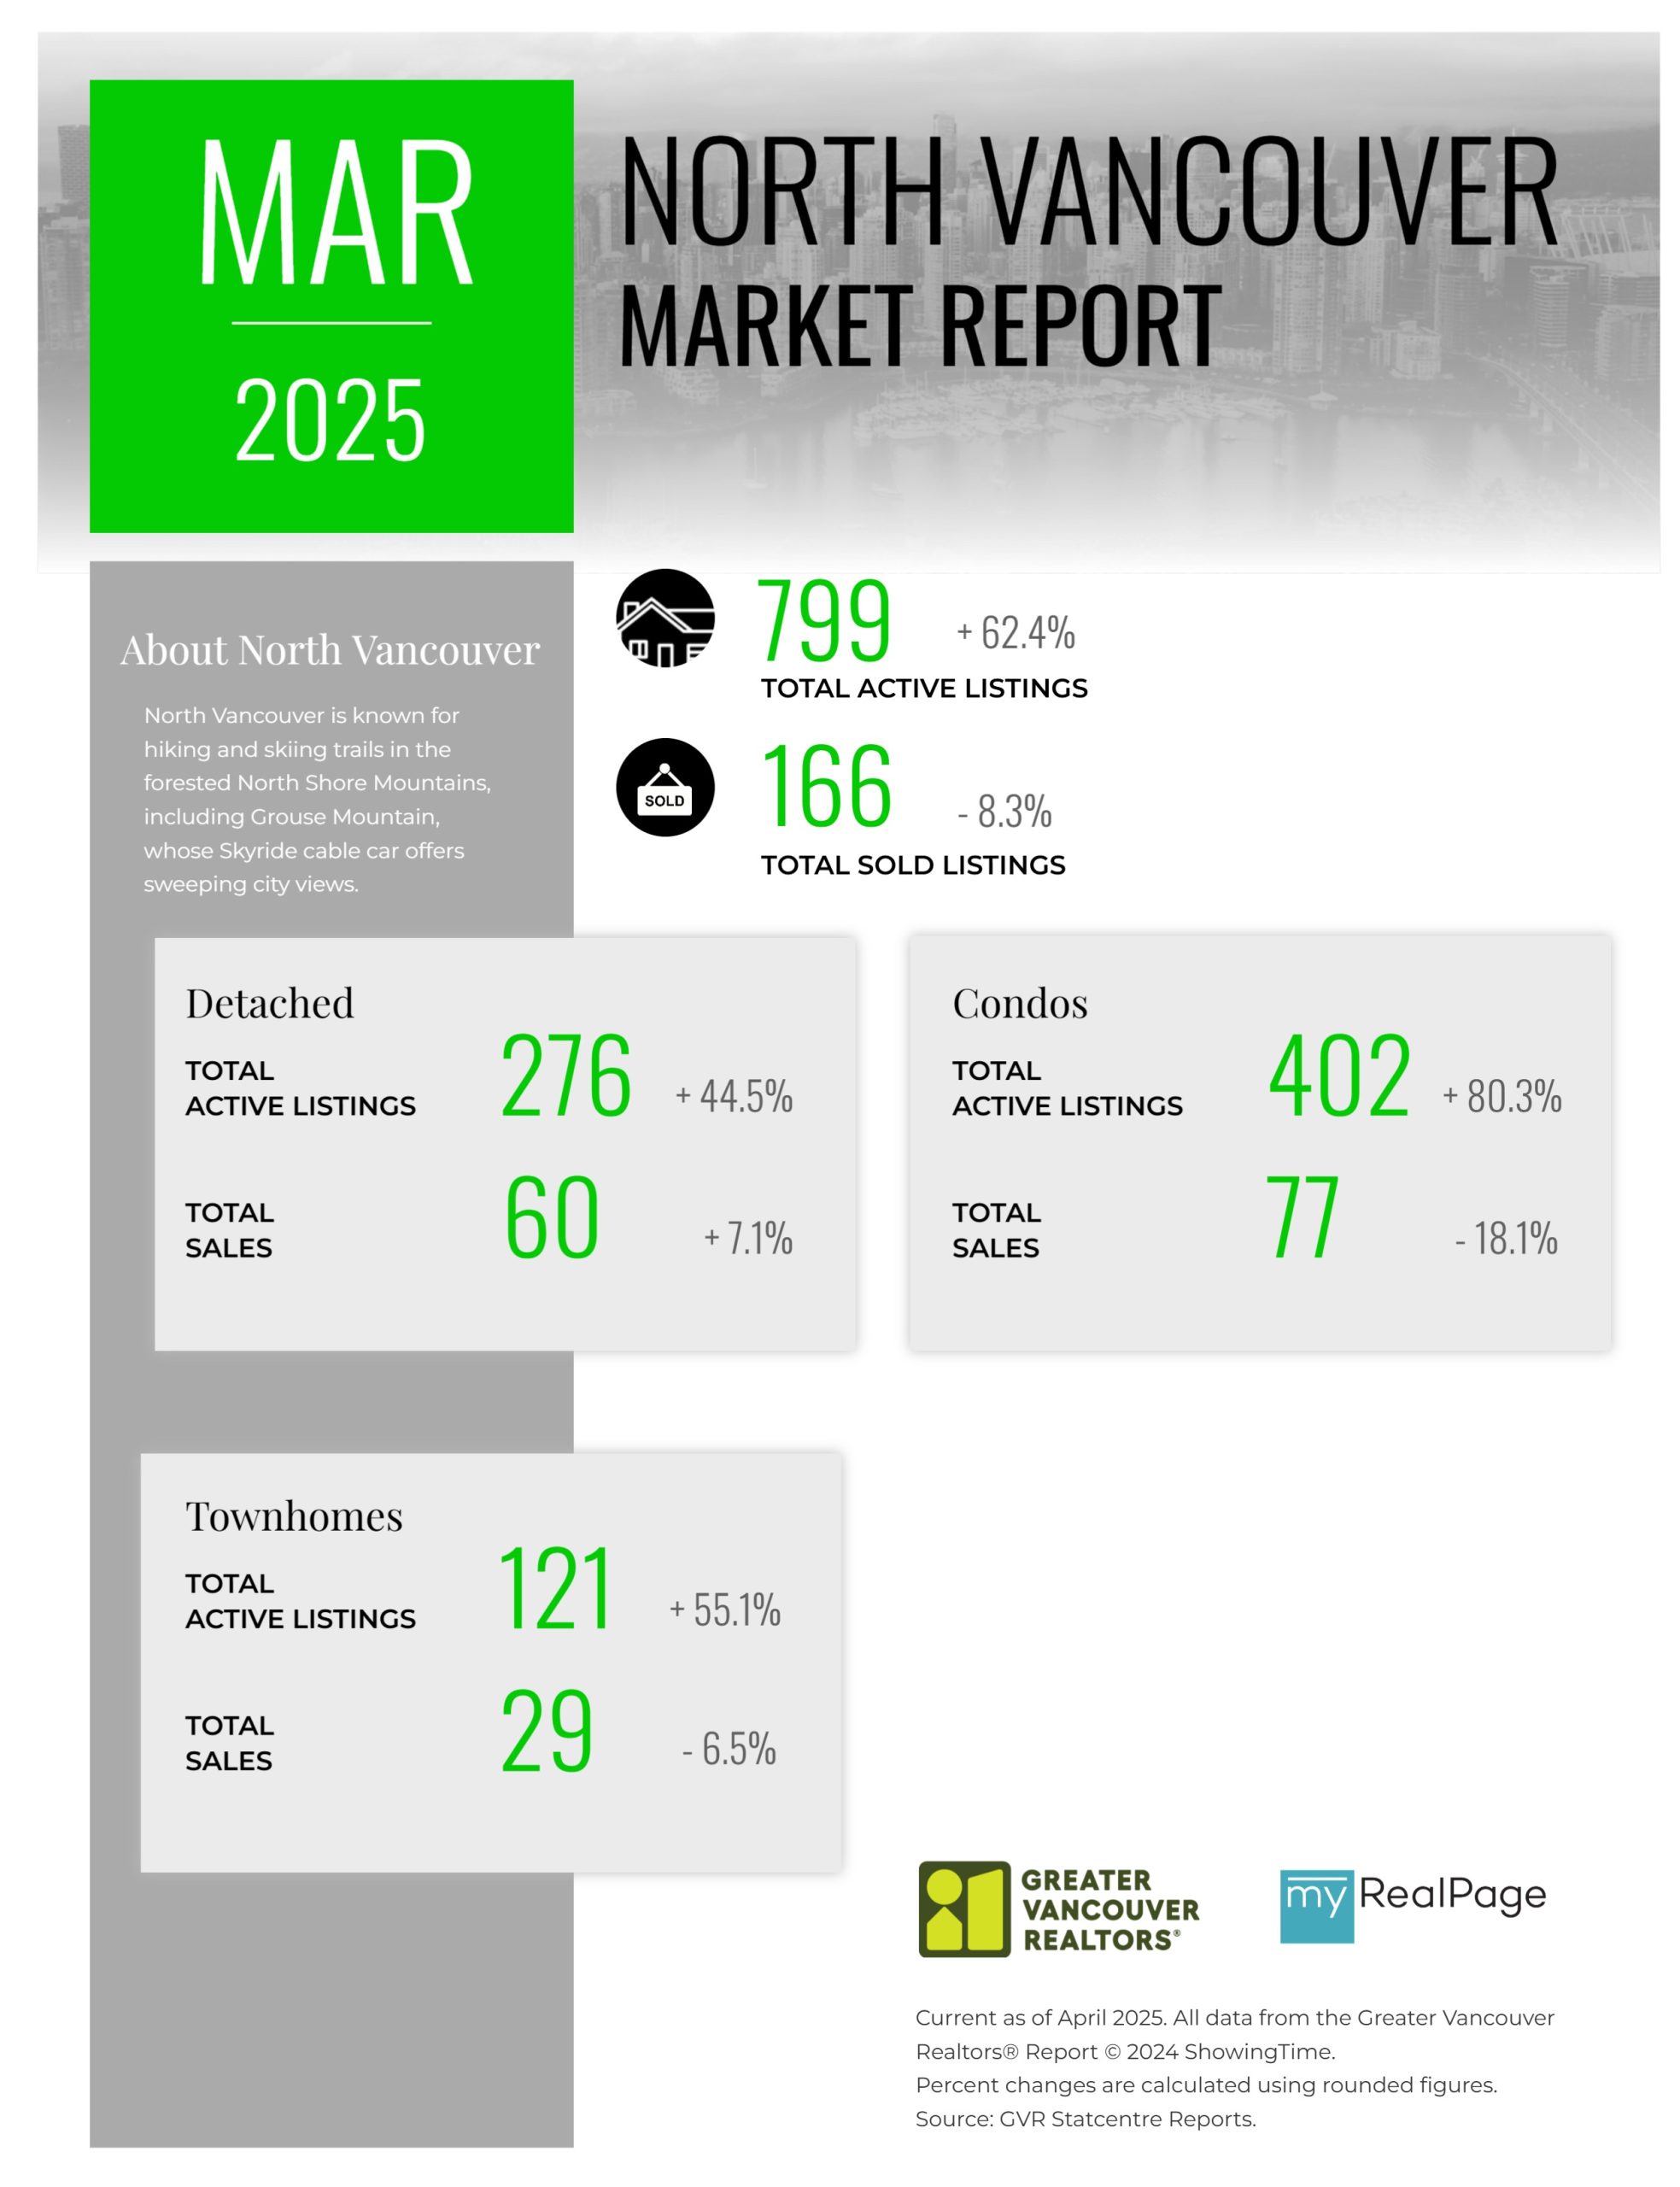
Printable Version – GVR February 2025 Data Infographic Report North Vancouver
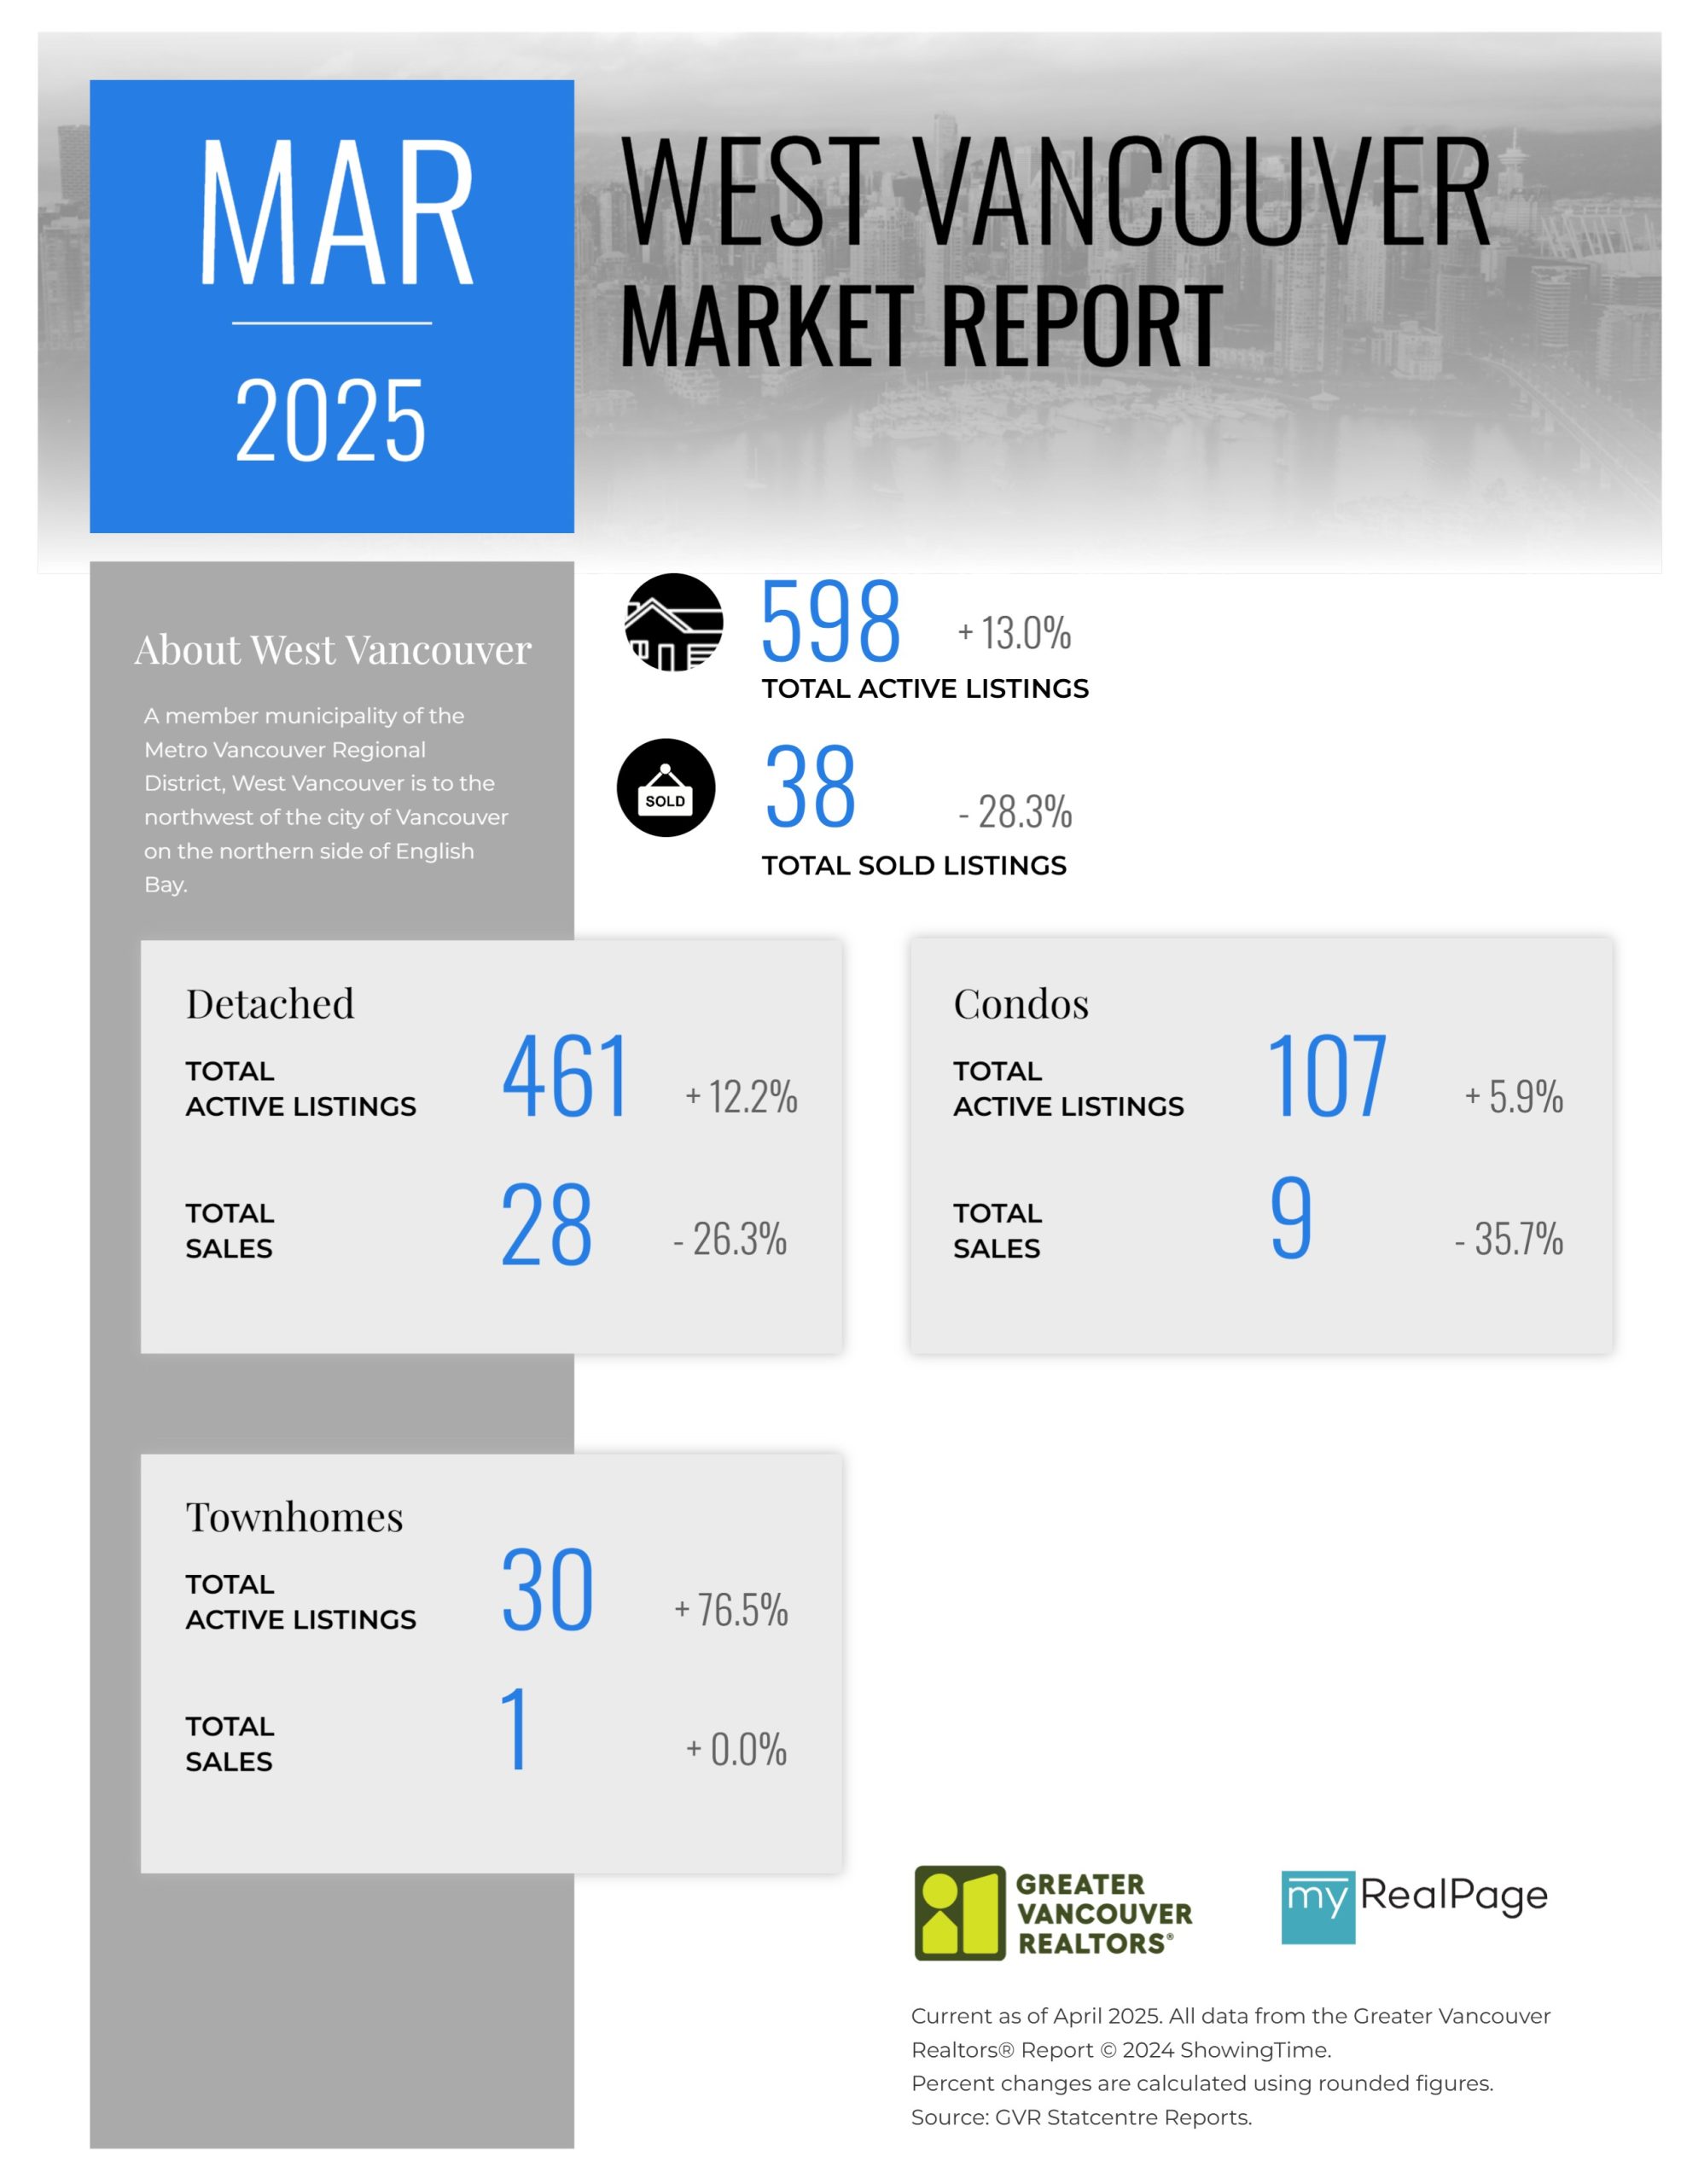
Printable Version – GVR March 2025 Data Infographics Report West Vancouver
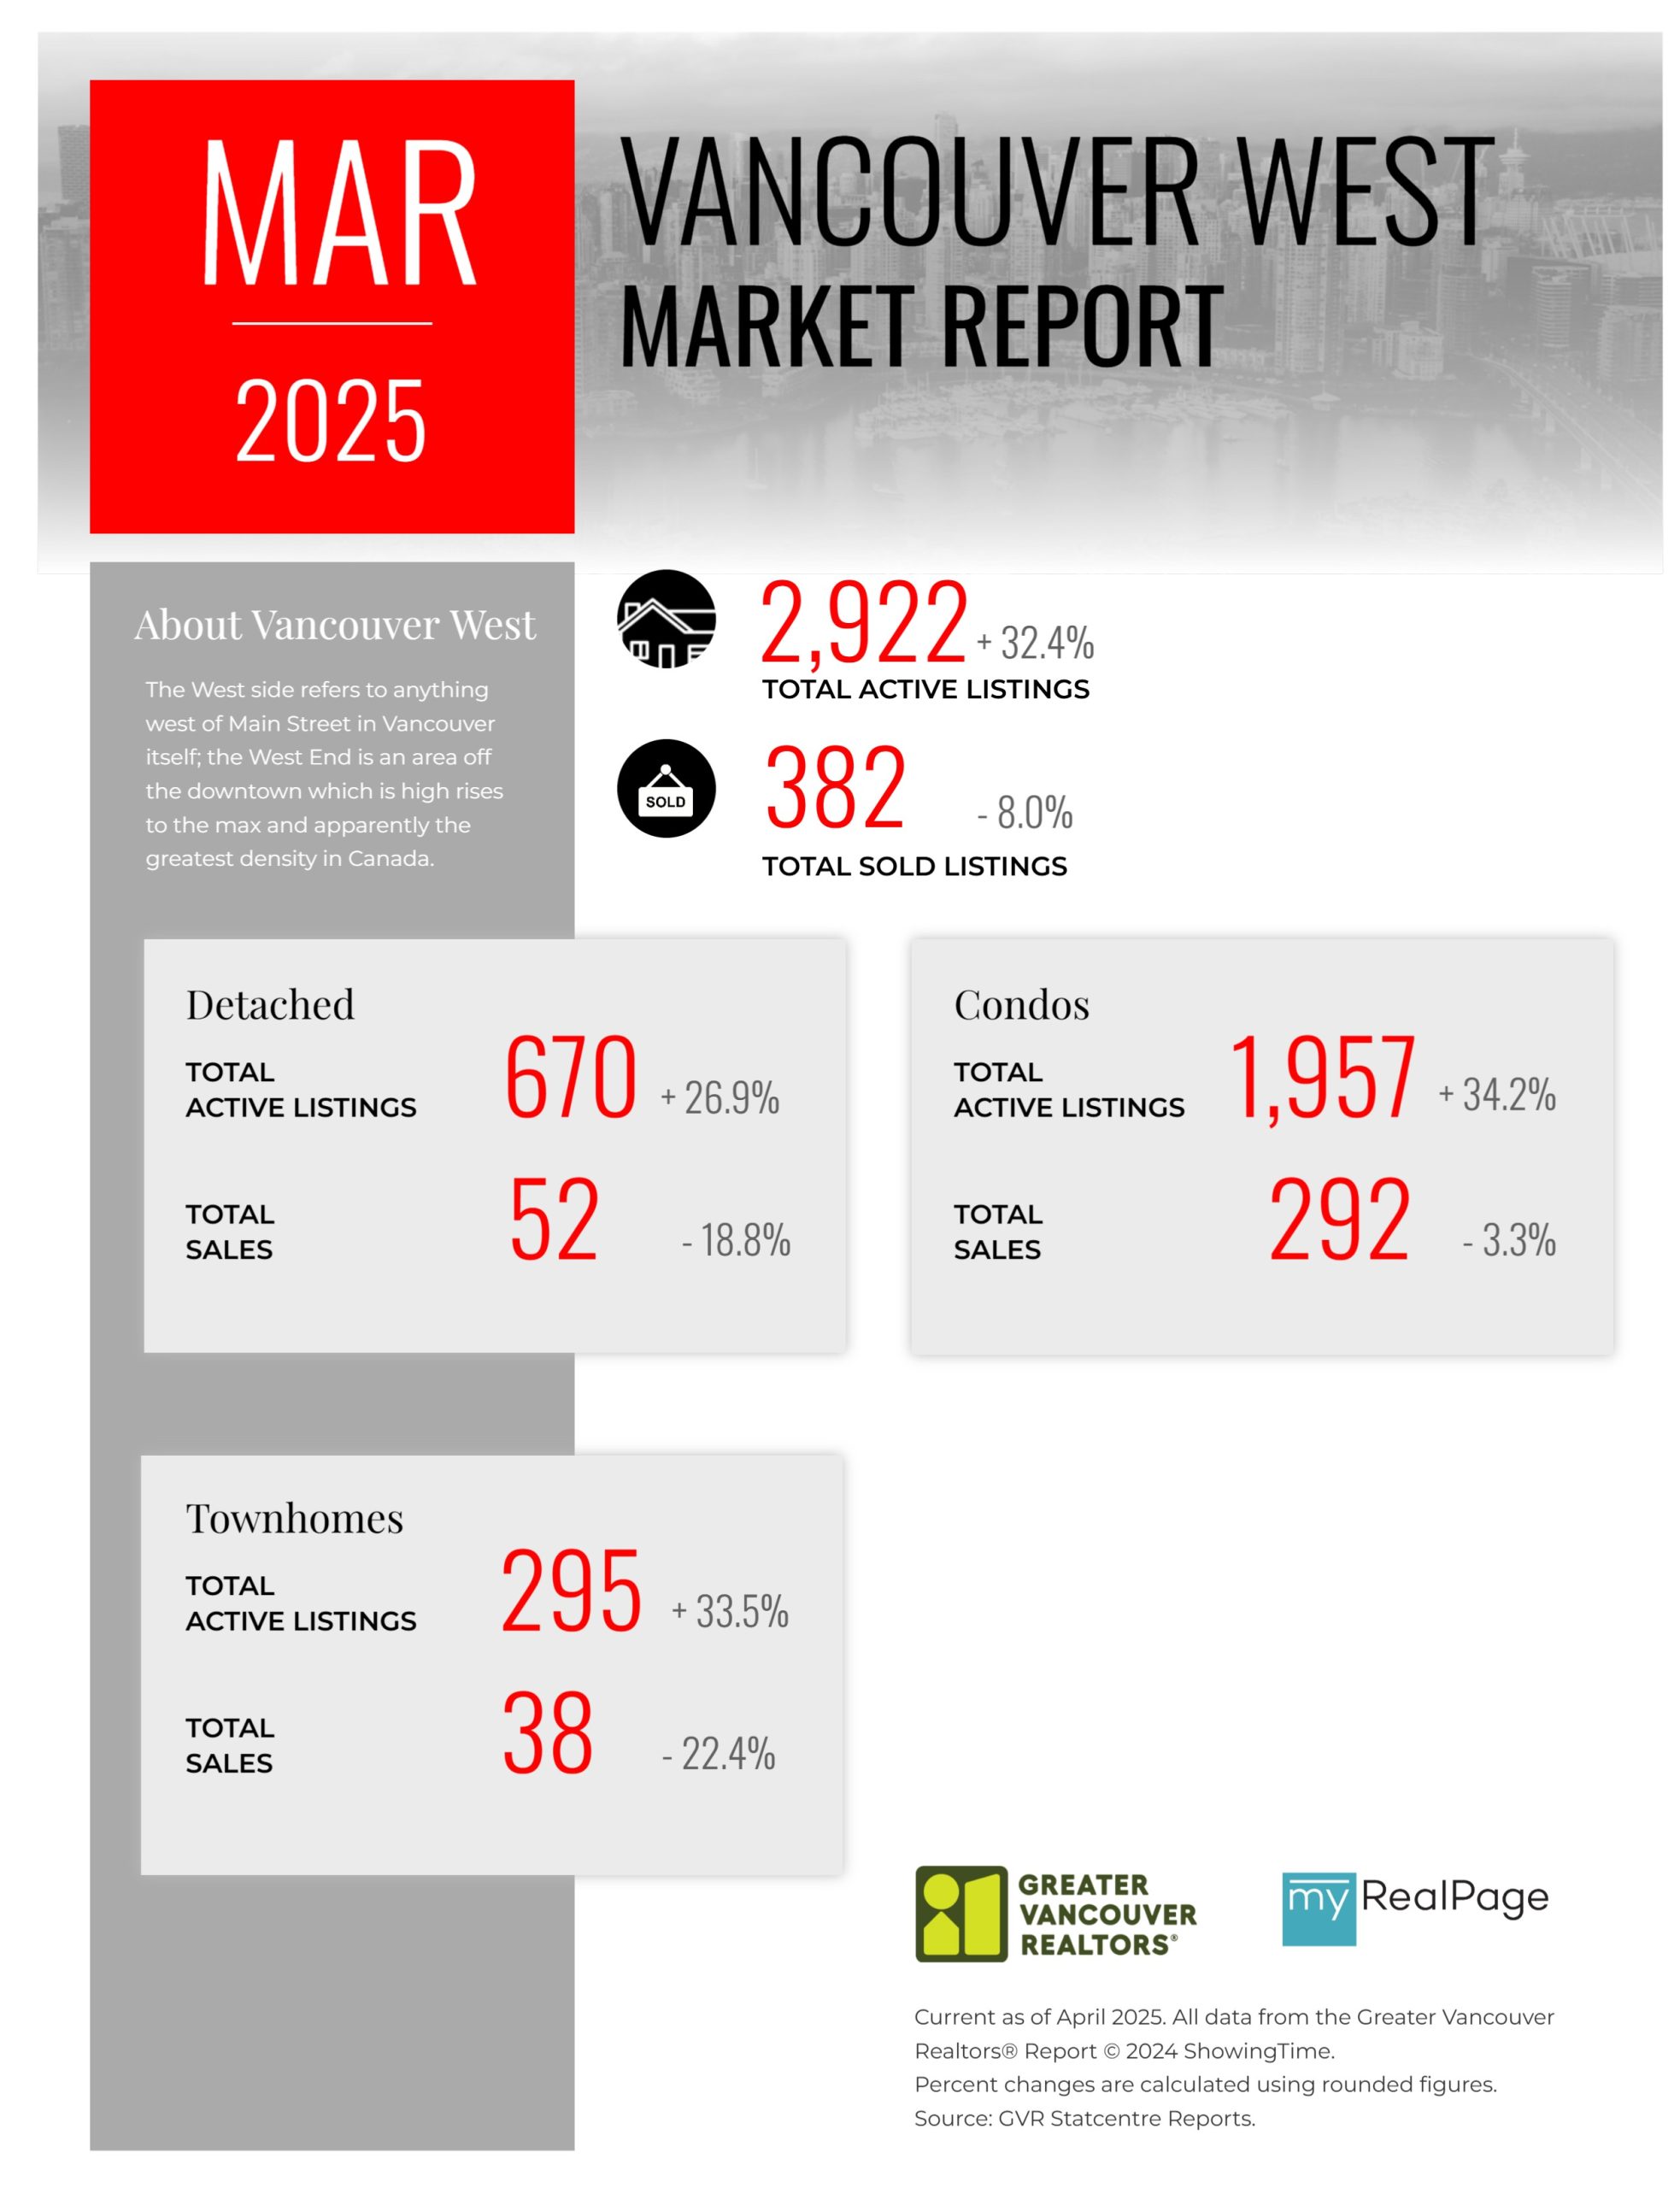
Printable Version – GVR March 2025 Data Infographics Report Vancouver West
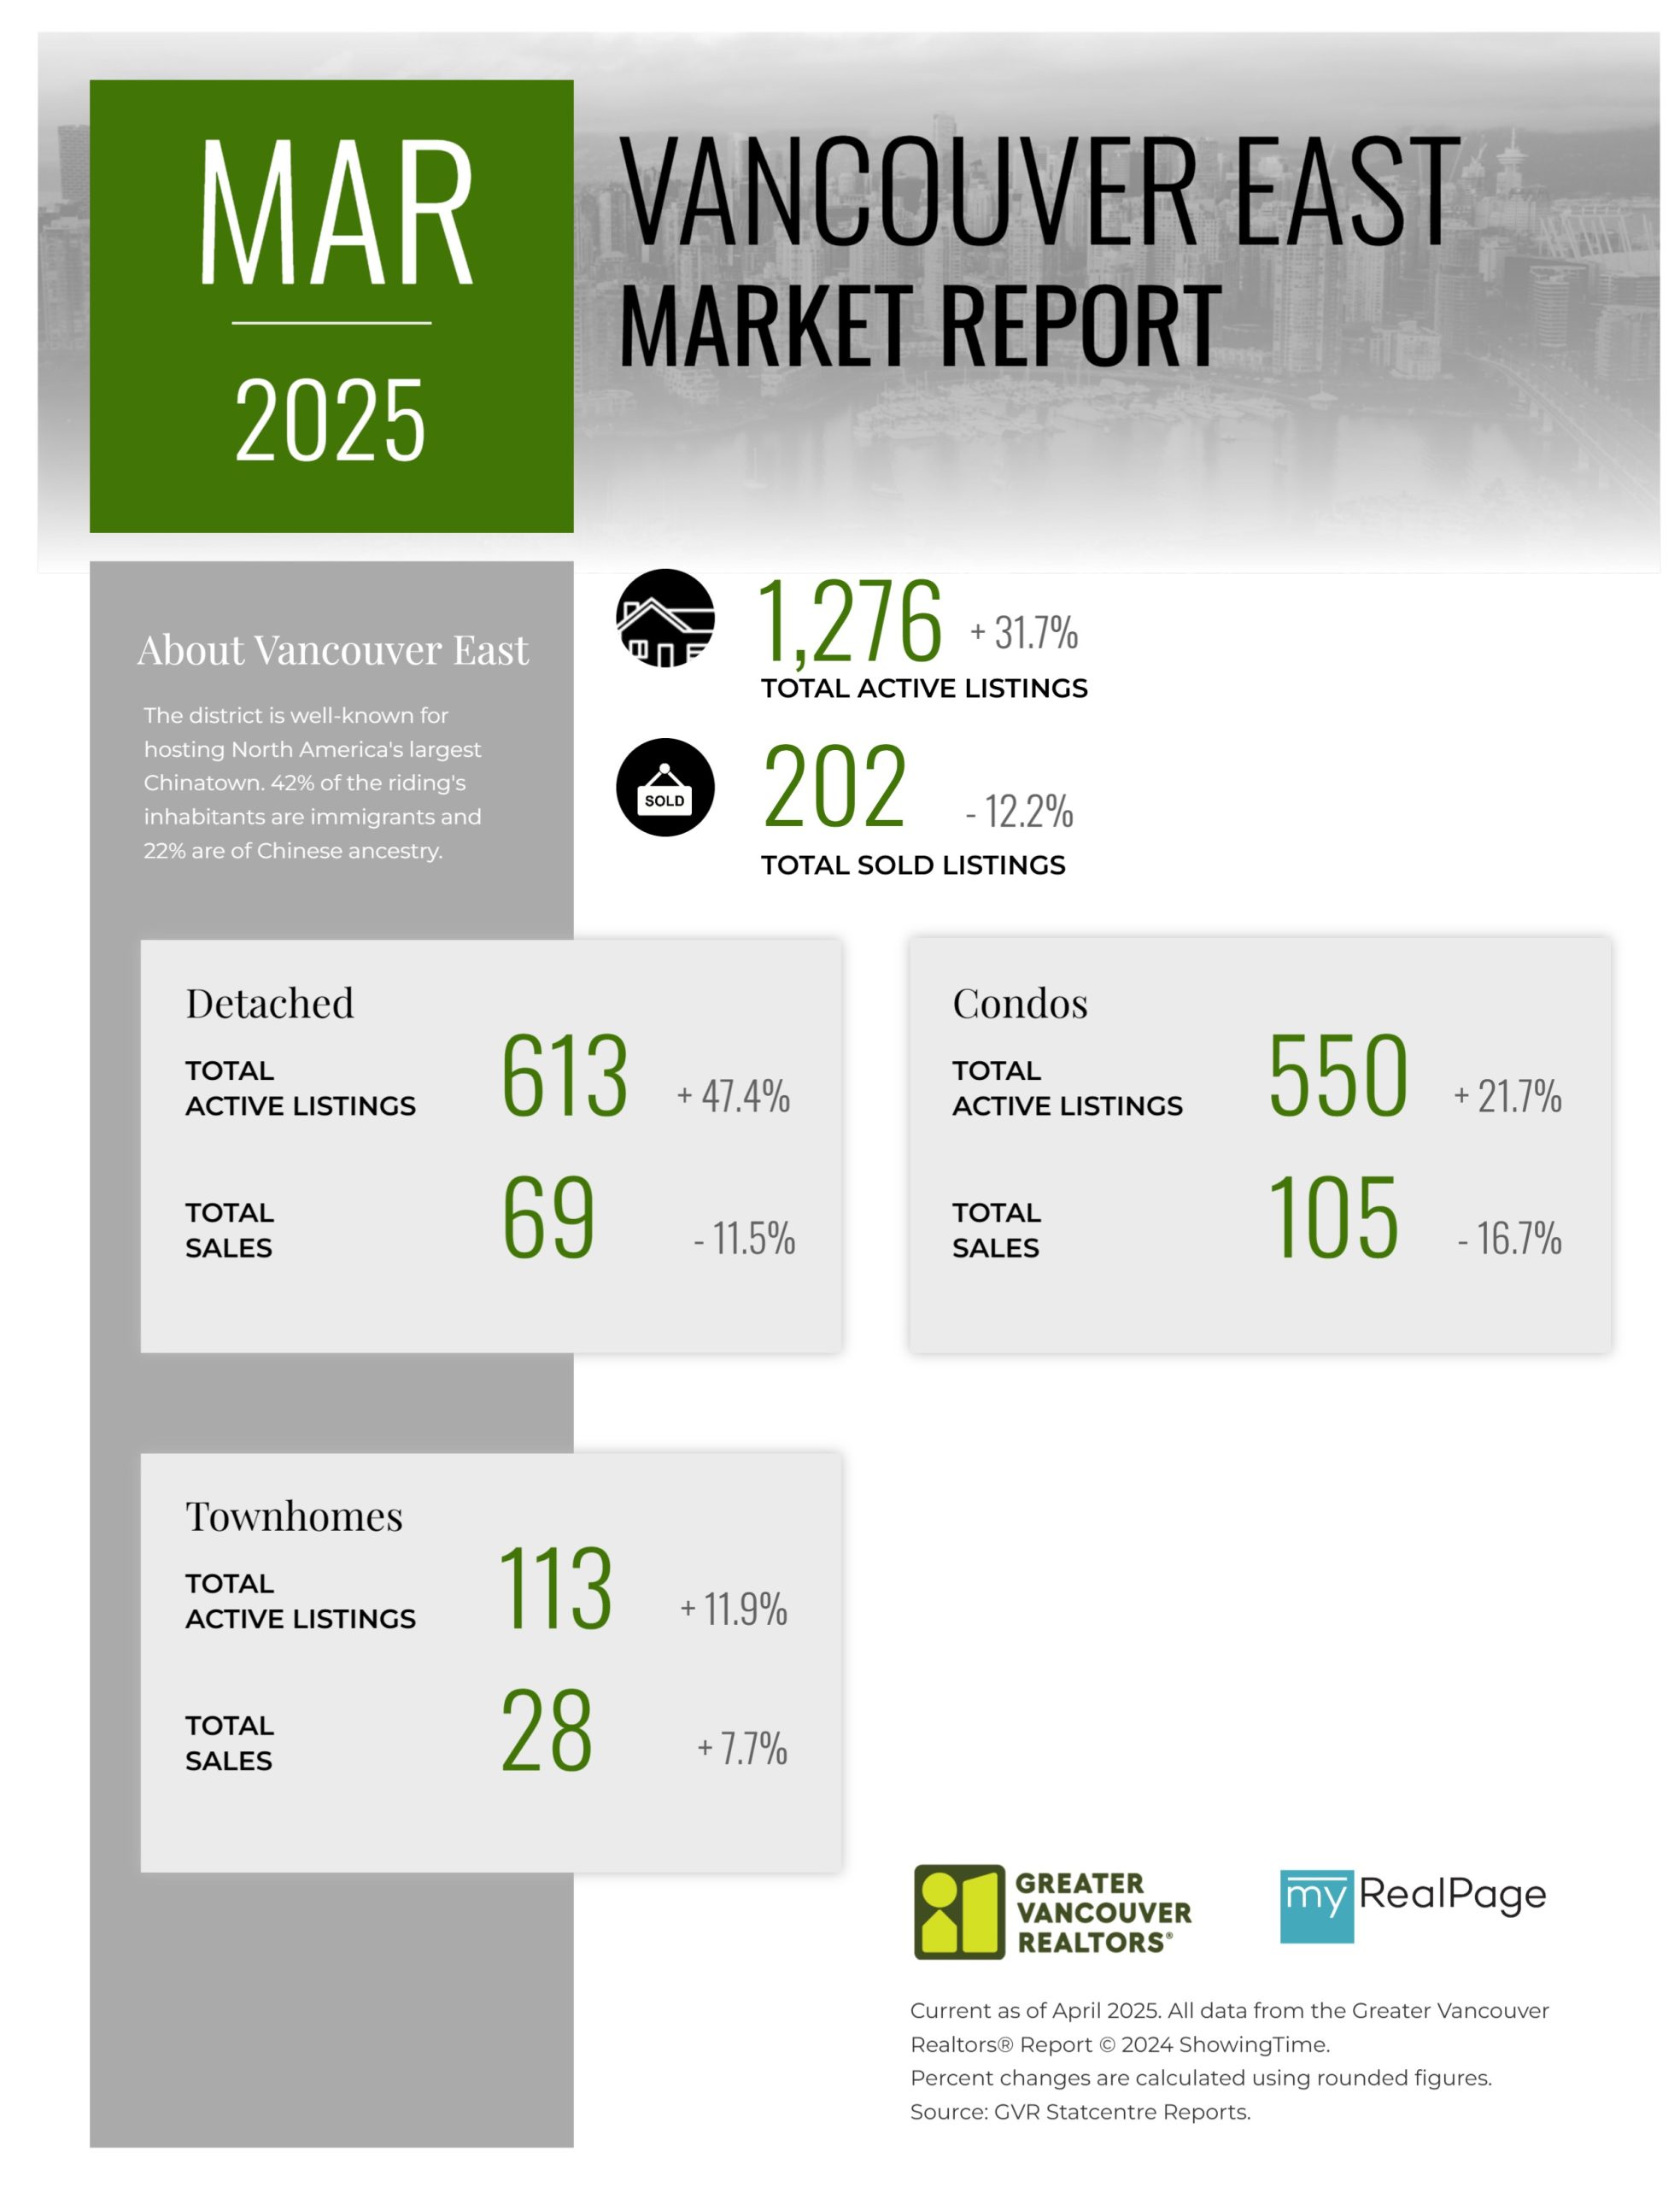
Printable Version – GVR March 2025 Data Infographics Report Vancouver East
Printable Version – GVR March 2025 Data Infographic Report Maple Ridge
Printable Version – GVR March 2025 Data Infographics Report Pitt Meadows
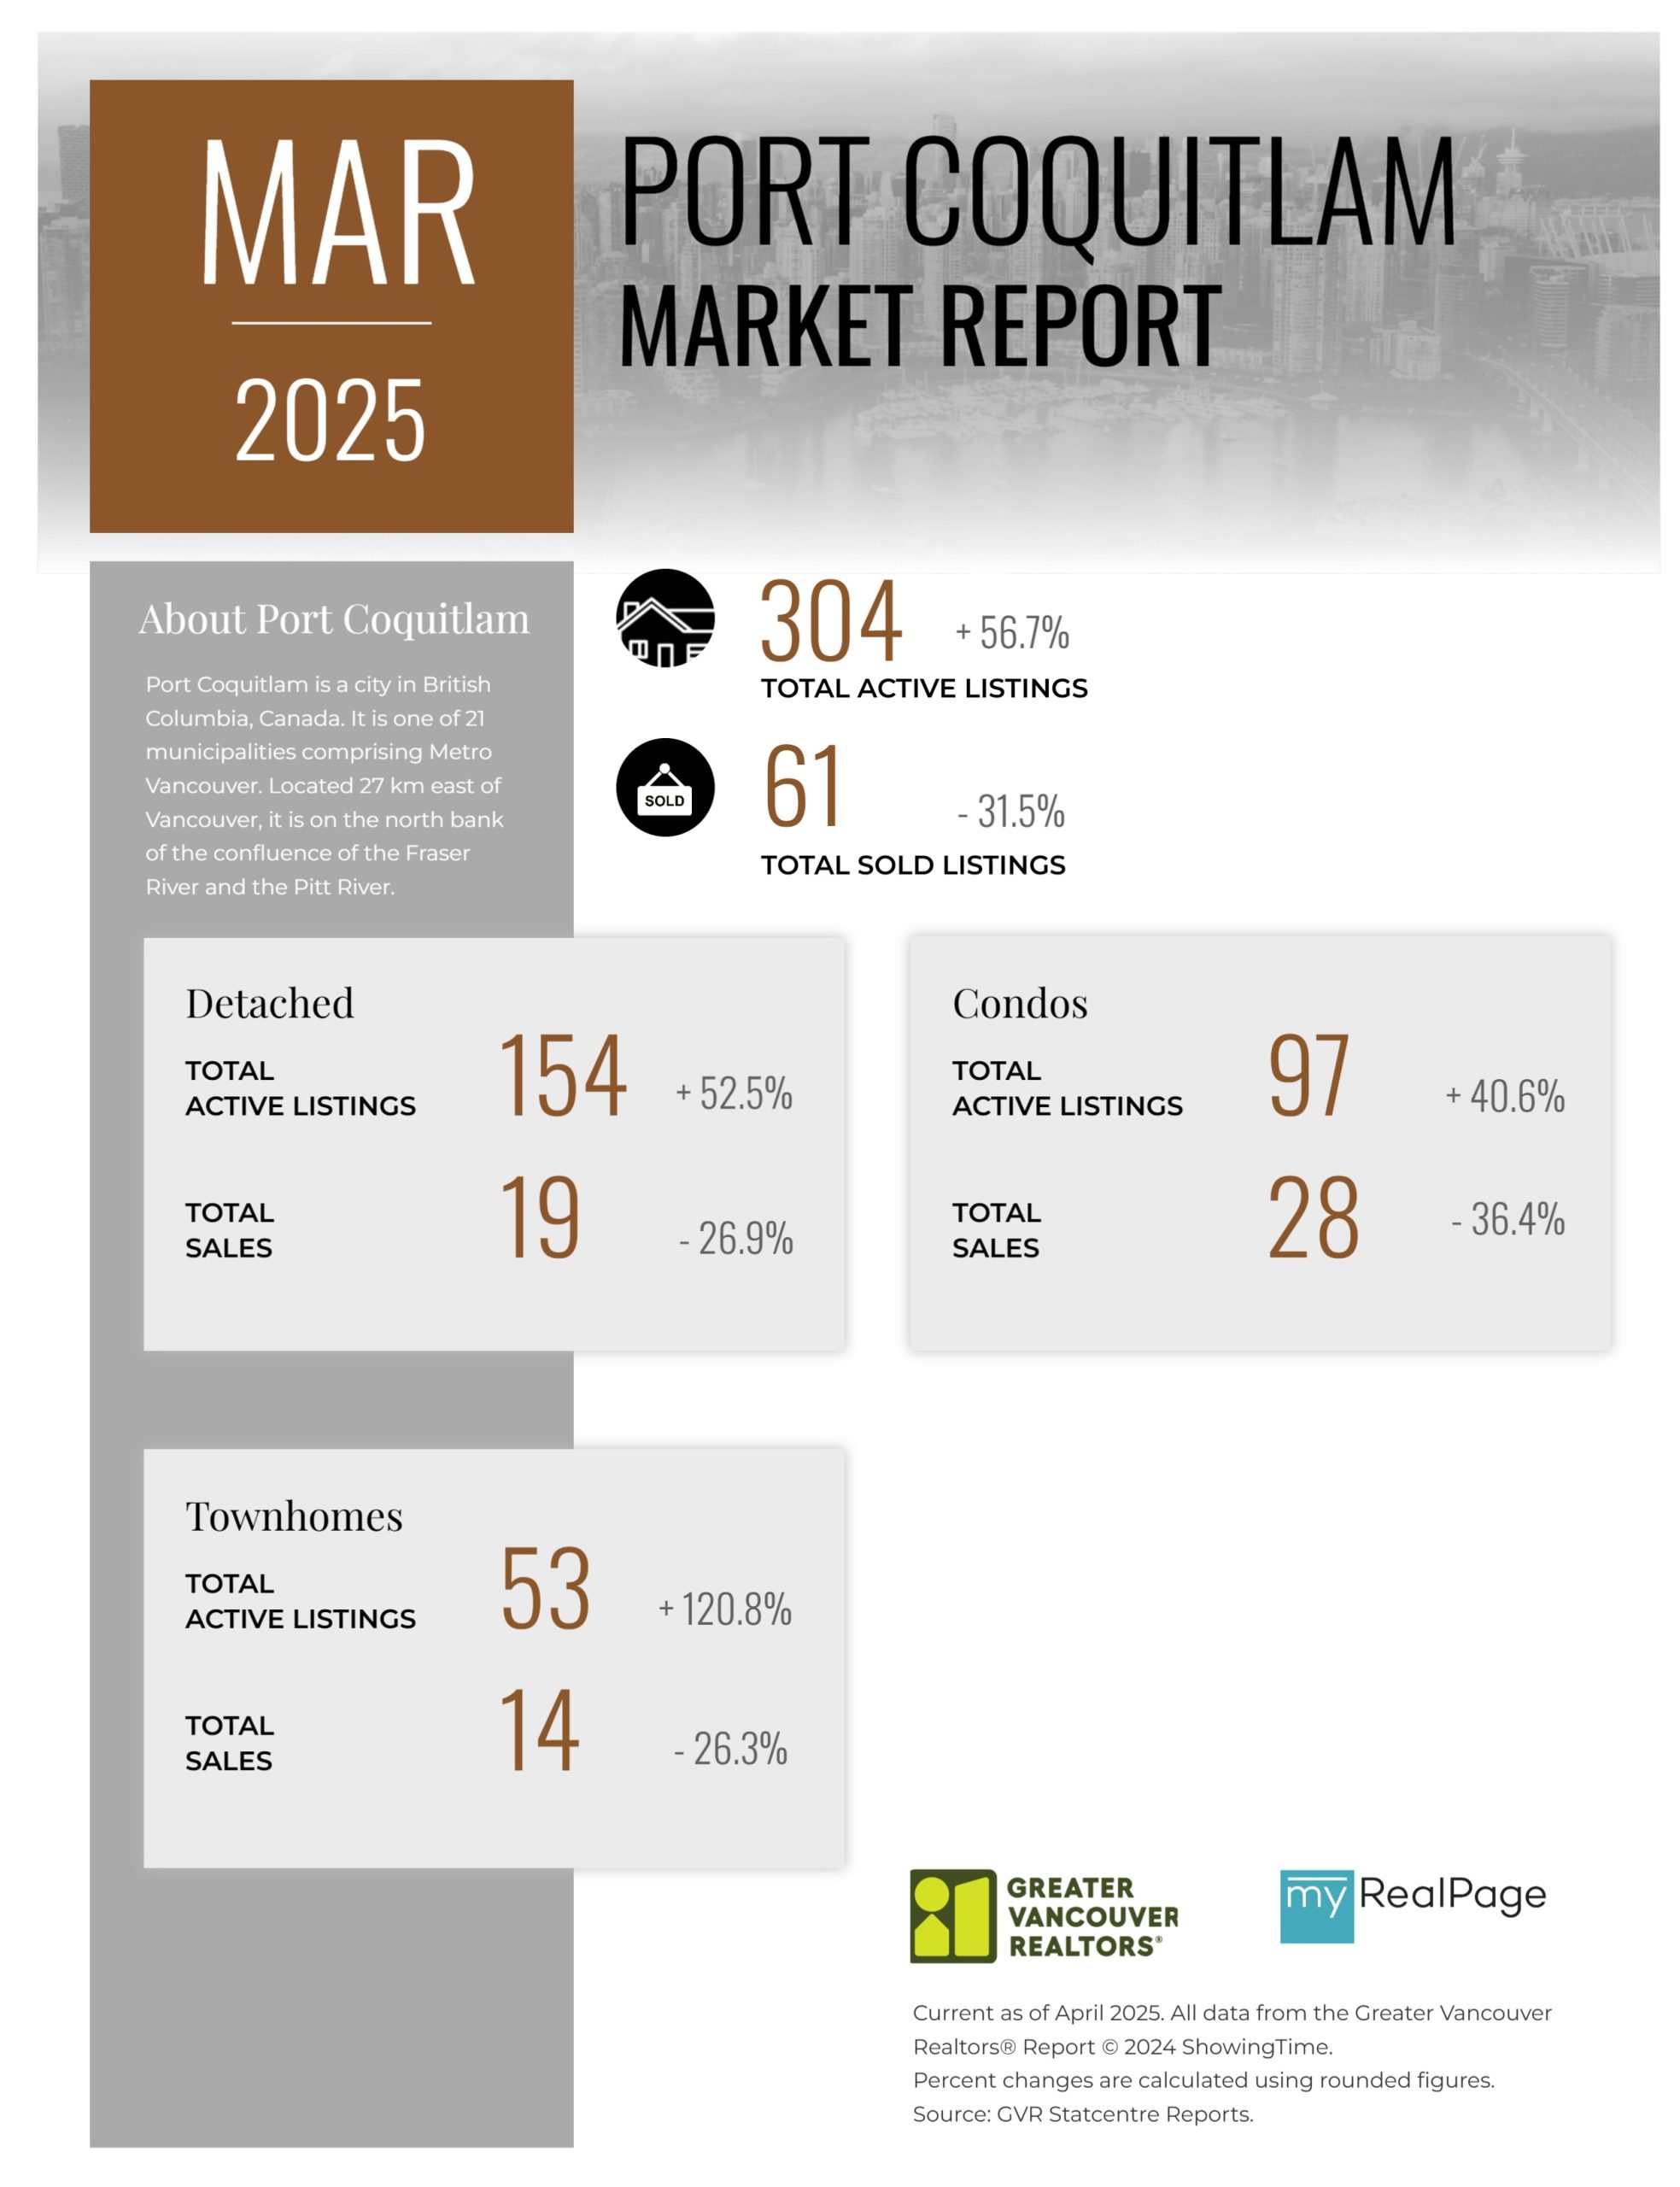
Printable Version – GVR March 2025 Data Infographics Report Port Coquitlam
Printable Version – GVR March 2025 Data Infographics Report Coquitlam
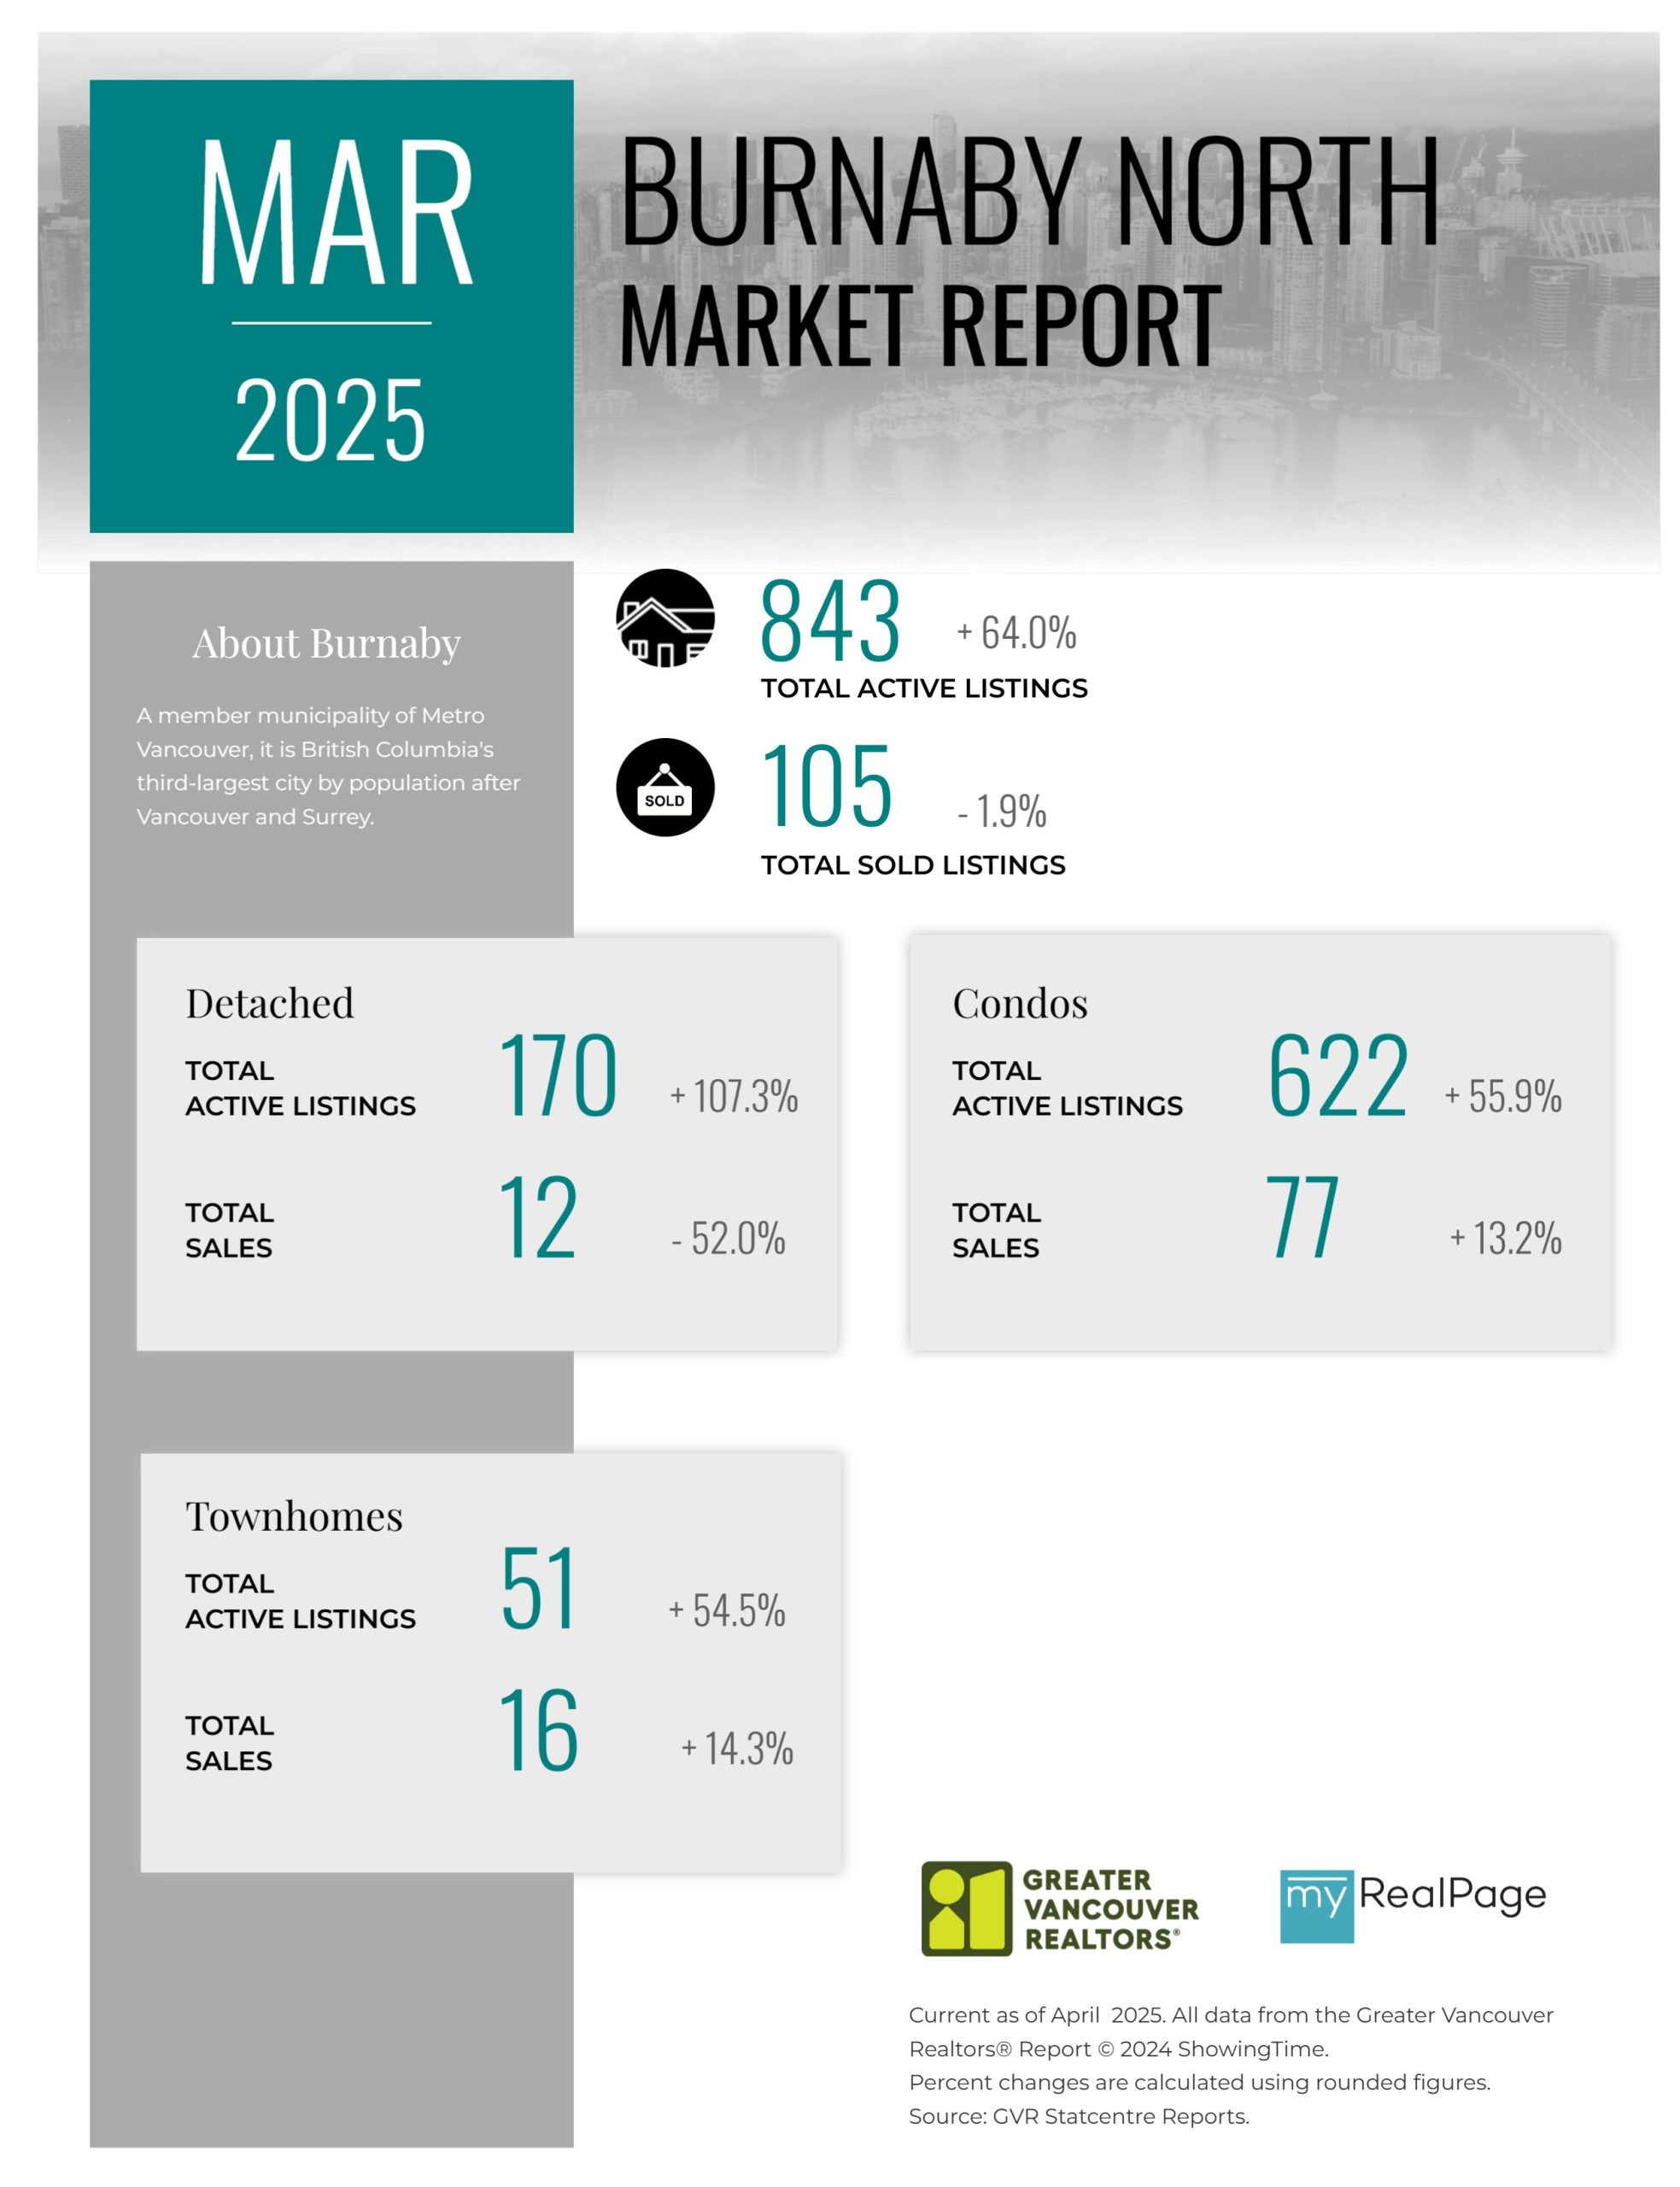
Printable Version – GVR March 2025 Data Infographic Report Burnaby North
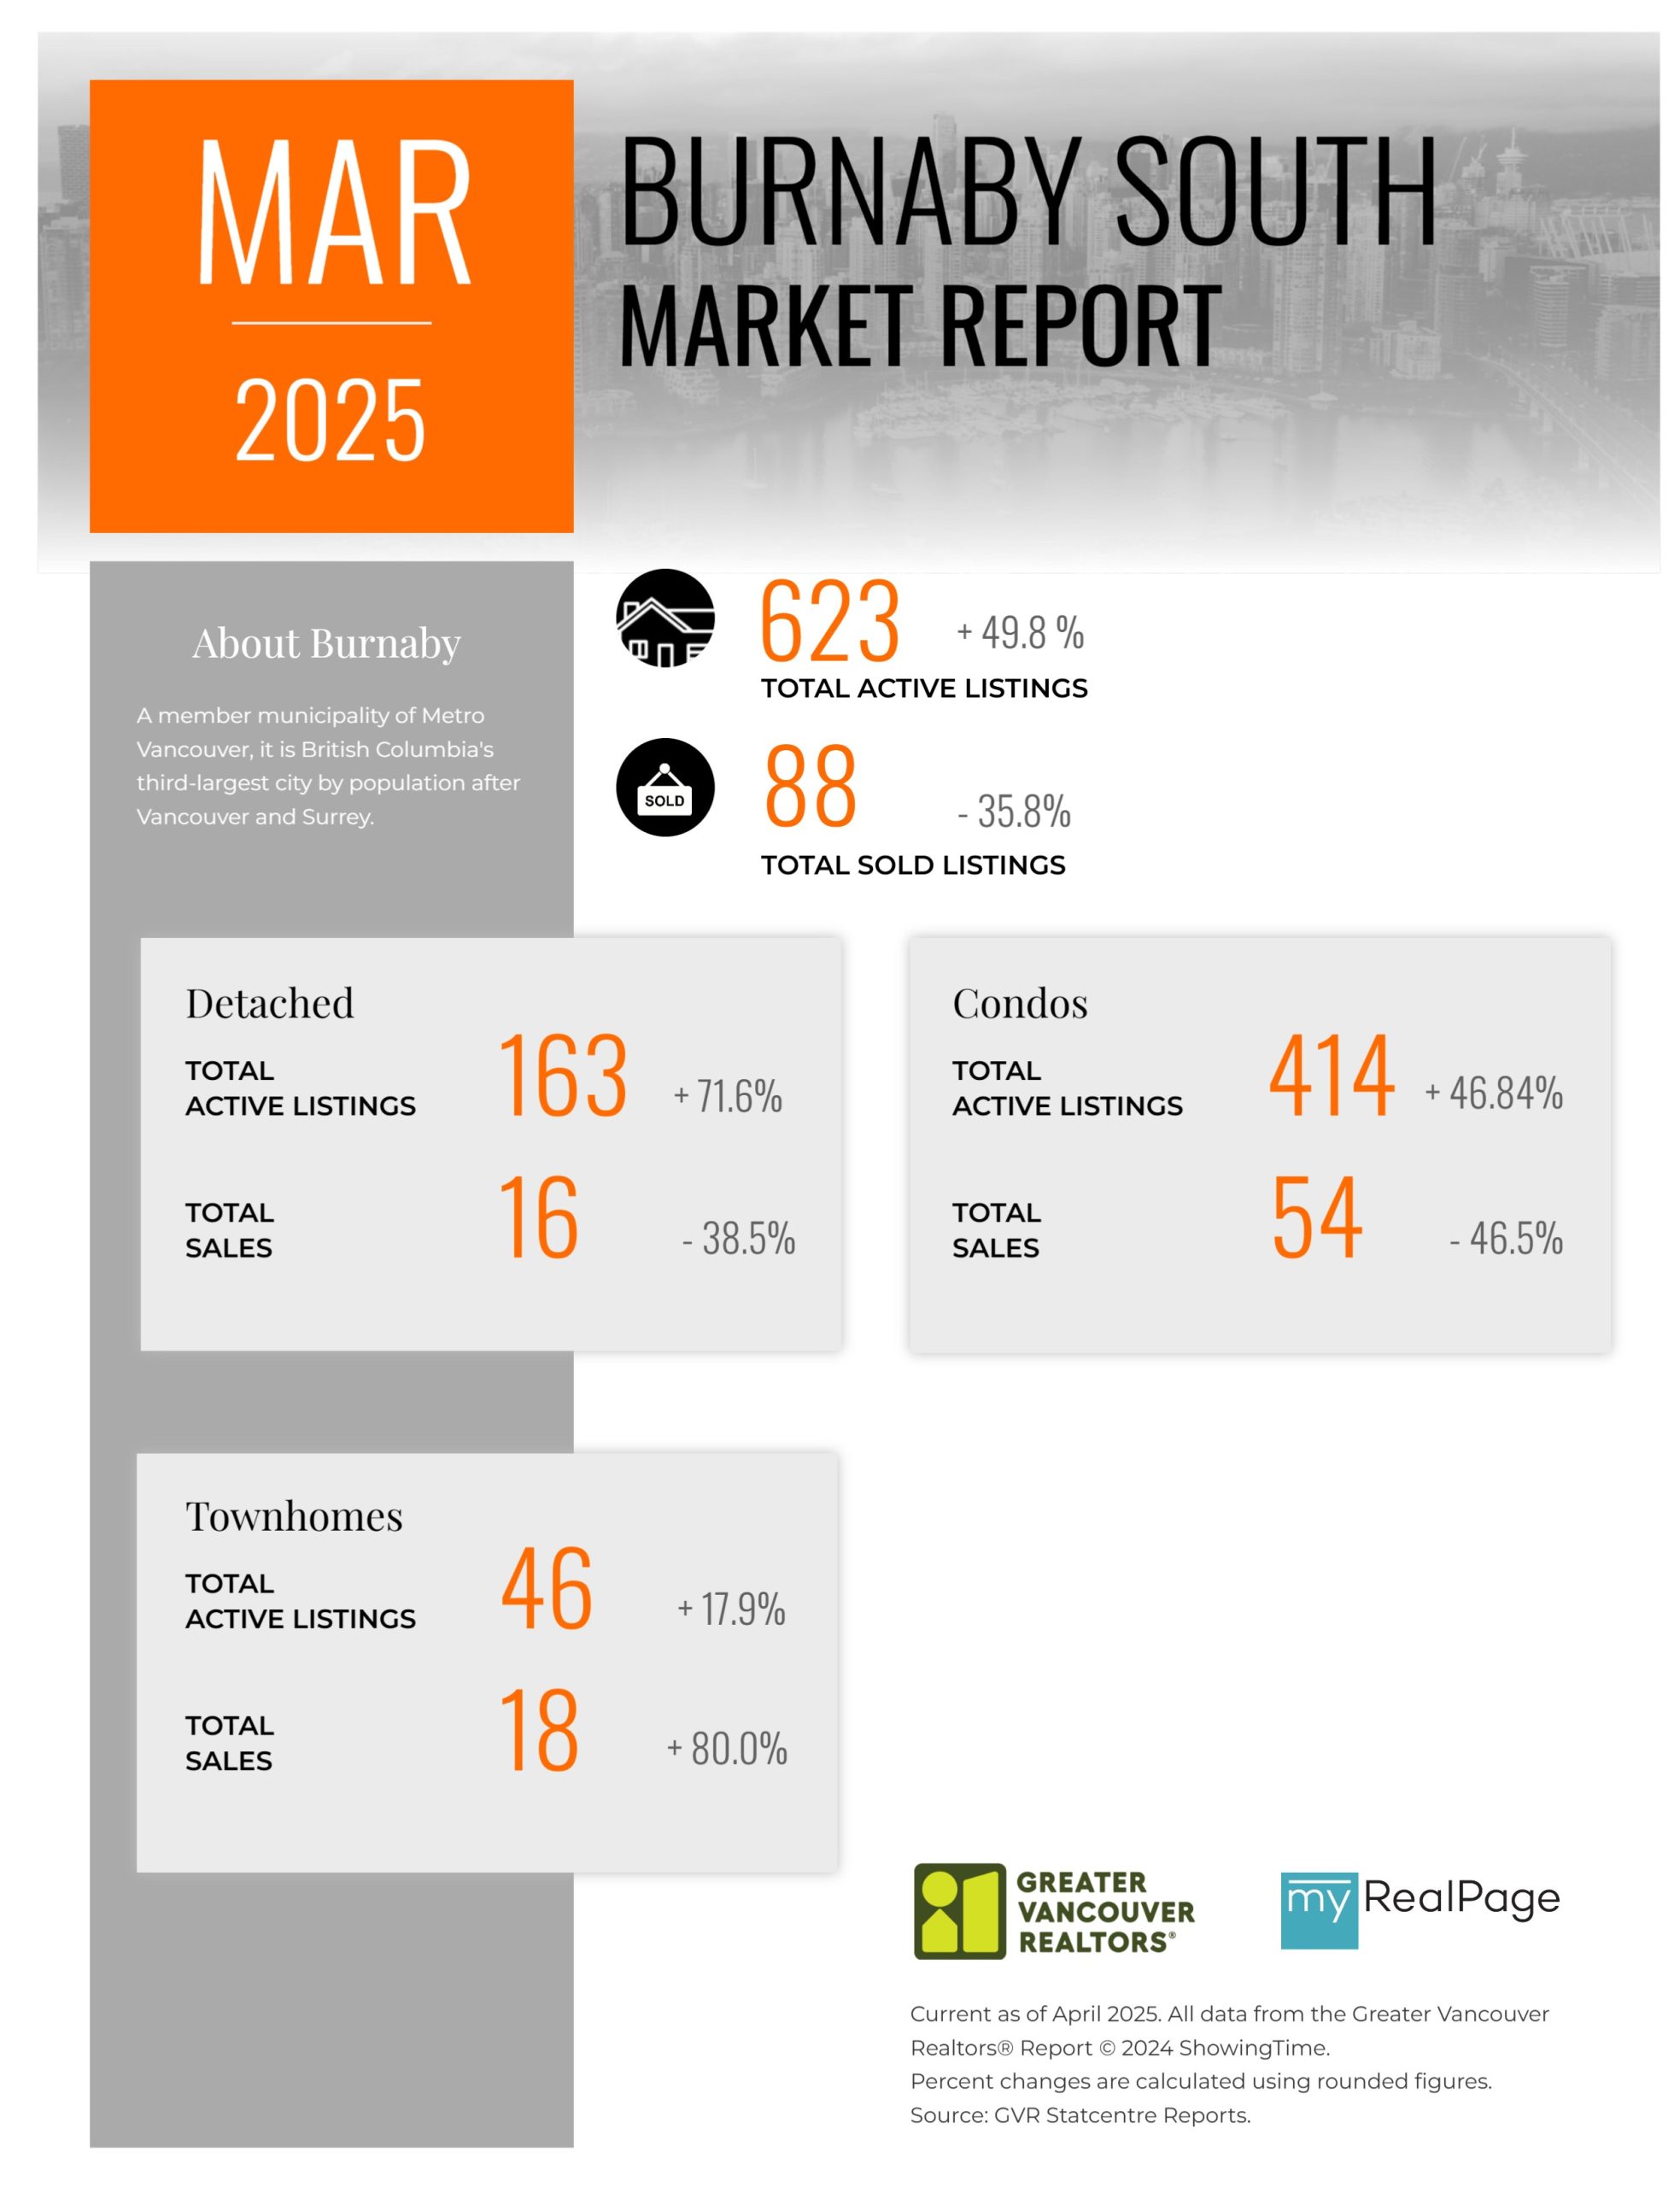
Printable Version – GVR March 2025 Data Infographics Report Burnaby South
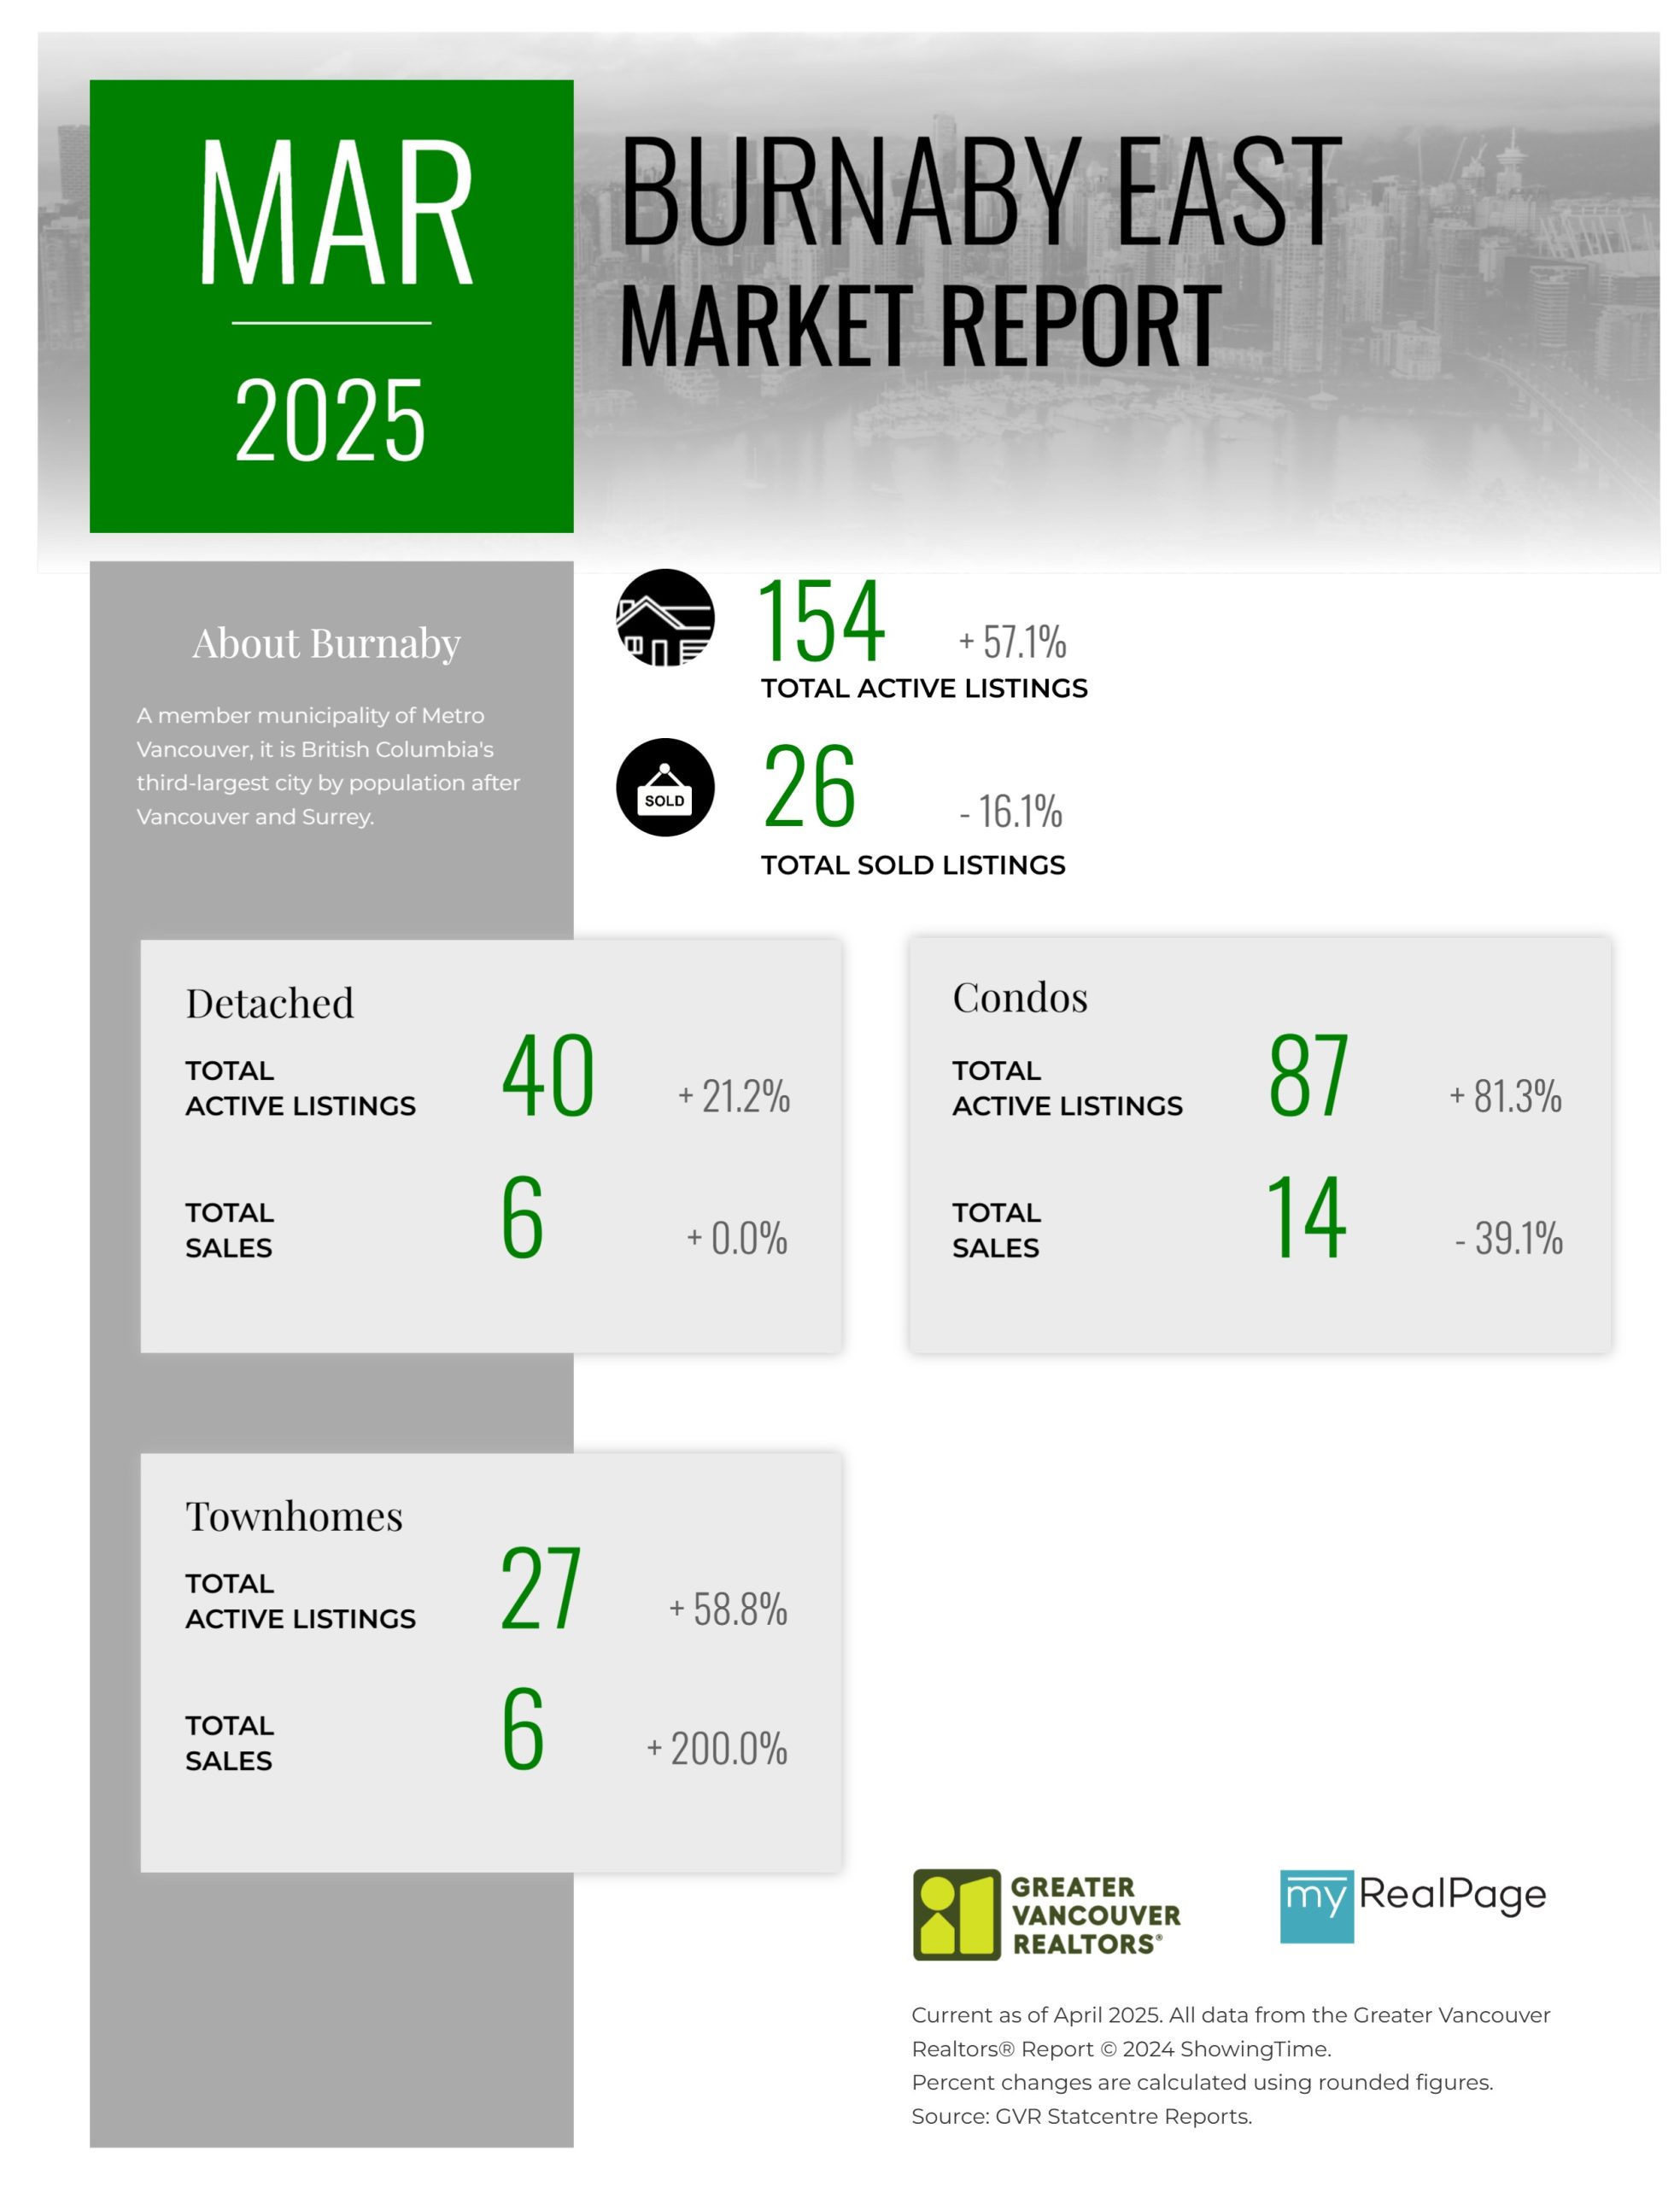
Printable Version – GVR March 2025 Data Infographics Report Burnaby East
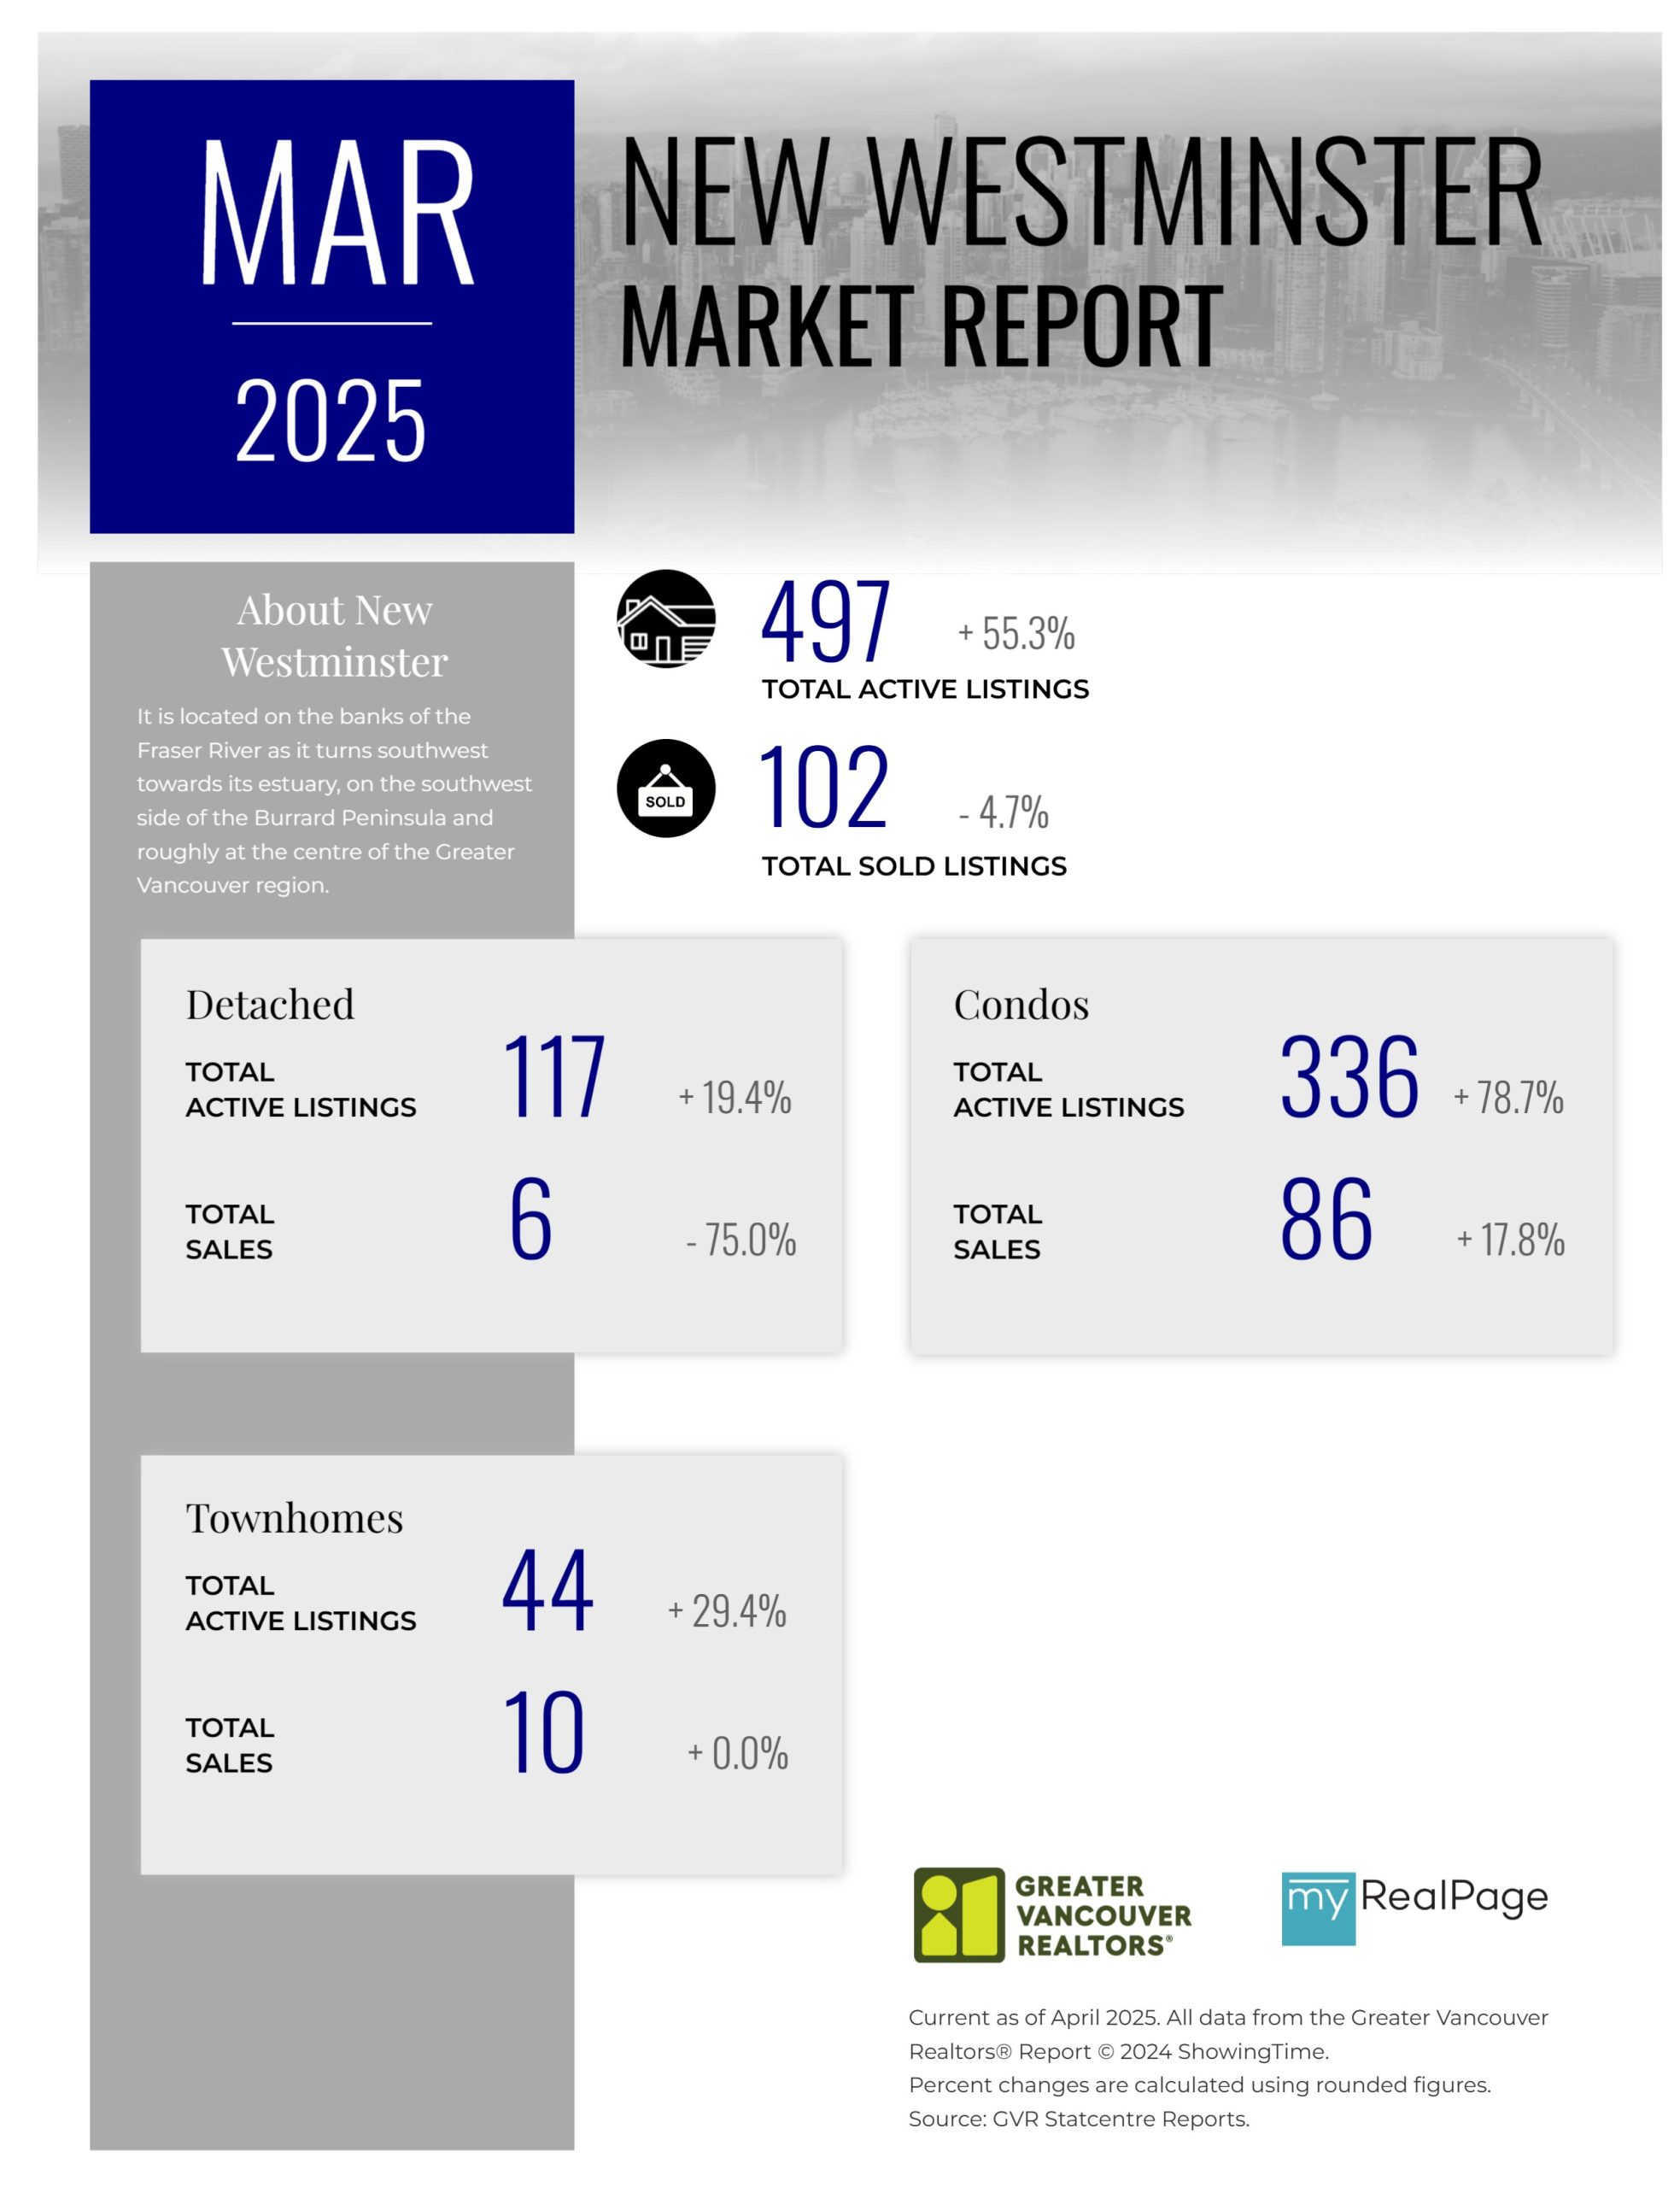
Printable Version – GVR March 2025 Data Infographics Report New Westminster
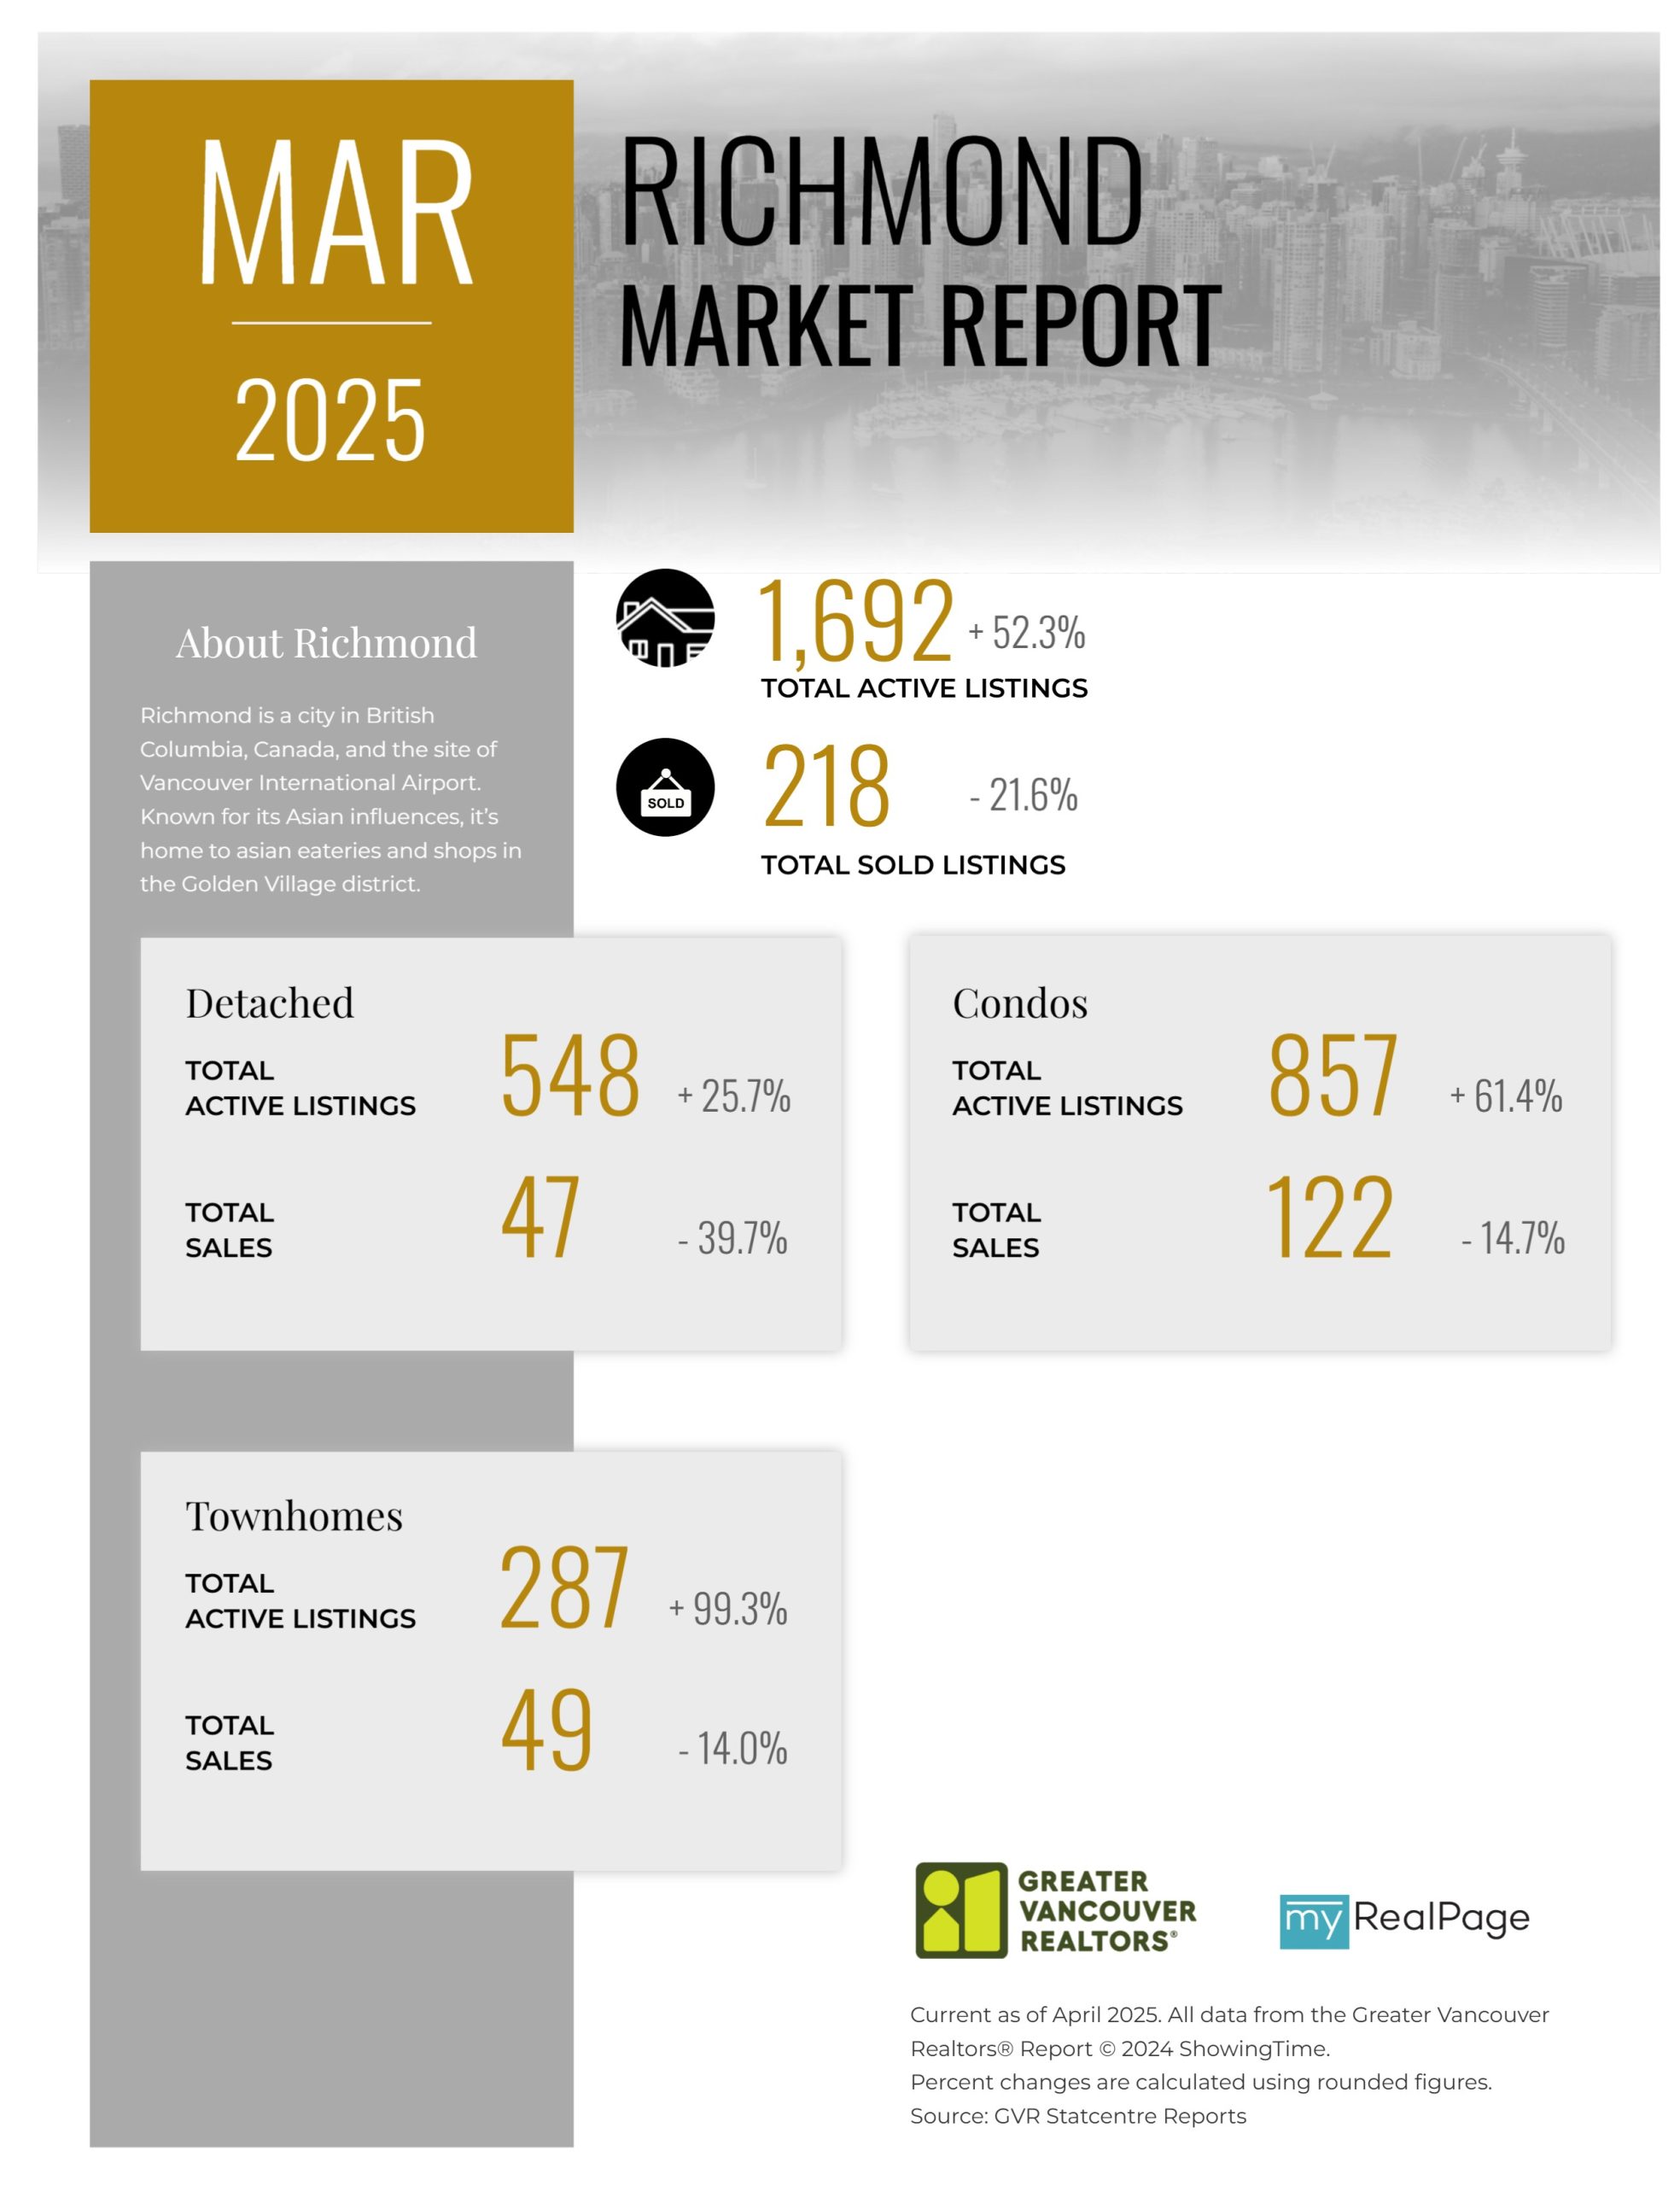
Printable Version – GVR March 2025 Data Infographics Report Richmond
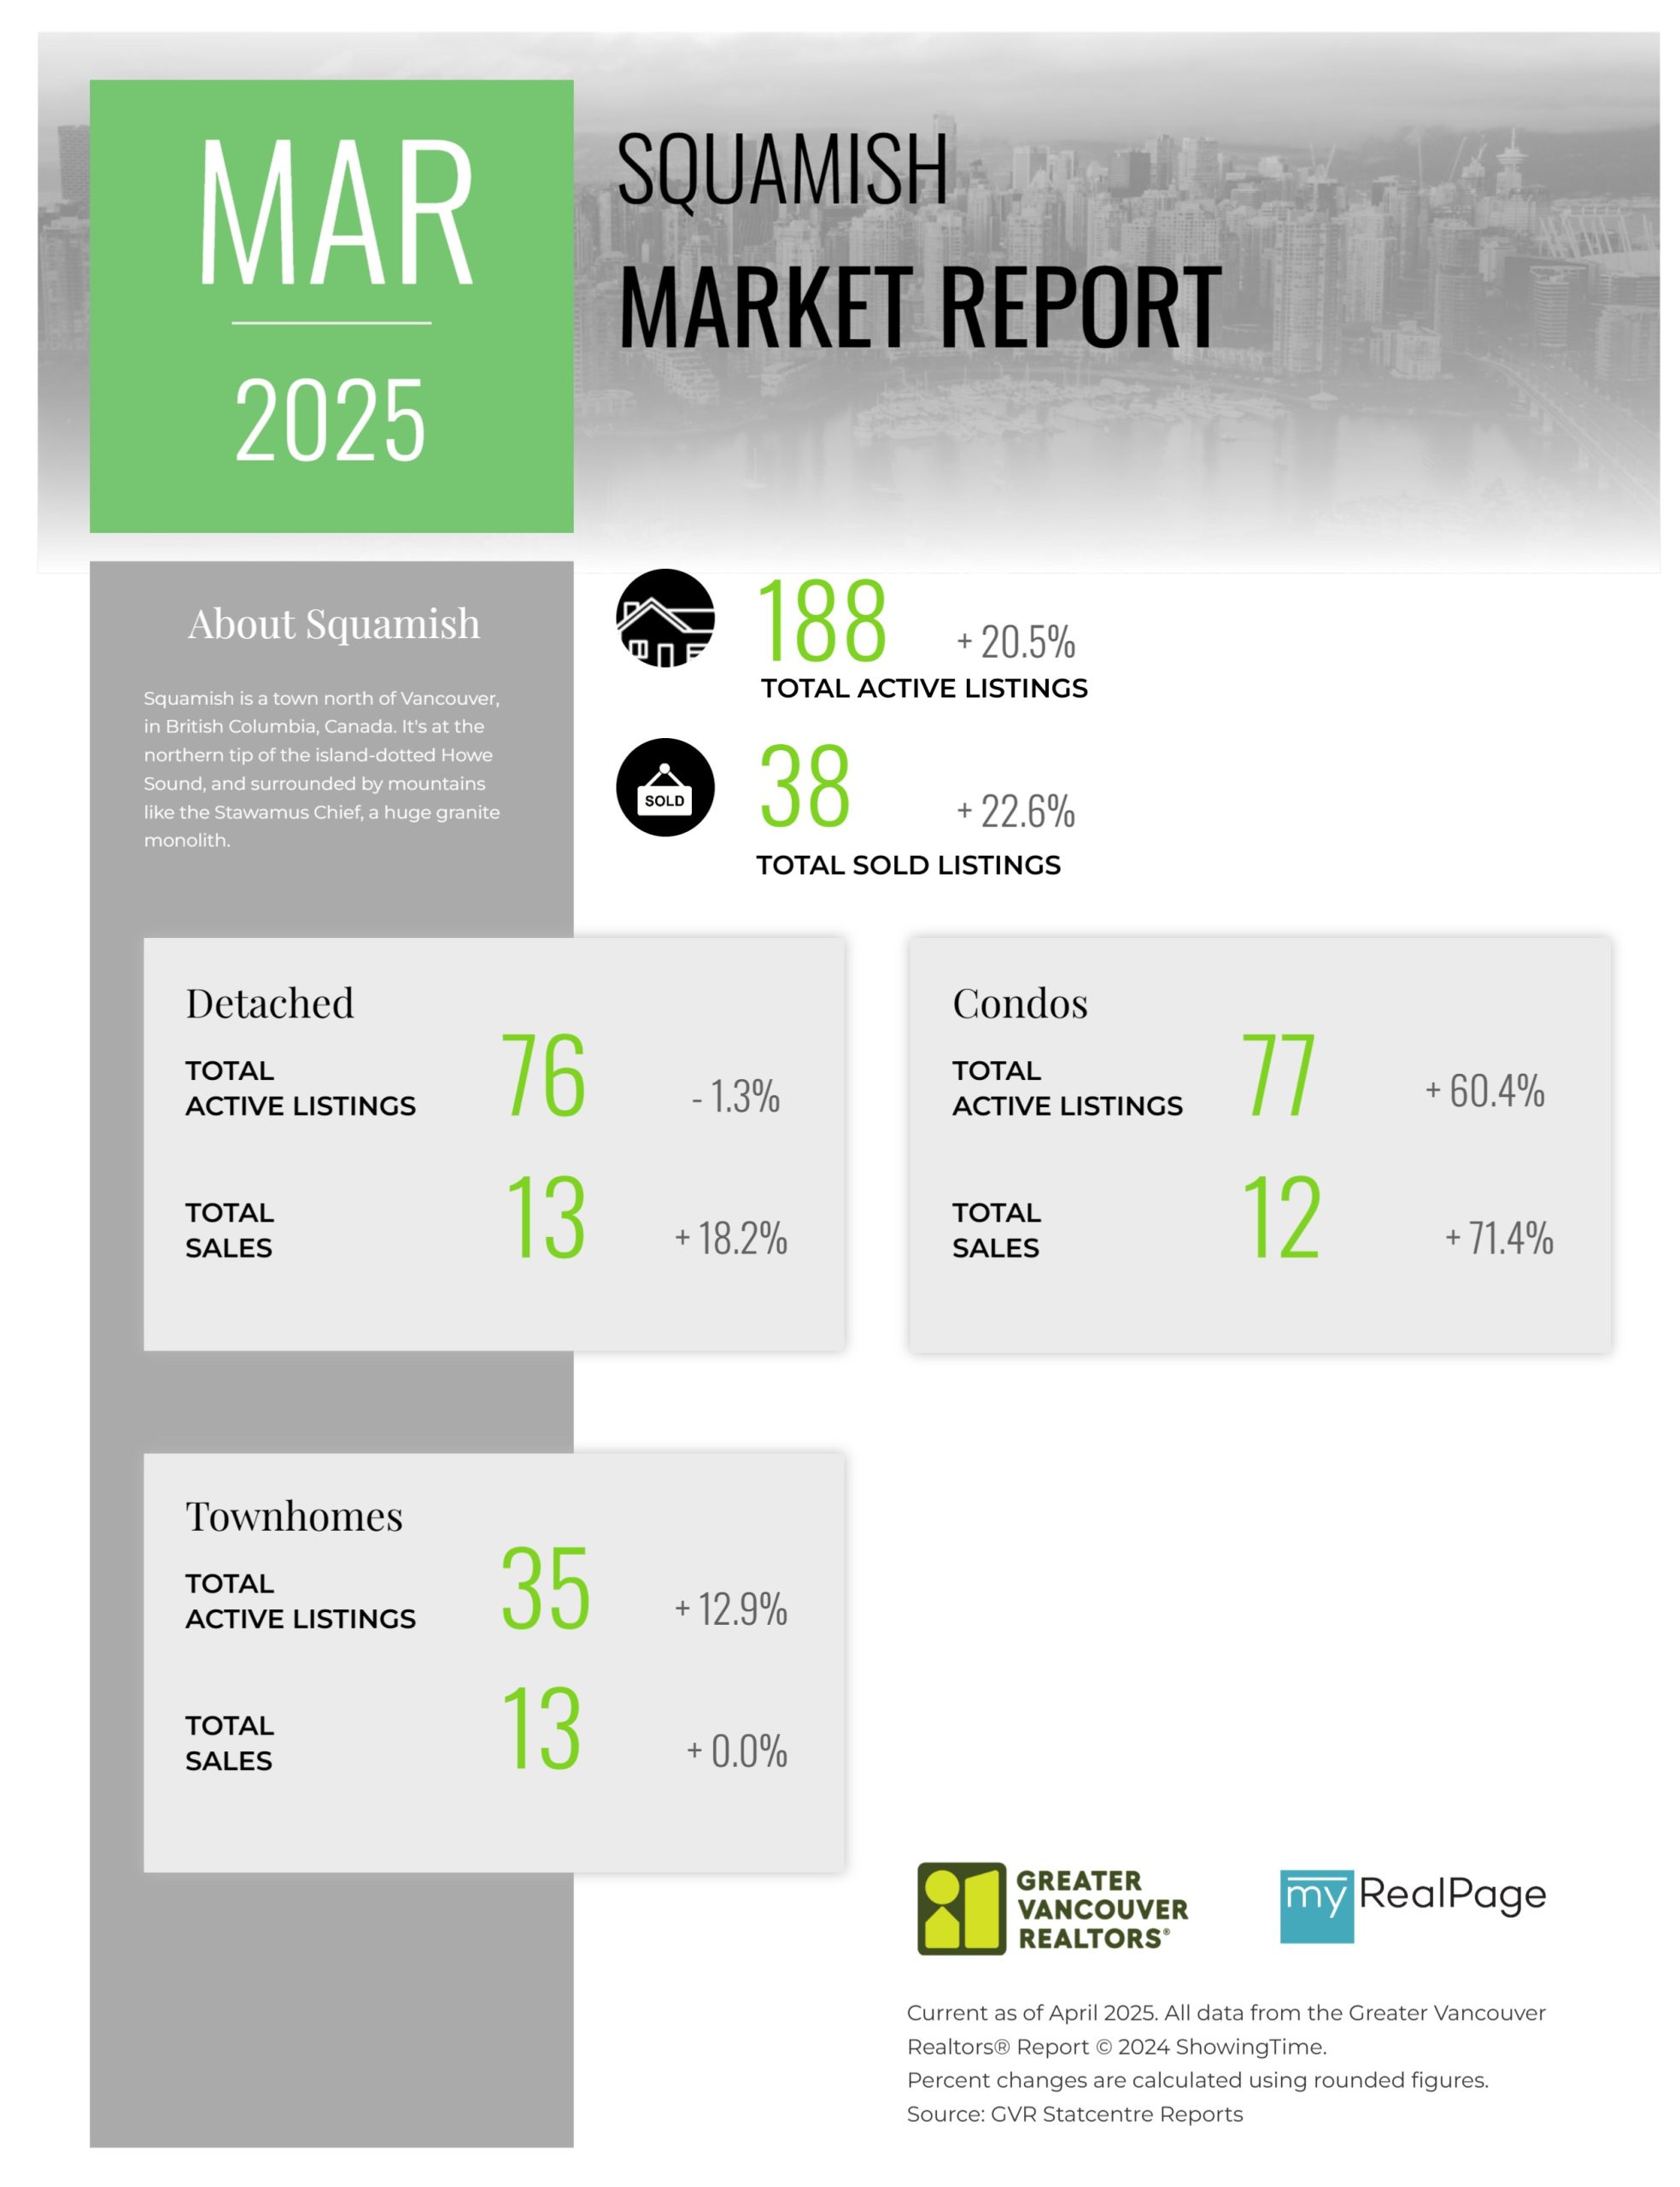
Printable Version – GVR March 2025 Data Infographics Report Squamish
Last Updated on April 7, 2025 by myRealPage
