INFOGRAPHICS: May 2024 GVR Greater Vancouver Market Reports

Home sales down in May while inventory continues to increase
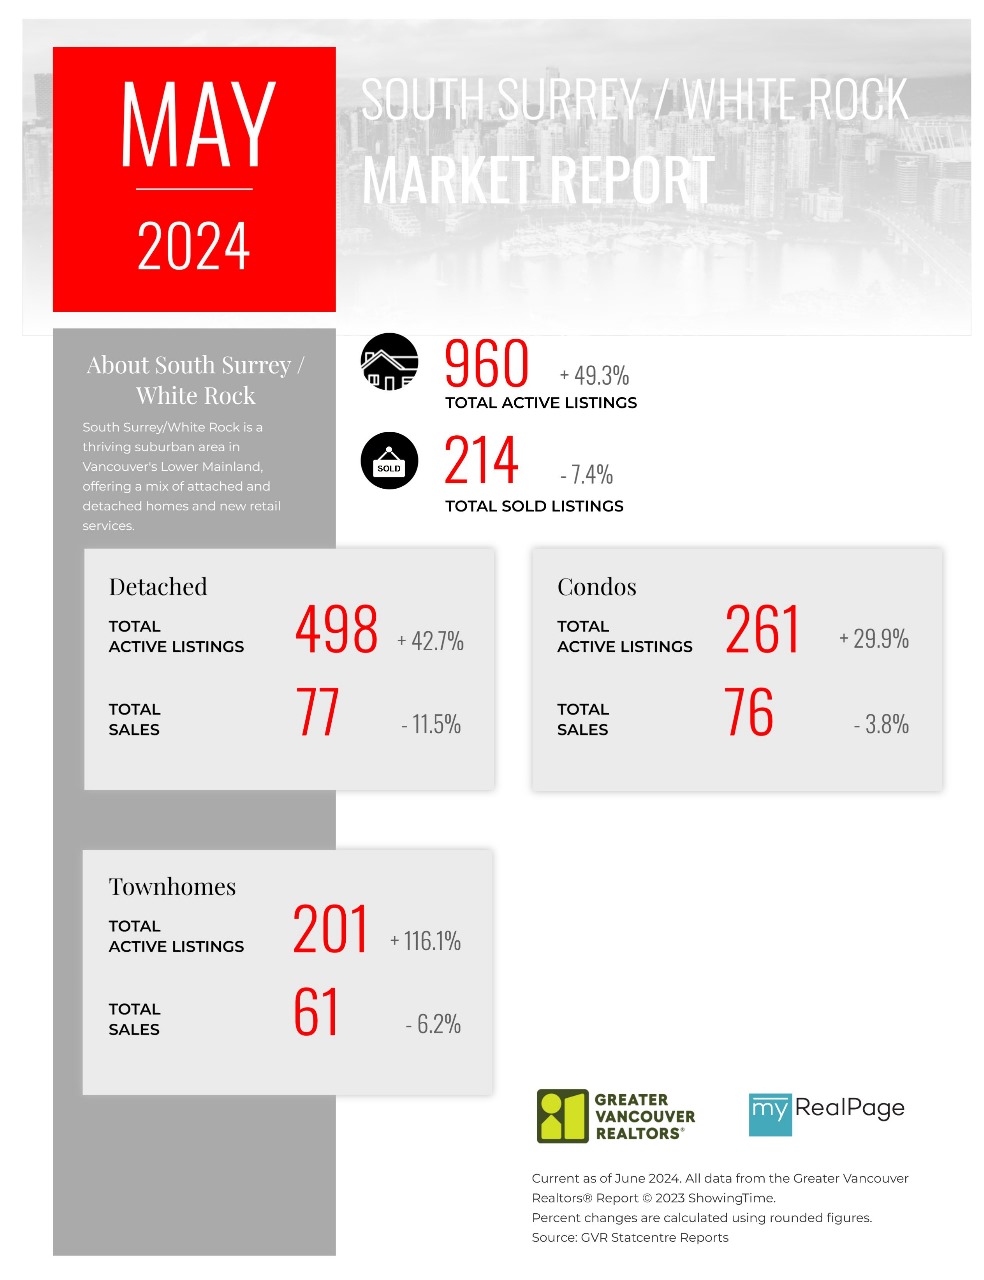
The number of transactions on the Multiple Listing Service® (MLS®) declined in May compared to what is typical for this time of year in Metro Vancouver1. This shift has allowed the inventory of homes available for sale to continue to accumulate with over 13,000 homes now actively listed on the MLS® in the region.
The Greater Vancouver REALTORS® (GVR)2 reports that residential sales in the region totalled 2,733 in May 2024, a 19.9 per cent decrease from the 3,411 sales recorded in May 2023. Last month’s sales total was also down 19.6 per cent from the 10-year seasonal average for May (3,398).
“The surprise in the May data is that sales have come in softer than what we’d typically expect to see at this point in the year, while the number of newly listed homes for sale is carrying some of the momentum seen in the April data.” Andrew Lis, GVR director of economics and data analytics
Read the full report on the REBGV website!
The following data is a comparison between May 2024 and May 2023 numbers, and is current as of June 2024. For last month’s update, you can check out our previous post!
Or follow this link for all our GVR Infographics!
These infographics cover current trends in several areas within the Greater Vancouver region. Click on the images for a larger view!
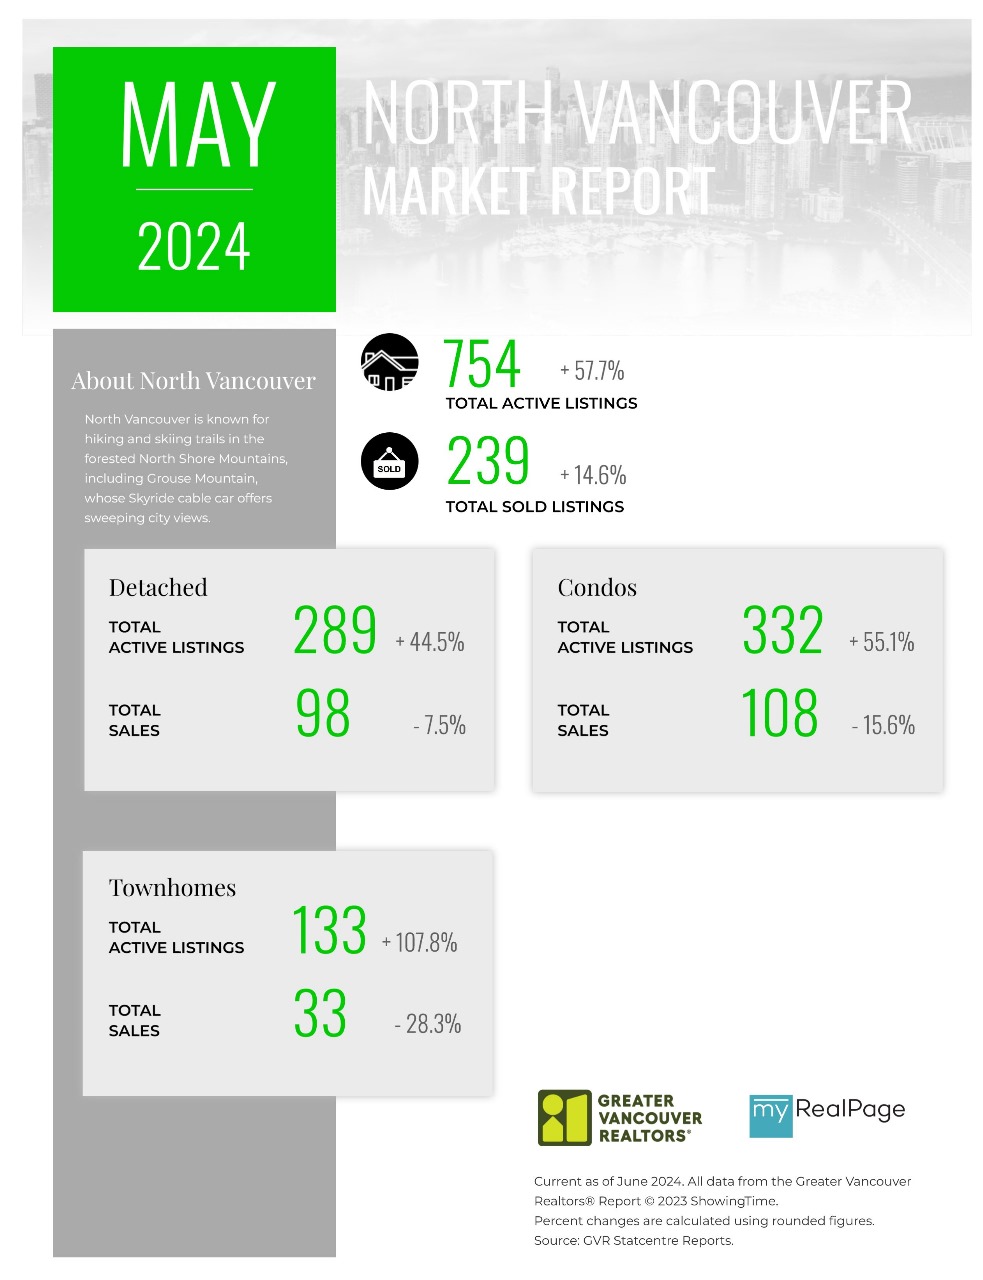
Printable Version – GVR May 2024 Data Infographic Report North Vancouver
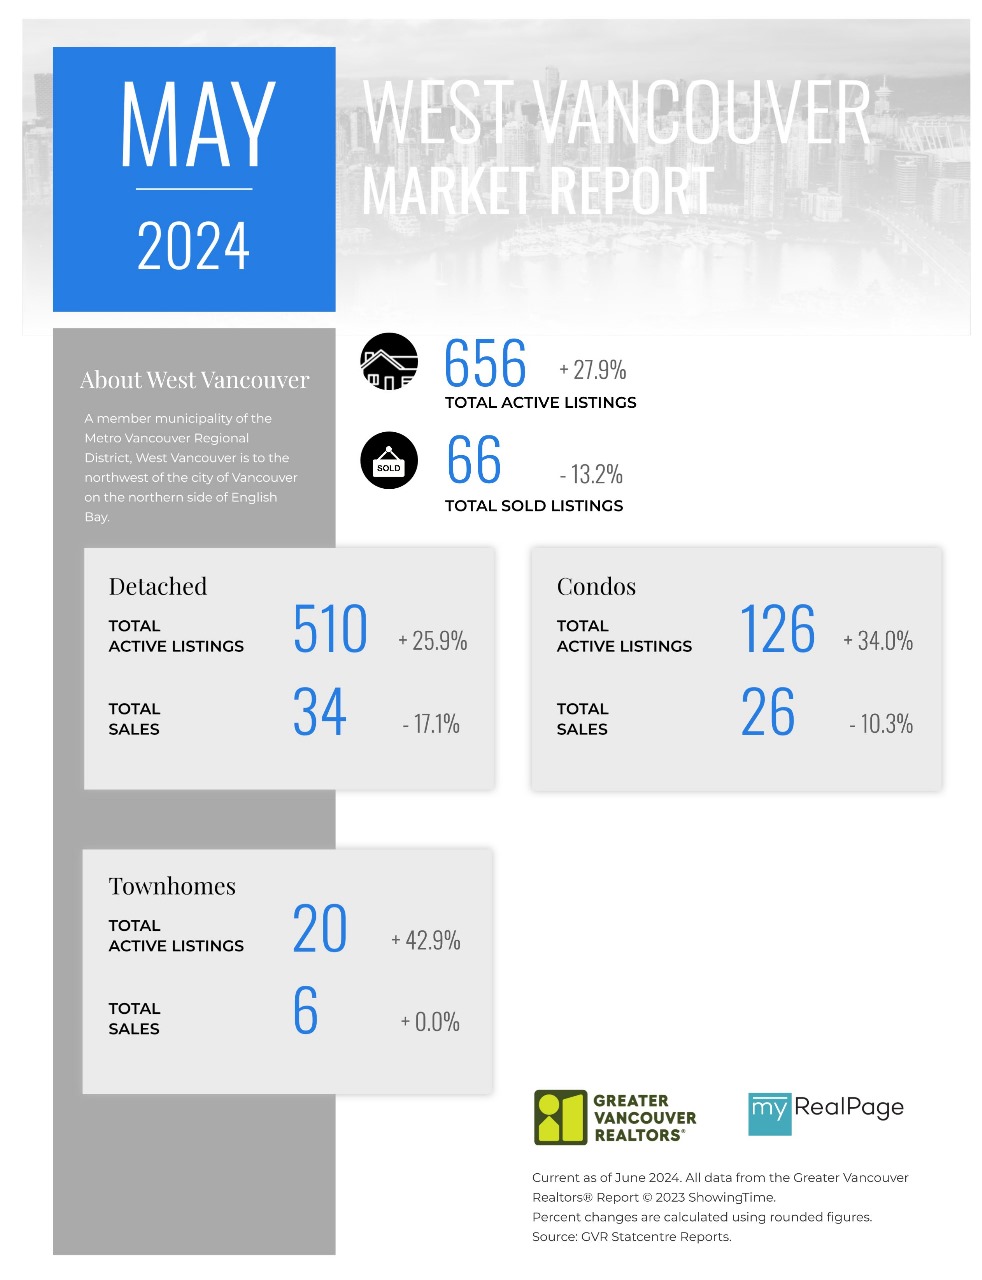
Printable Version – GVR May 2024 Data Infographics Report West Vancouver
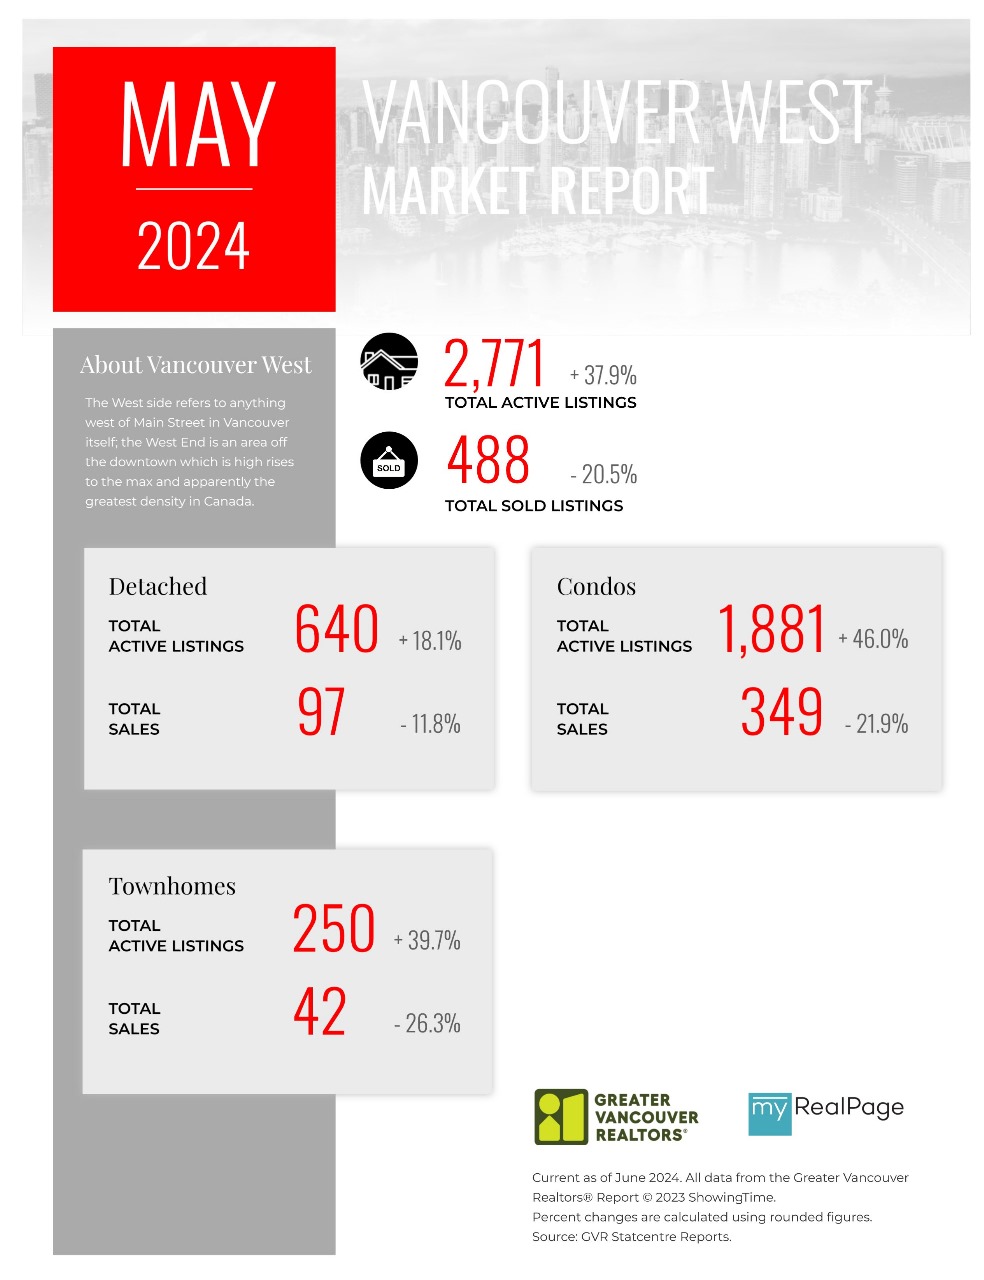
Printable Version – GVR May 2024 Data Infographics Report Vancouver West
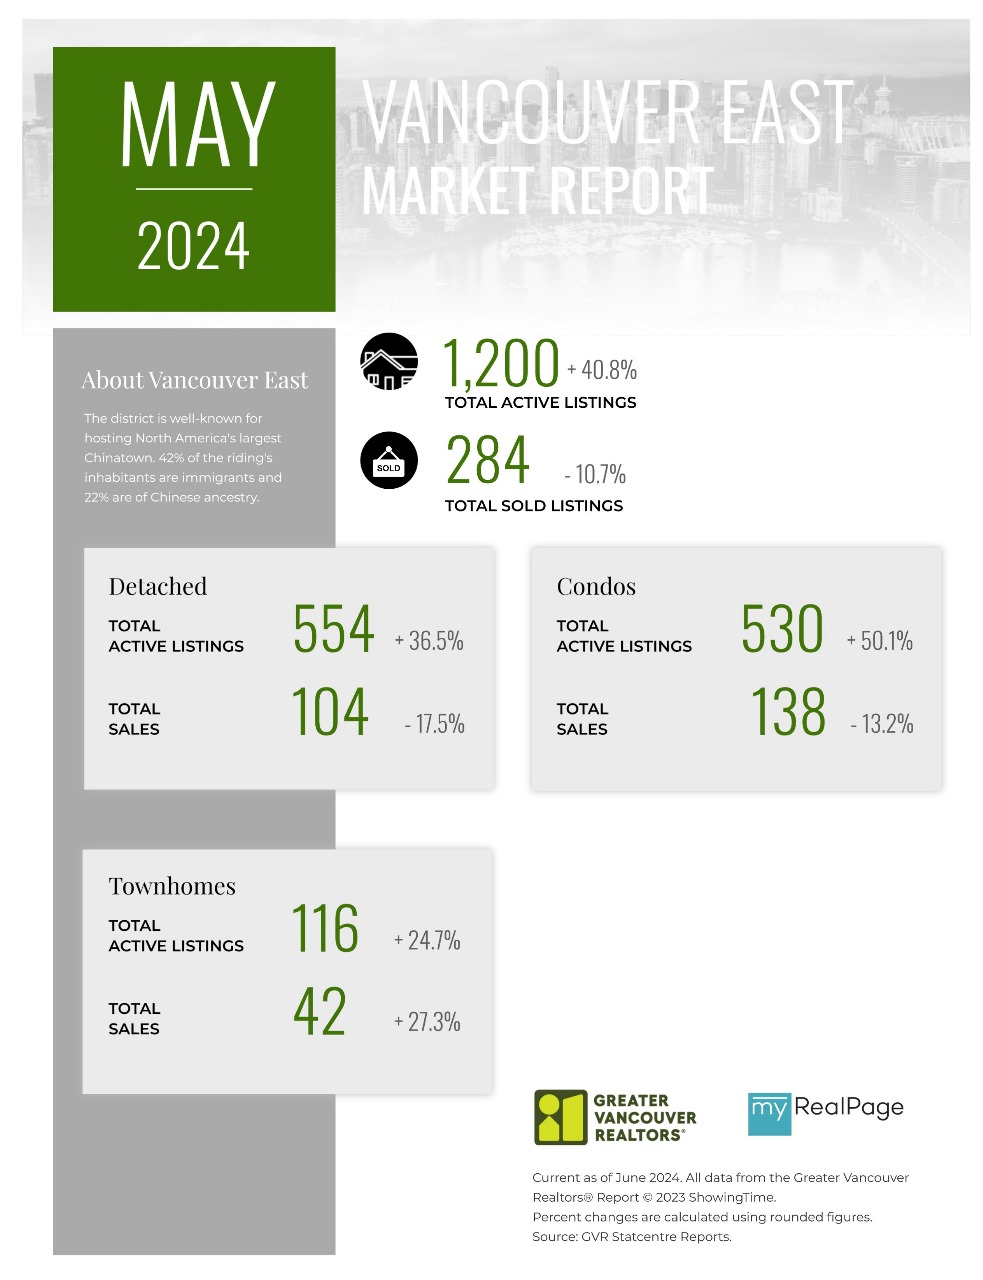
Printable Version – GVR May 2024 Data Infographics Report Vancouver East
Printable Version – GVR May 2024 Data Infographic Report Maple Ridge
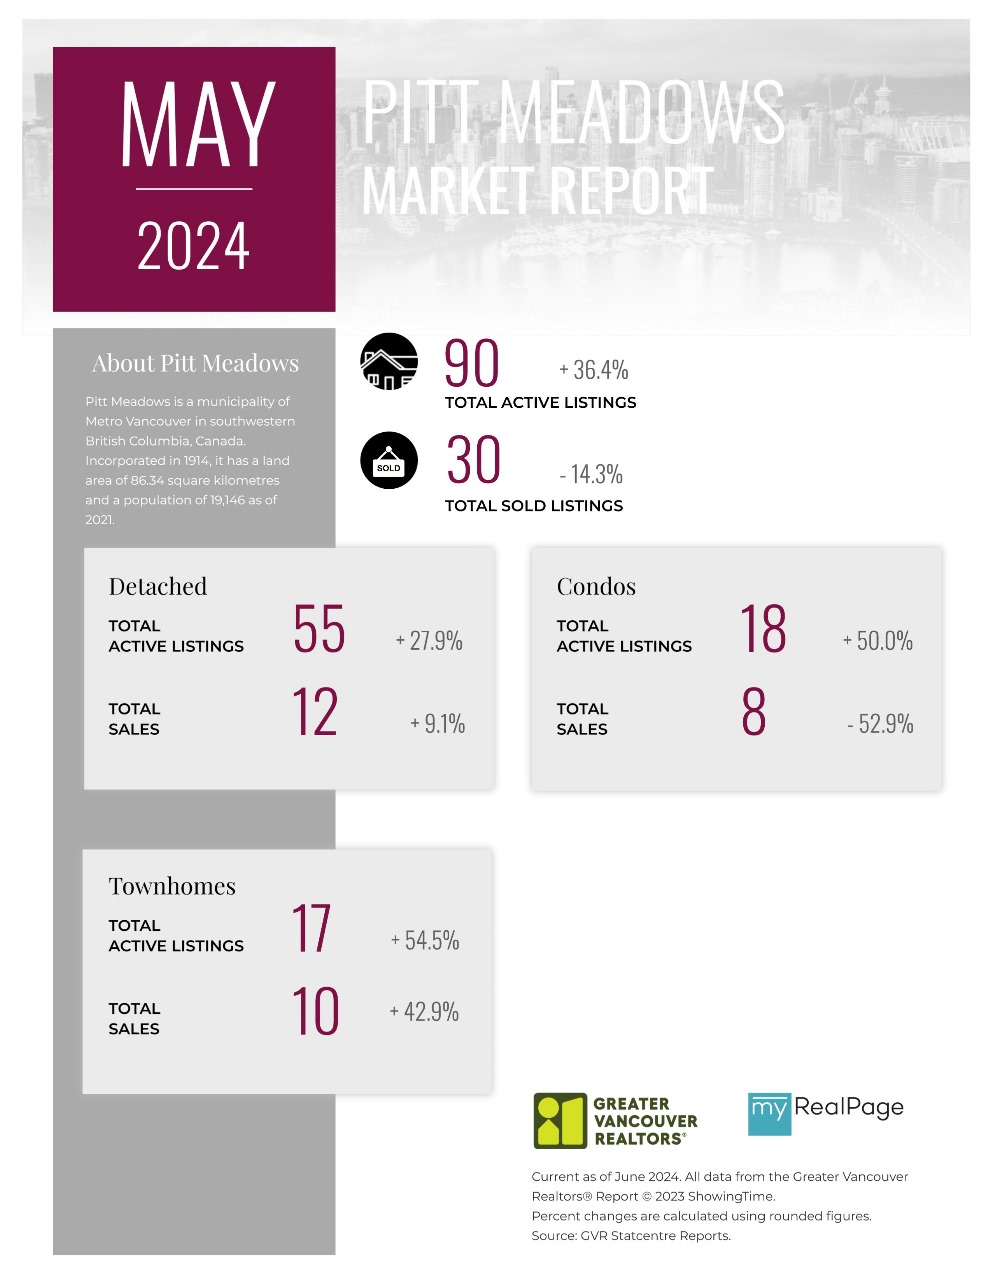
Printable Version – GVR May 2024 Data Infographics Report Pitt Meadows
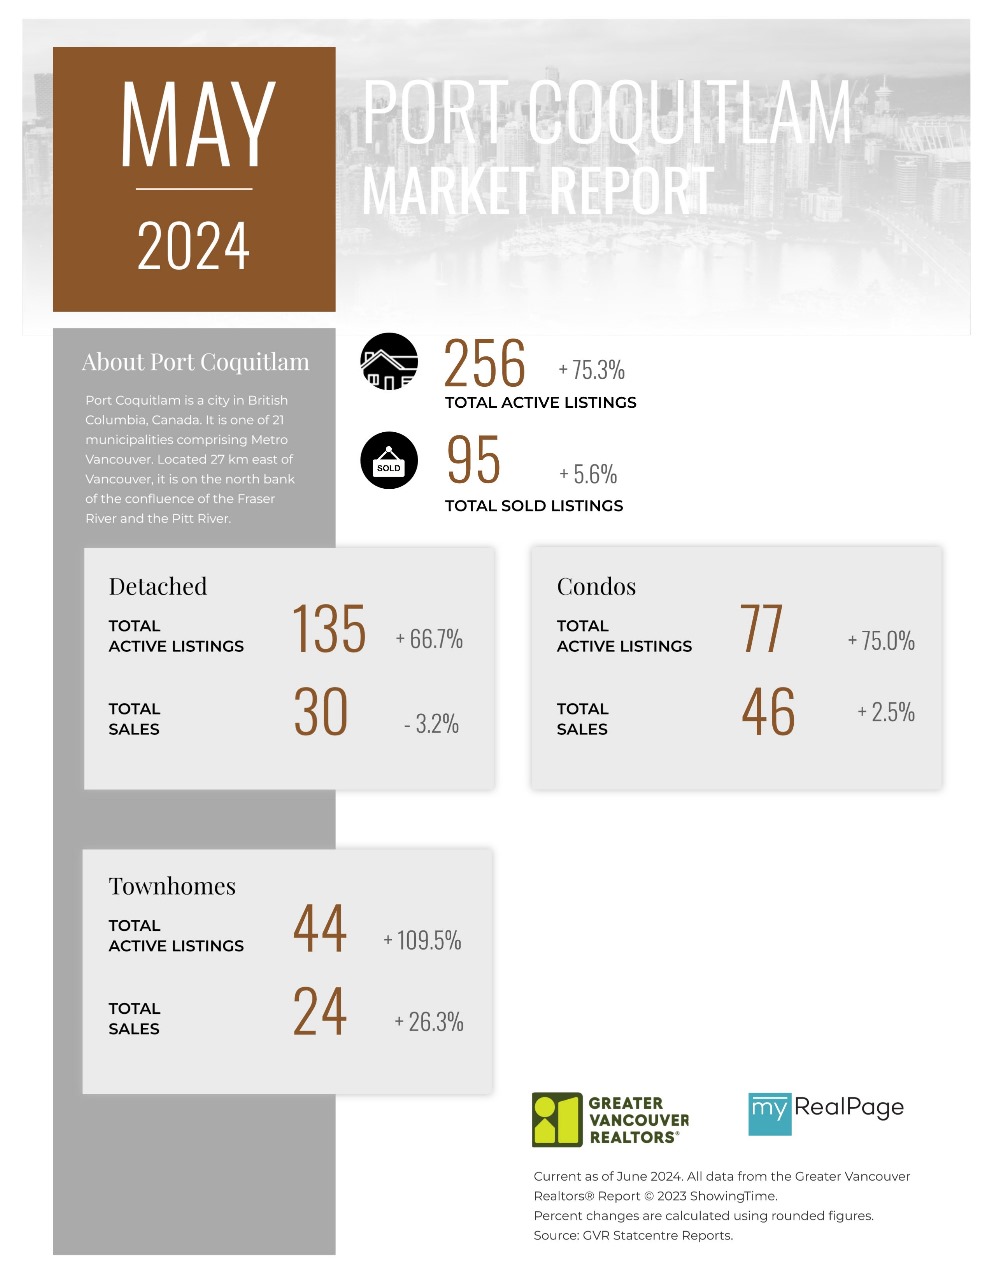
Printable Version – GVR May 2024 Data Infographics Report Port Coquitlam
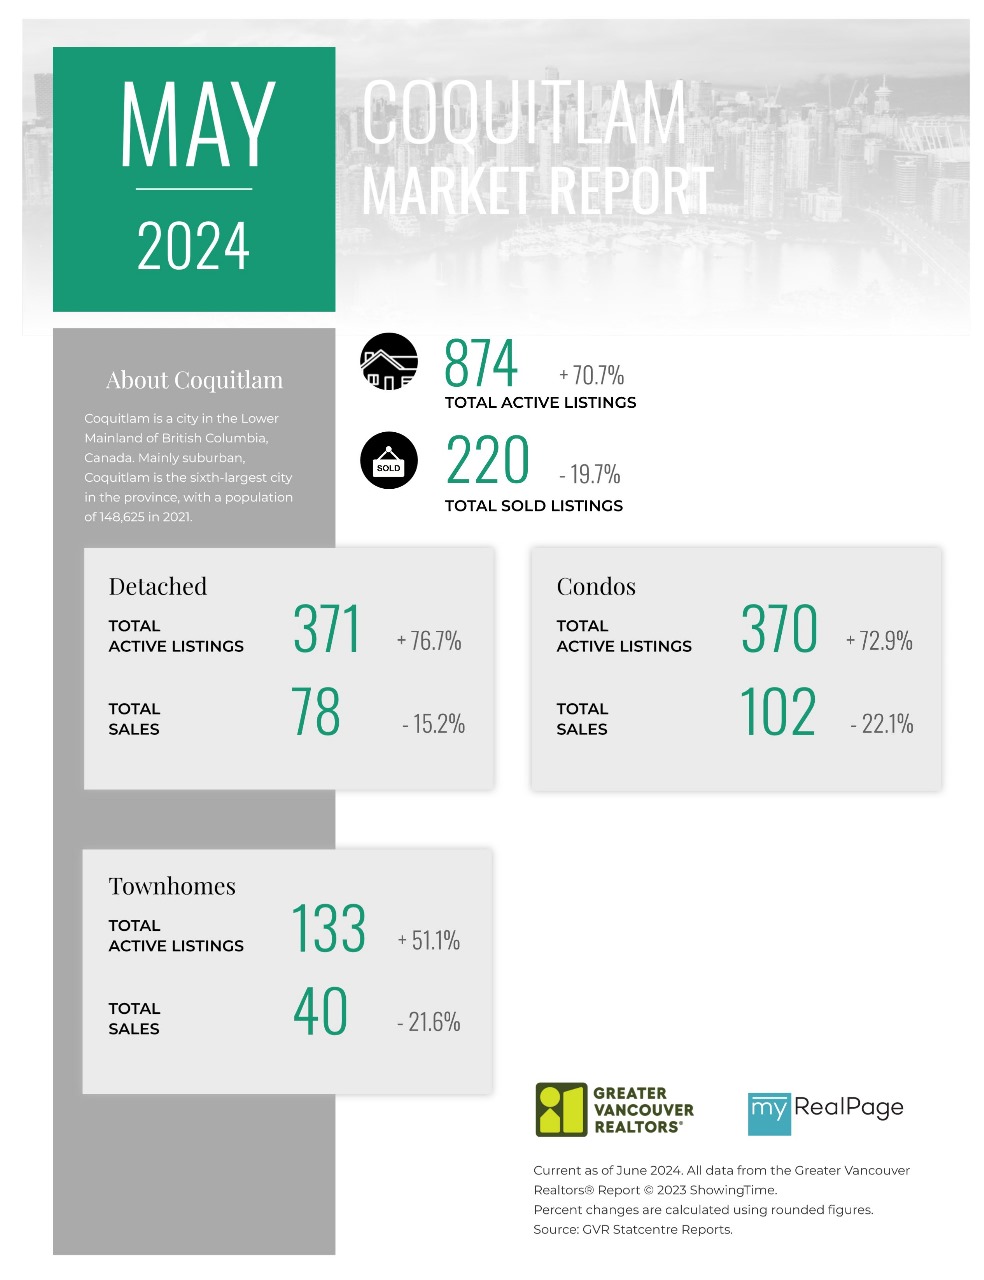
Printable Version – GVR May 2024 Data Infographics Report Coquitlam
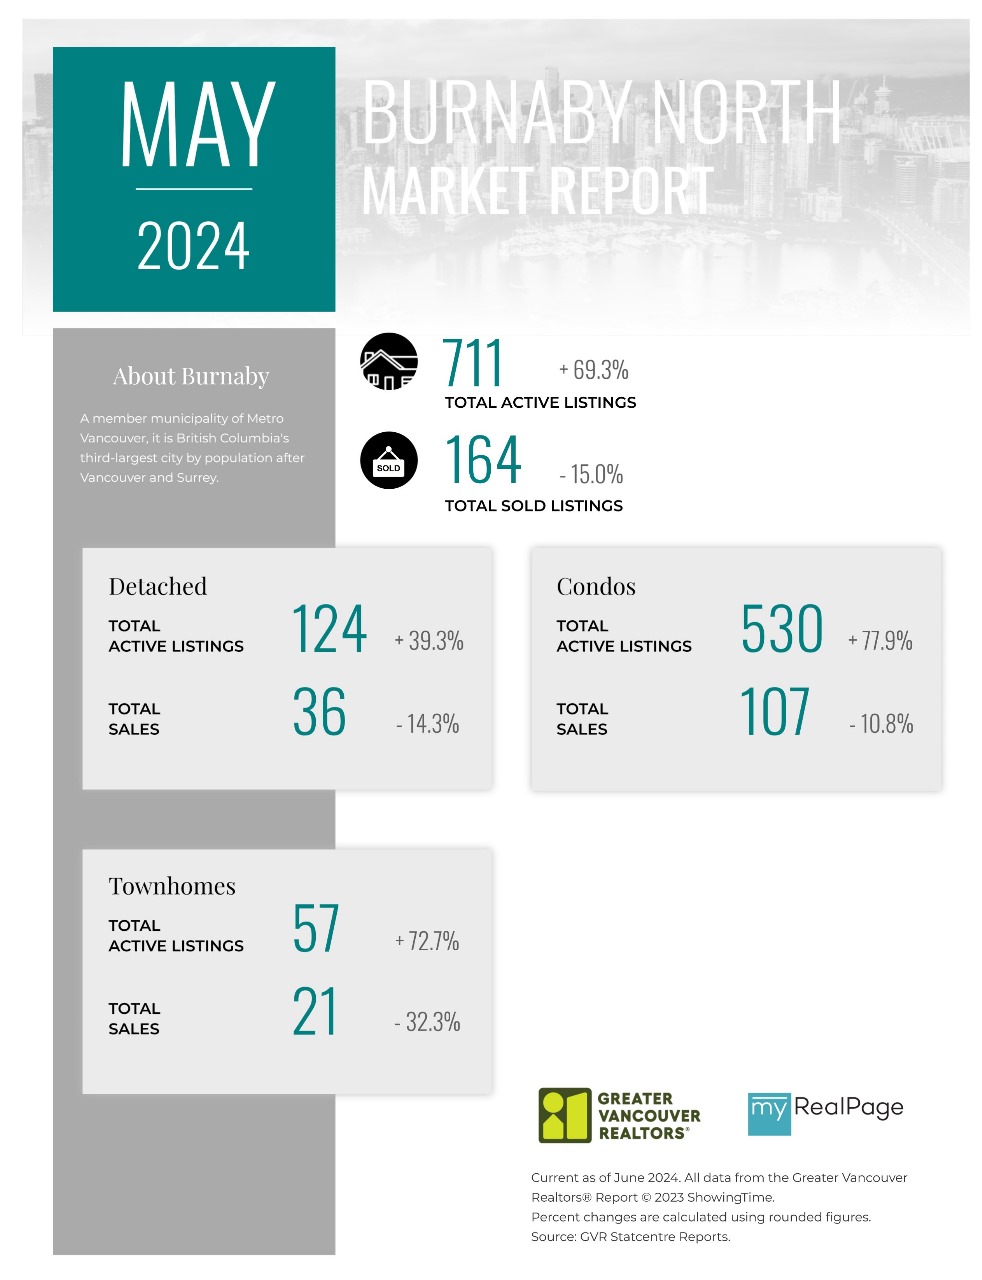
Printable Version – GVR May 2024 Data Infographic Report Burnaby North
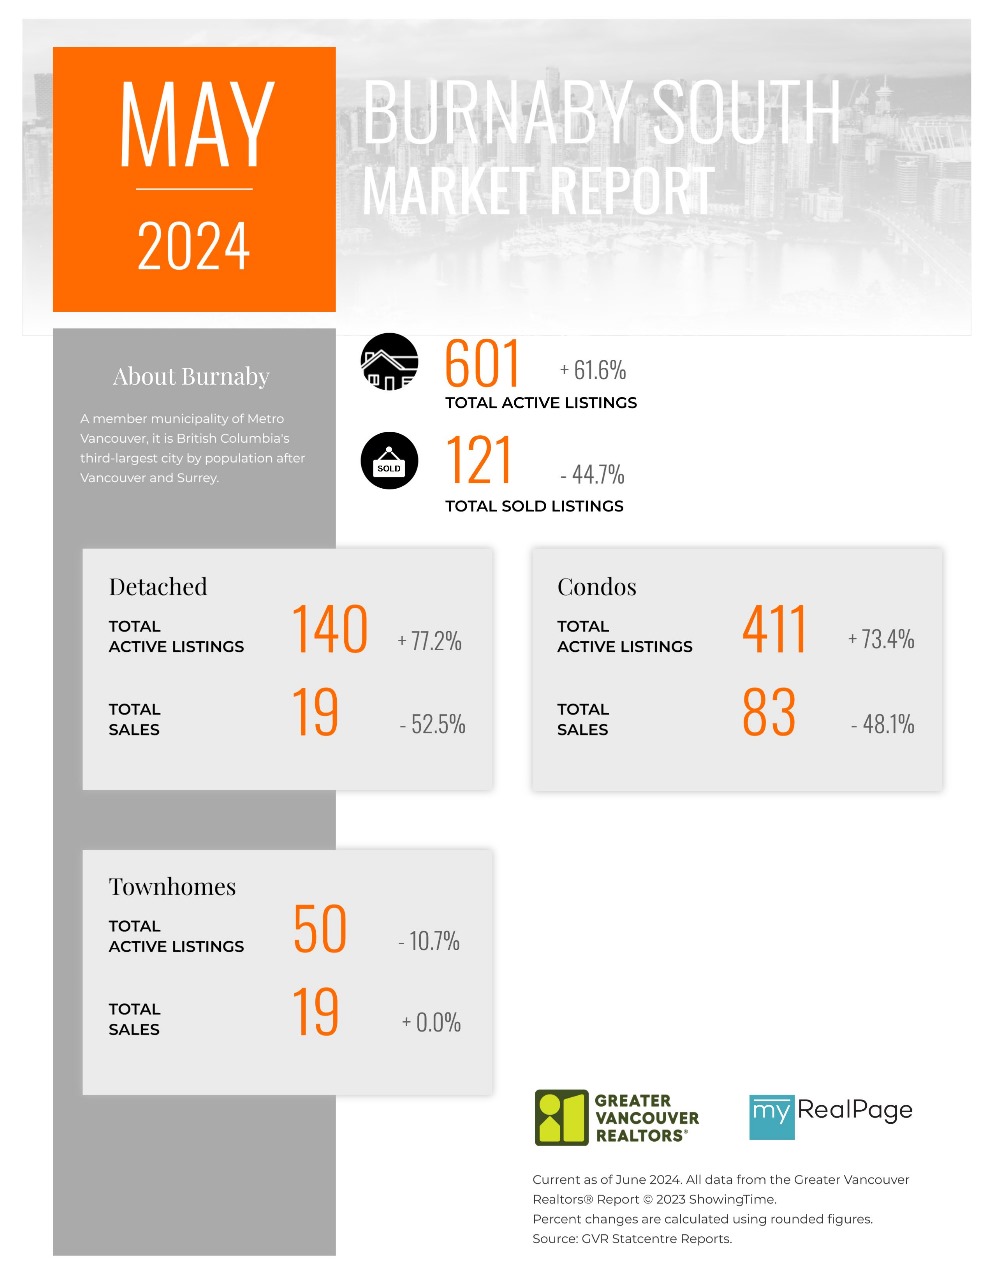
Printable Version – GVR May 2024 Data Infographics Report Burnaby South
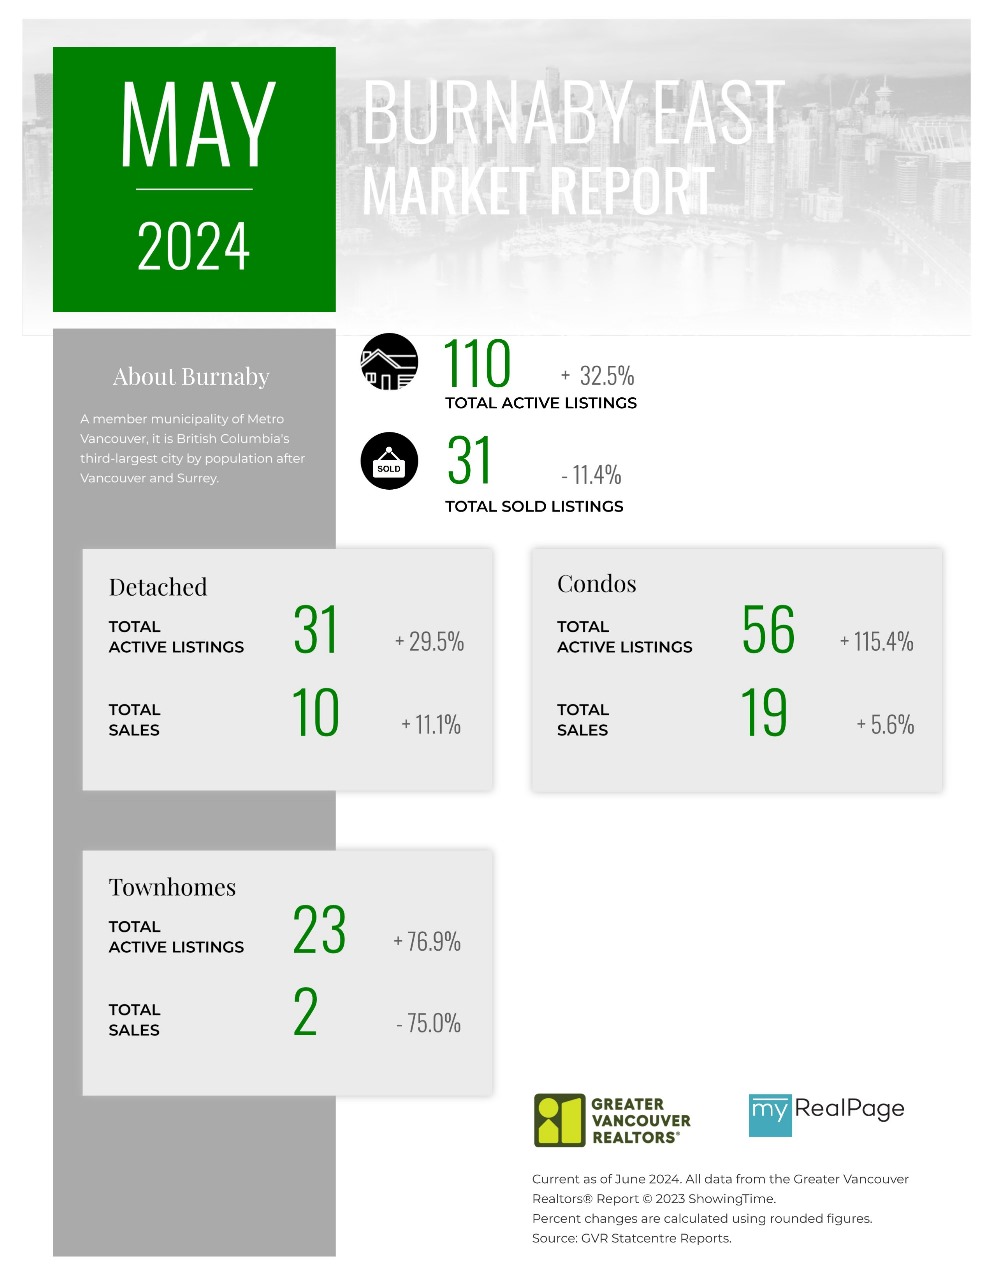
Printable Version – GVR May 2024 Data Infographics Report Burnaby East
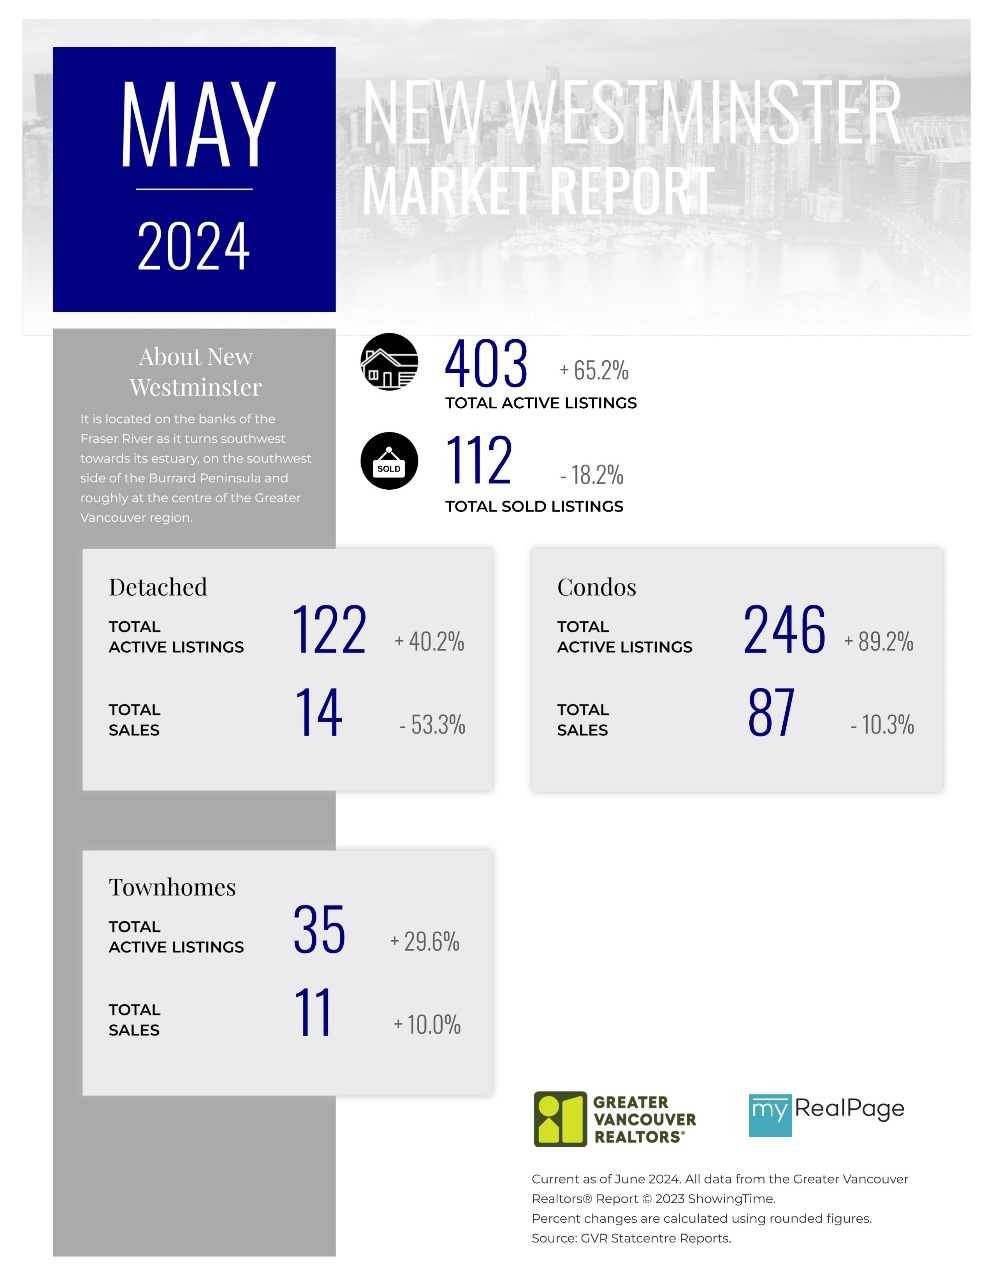
Printable Version – GVR May 2024 Data Infographics Report New Westminster
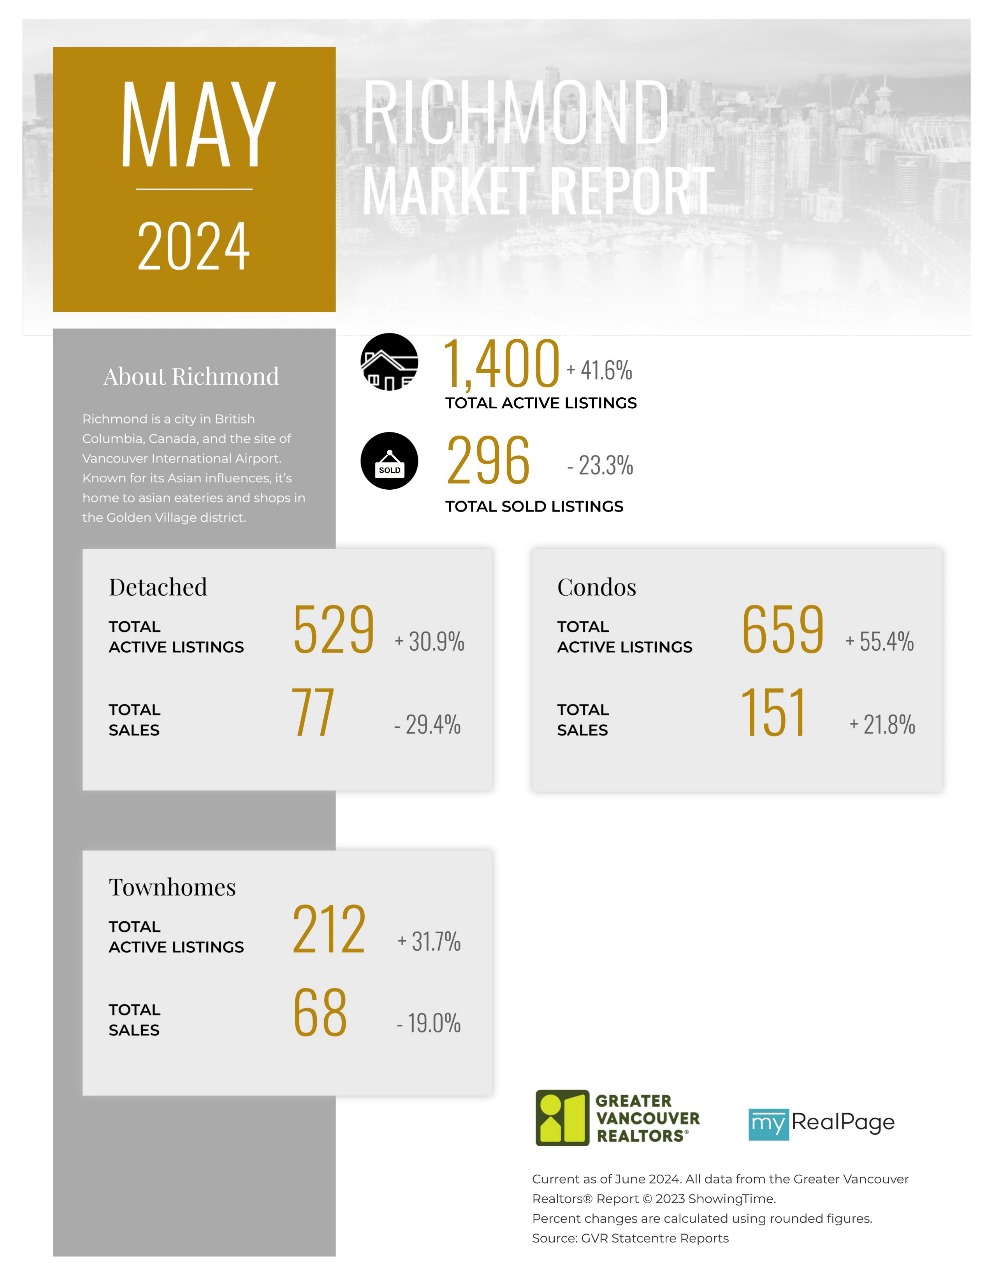
Printable Version – GVR May 2024 Data Infographics Report Richmond
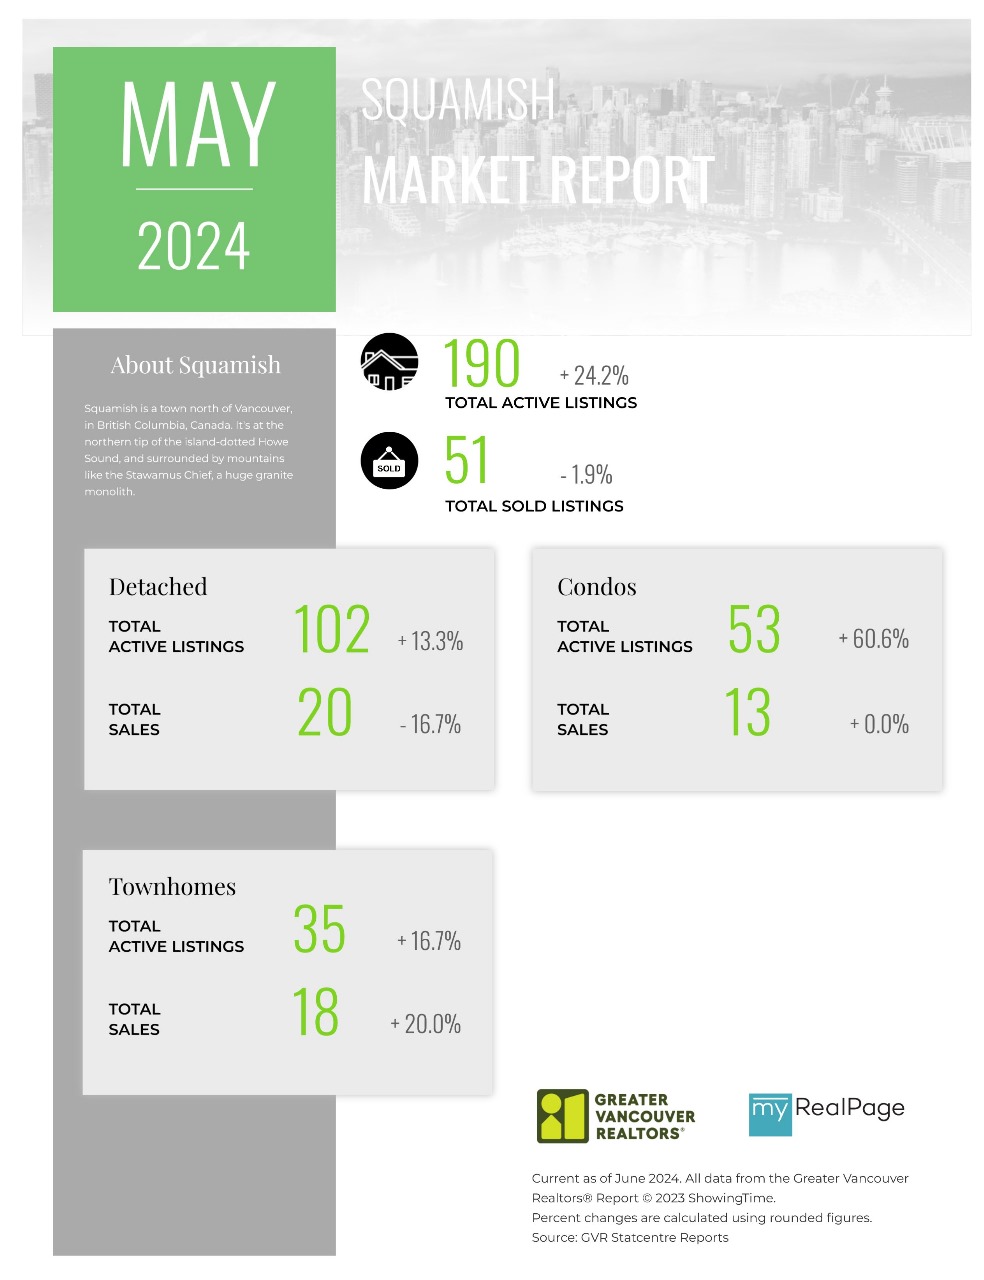
Printable Version – GVR May 2024 Data Infographics Report Squamish

Last Updated on June 7, 2024 by myRealPage
