INFOGRAPHICS: February 2026 GVR Greater Vancouver Market Reports

New normal for Metro Vancouver’s housing market continues
Metro Vancouver home sales registered on the MLS® in February continued the recent trend of slower-than-average sales, seeing a ten per cent decline over the same period last year.
The Greater Vancouver REALTORS® (GVR) reports that residential sales in the region totalled 1,648 in February 2026, a 9.8 per cent decrease from the 1,827 sales recorded in February 2025. This was 28.7 per cent below the 10-year seasonal average (2,310).
“With each passing data point, the pace of sales running well-below long-term averages are no longer a surprise – it’s become the new norm. A surprising finding this February, however, is that home sellers appear less eager to list their homes relative to last year with new listings down about seven percent, mostly driven by fewer listings in the apartment segment.” Andrew Lis, GVR chief economist and vice-president data analytics
Read the full report on the REBGV website!
The following data is a comparison between February 2026 and February 2025 numbers, and is current as of March of 2026. For last month’s update, you can check out our previous post!
Or follow this link for all our GVR Infographics!
These infographics cover current trends in several areas within the Greater Vancouver region. Click on the images for a larger view!
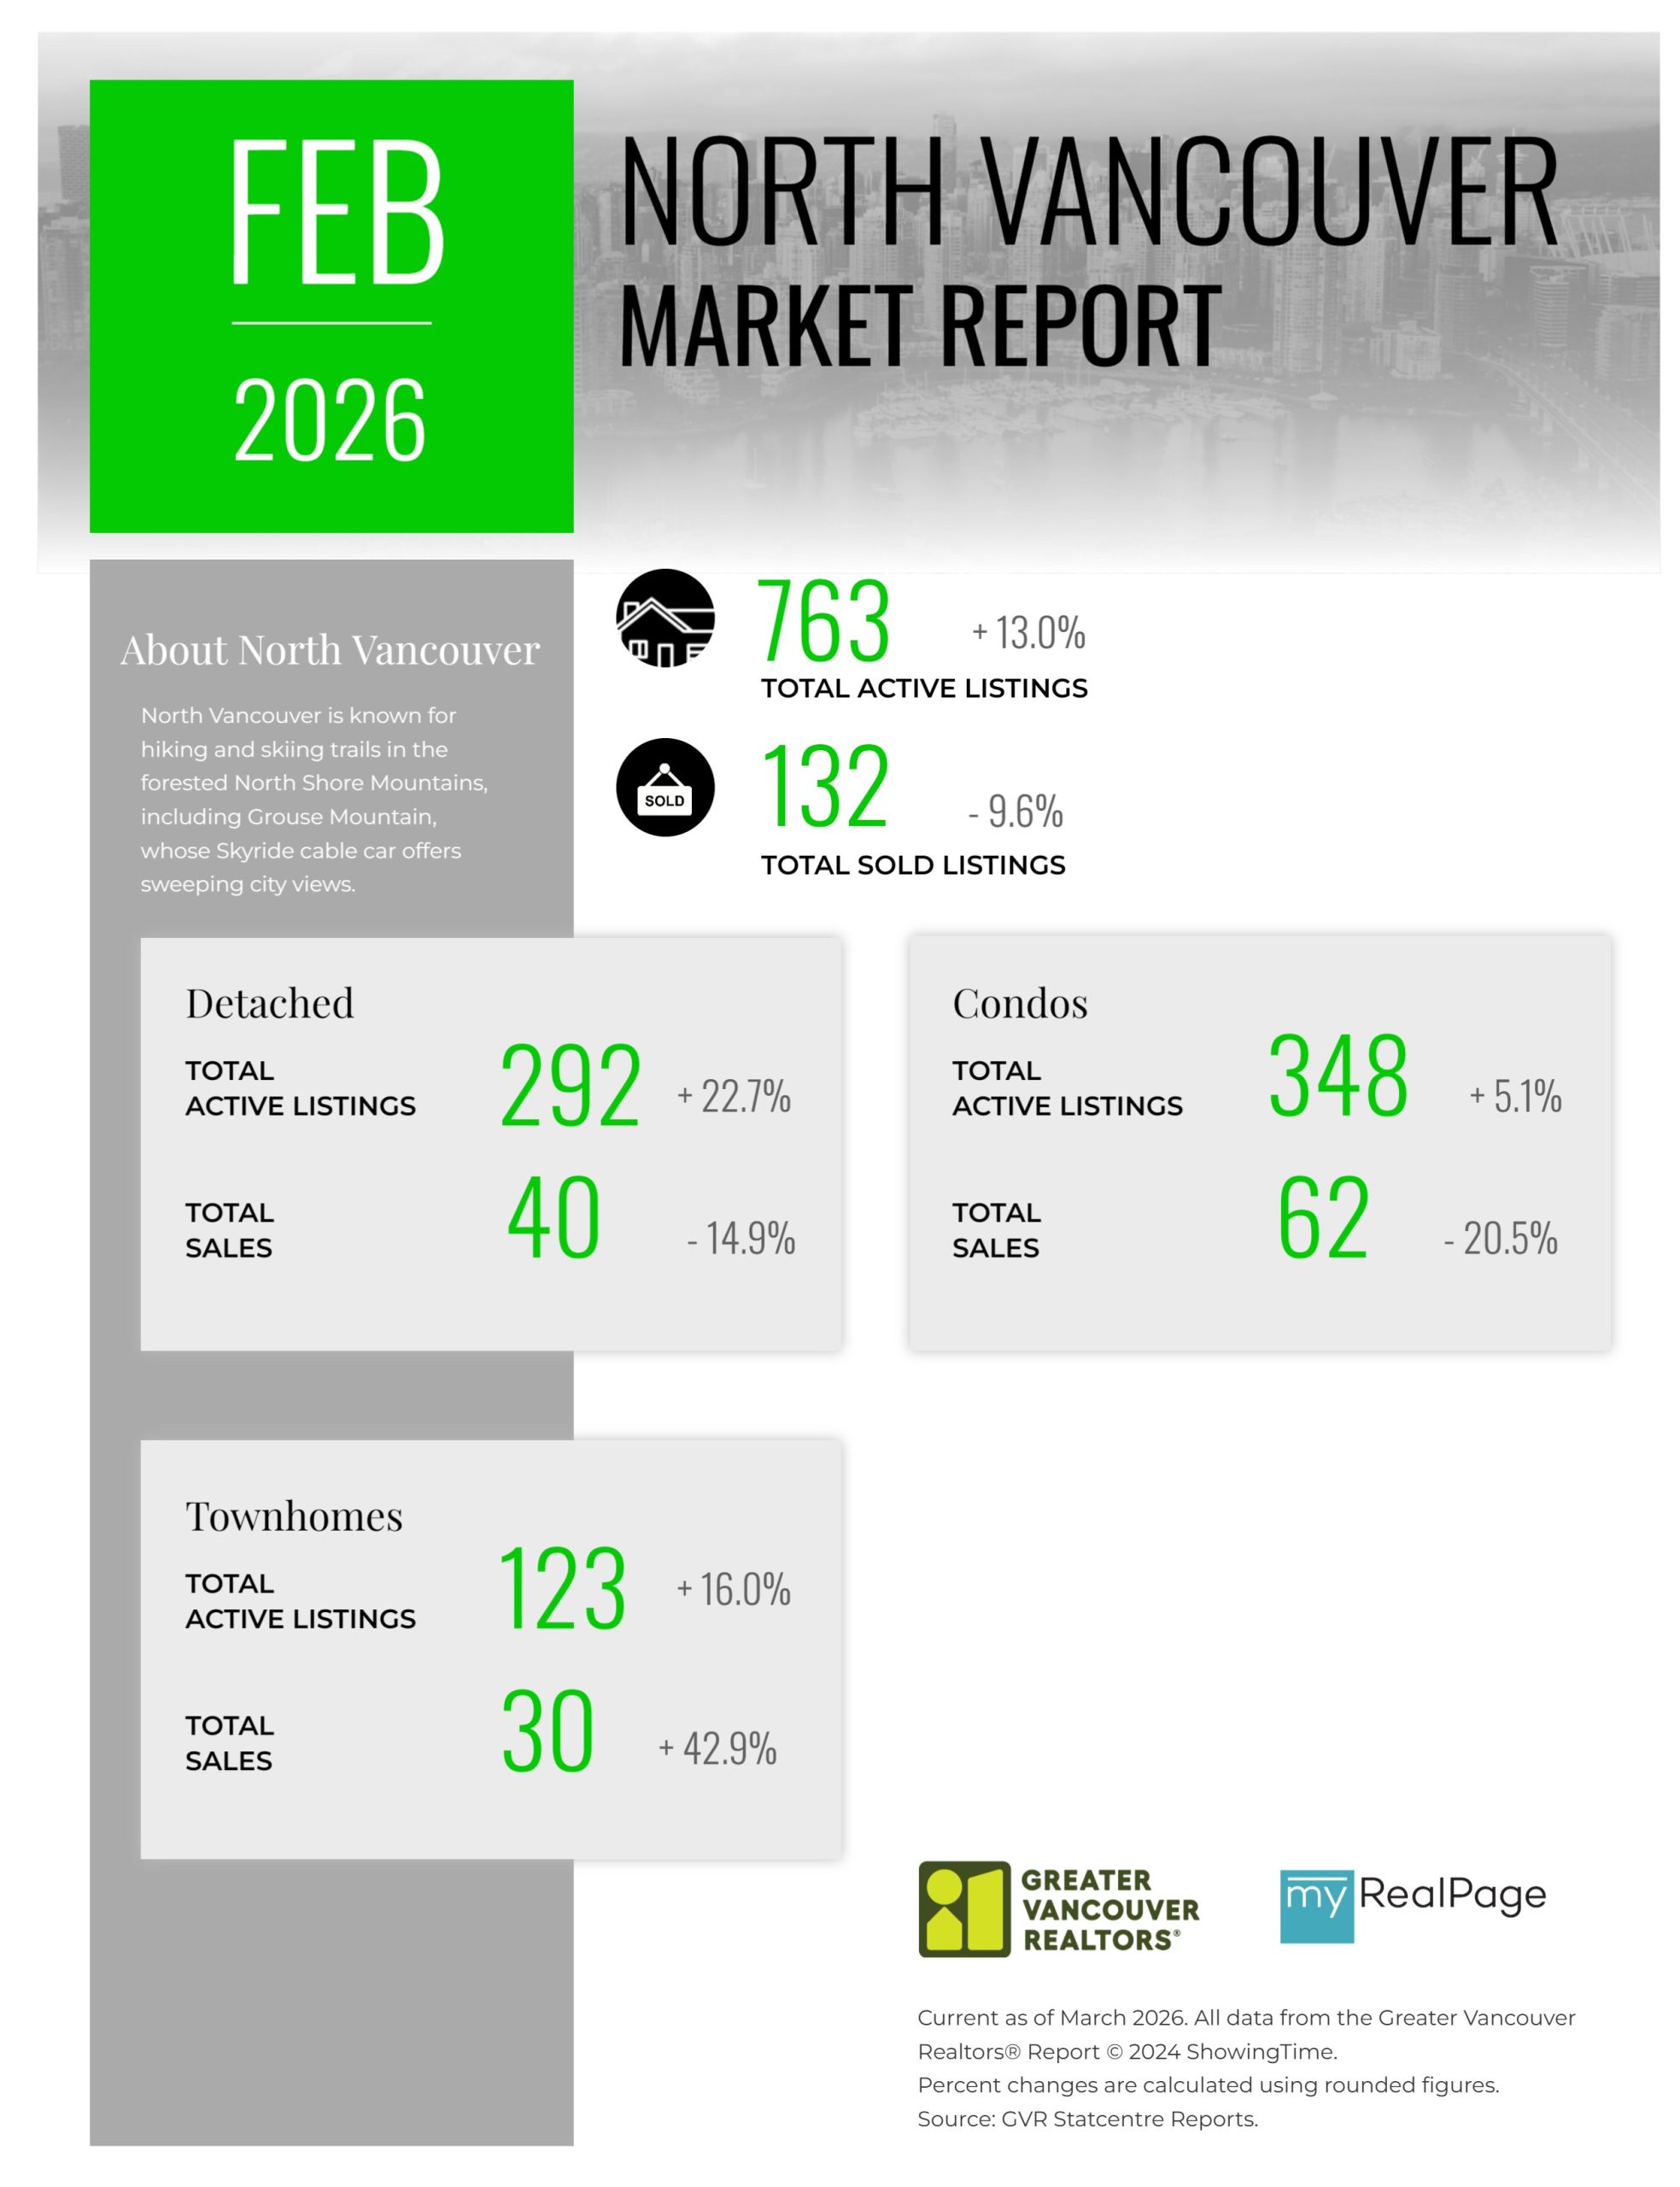
Printable Version – GVR February 2026 Data Infographic Report North Vancouver
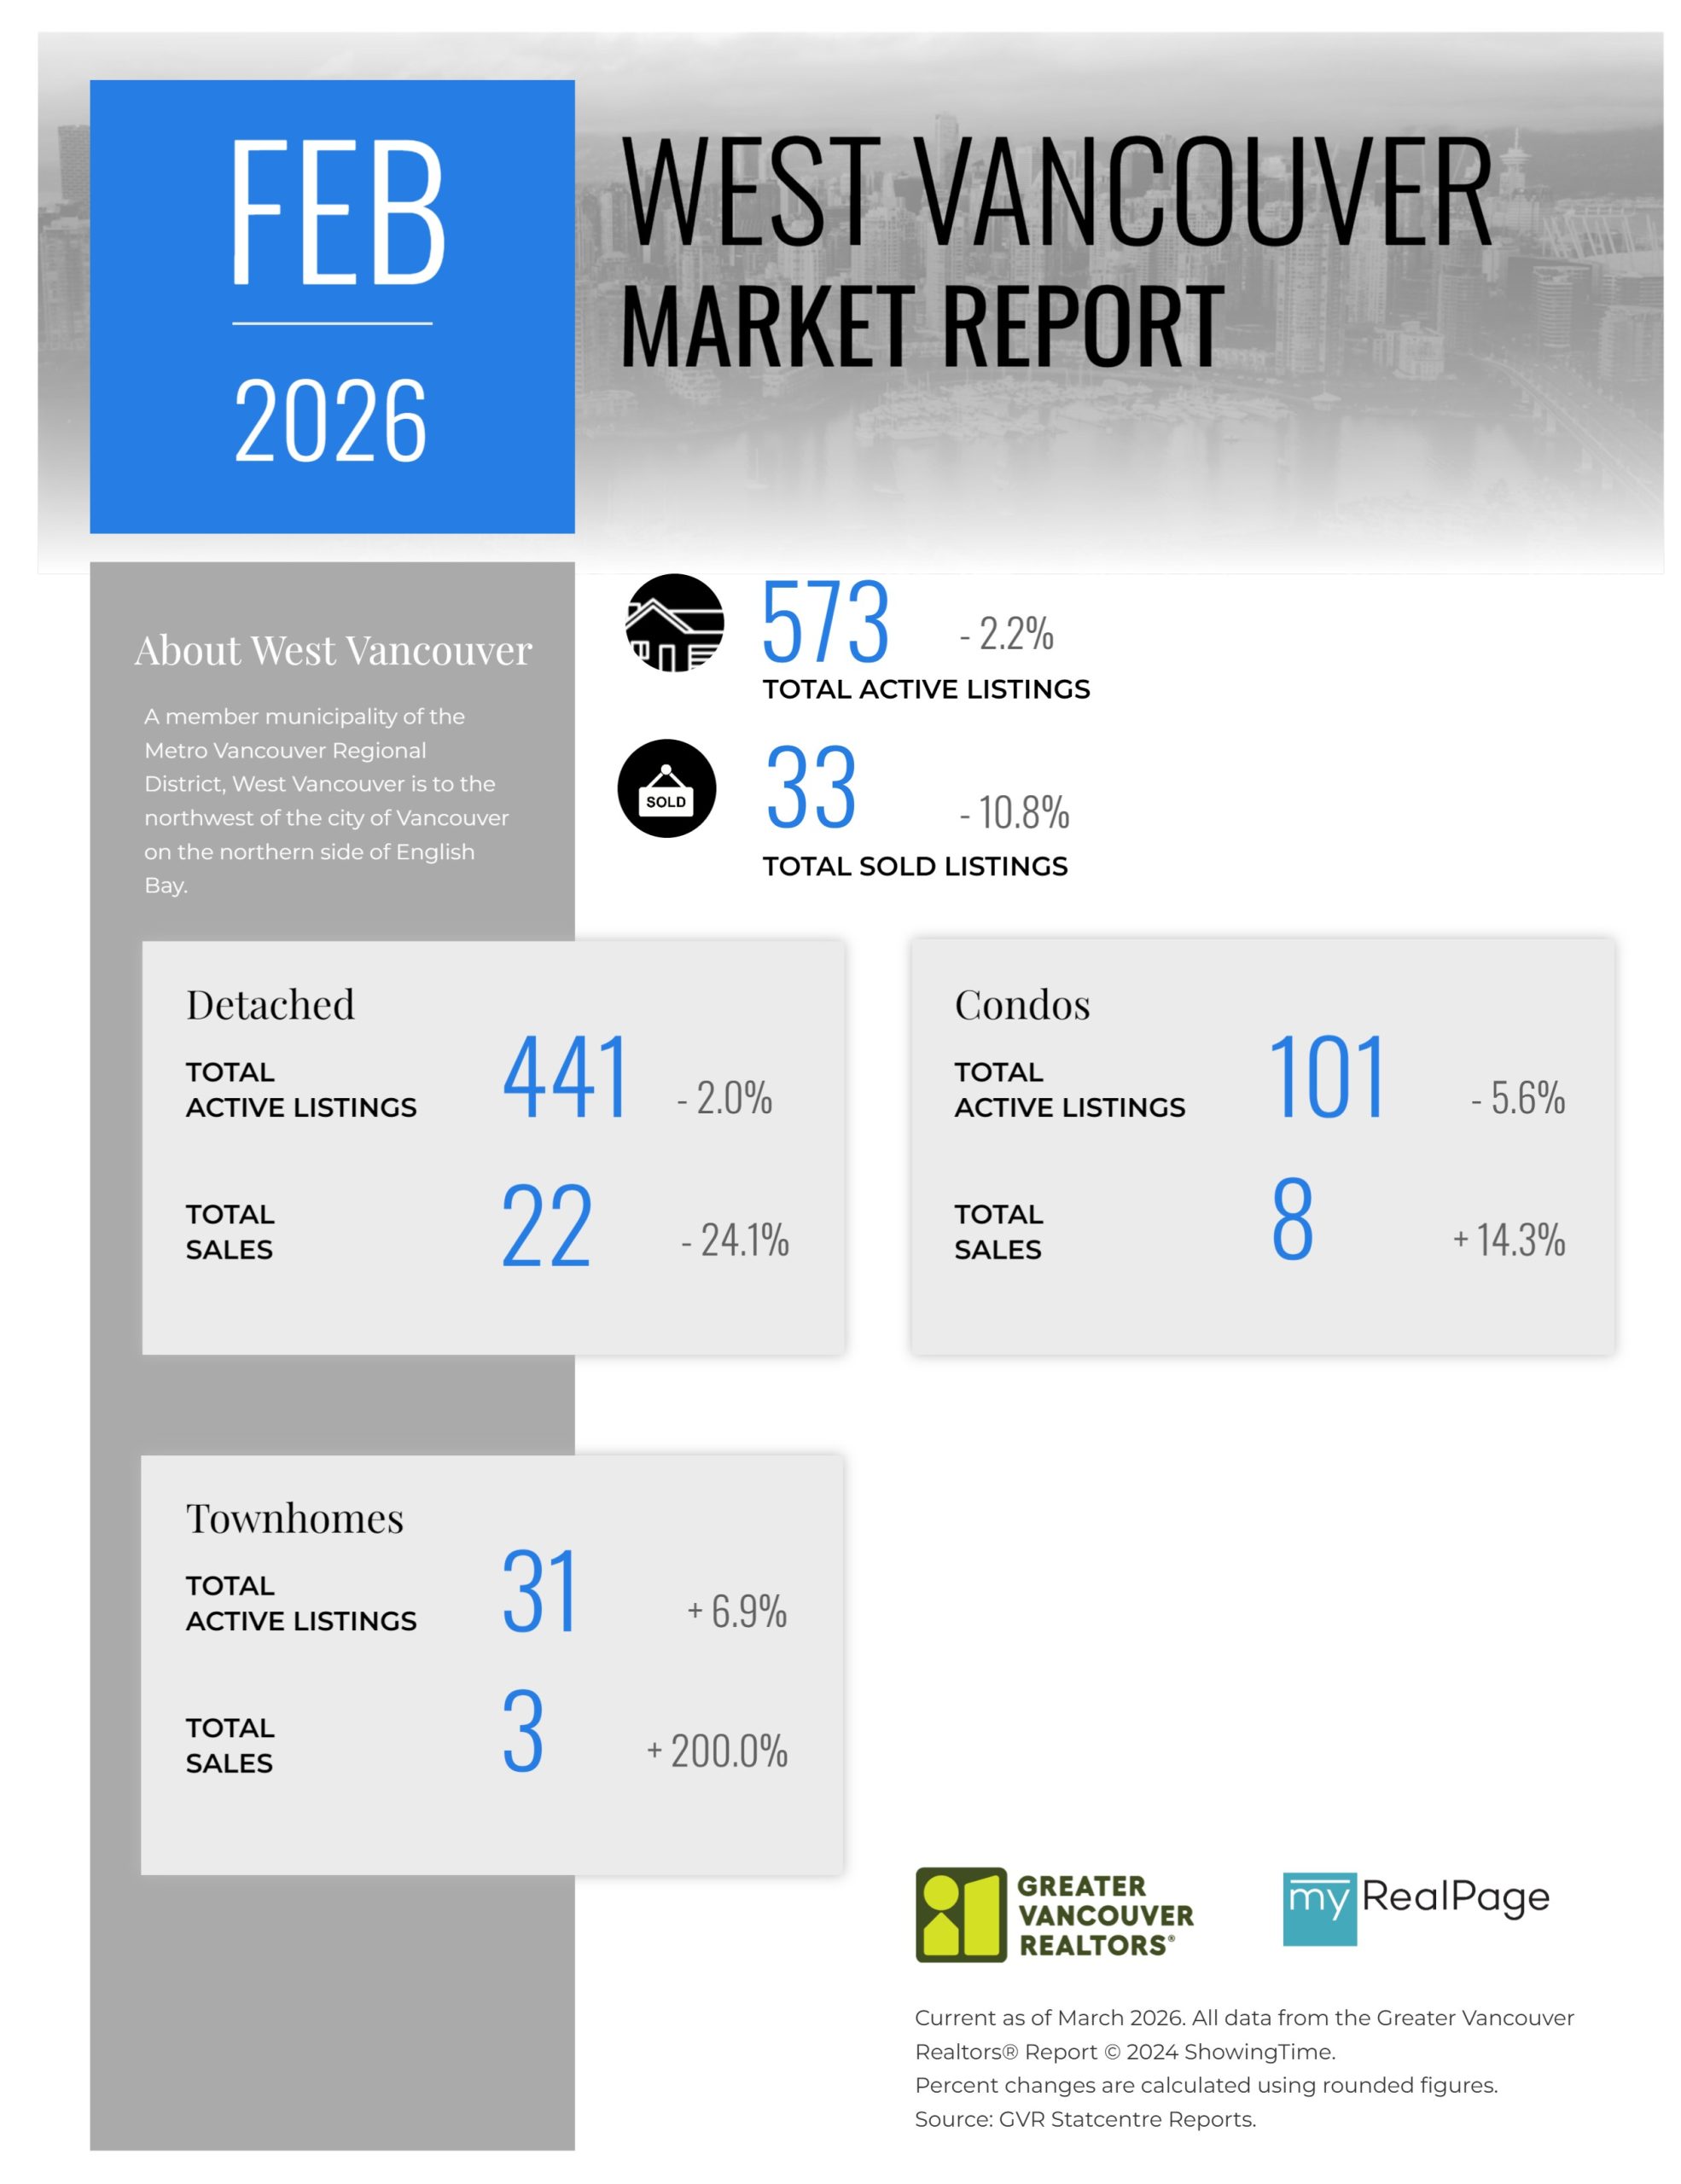
Printable Version – GVR February 2026 Data Infographics Report West Vancouver
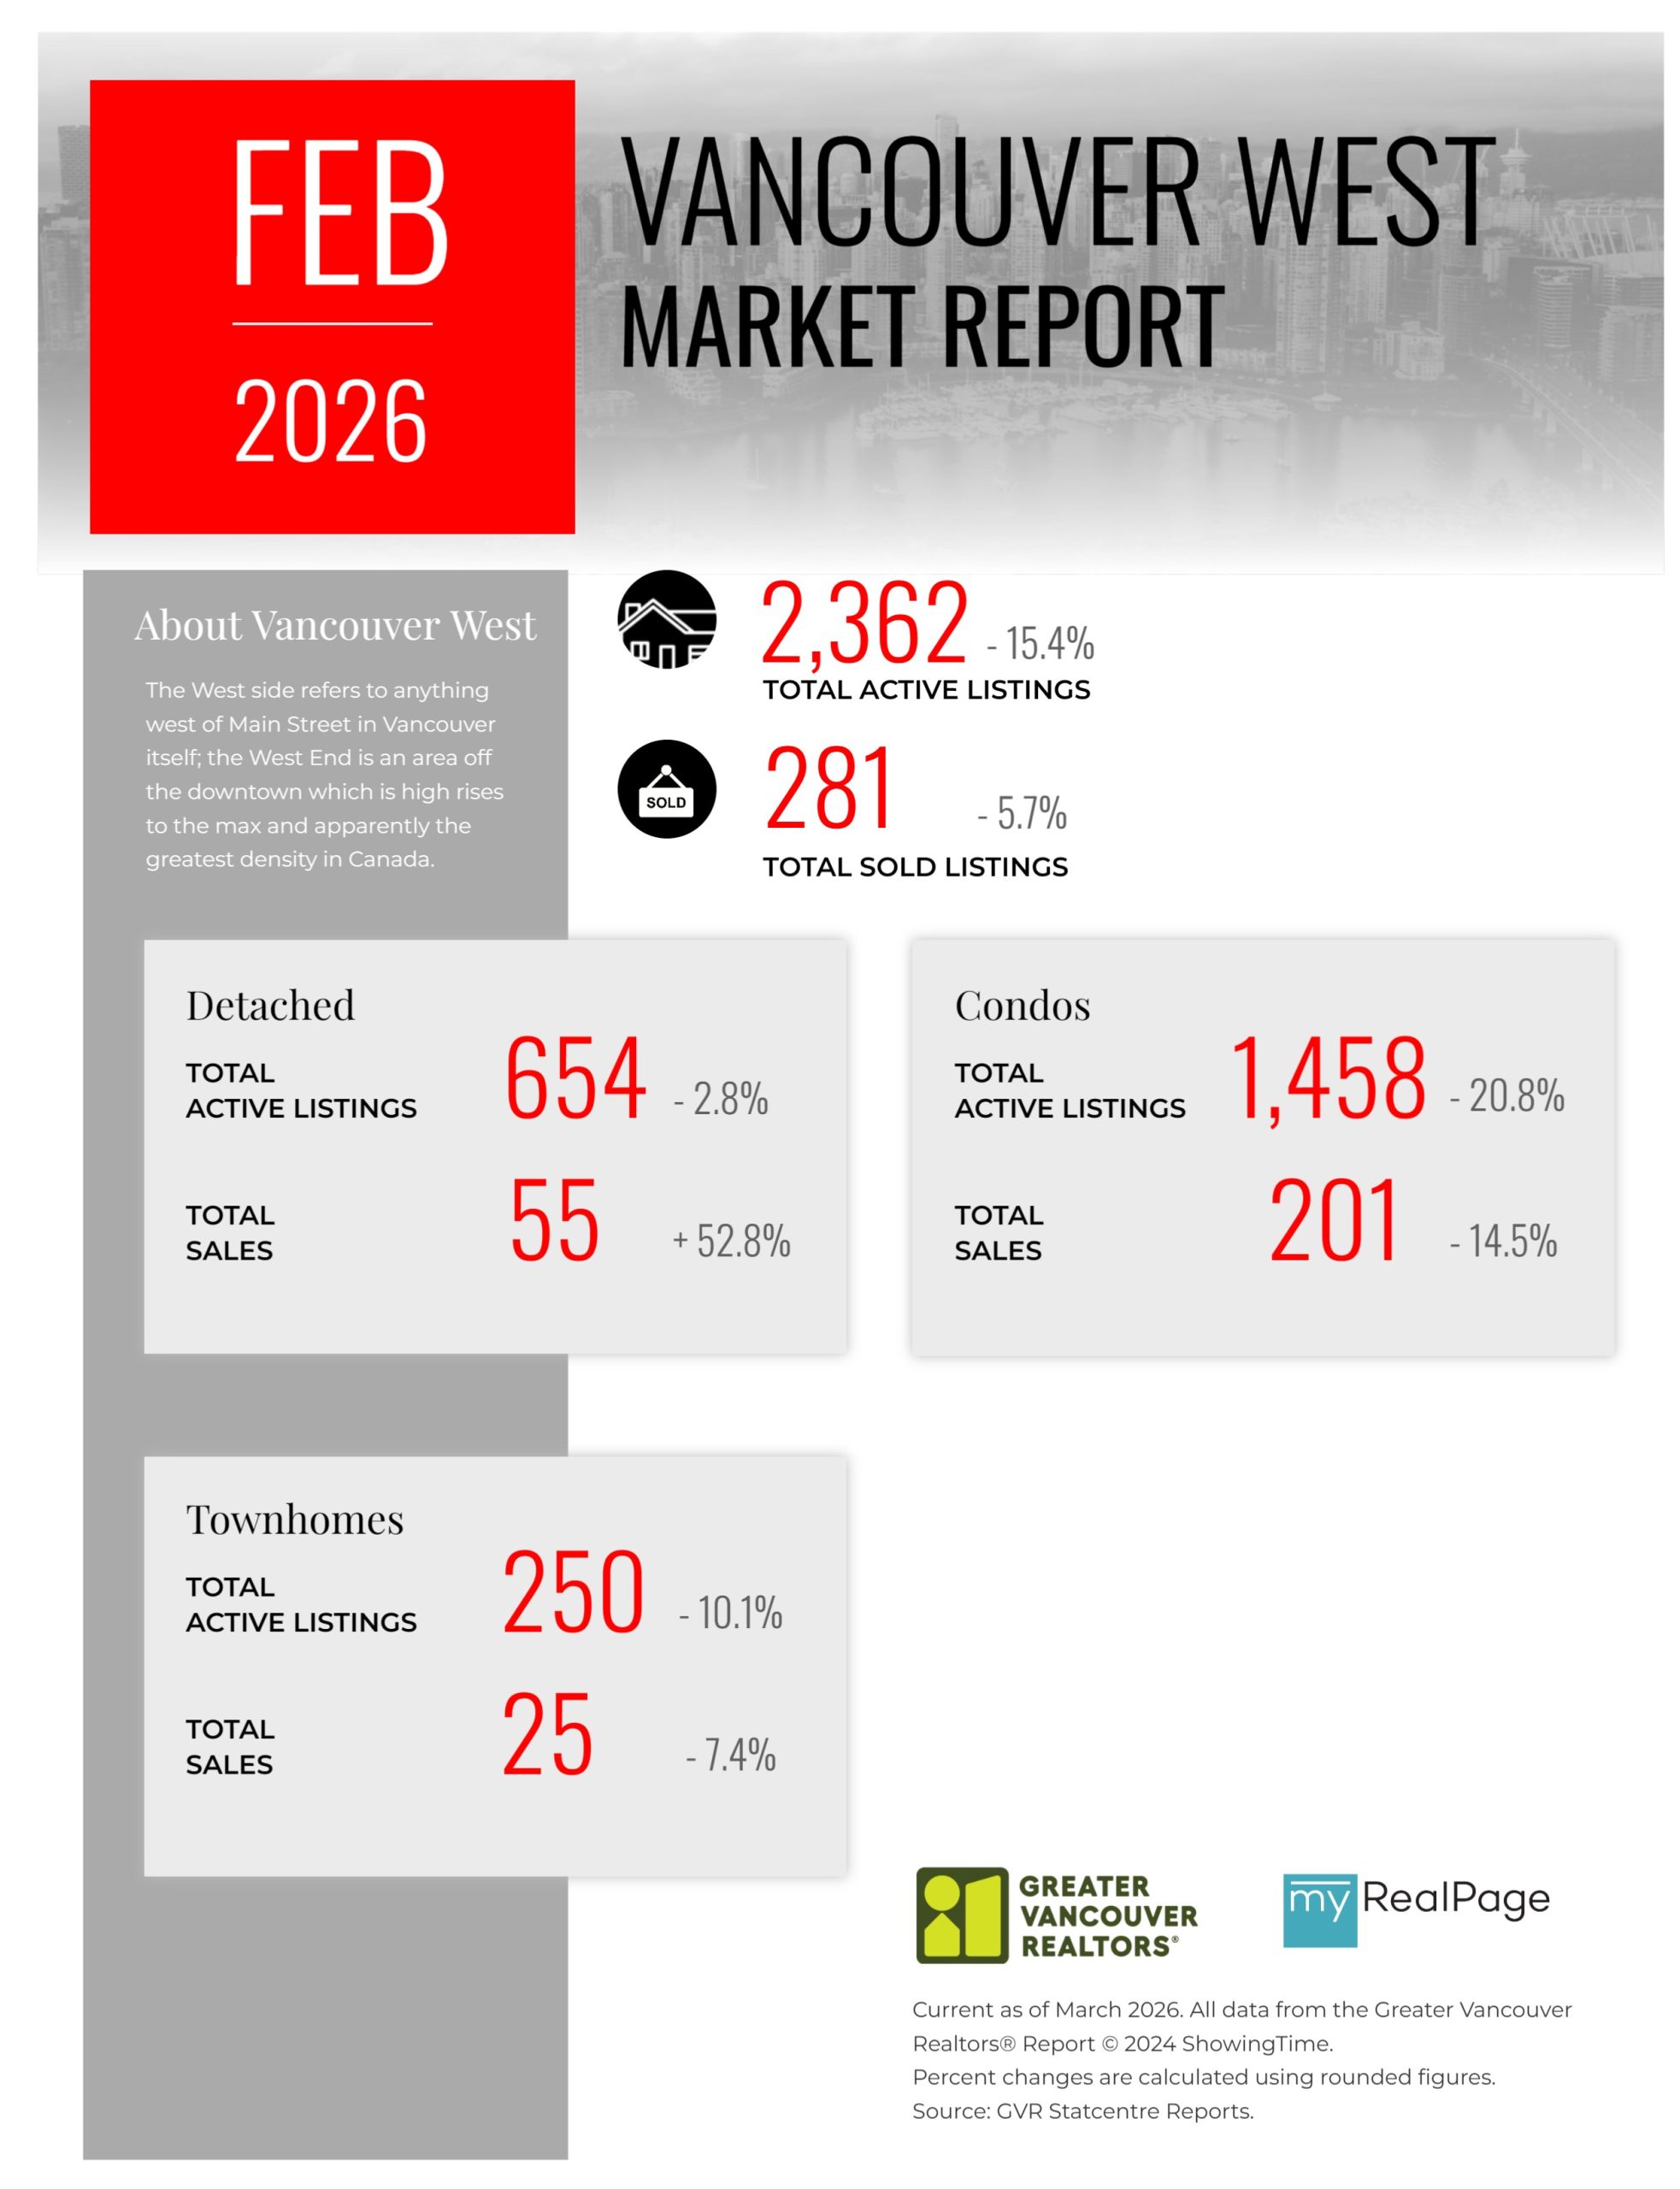
Printable Version – GVR February 2026 Data Infographics Report Vancouver West
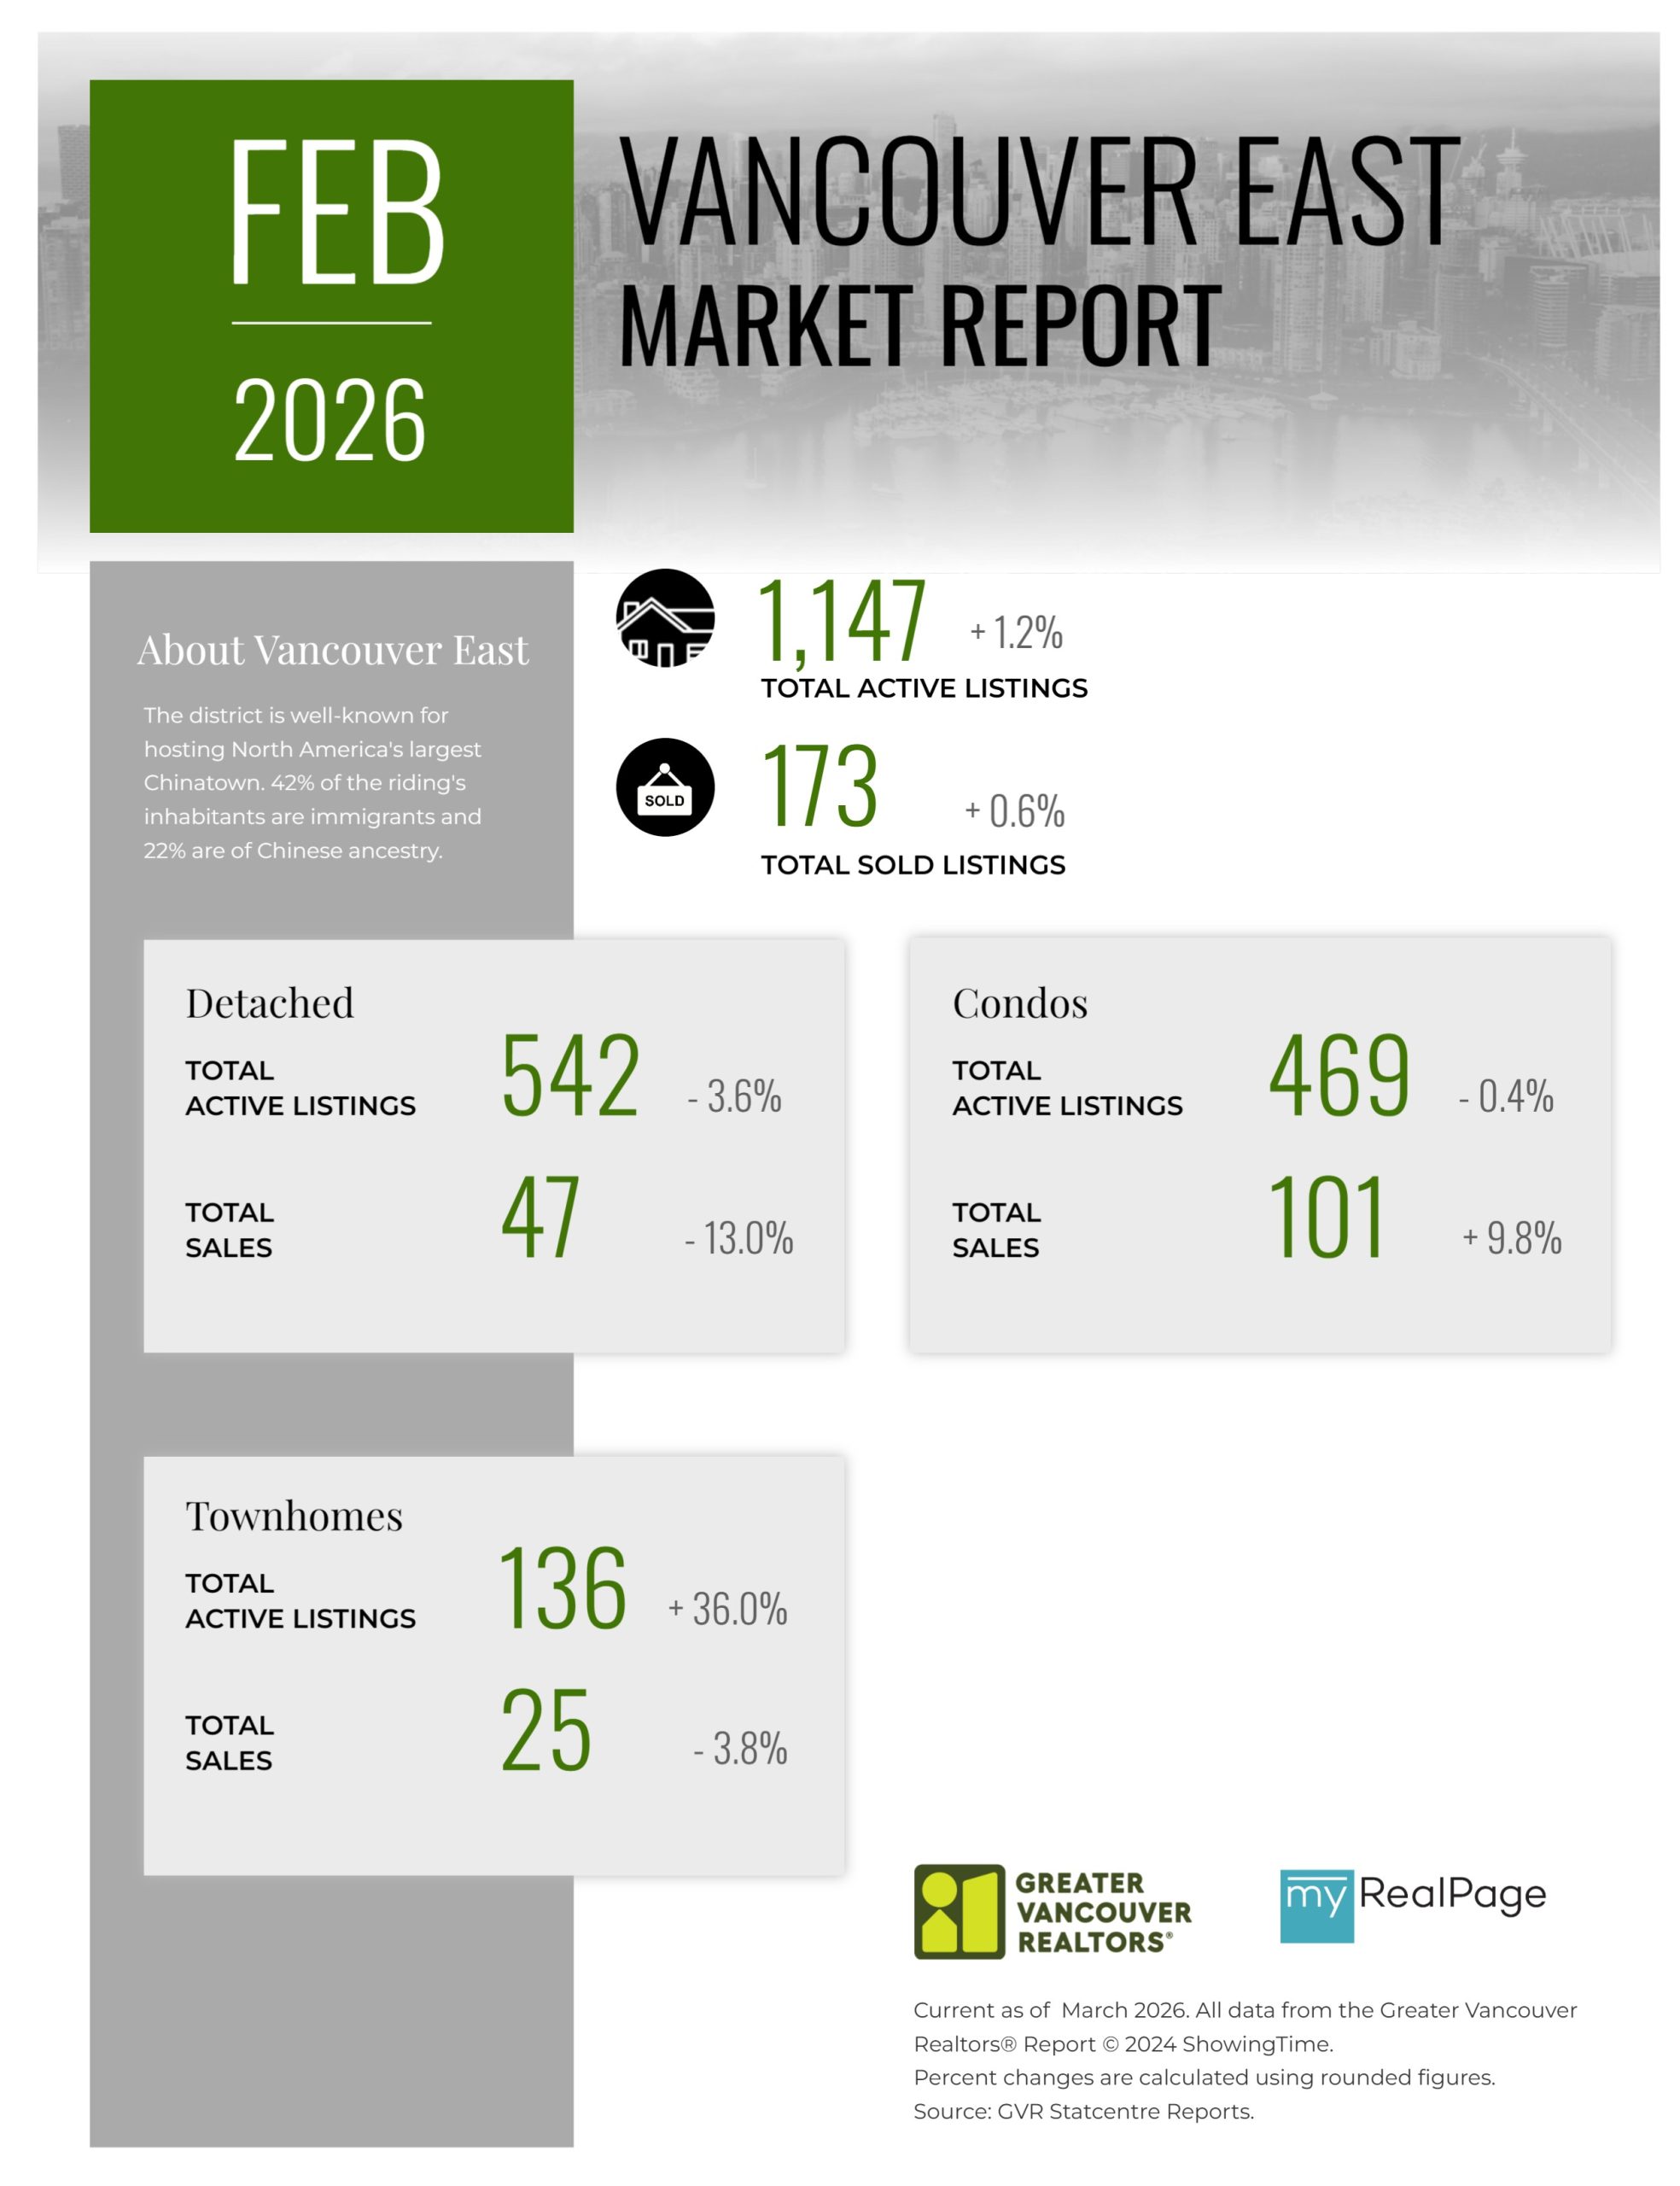
Printable Version – GVR February 2026 Data Infographics Report Vancouver East
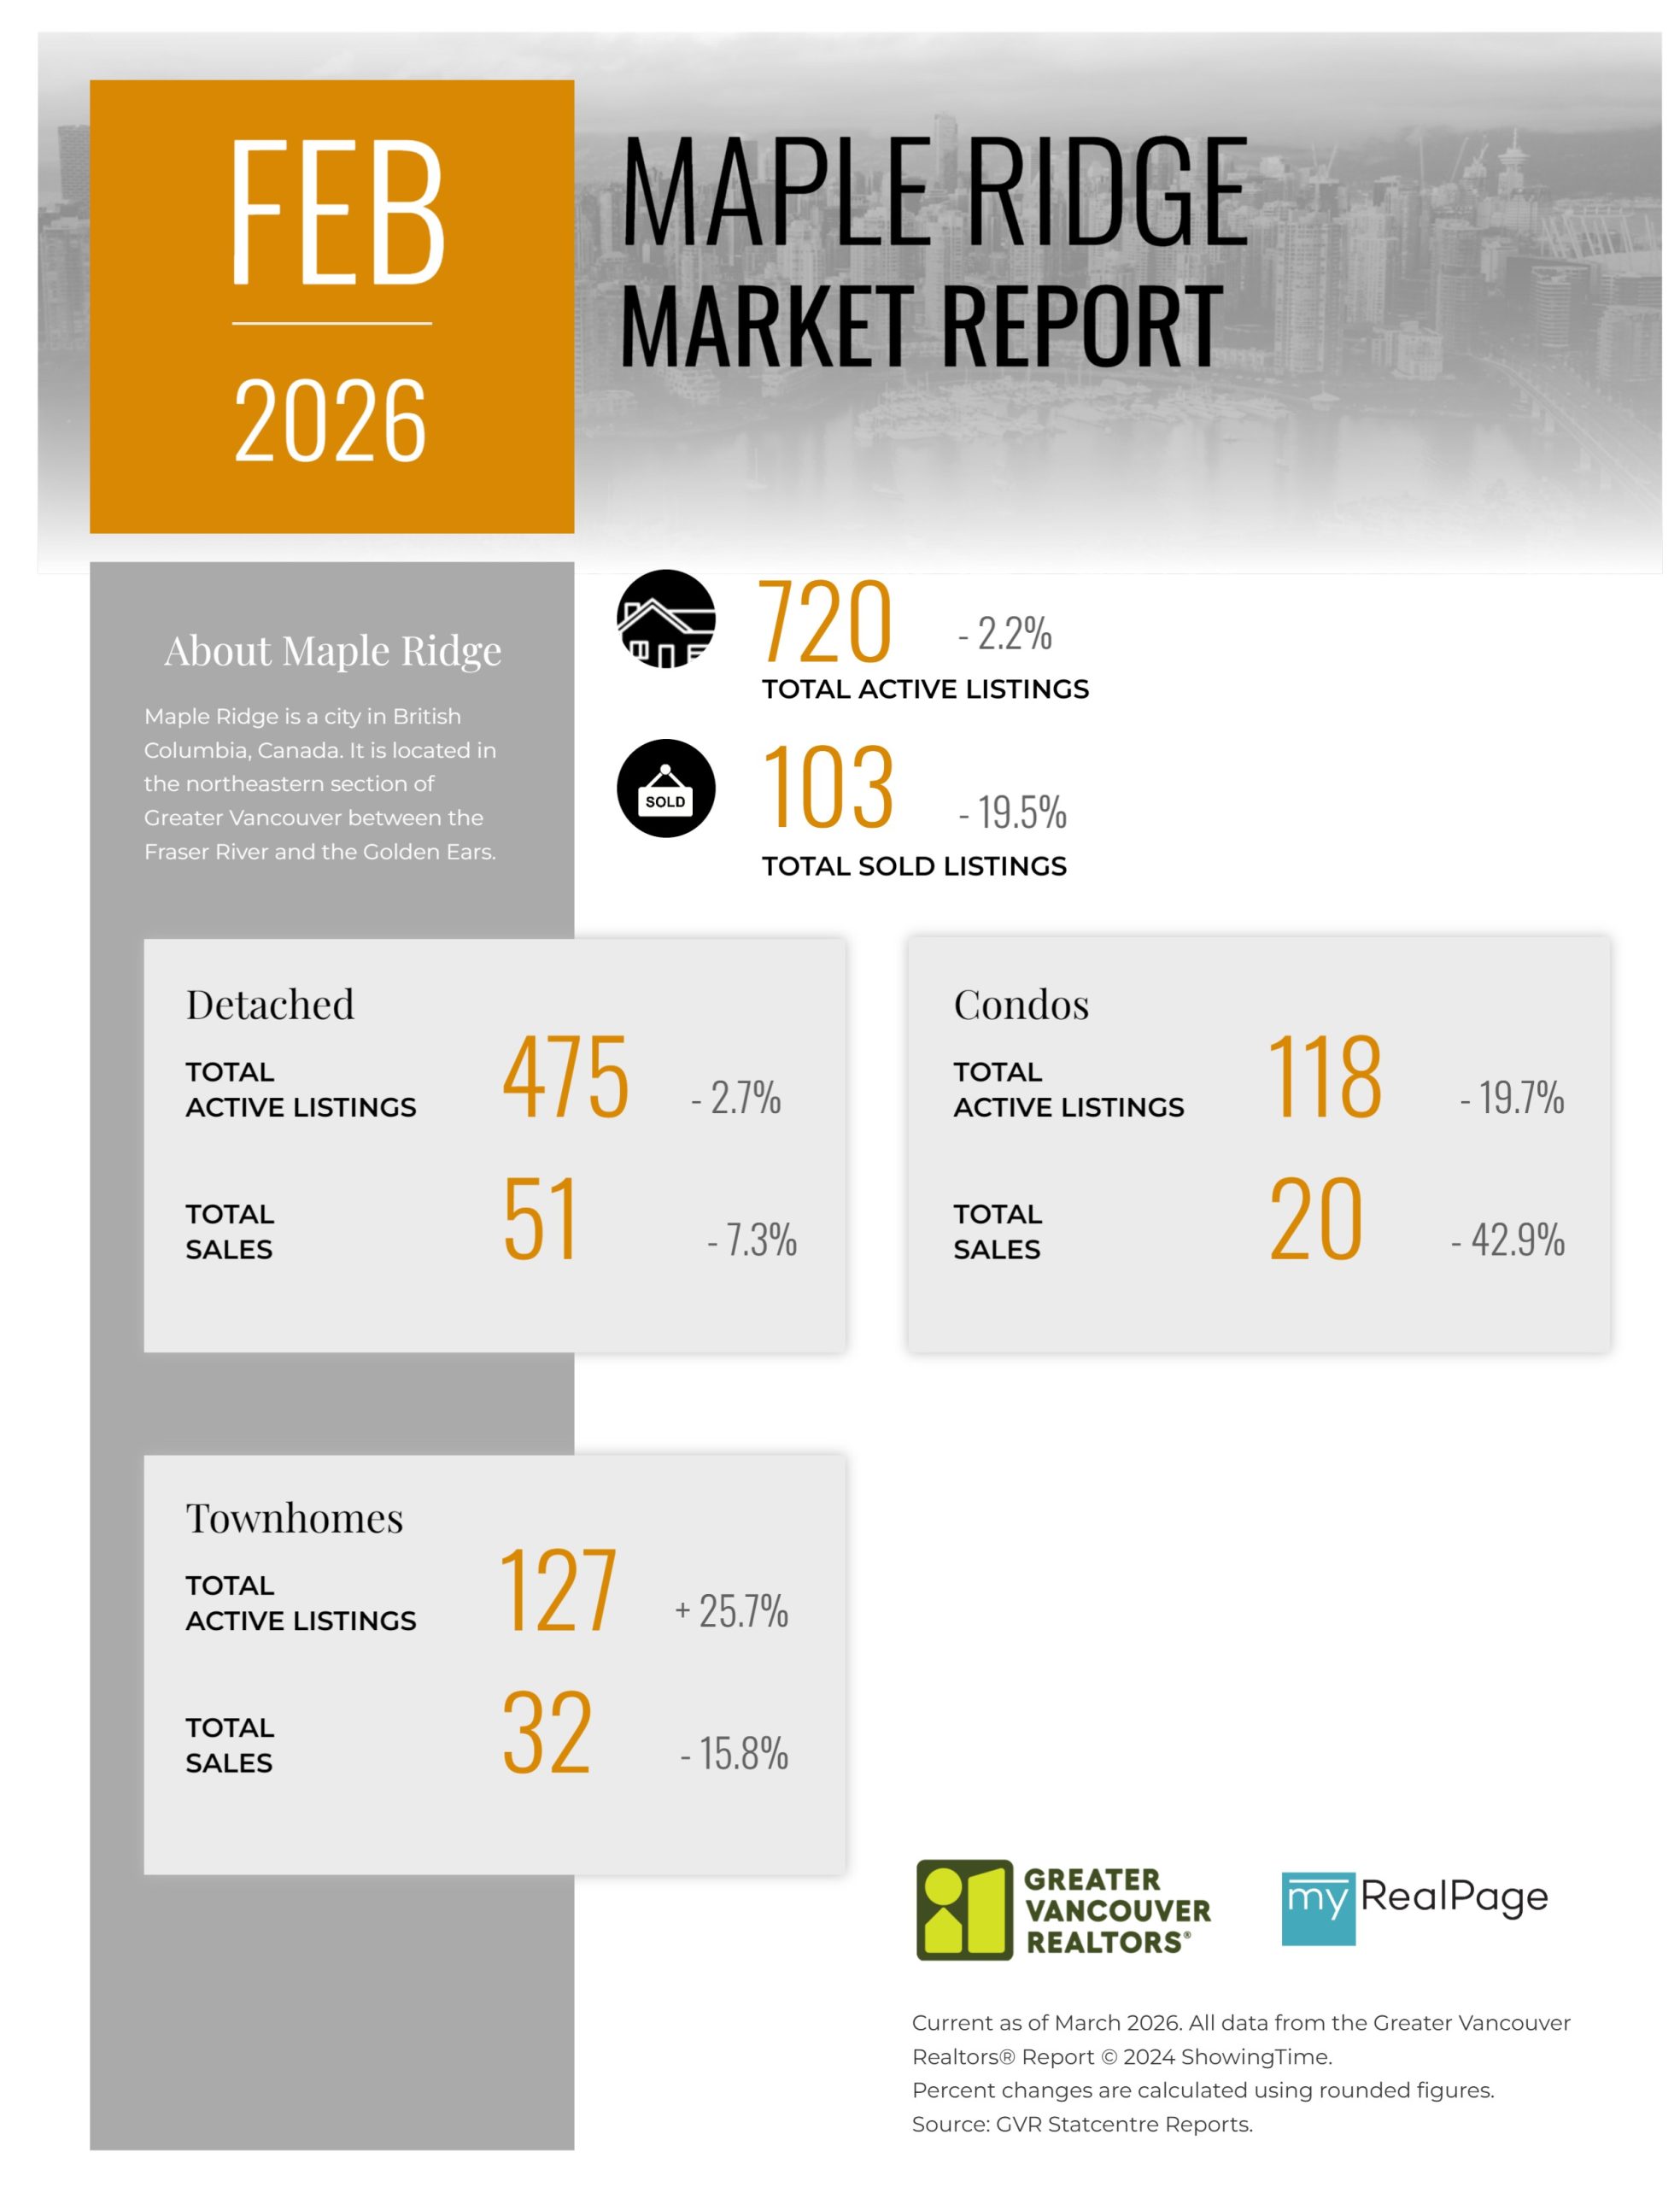
Printable Version – GVR February 2026 Data Infographic Report Maple Ridge
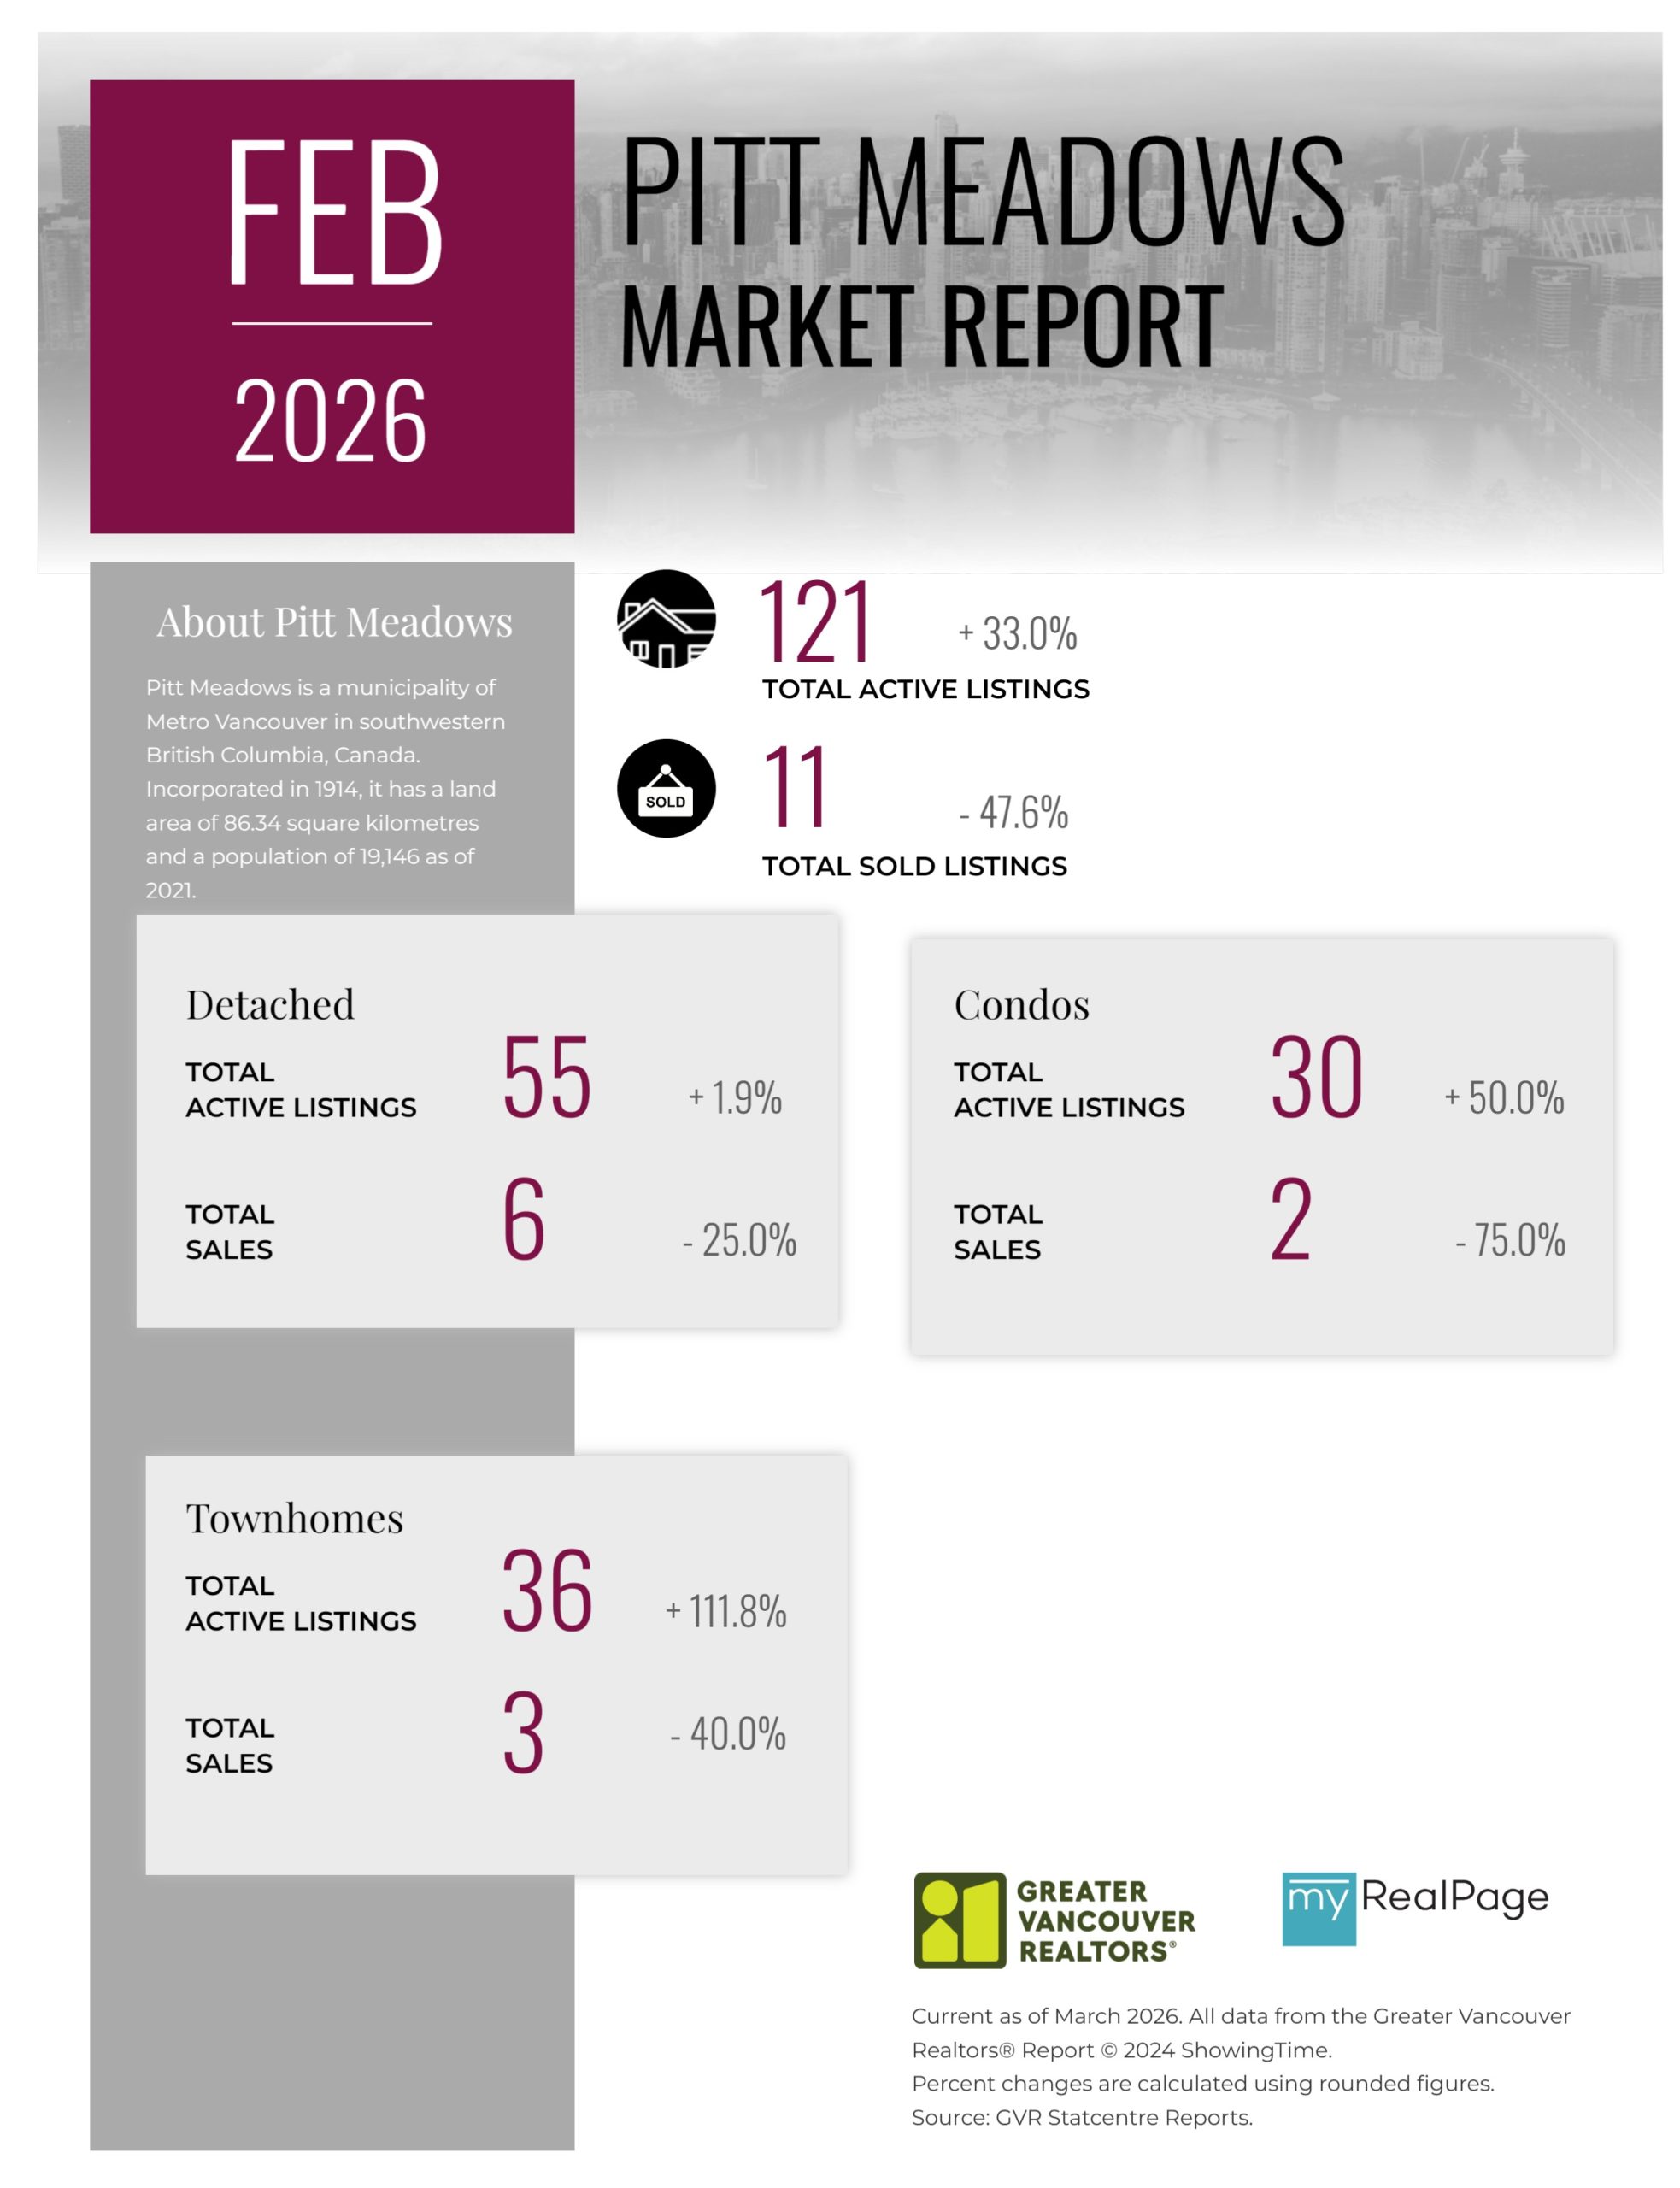
Printable Version – GVR February 2026 Data Infographics Report Pitt Meadows
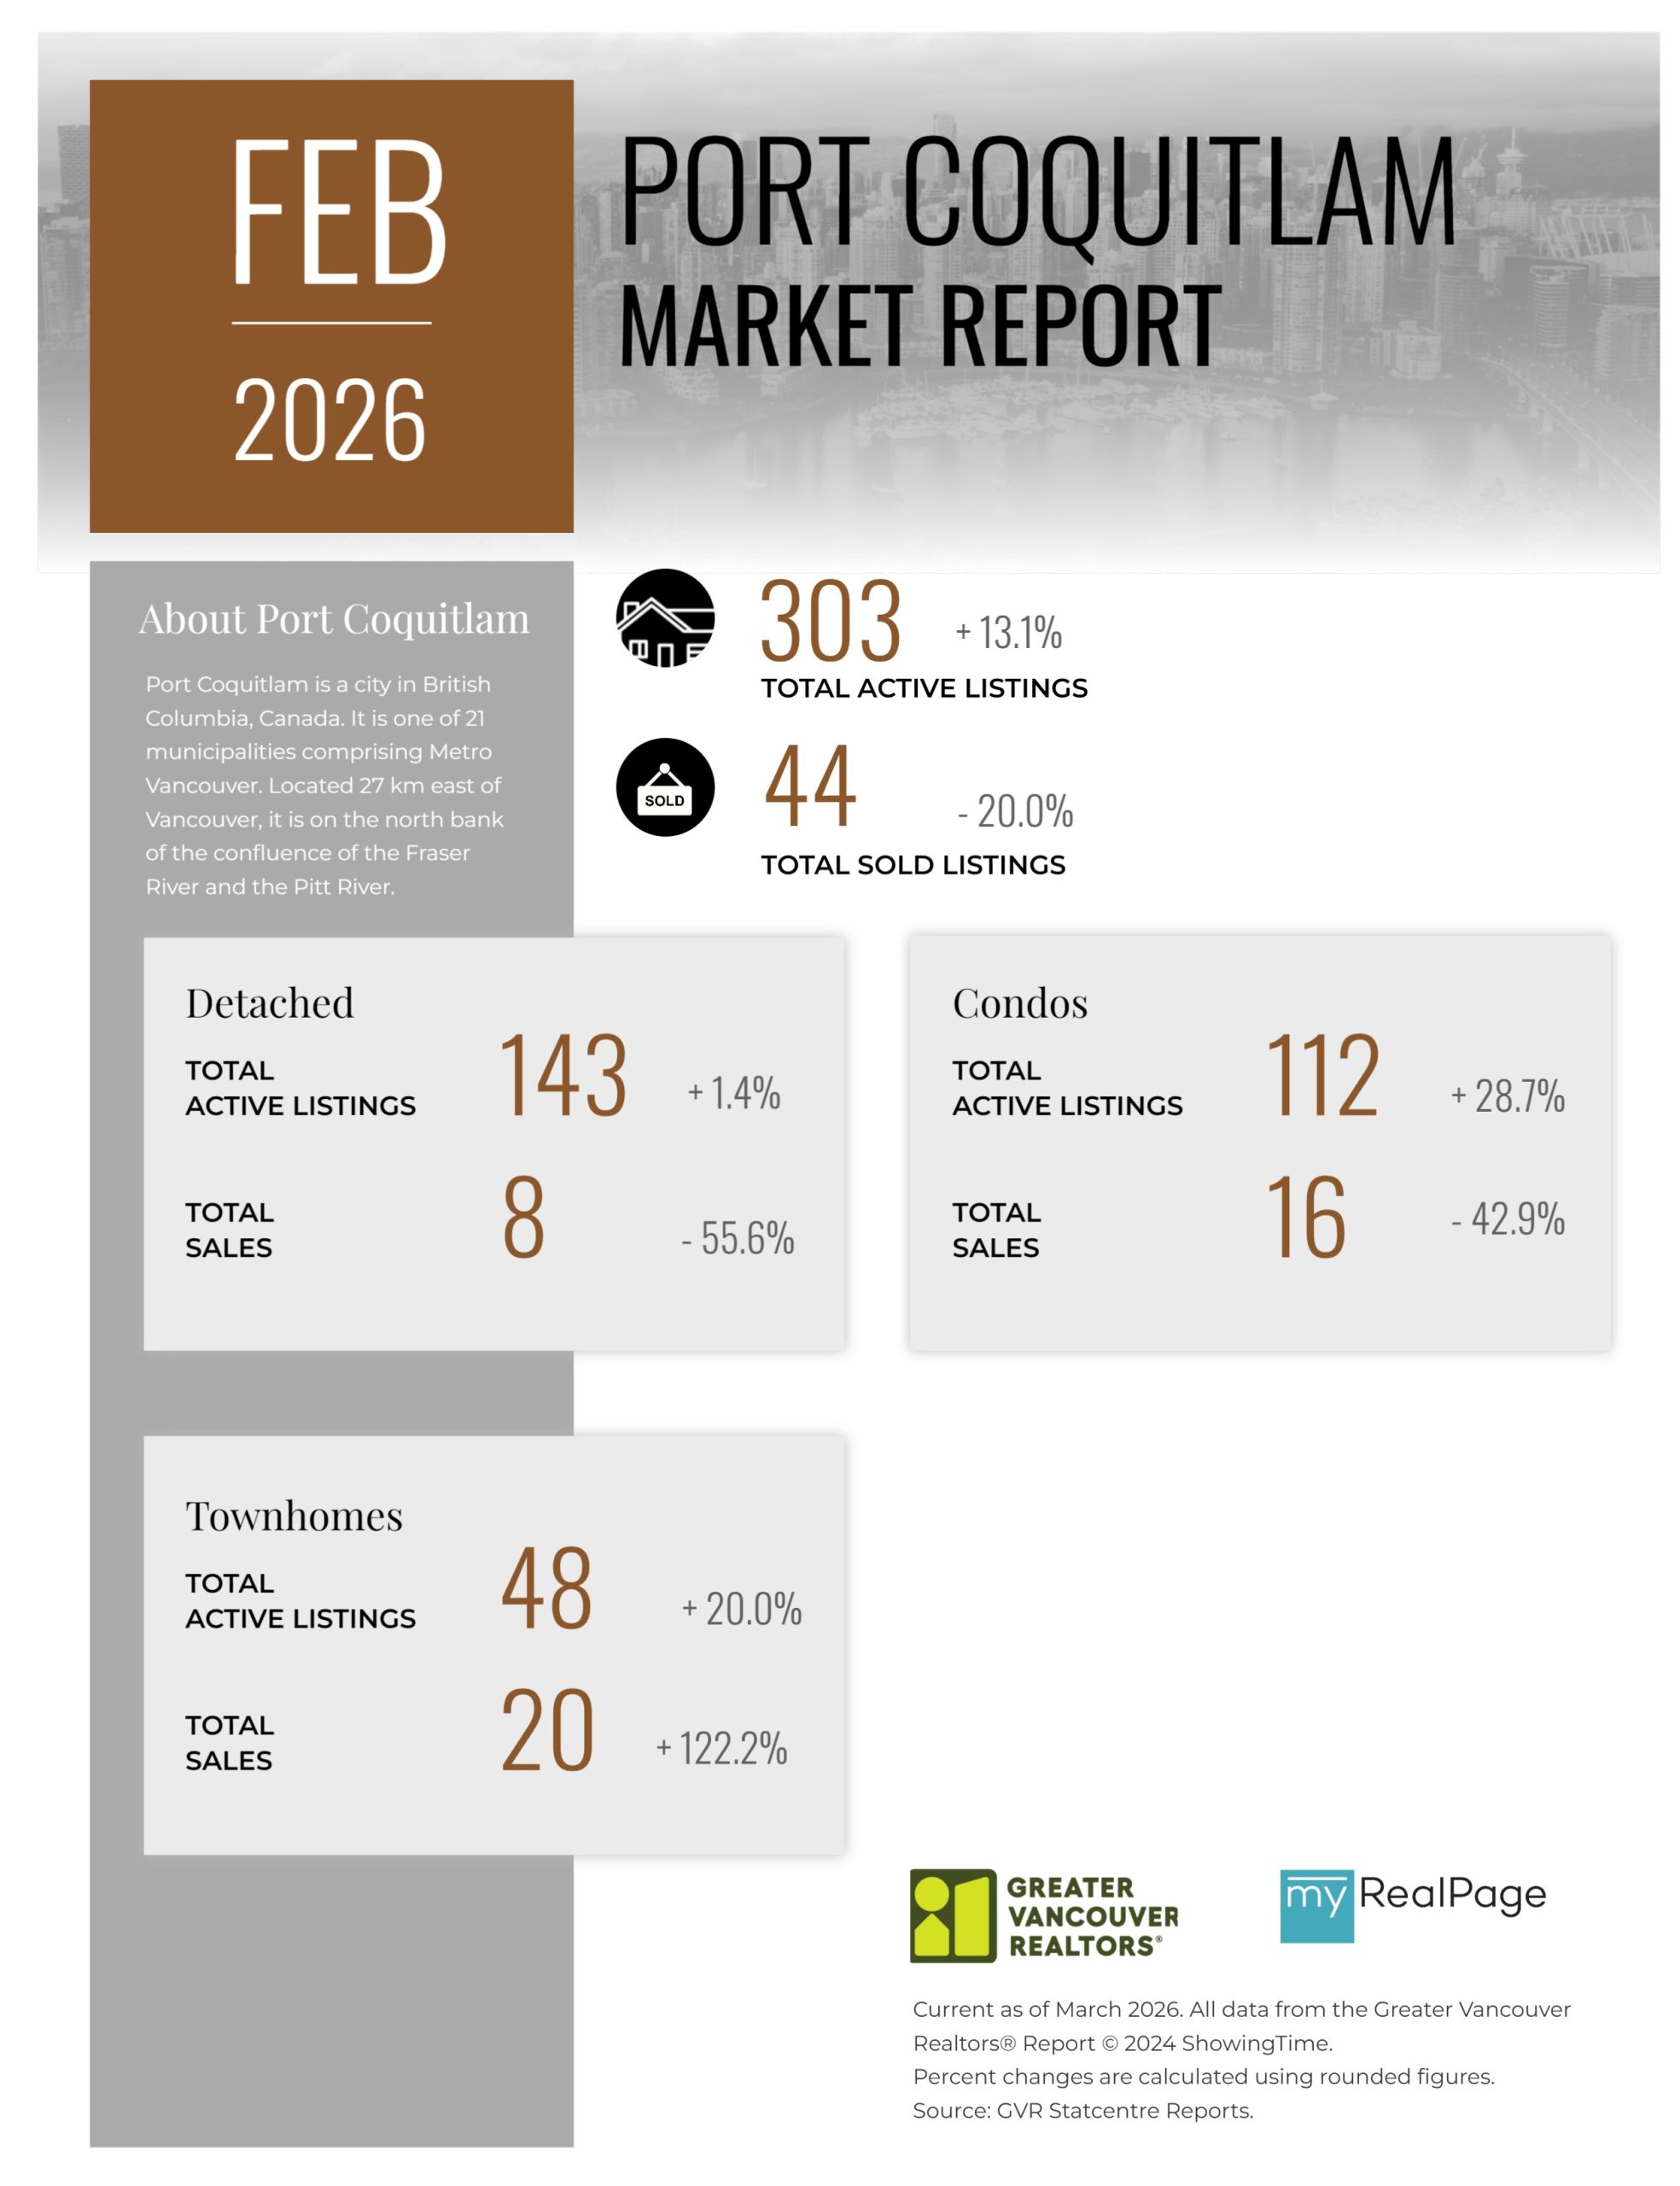
Printable Version – GVR February 2026 Data Infographics Report Port Coquitlam
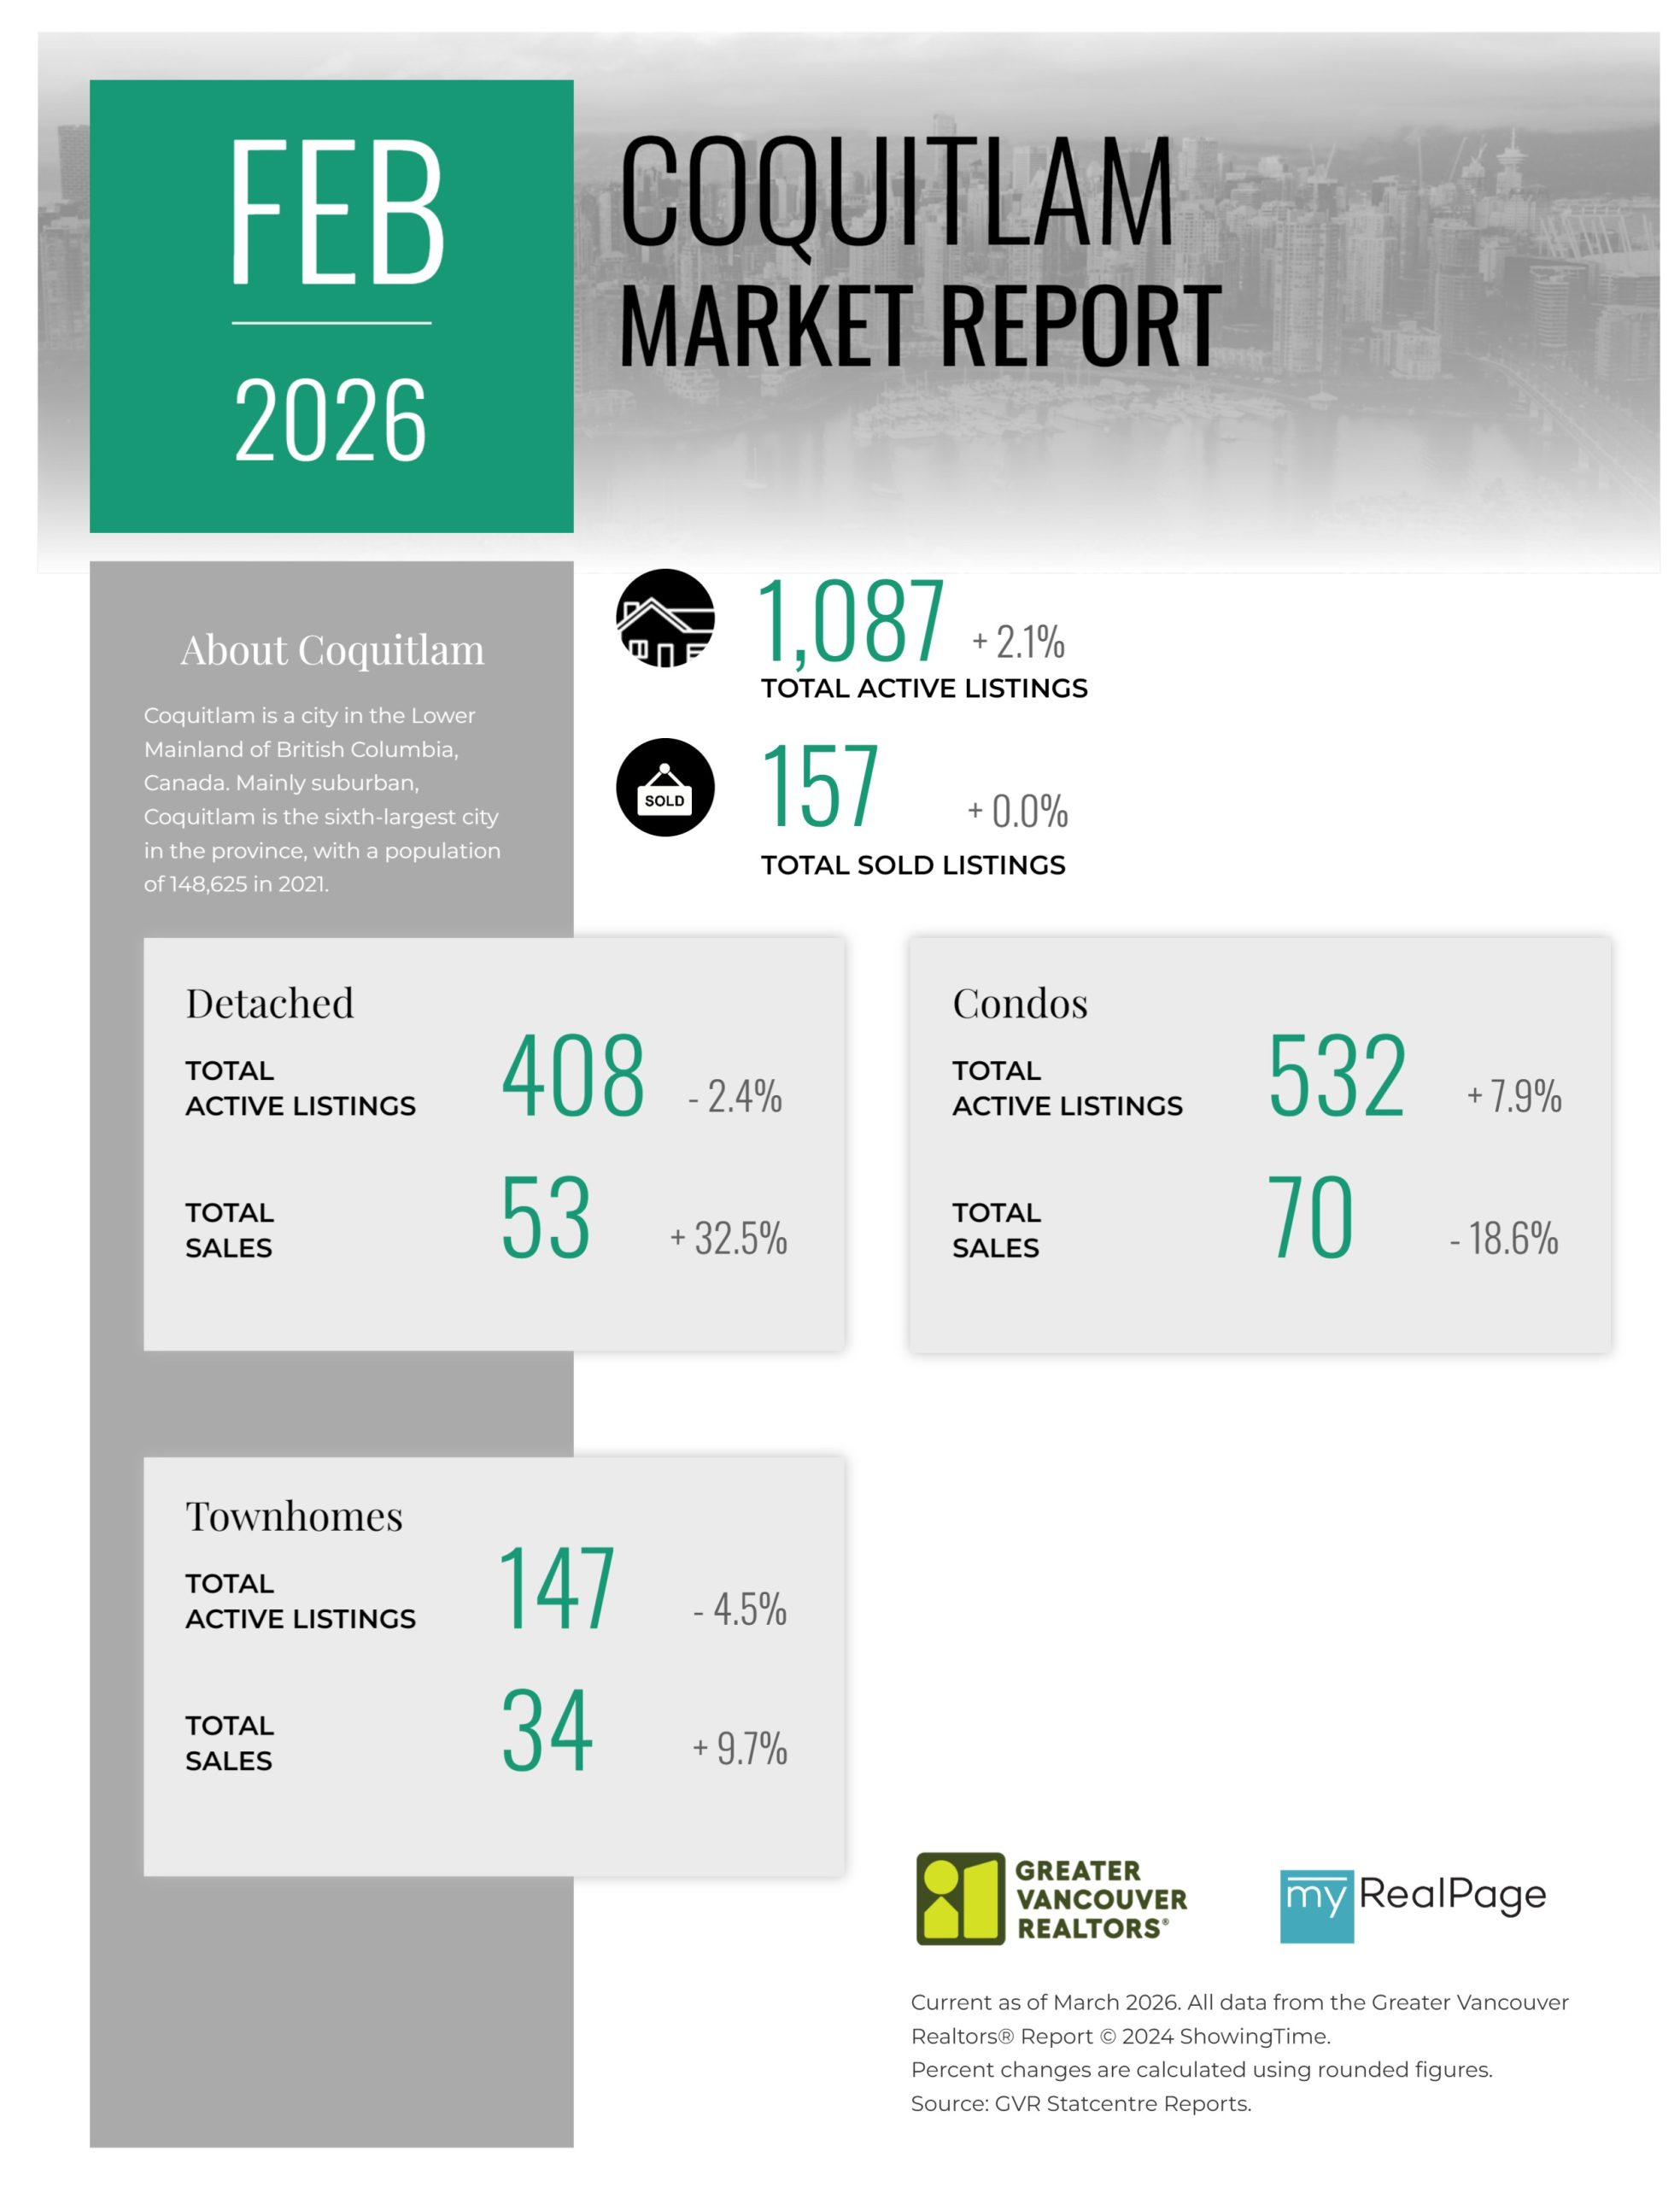
Printable Version – GVR February 2026 Data Infographics Report Coquitlam
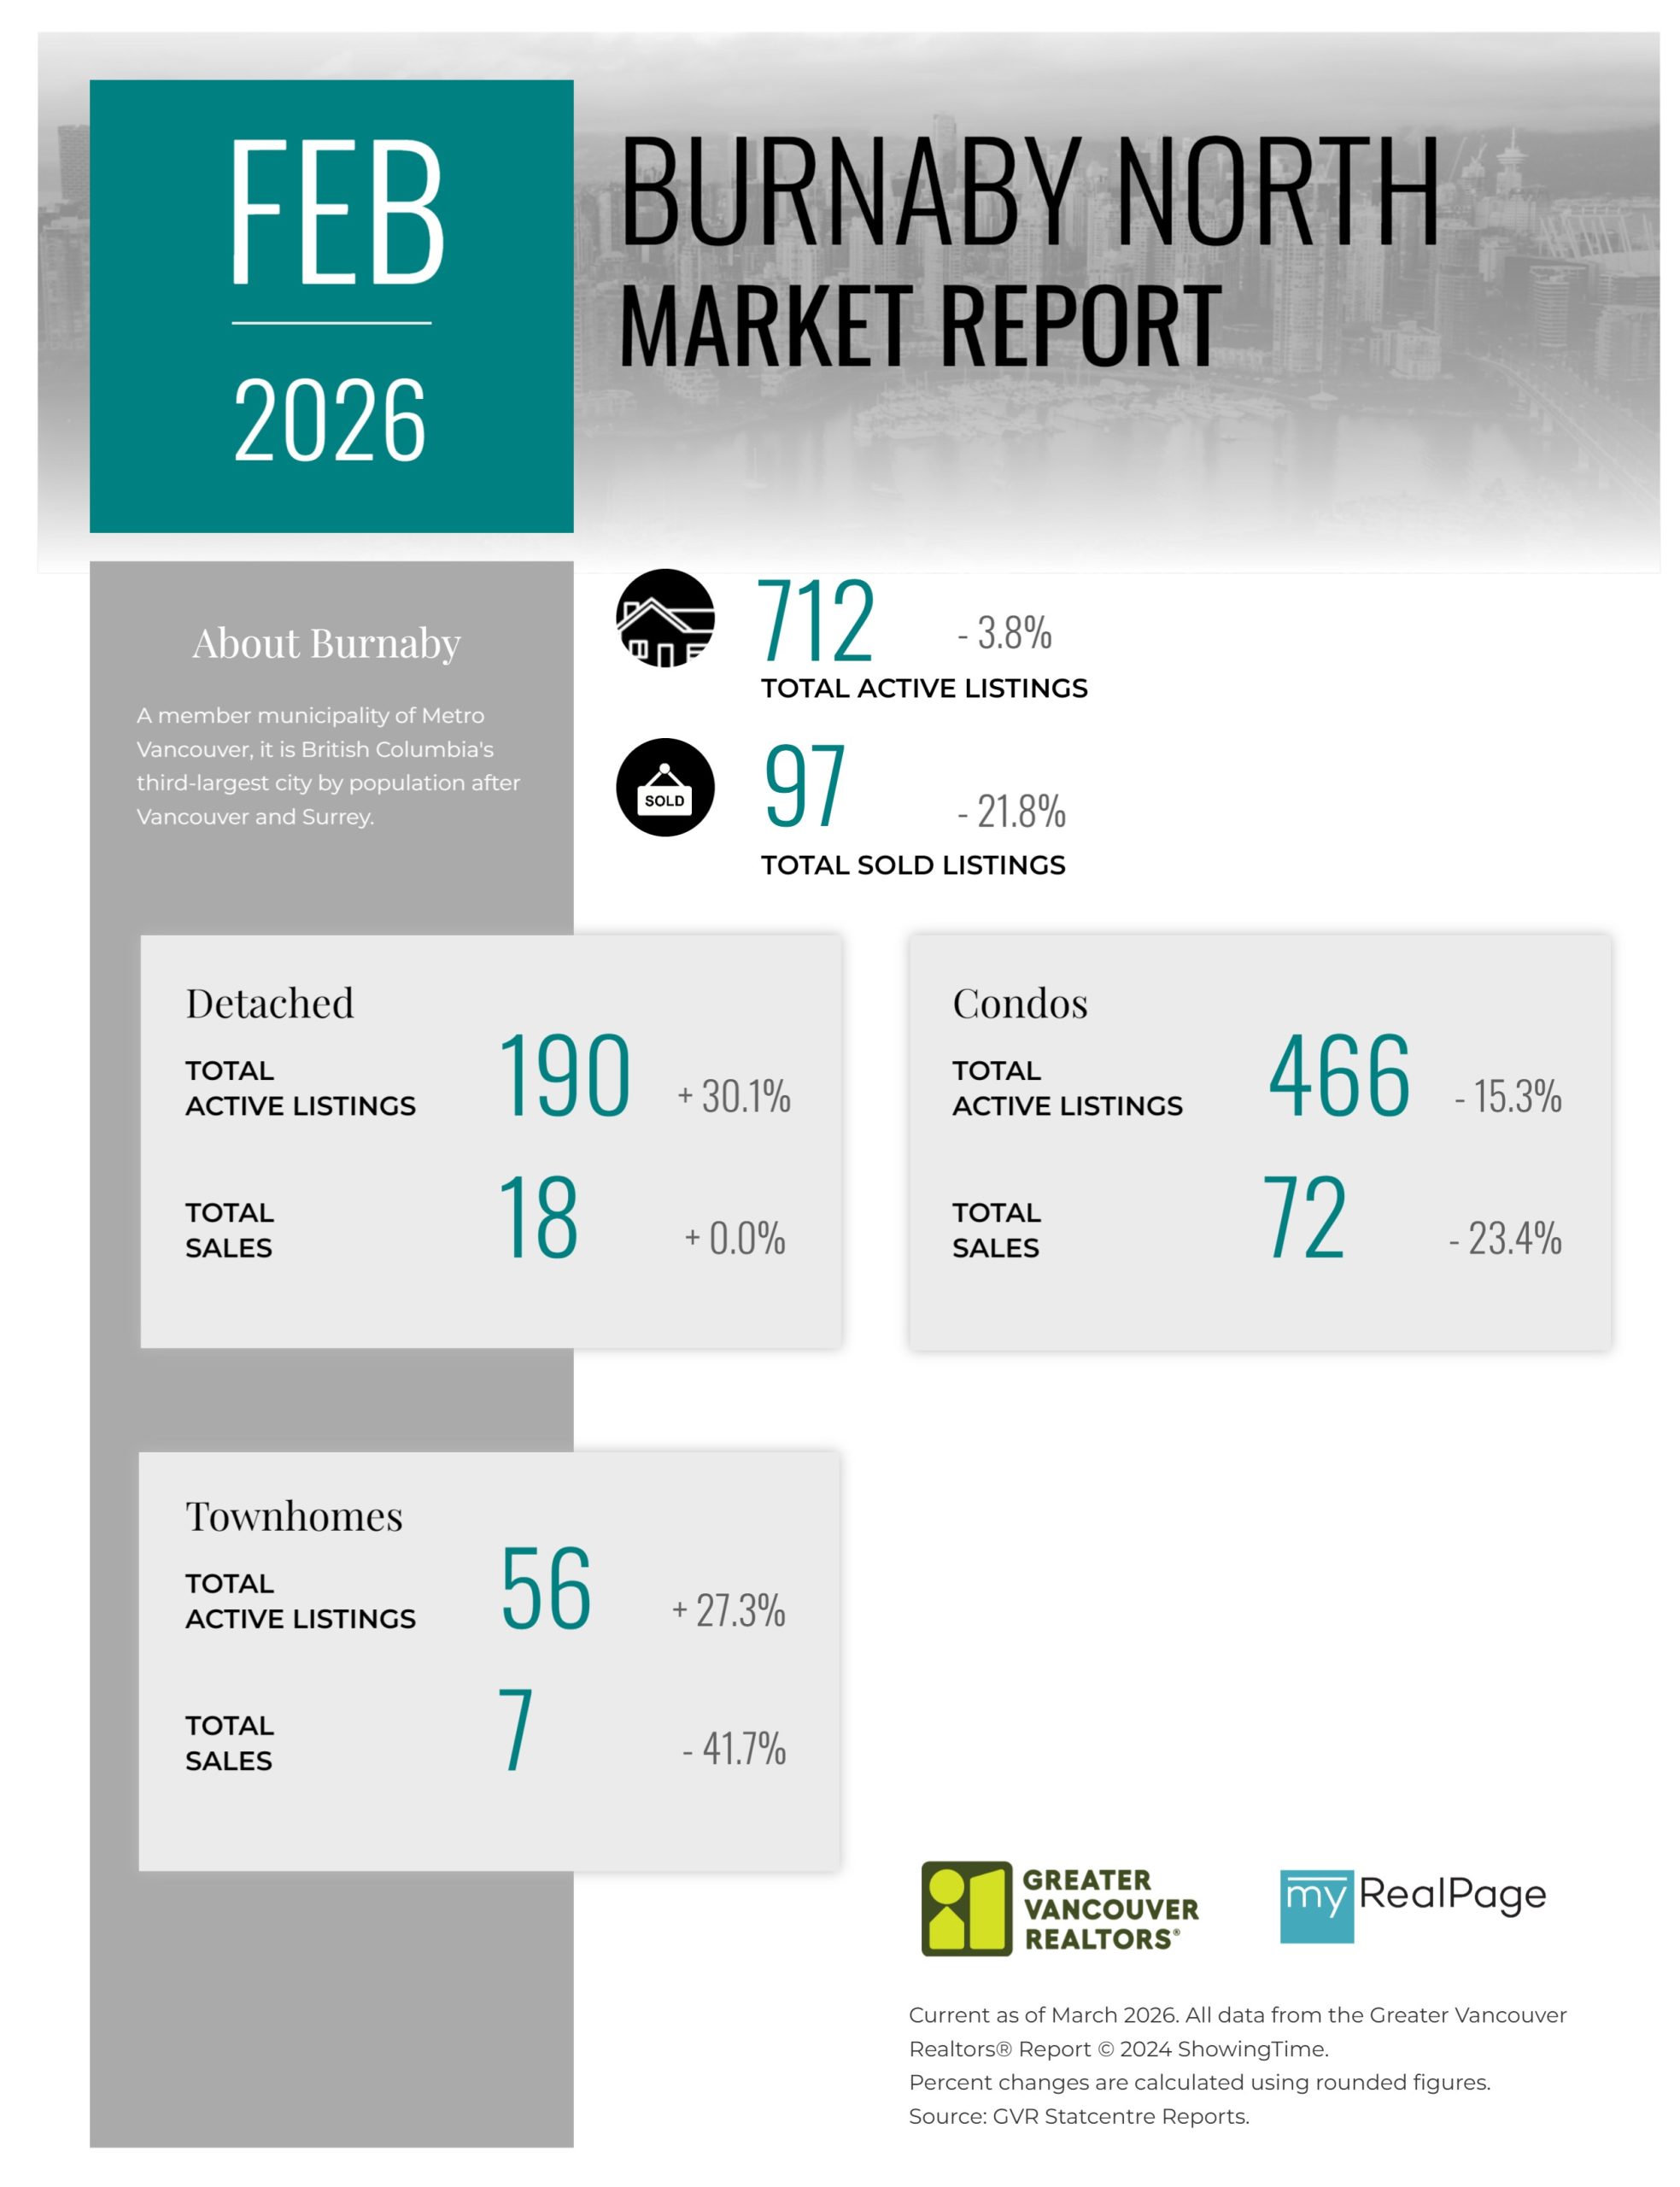
Printable Version – GVR February 2026 Data Infographic Report Burnaby North
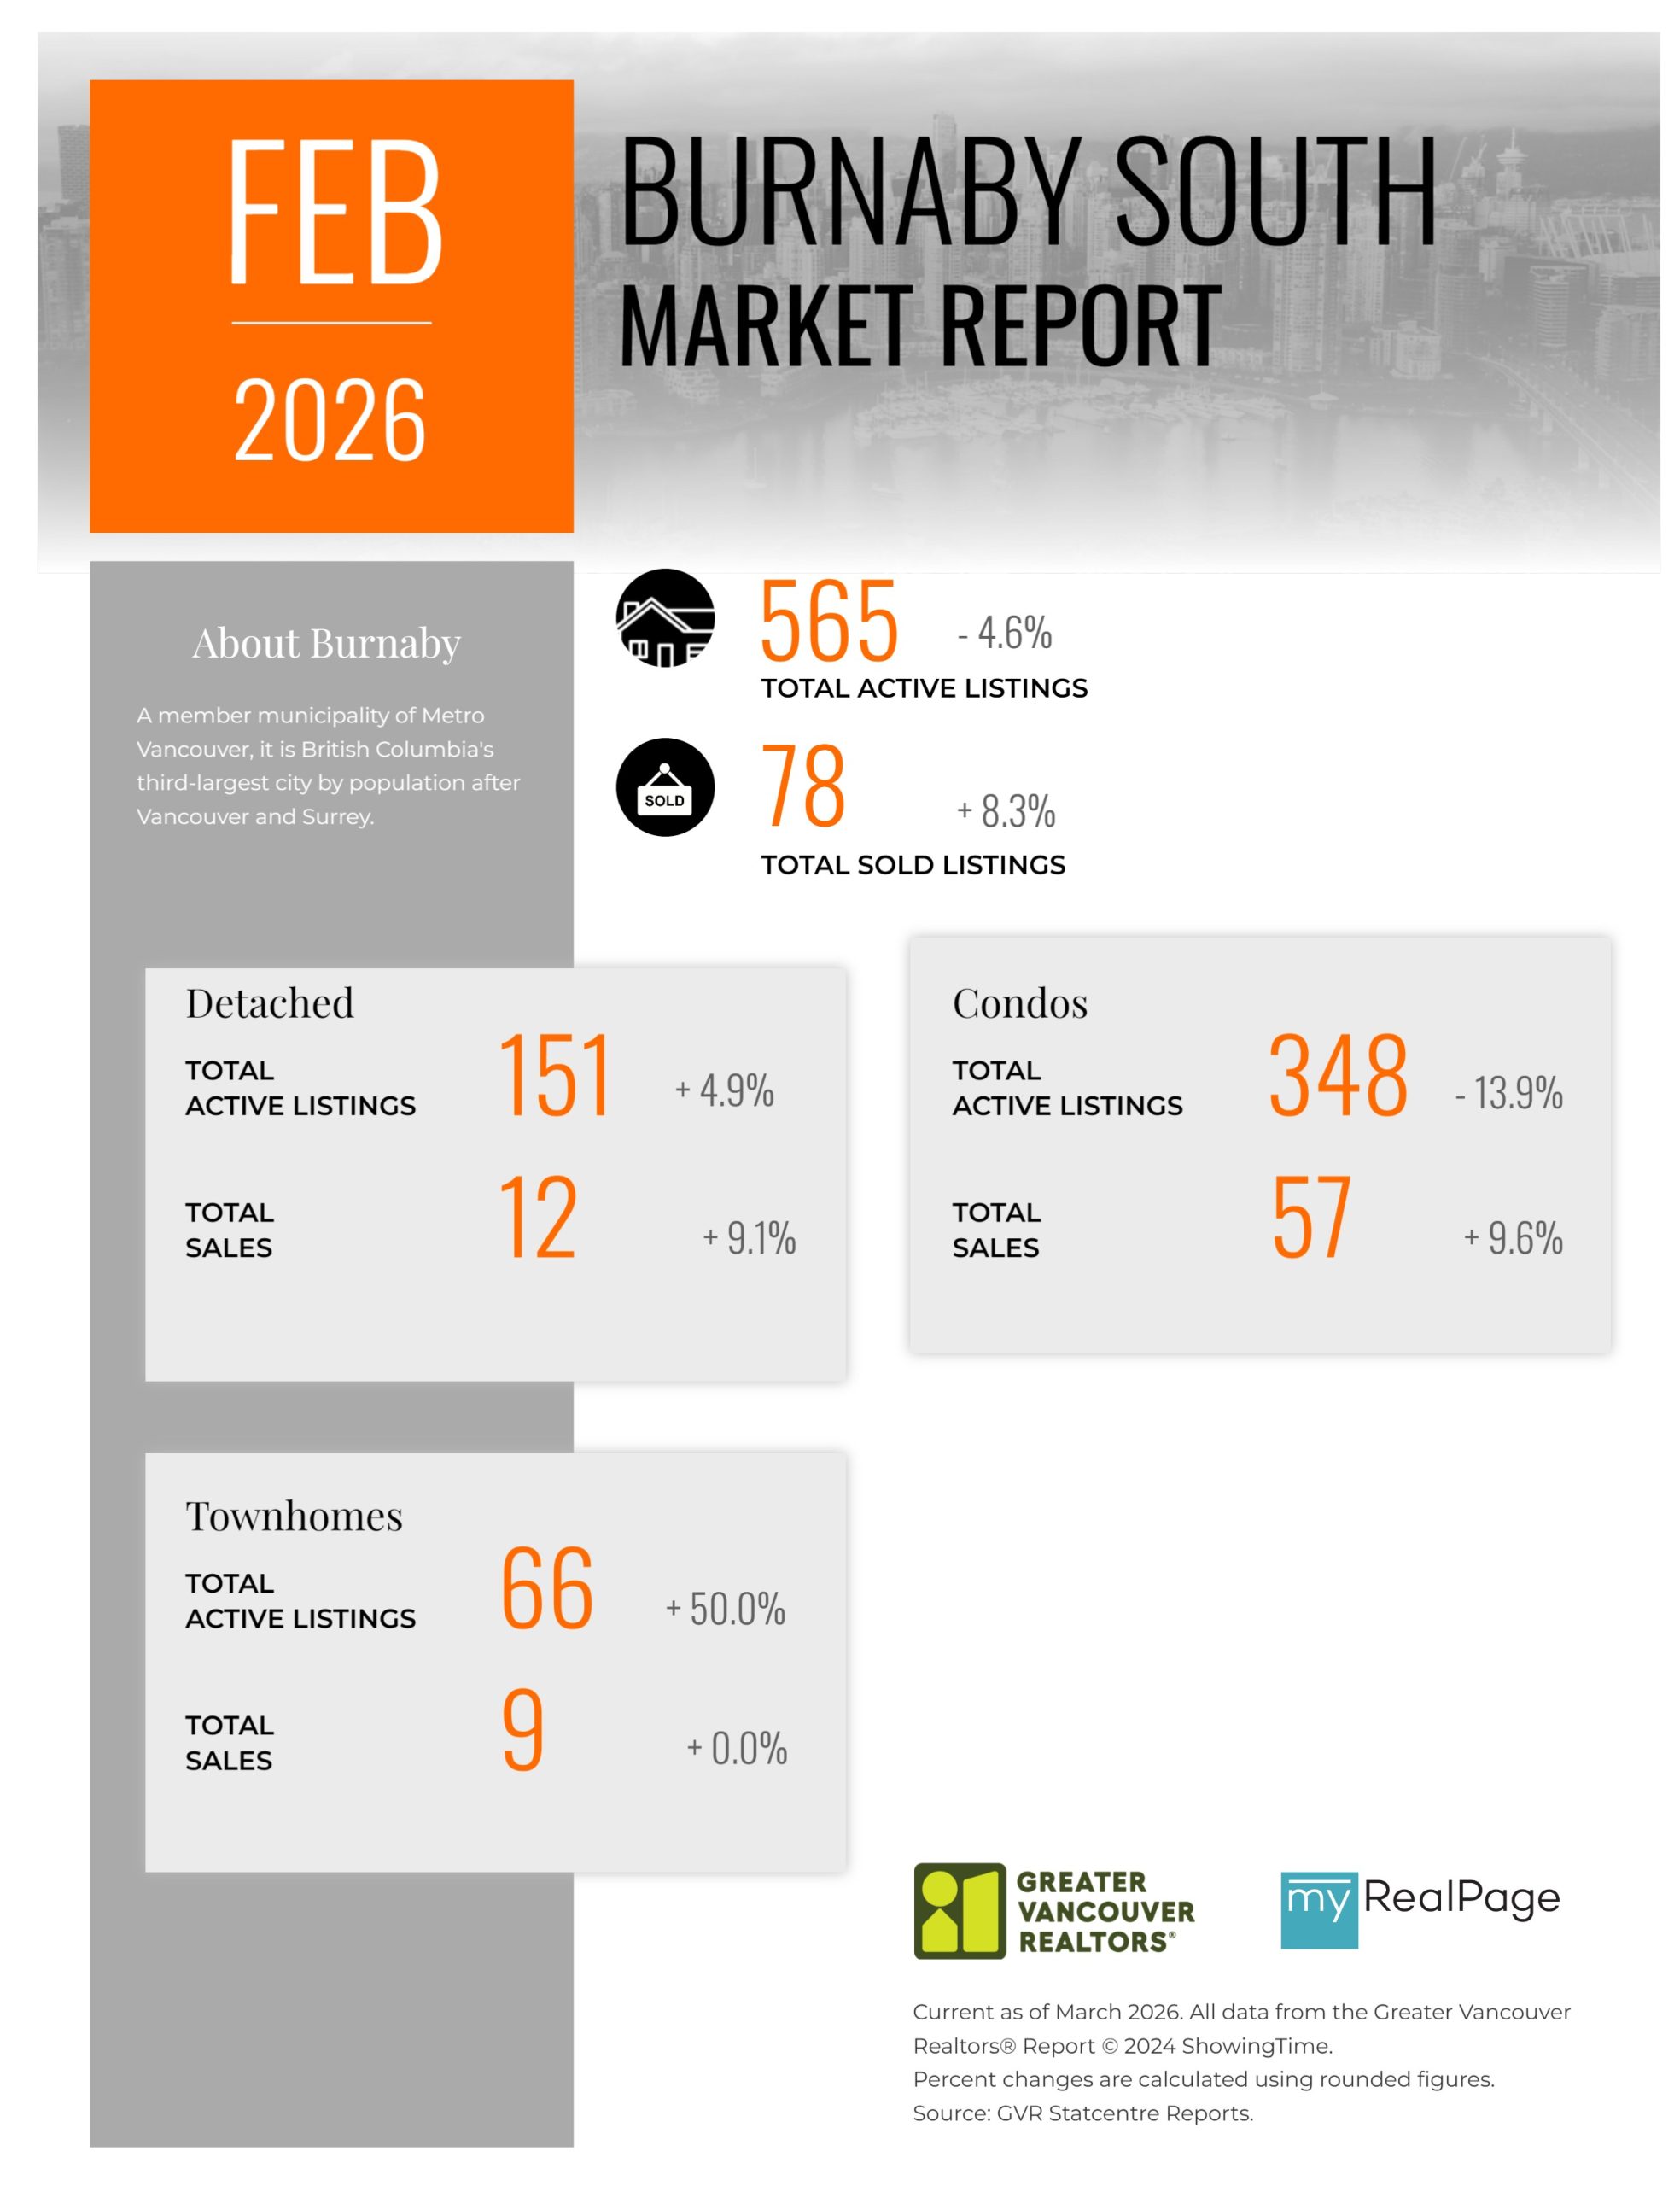
Printable Version – GVR February 2026 Data Infographics Report Burnaby South
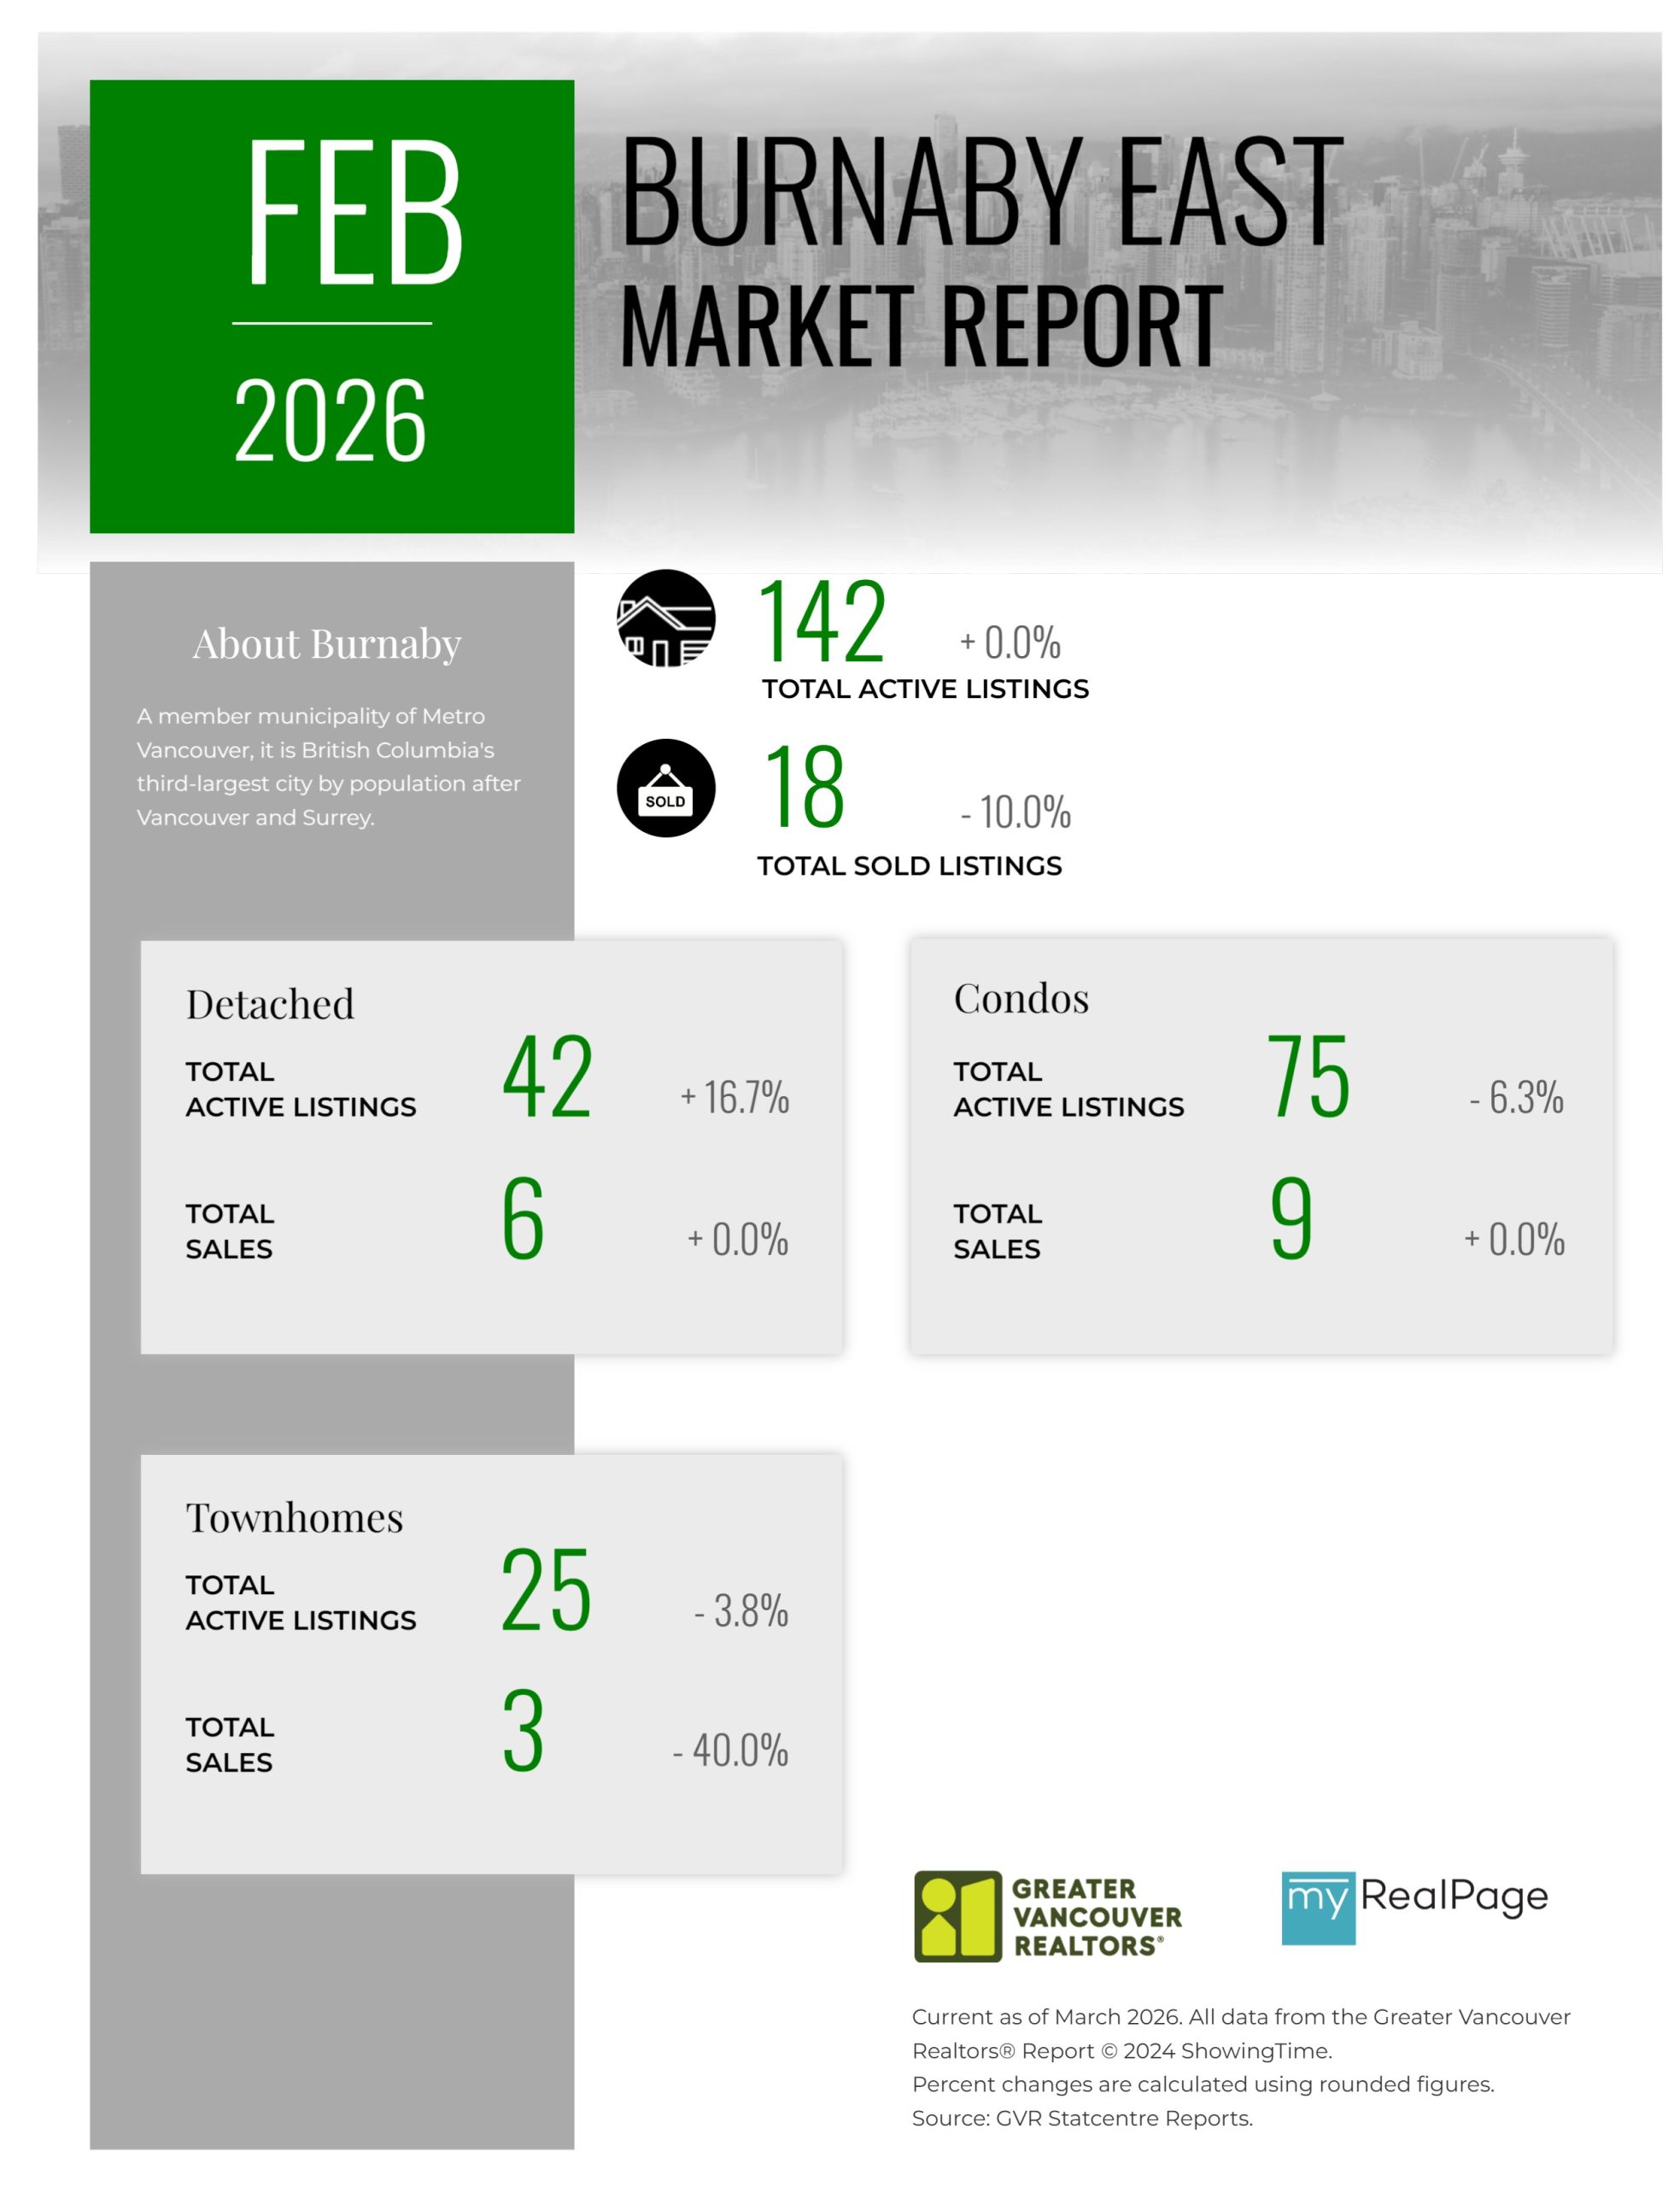
Printable Version – GVR February 2026 Data Infographics Report Burnaby East
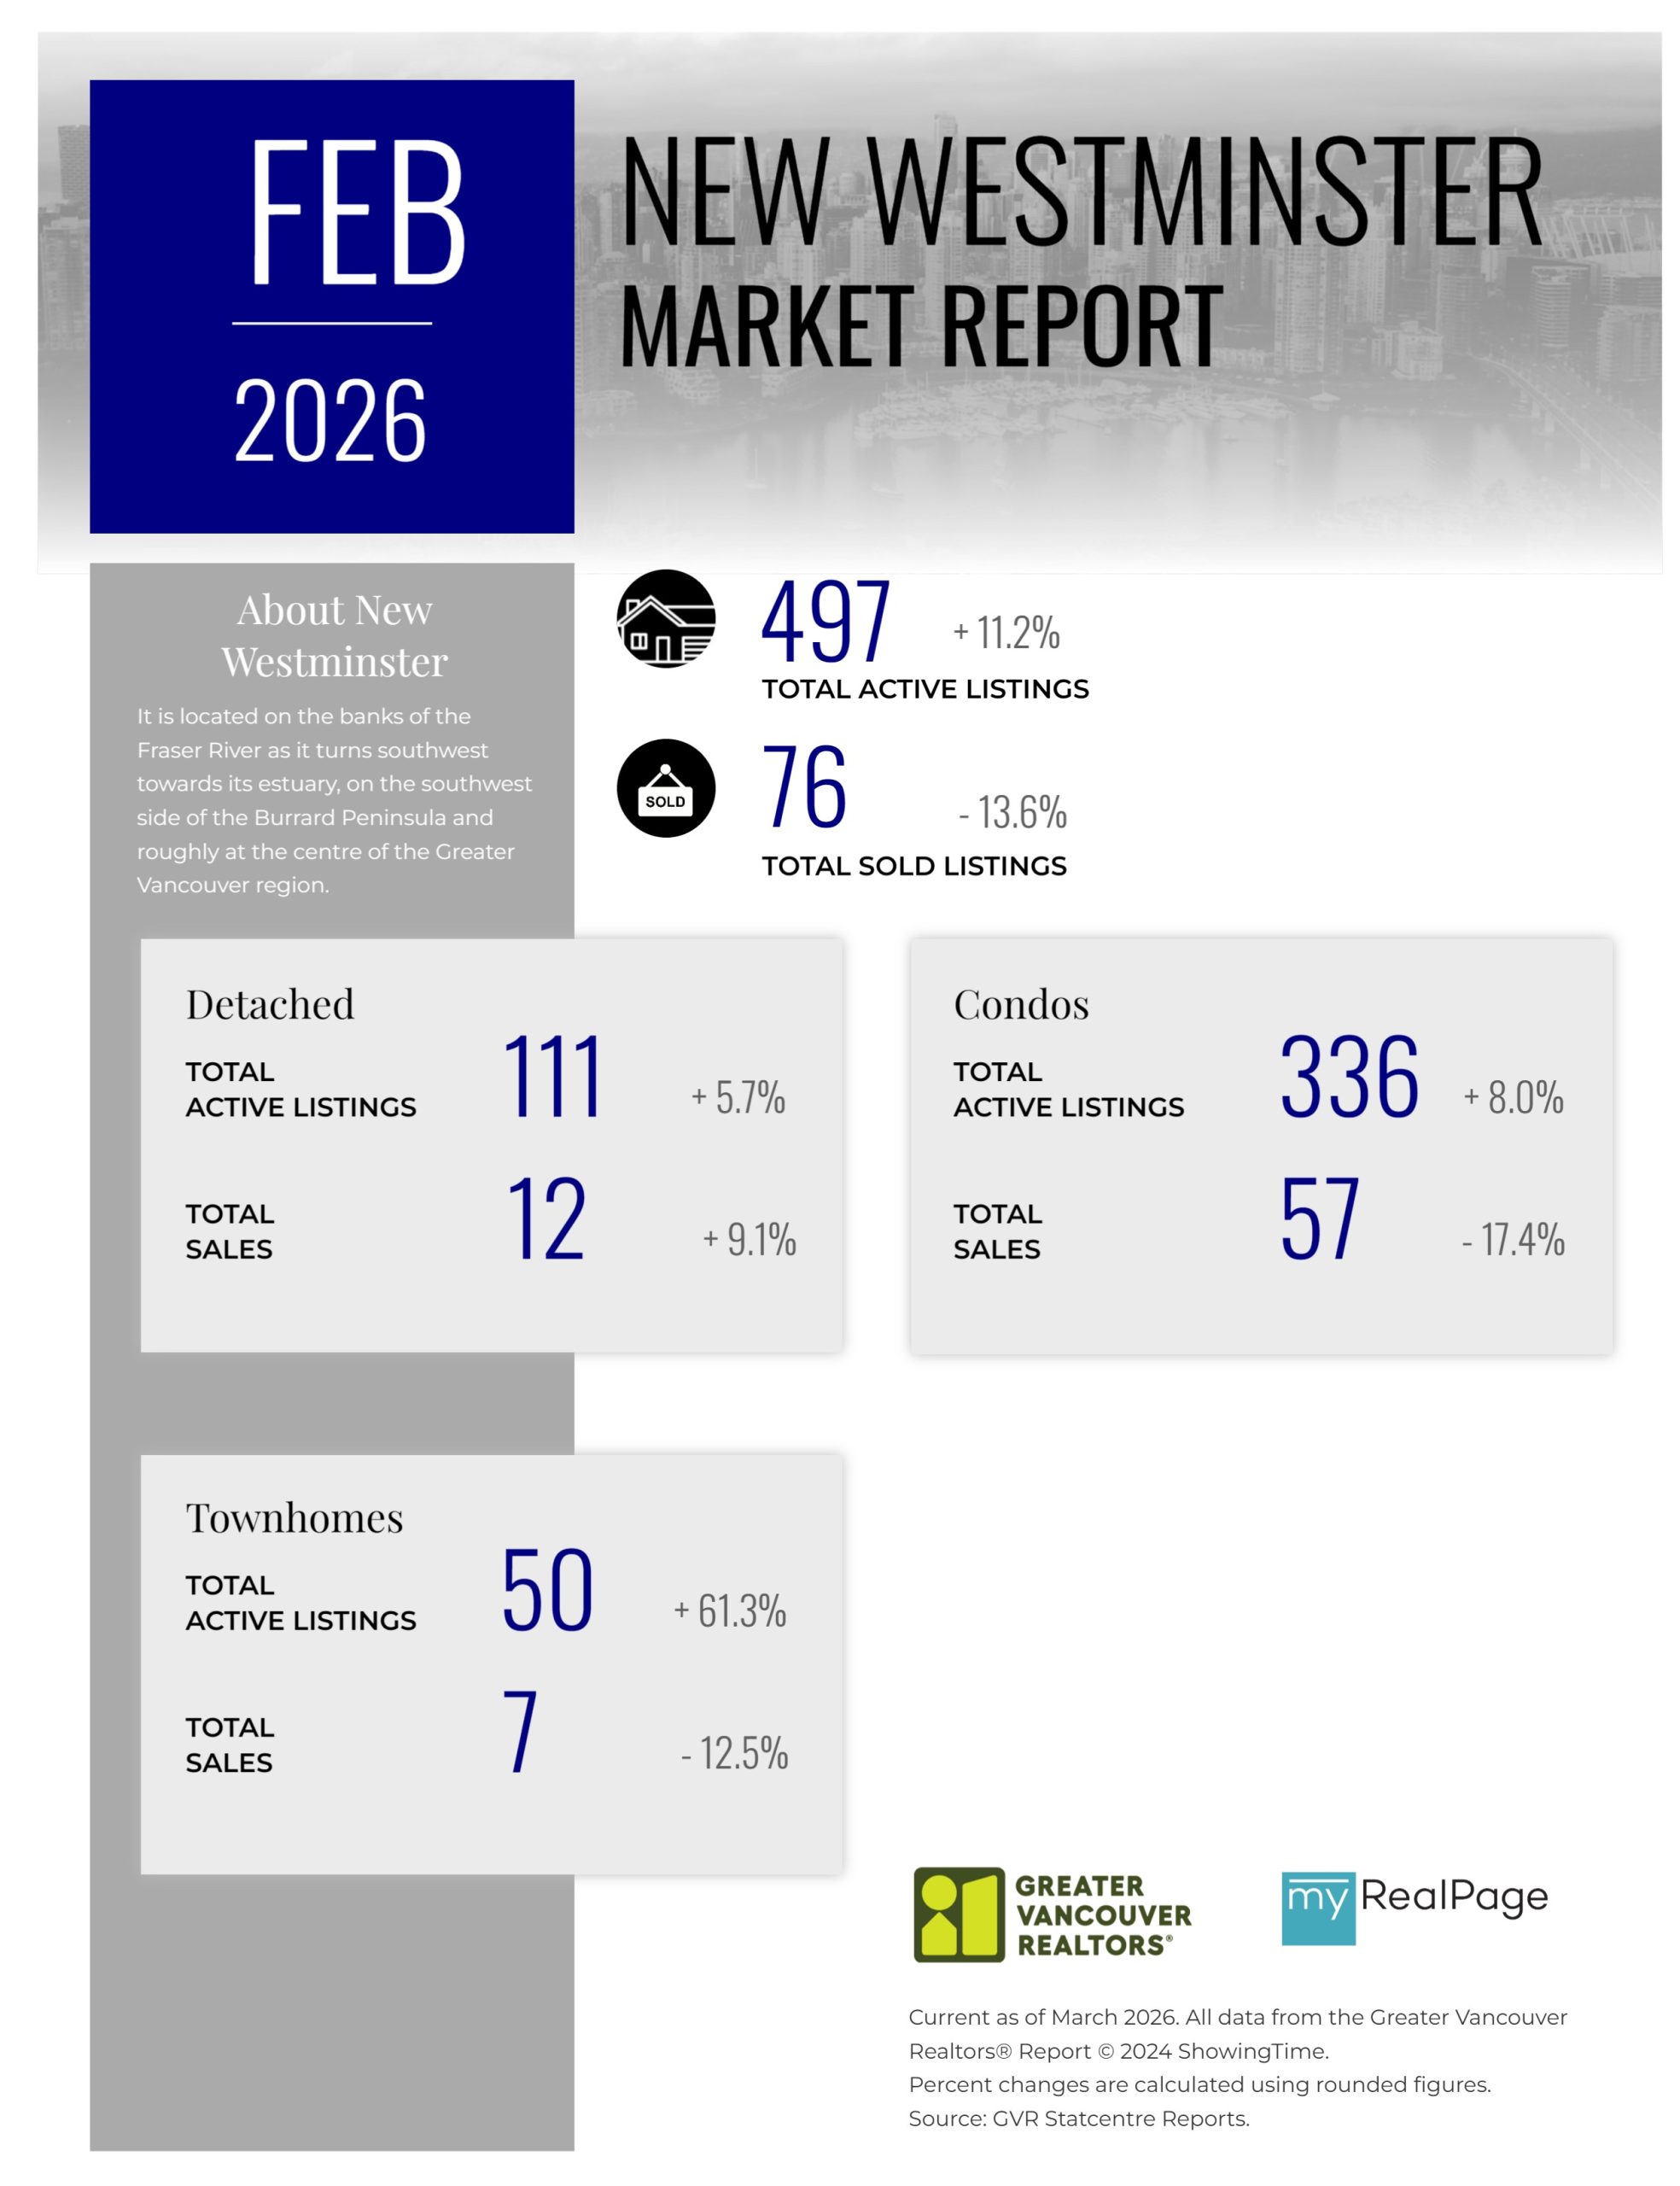
Printable Version – GVR February 2026 Data Infographics Report New Westminster
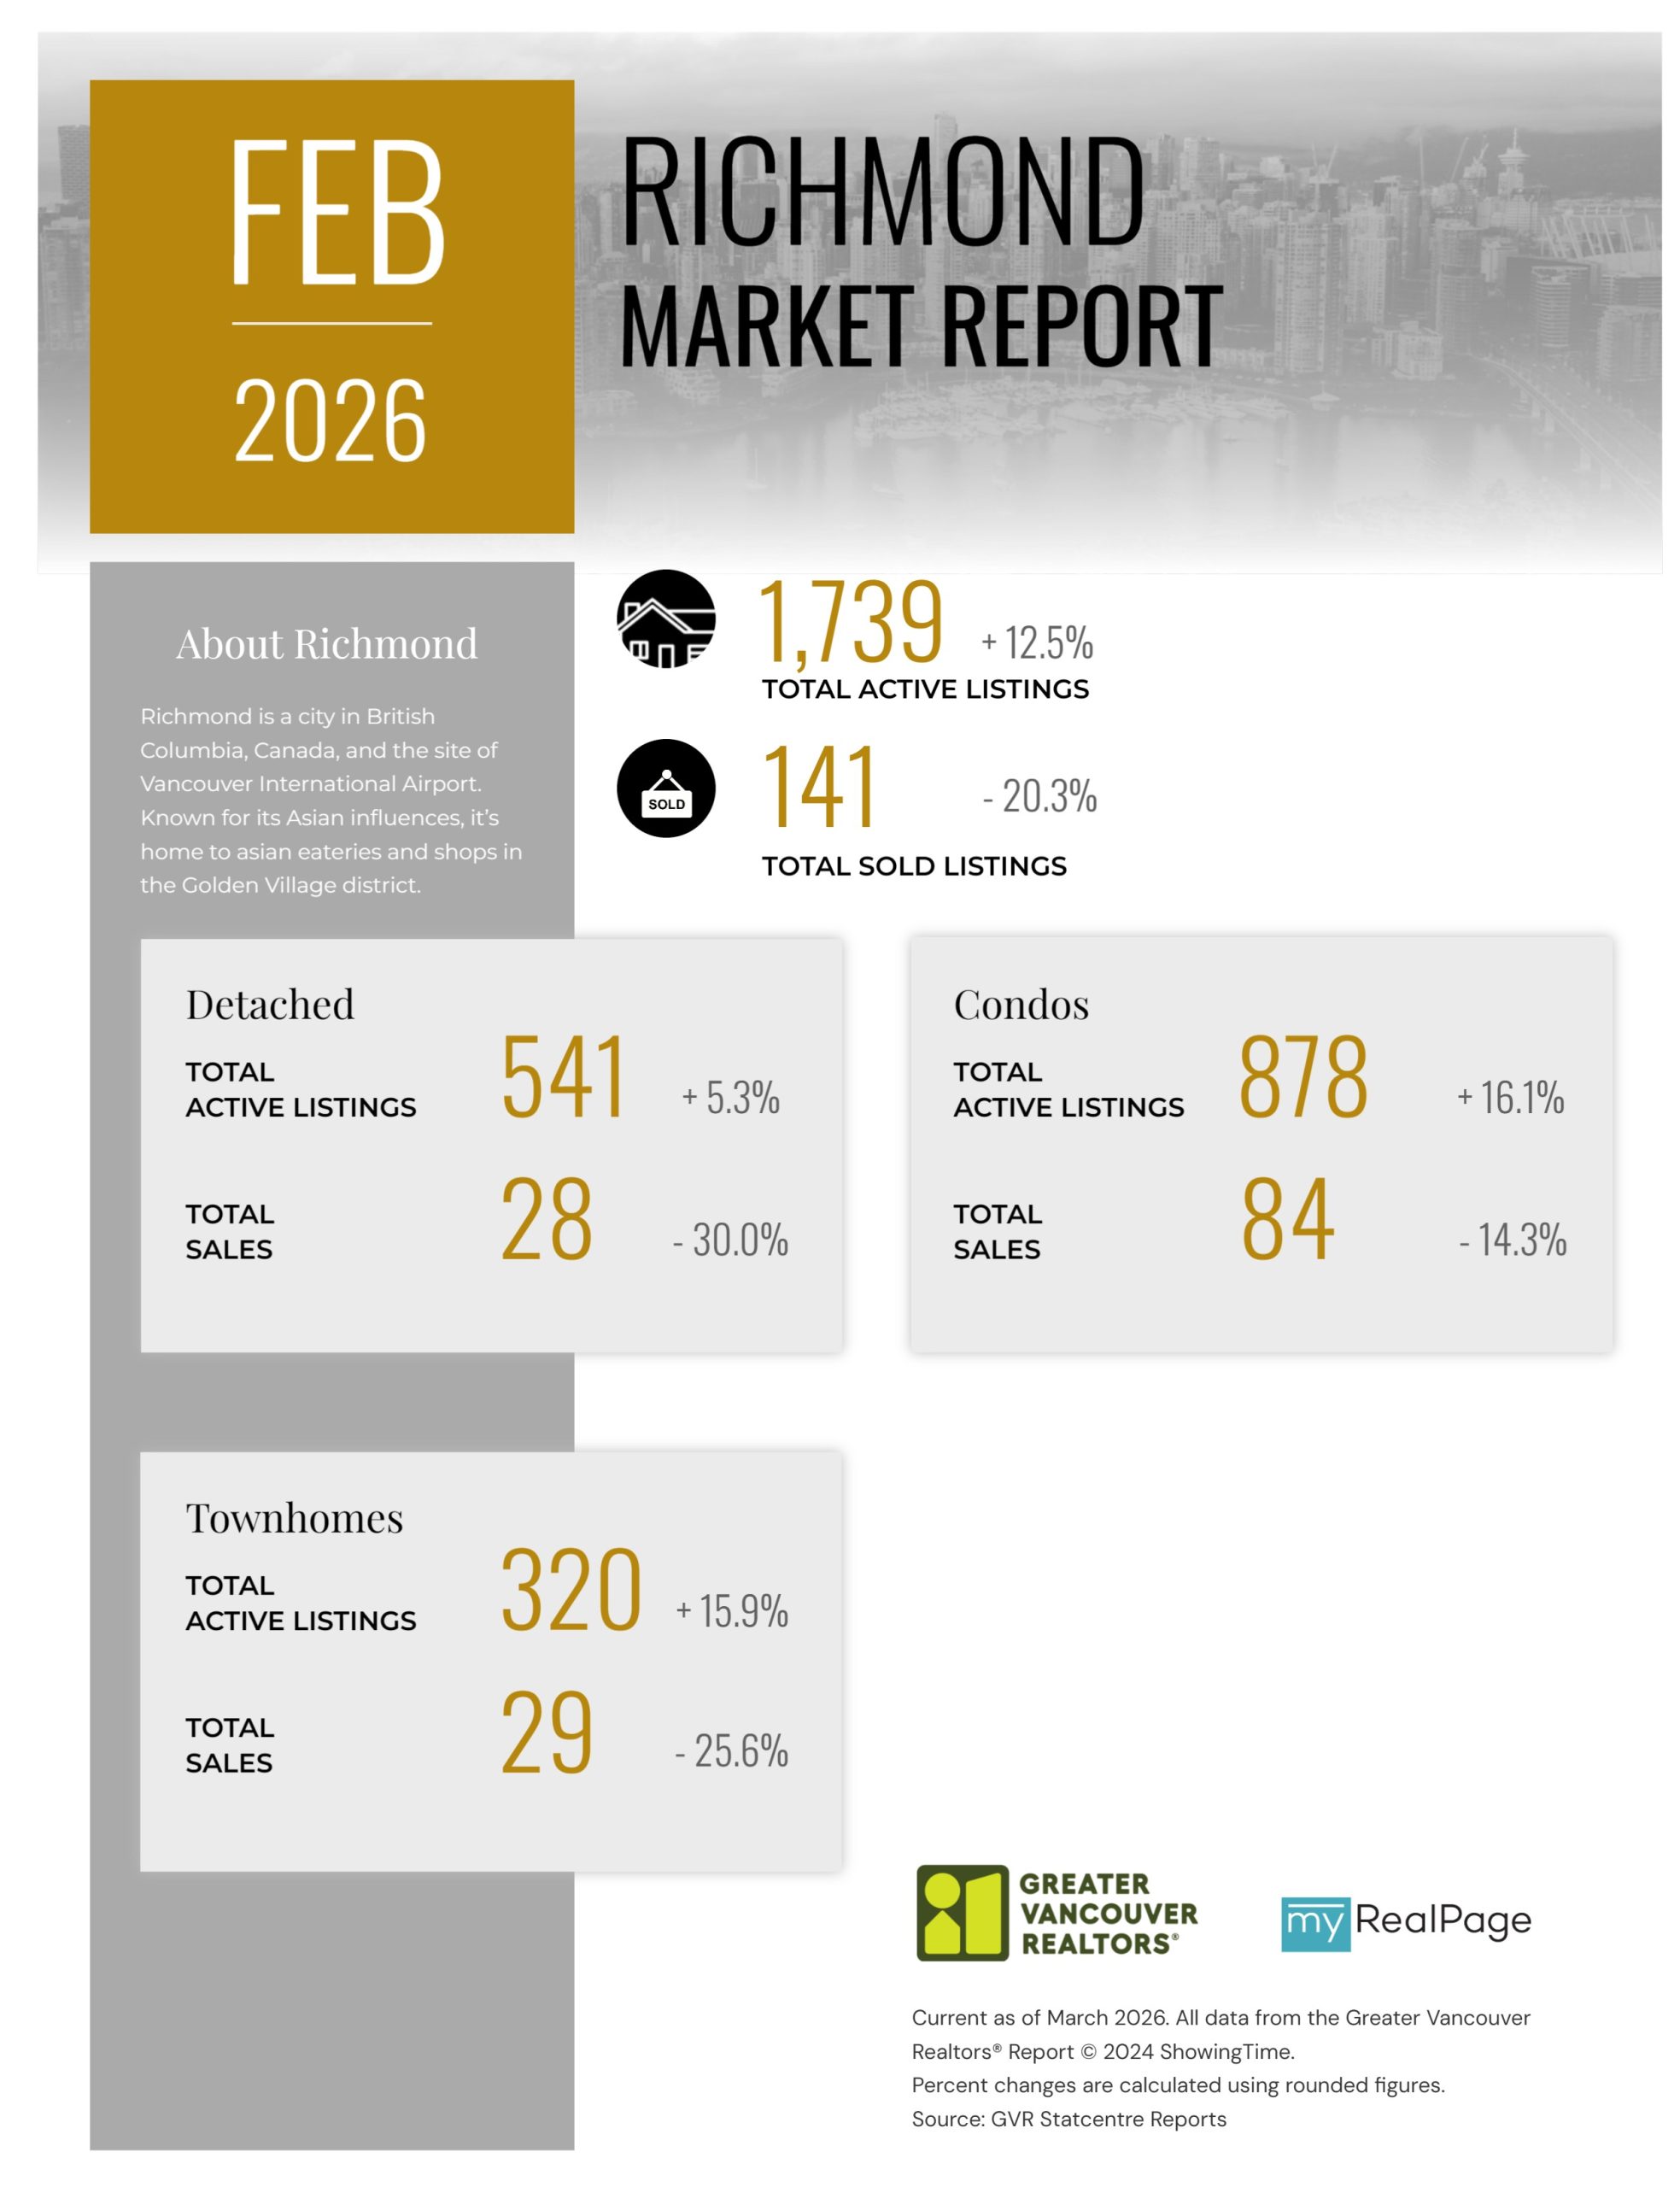
Printable Version – GVR February 2026 Data Infographics Report Richmond
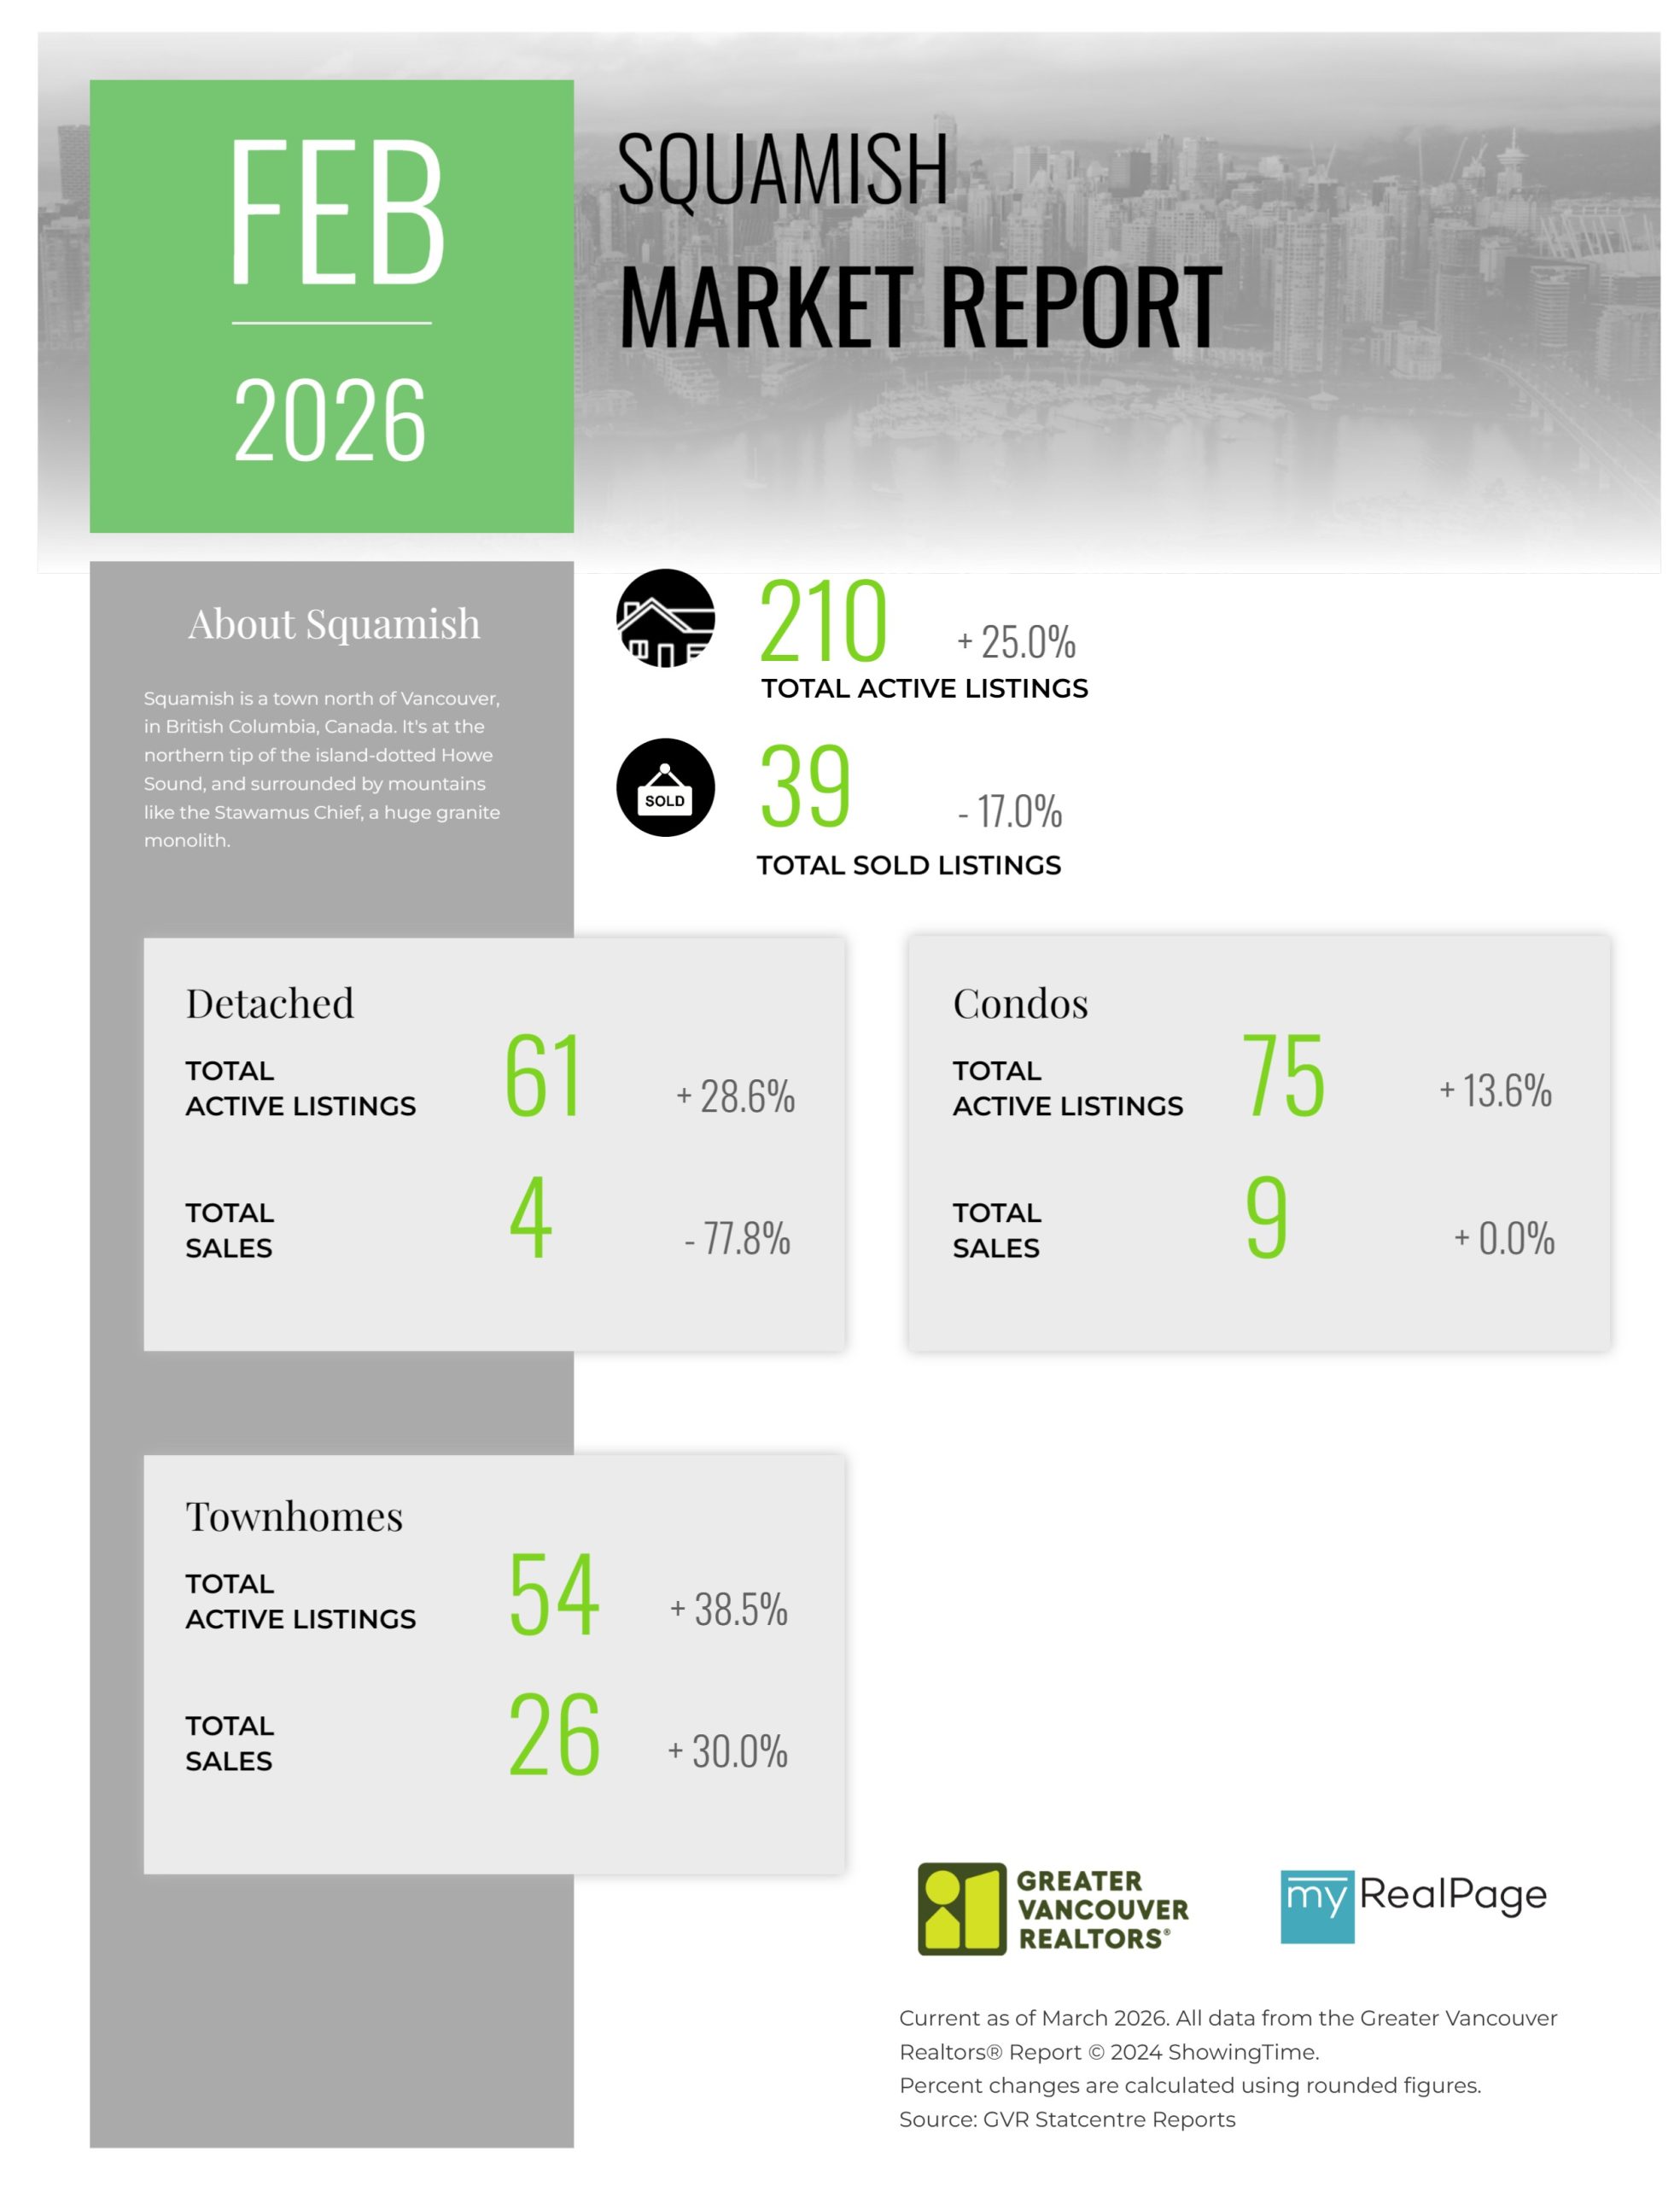
Printable Version – GVR February 2026 Data Infographics Report Squamish
Last Updated on March 8, 2026 by myRealPage
