INFOGRAPHICS: January 2024 REBGV Greater Vancouver Market Reports

Home sales across Metro Vancouver’s housing market off to strong start in 2024
While the Metro Vancouver market ended 2023 in balanced market territory, conditions in January began shifting back in favour of sellers as the pace of newly listed properties did not keep up with the volume of home sales.
The Real Estate Board of Greater Vancouver (REBGV) reports that residential sales in the region totalled 1,427 in January 2024, a 38.5 per cent increase from the 1,030 sales recorded in January 2023. This was 20.2 per cent below the 10-year seasonal average (1,788).
“It’s hard to believe that January sales figures came in so strong after such a quiet December, which saw many buyers and sellers delaying major decisions. If sellers don’t step off the sidelines soon, the competition among buyers could tilt the market back into sellers’ territory as the available inventory struggles to keep pace with demand.” Andrew Lis, REBGV director of economics and data analytics
Read the full report on the REBGV website!
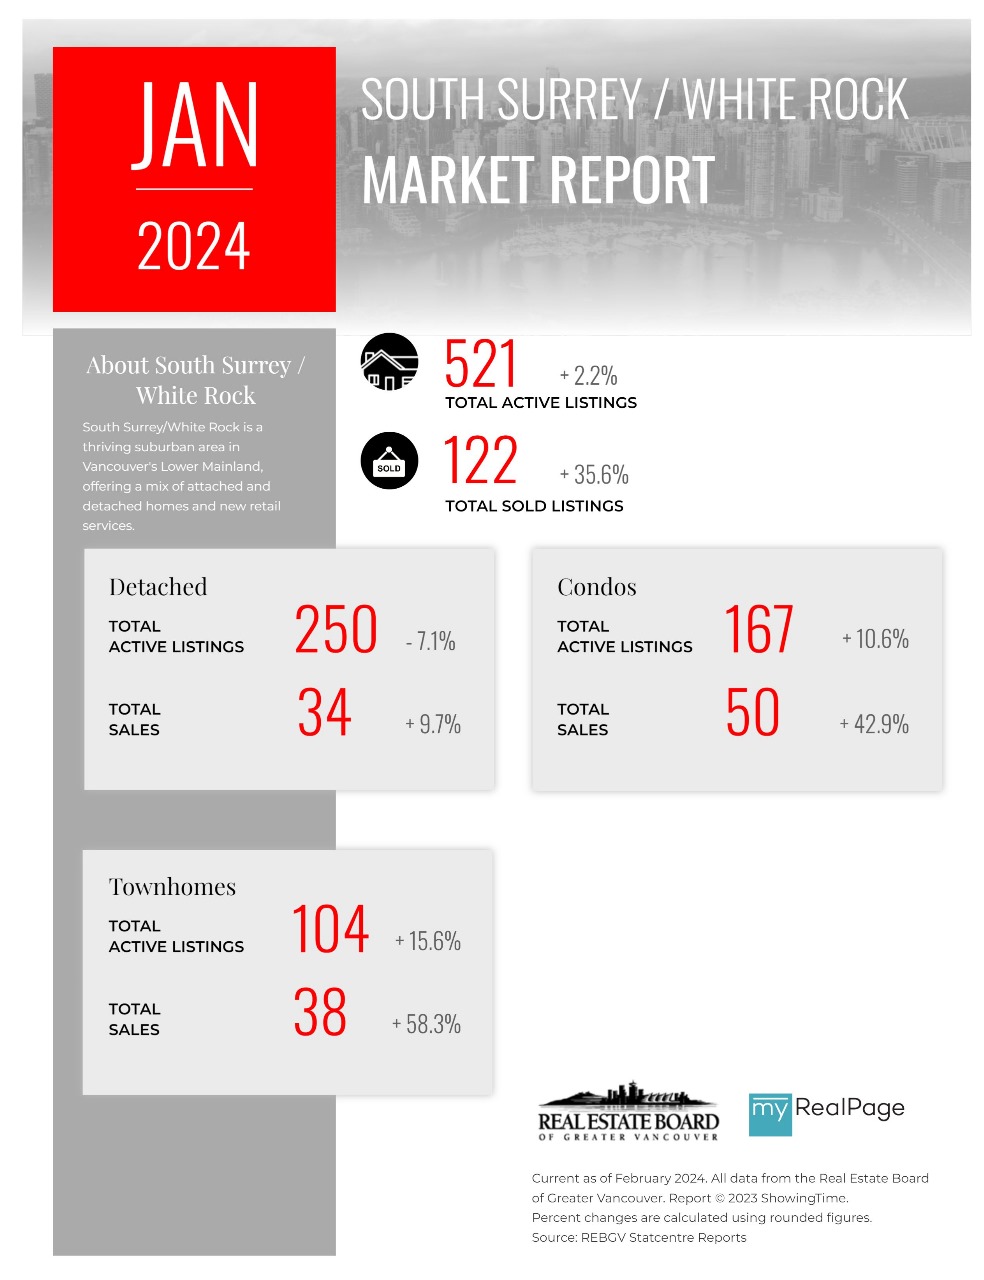
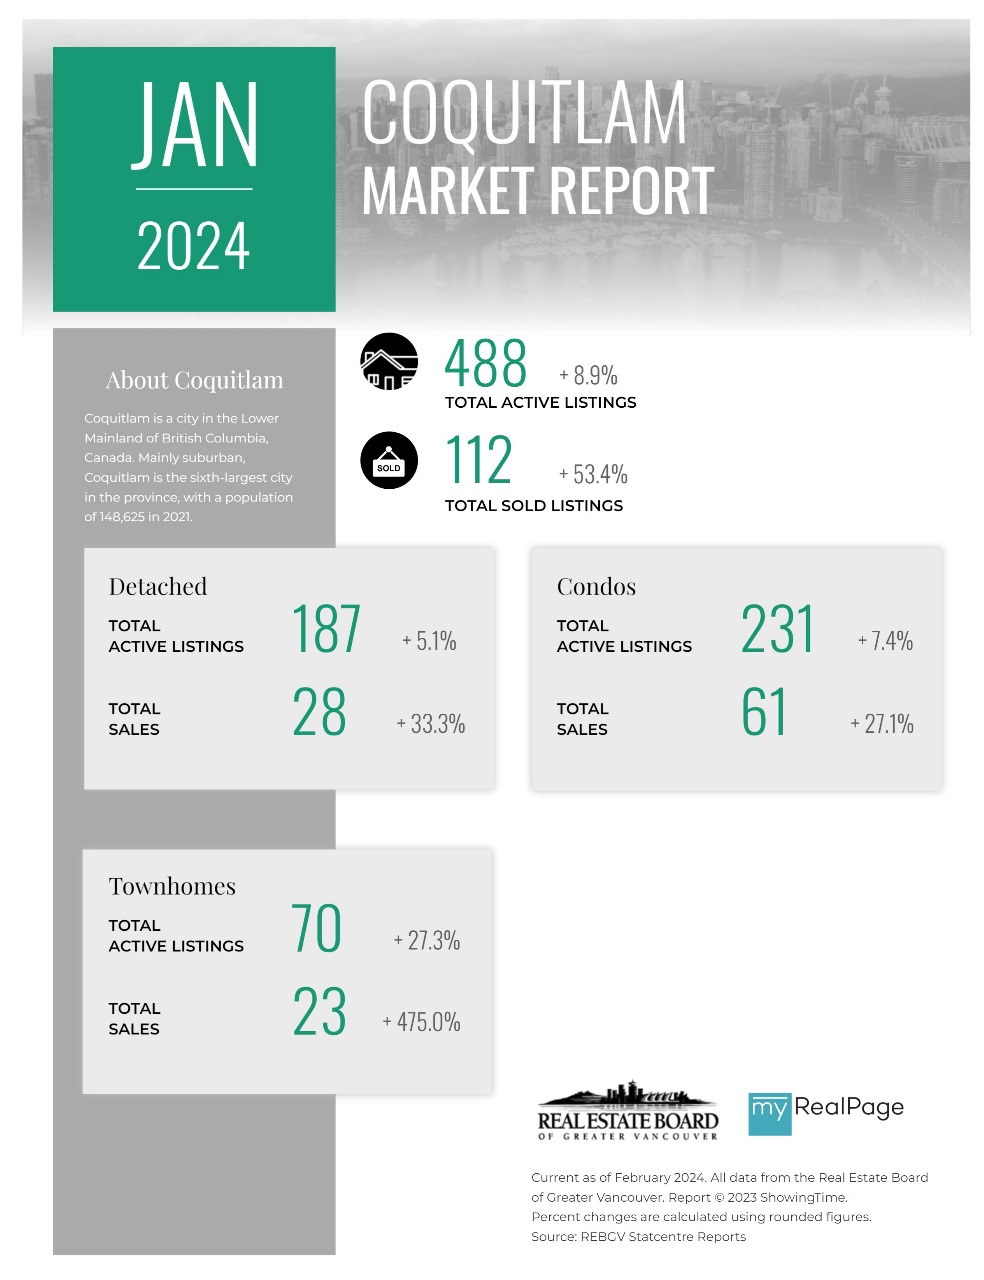
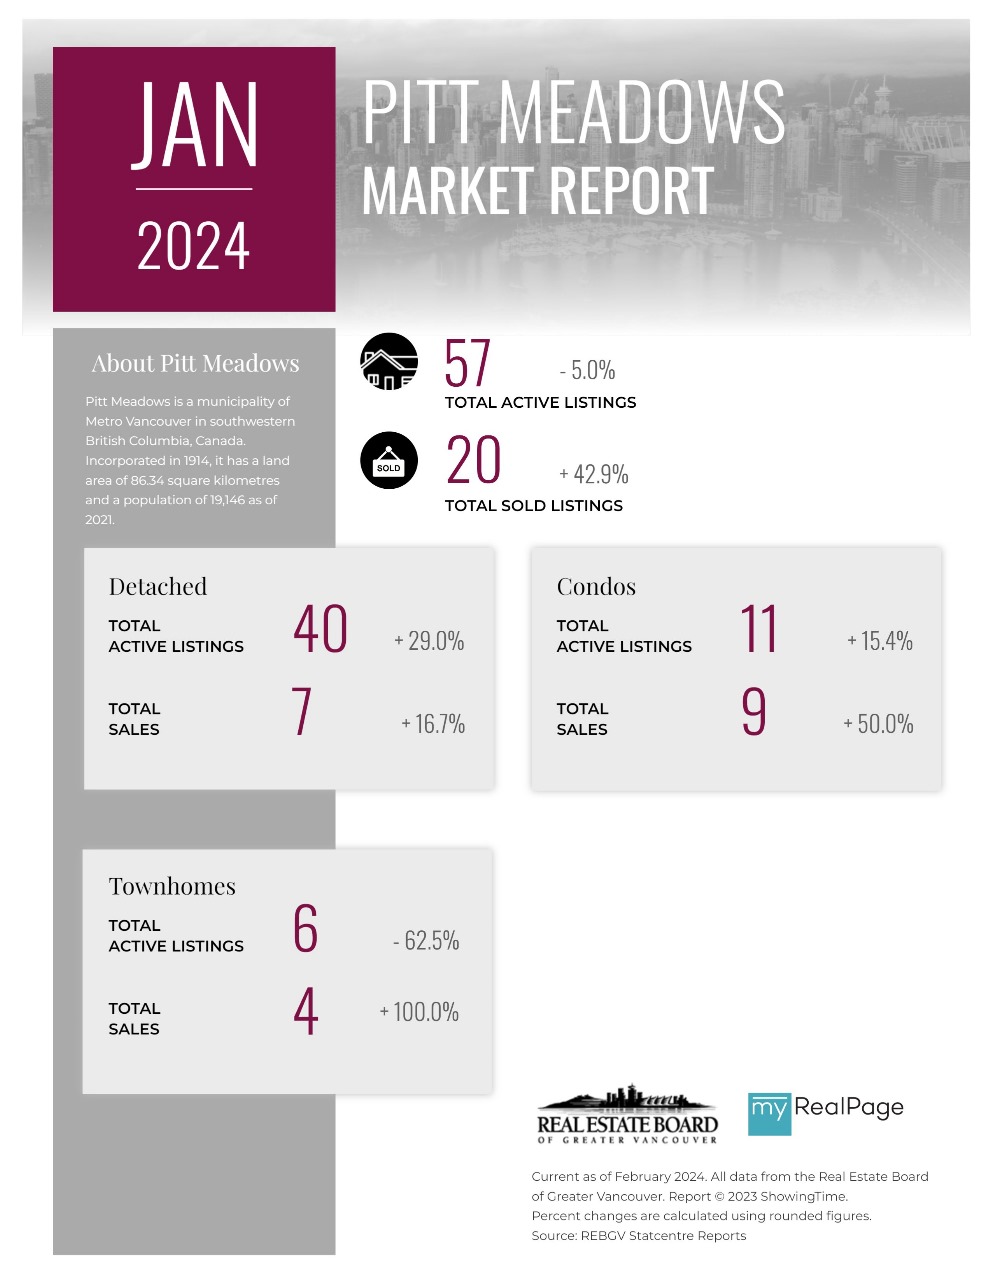
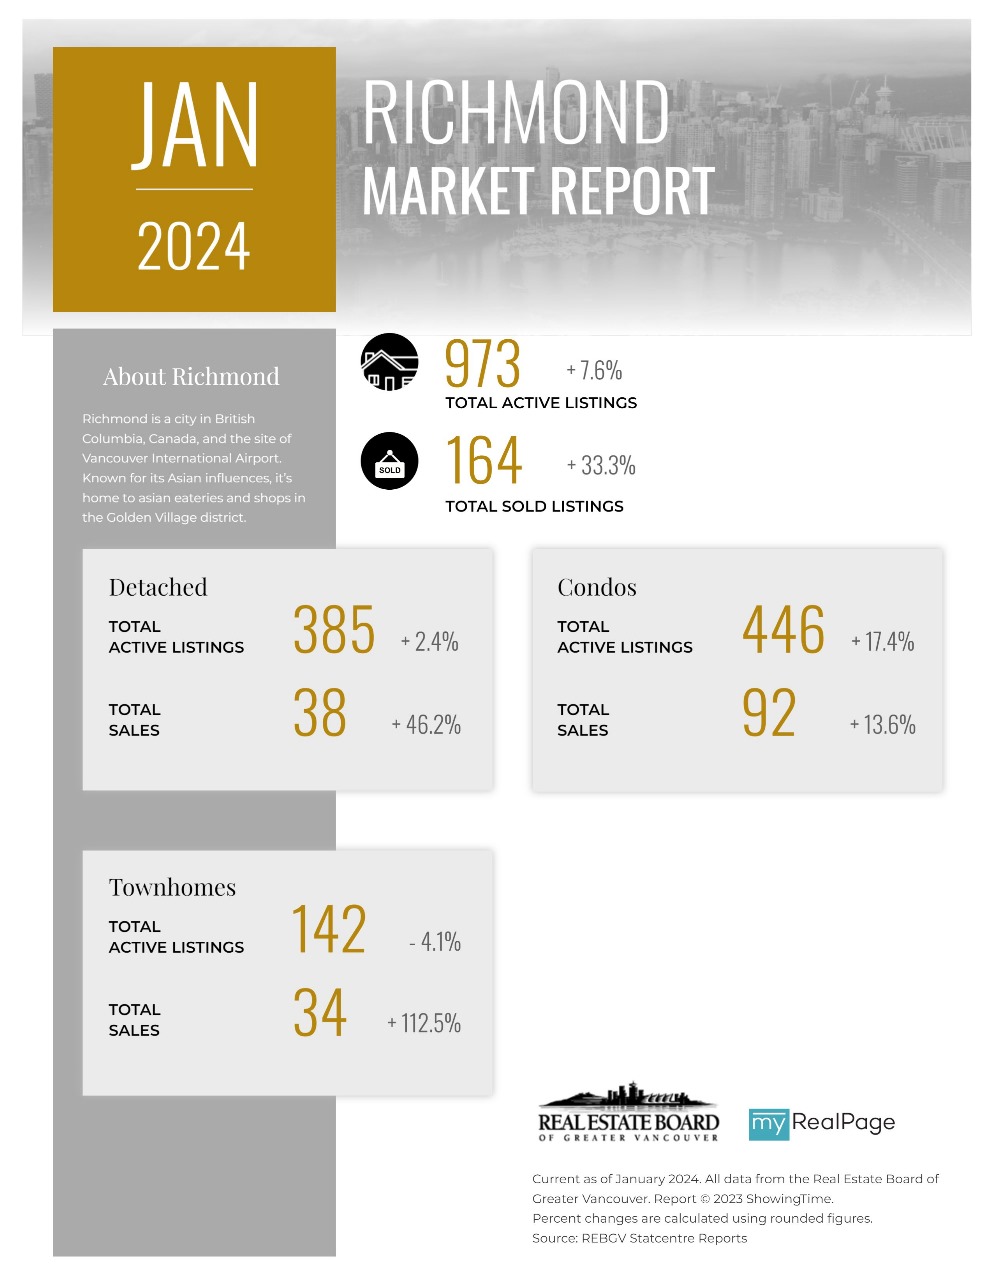
The following data is a comparison between January 2024 and January 2023 numbers, and is current as of February 2024. For last month’s update, you can check out our previous post!
Or follow this link for all our REBGV Infographics!
These infographics cover current trends in several areas within the Greater Vancouver region. Click on the images for a larger view!
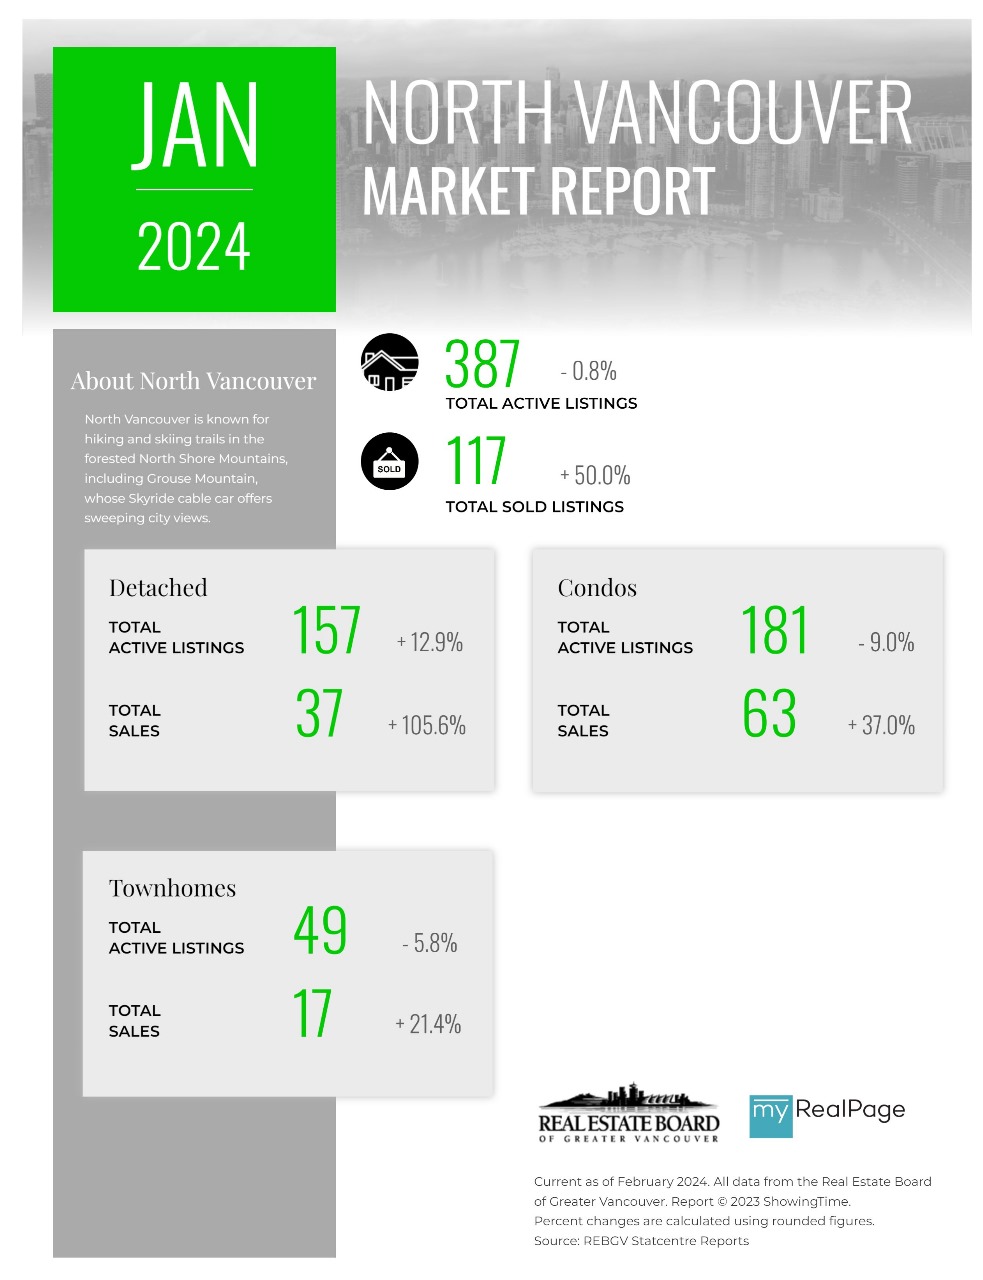
Printable Version – REBGV January 20243 Data Infographic Report North Vancouver
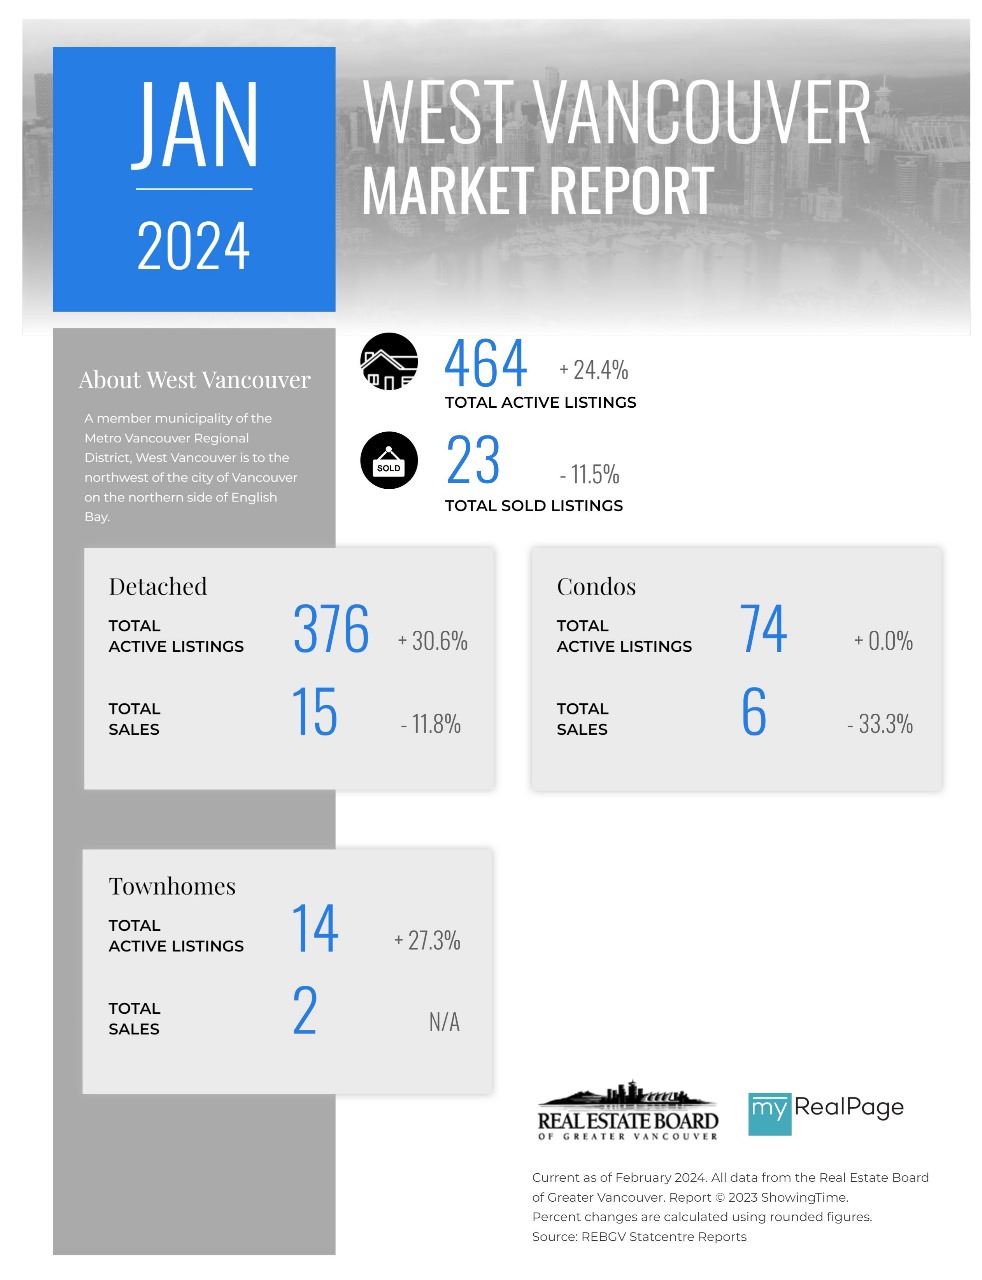
Printable Version – REBGV January 2024 Data Infographics Report West Vancouver
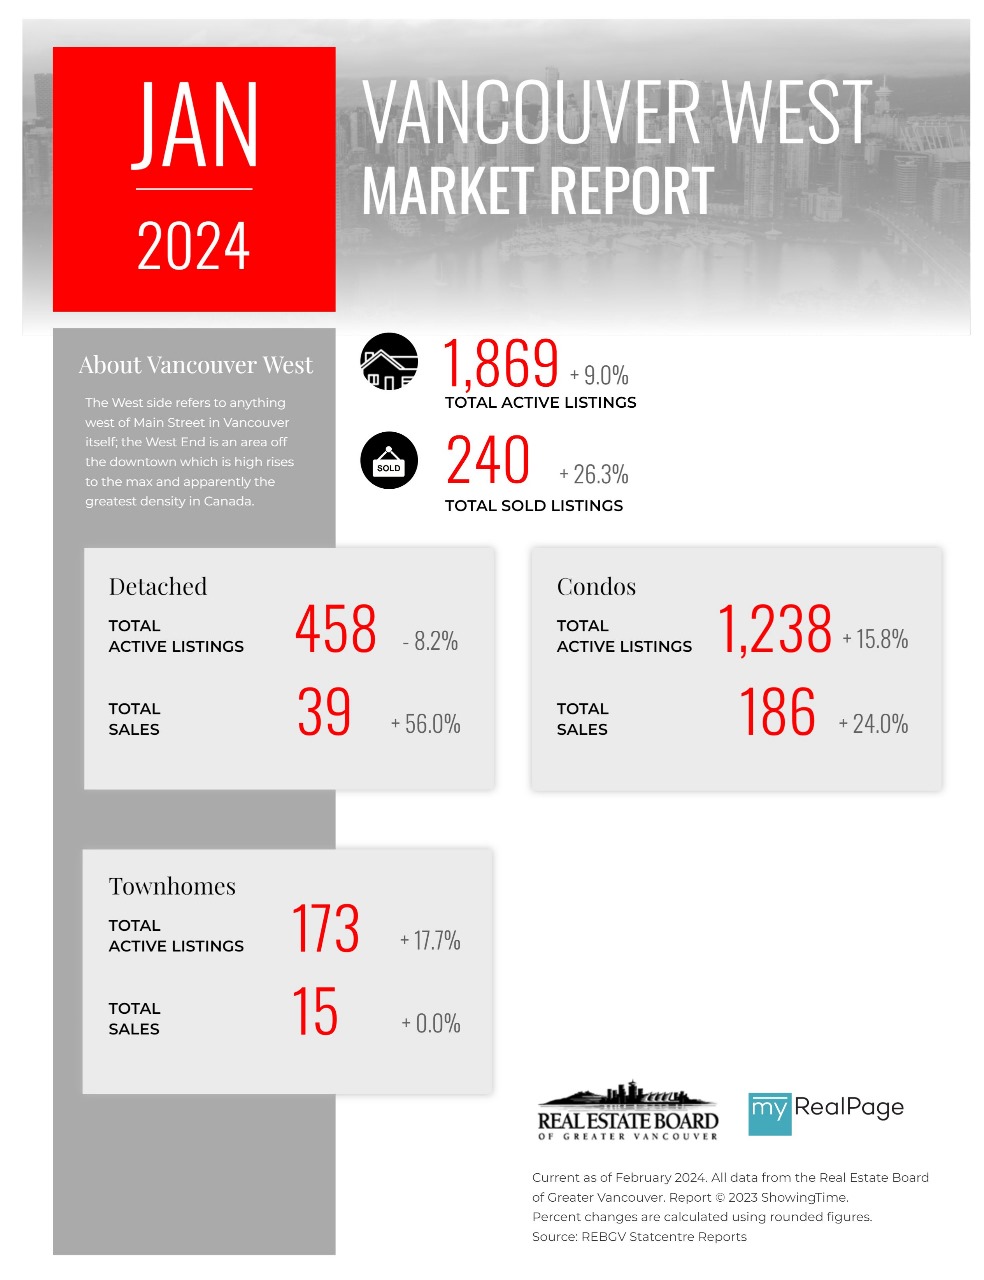
Printable Version – REBGV January 2024 Data Infographics Report Vancouver West
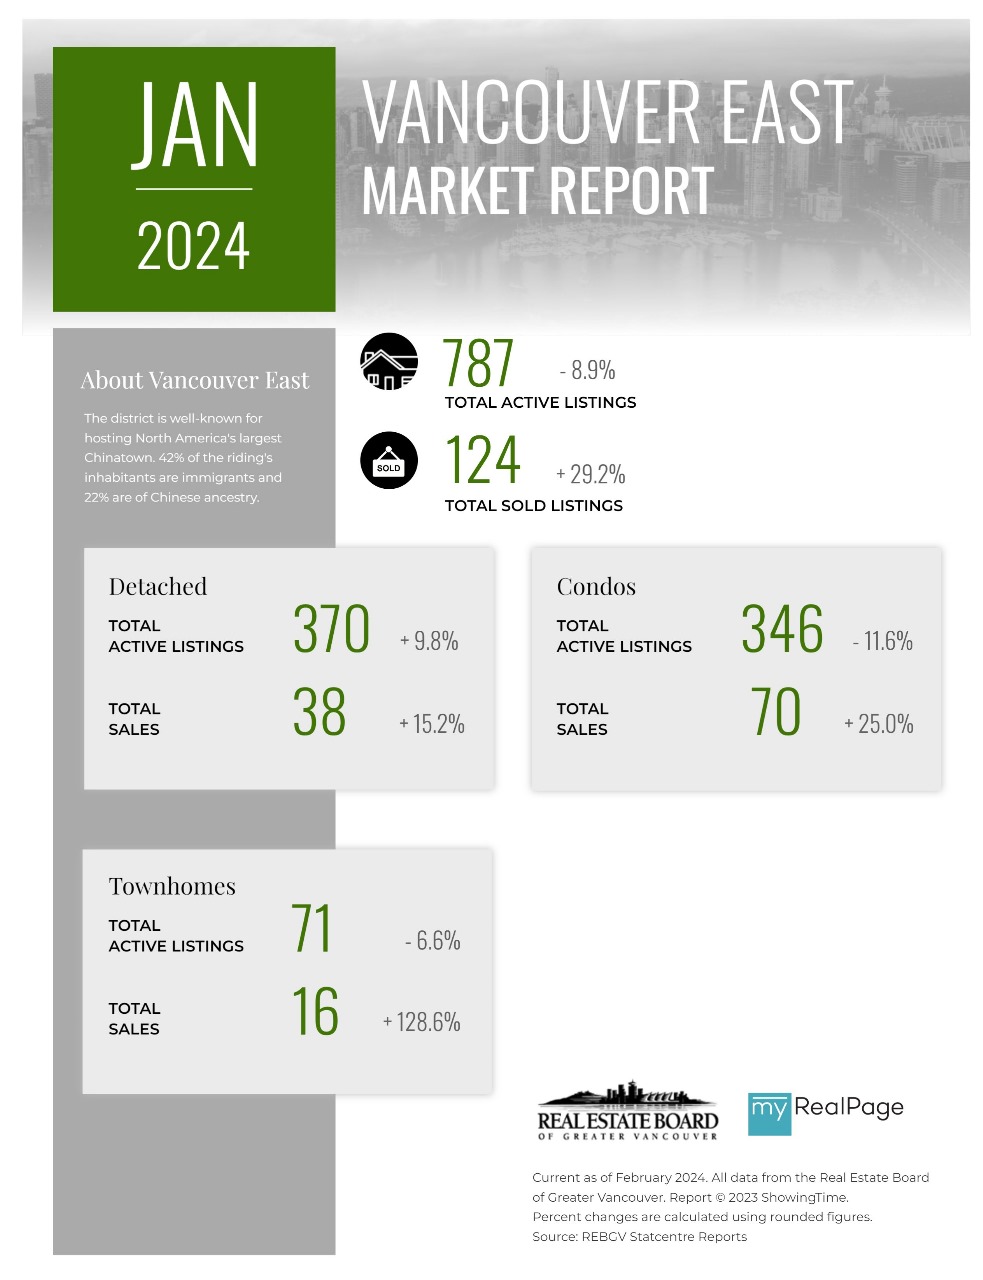
Printable Version – REBGV January 2024 Data Infographics Report Vancouver East
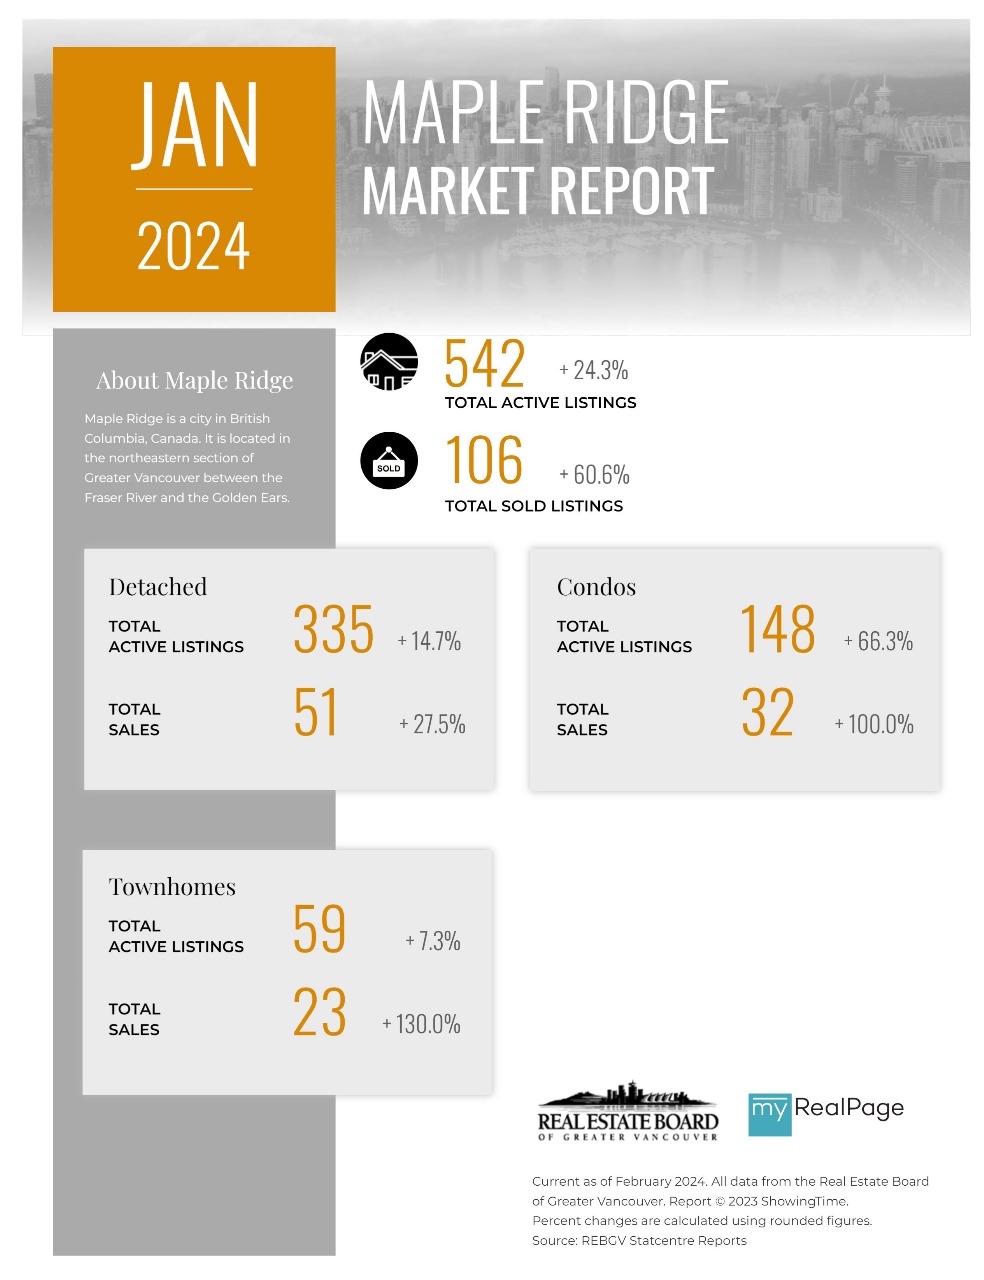
Printable Version – REBGV January 2024 Data Infographic Report Maple Ridge
Printable Version – REBGV January 2024 Data Infographics Report Pitt Meadows
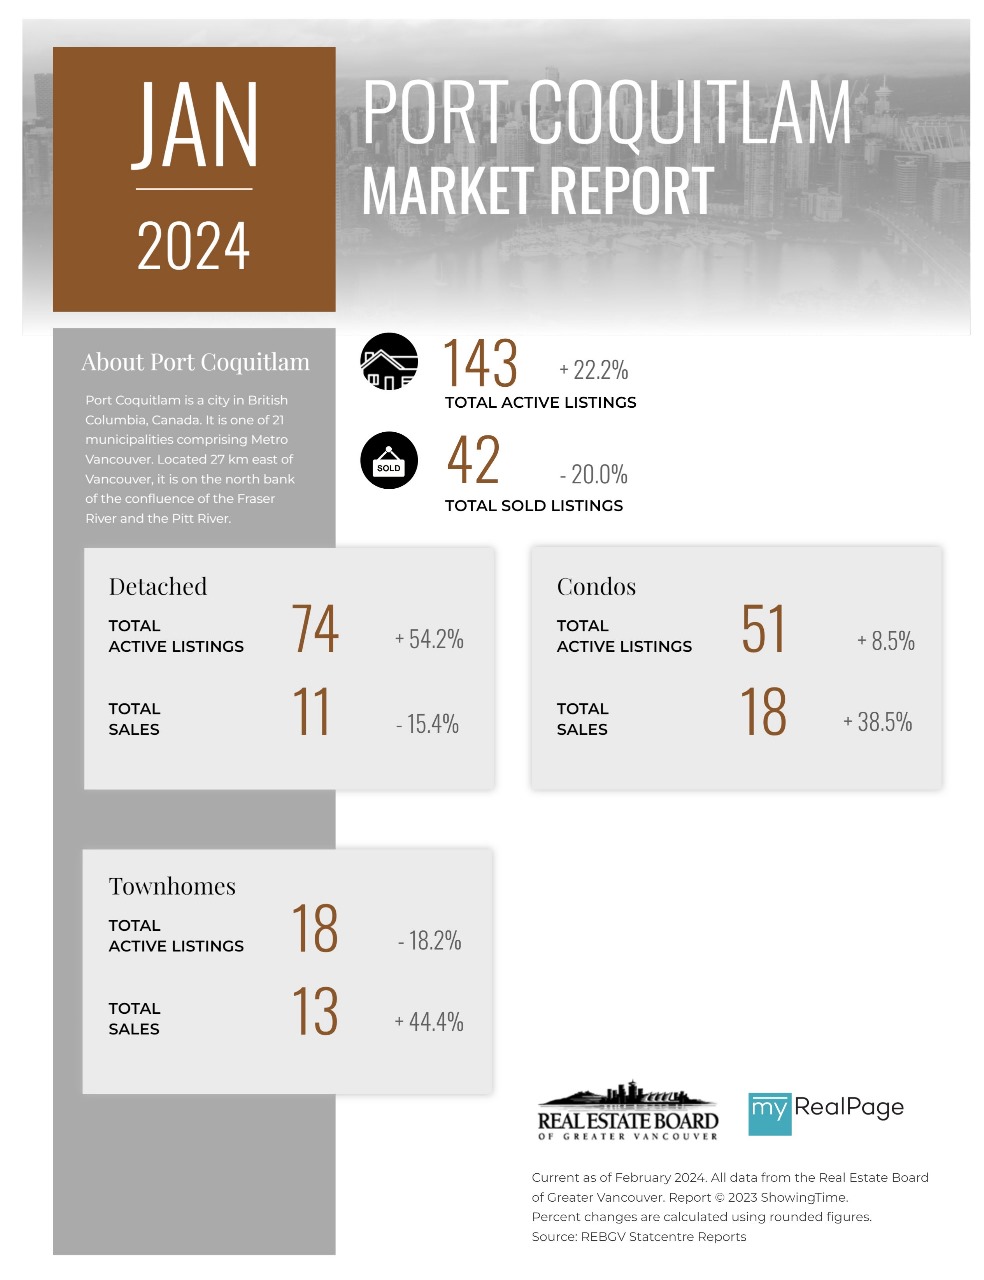
Printable Version – REBGV January 2024 Data Infographics Report Port Coquitlam
Printable Version – REBGV January 2024 Data Infographics Report Coquitlam
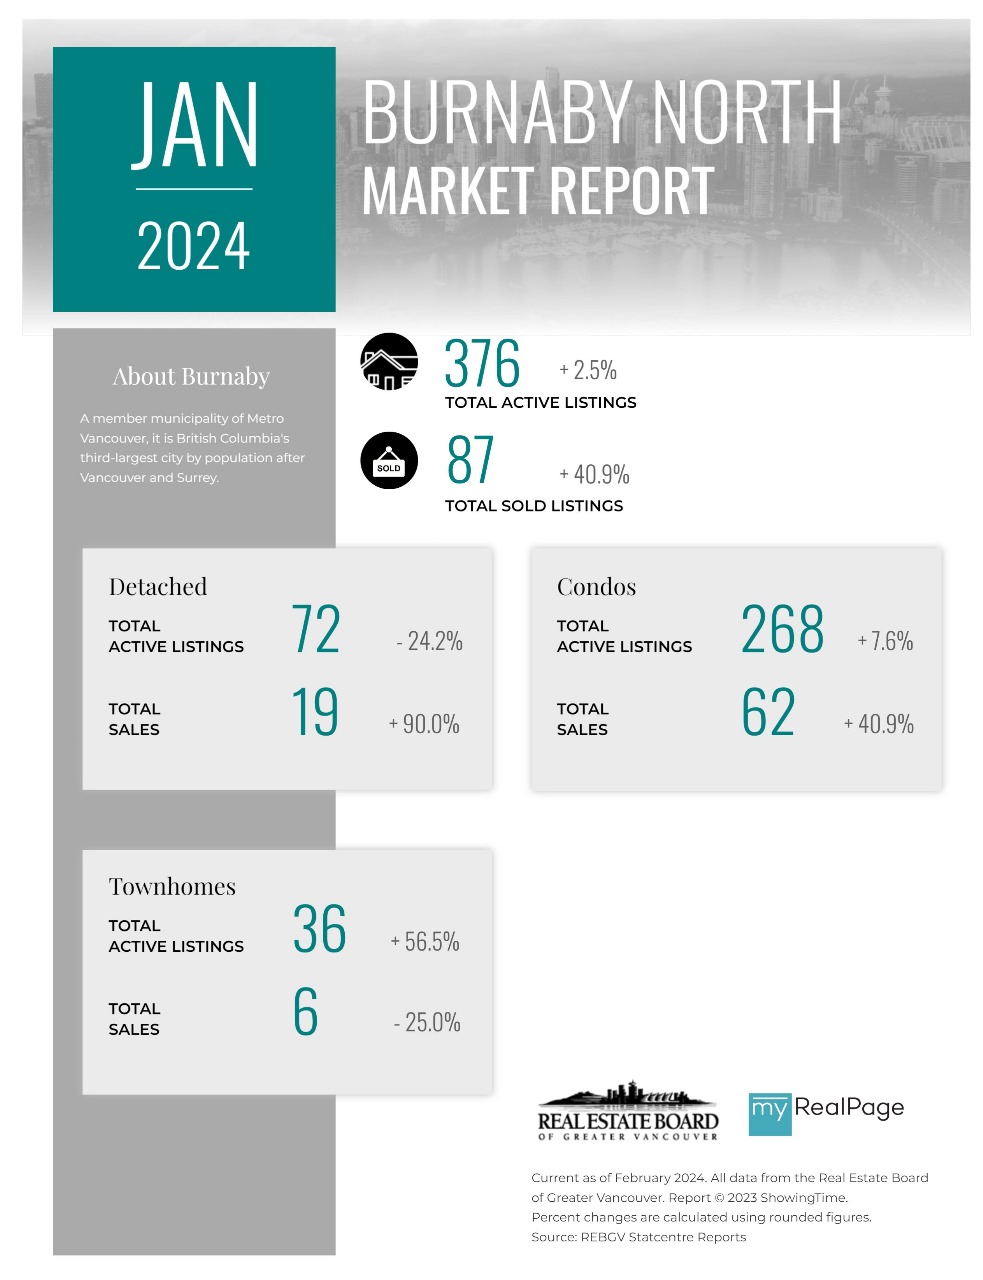
Printable Version – REBGV January 2024 Data Infographic Report Burnaby North
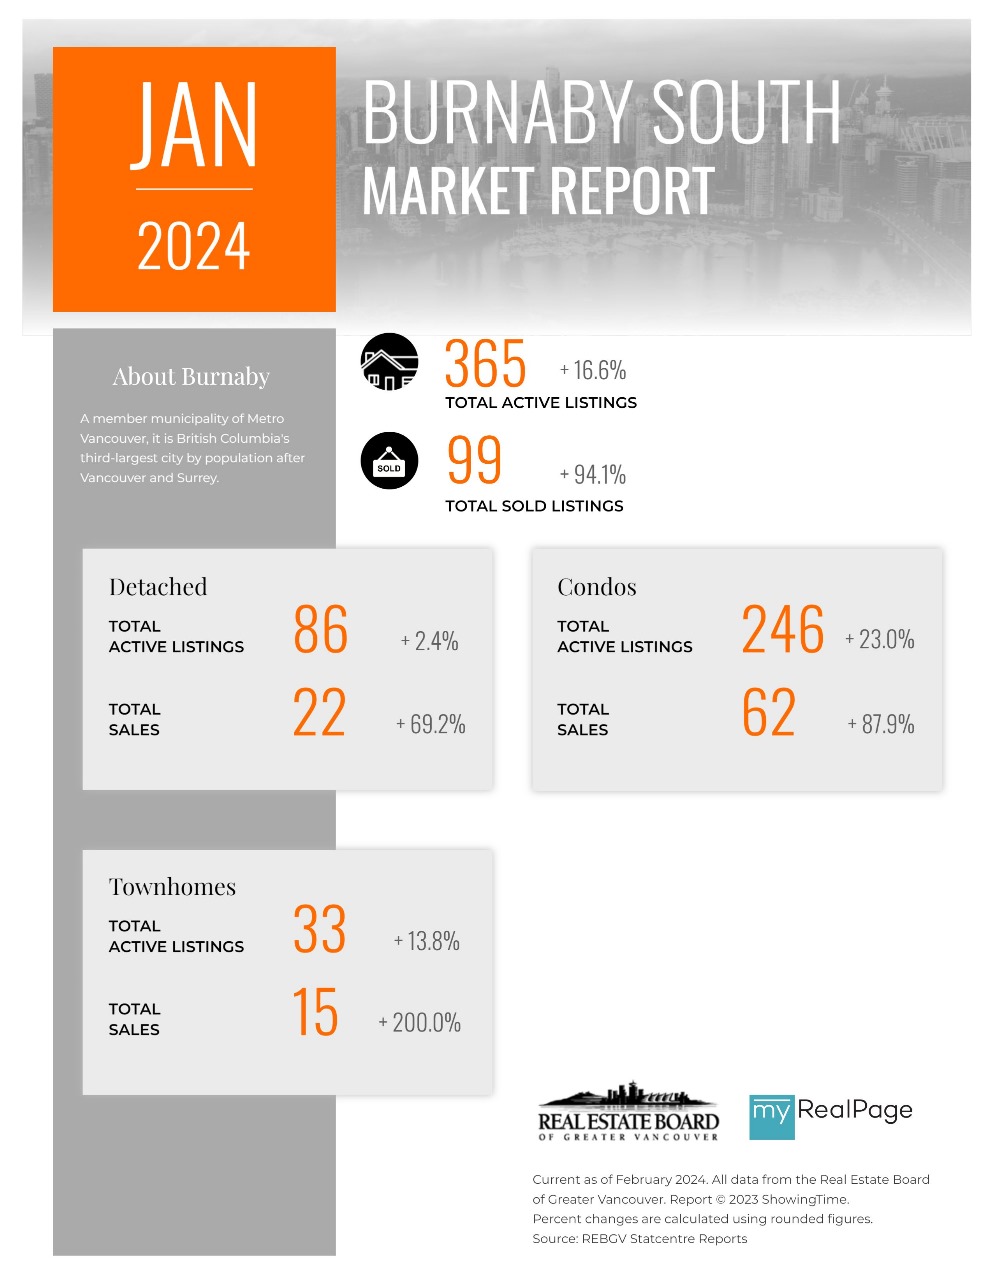
Printable Version – REBGV January 2024 Data Infographics Report Burnaby South
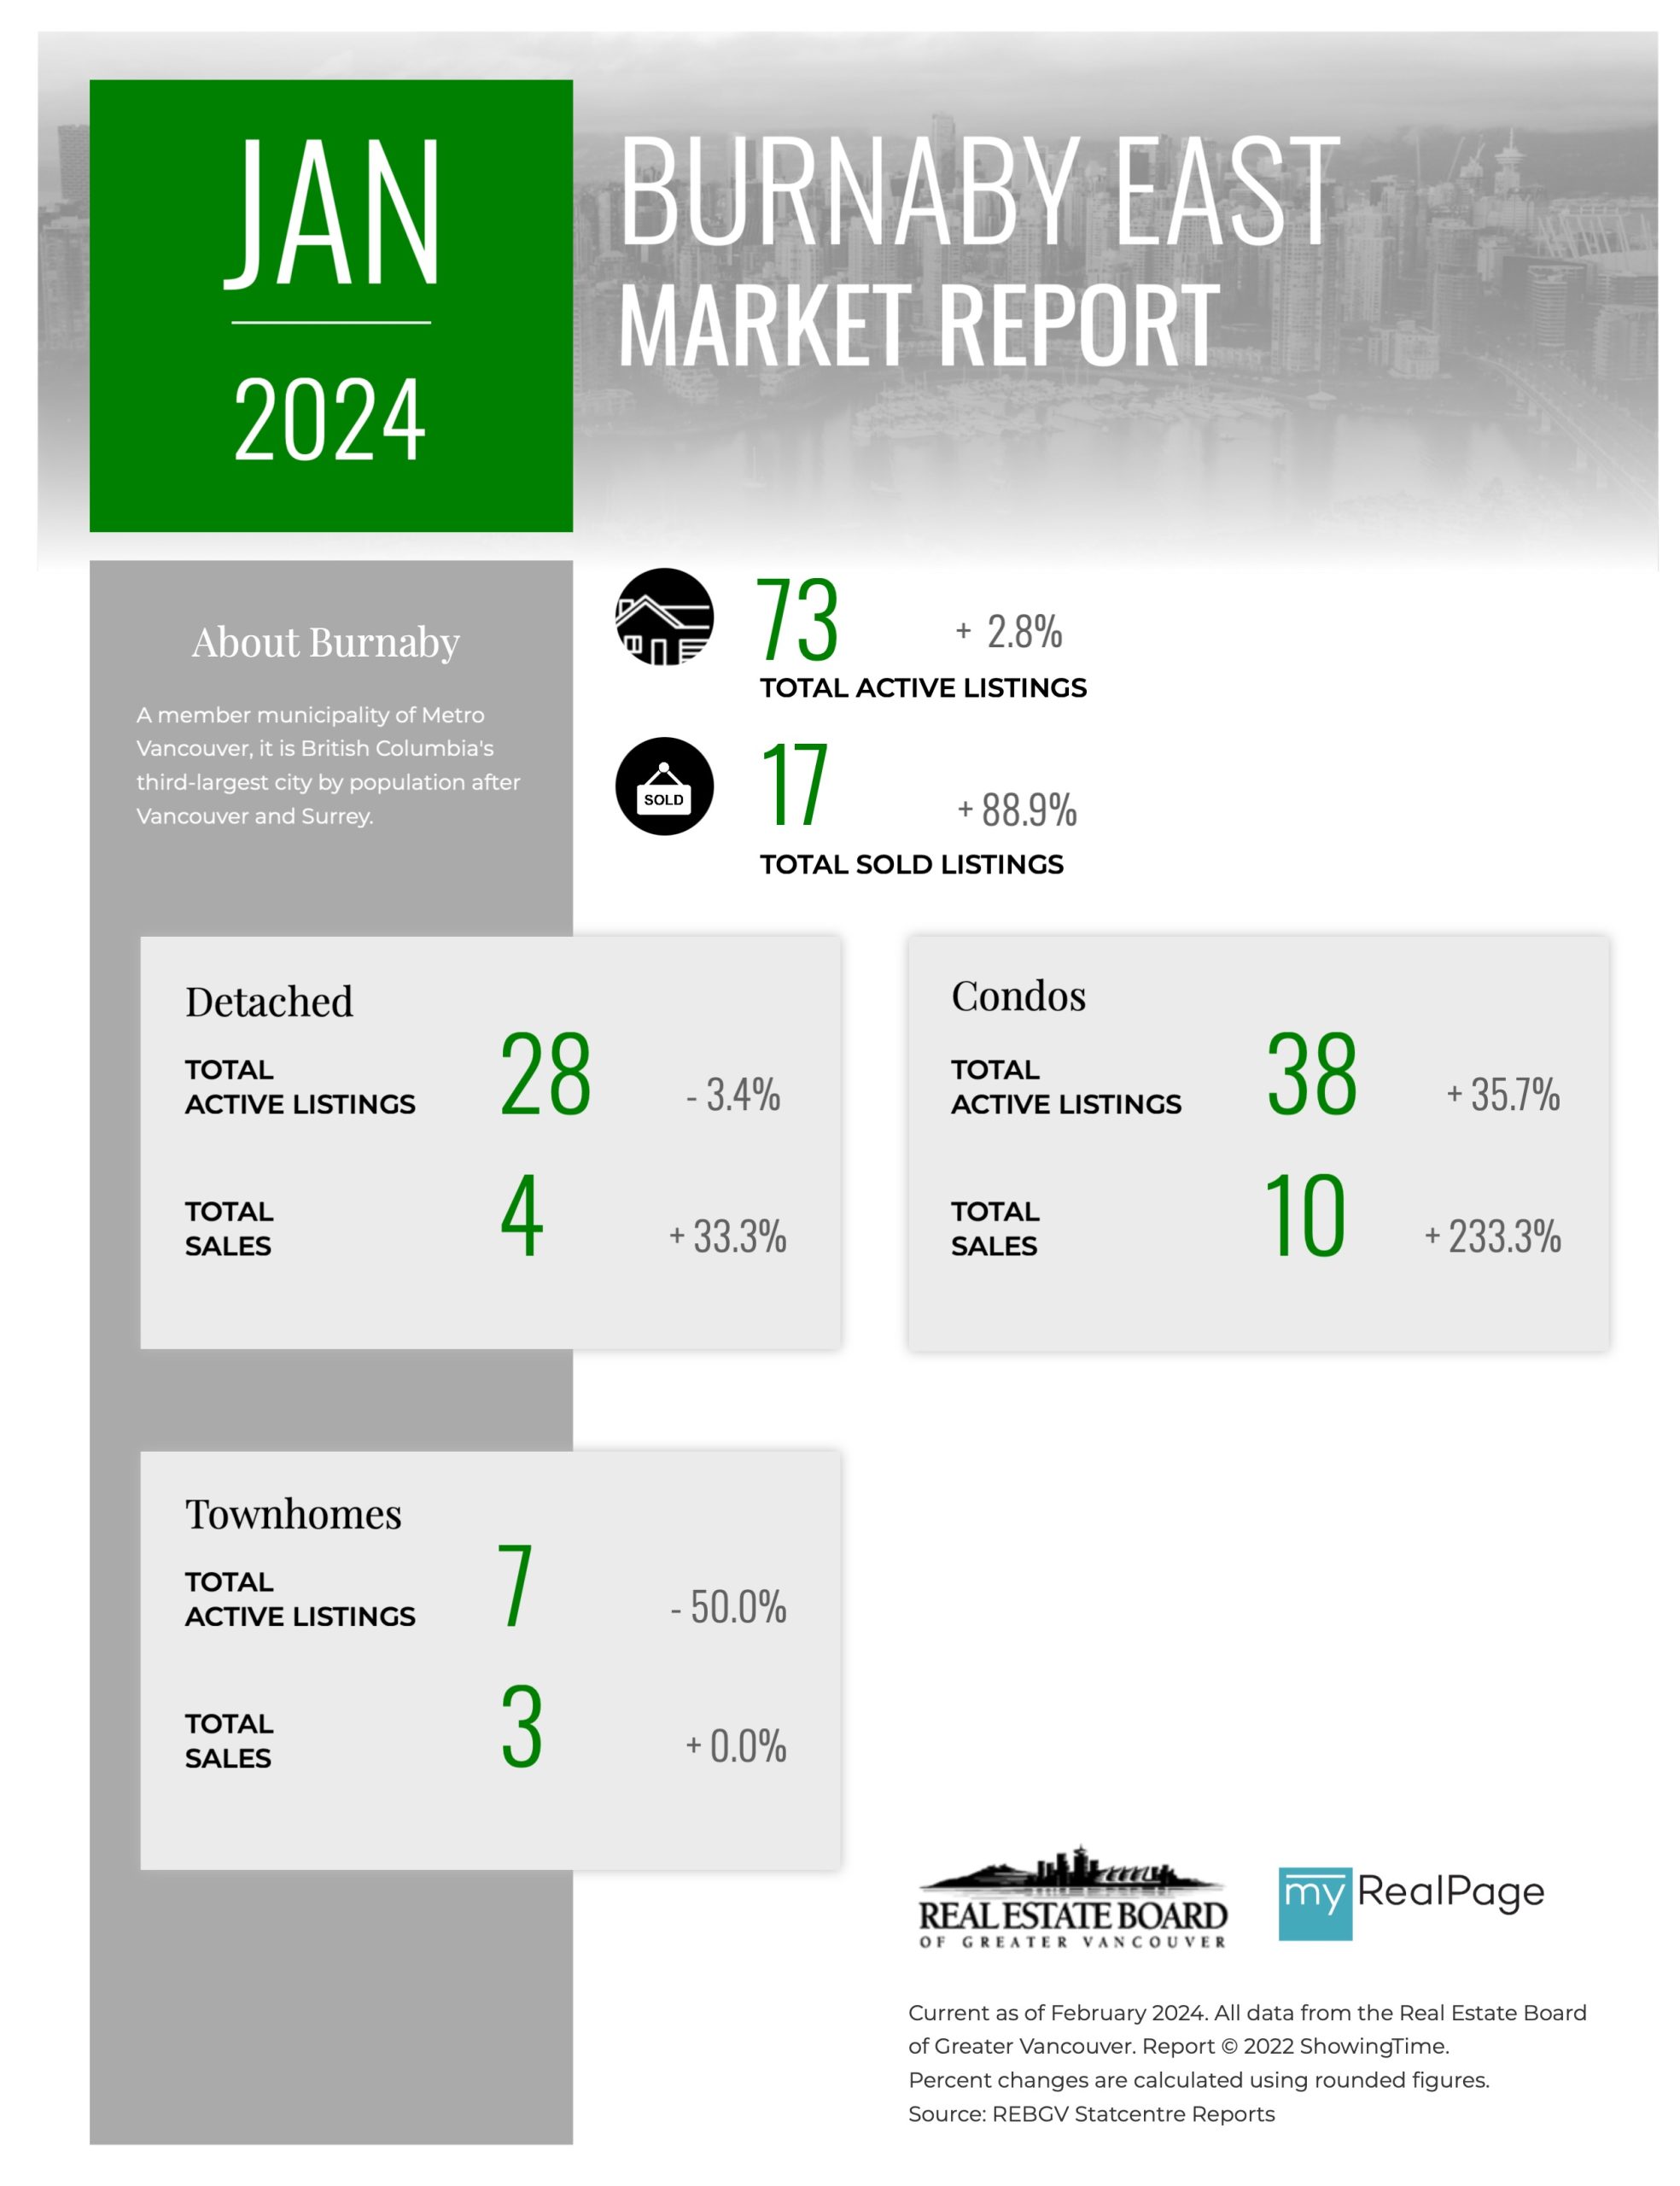
Printable Version – REBGV January 2024 Data Infographics Report Burnaby East
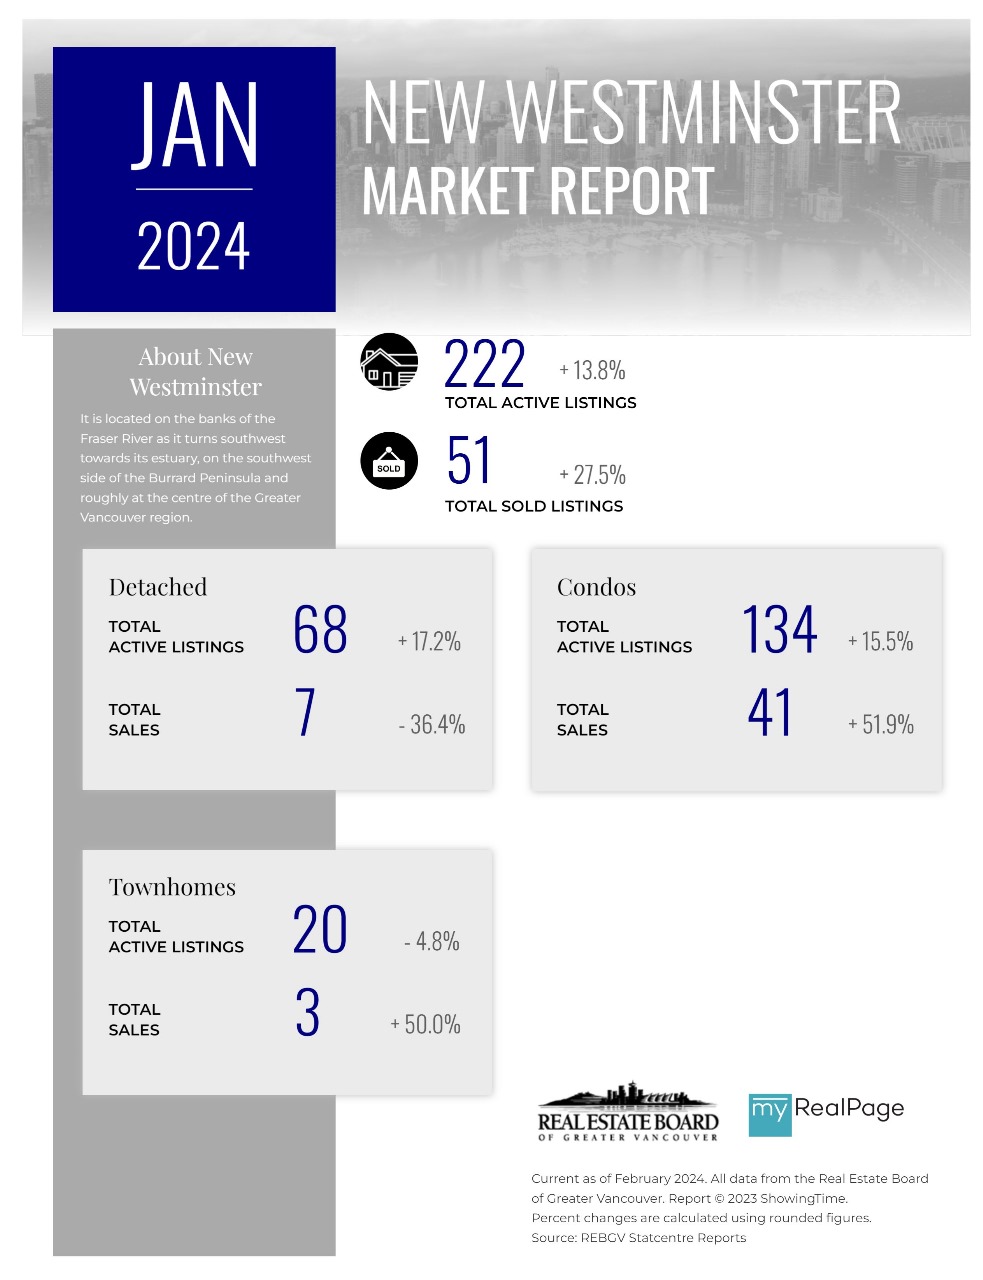
Printable Version – REBGV January 2024 Data Infographics Report New Westminster
Printable Version – REBGV January 2024 Data Infographics Report Richmond
Last Updated on February 8, 2024 by myRealPage
