INFOGRAPHICS: April 2026 GVR Greater Vancouver Market Reports

Diverging trends widen as detached housing gains steam
Home sales registered on the MLS® in Metro Vancouver* remain relatively flat compared to April last year, but a divergence is emerging between market segments.
The Greater Vancouver REALTORS® (GVR) reports that residential sales in the region totalled 2,110 in April 2026, a 2.5 per cent decrease from the 2,163 sales recorded in April 2025. This total also represents a 22.9 per cent decline from the 10-year seasonal average (2,735).
“Last month we noted that a divergence was emerging between sales trends in the detached and multi-family segments, which continued in April. Sales of detached homes have been gaining year-over-year, while sales in the multi-family segment have declined, and this pattern is consistent across most areas. The fact this pattern is so broad-based reduces the likelihood that what we’re seeing is just a blip in the data since the momentum isn’t isolated to small pockets of the market.” said Andrew Lis, GVR chief economist and vice-president data analytics
Read the full report on the REBGV website!
The following data is a comparison between April 2026 and April 2025 numbers, and is current as of May of 2026. For last month’s update, you can check out our previous post!
Or follow this link for all our GVR Infographics!
These infographics cover current trends in several areas within the Greater Vancouver region. Click on the images for a larger view!
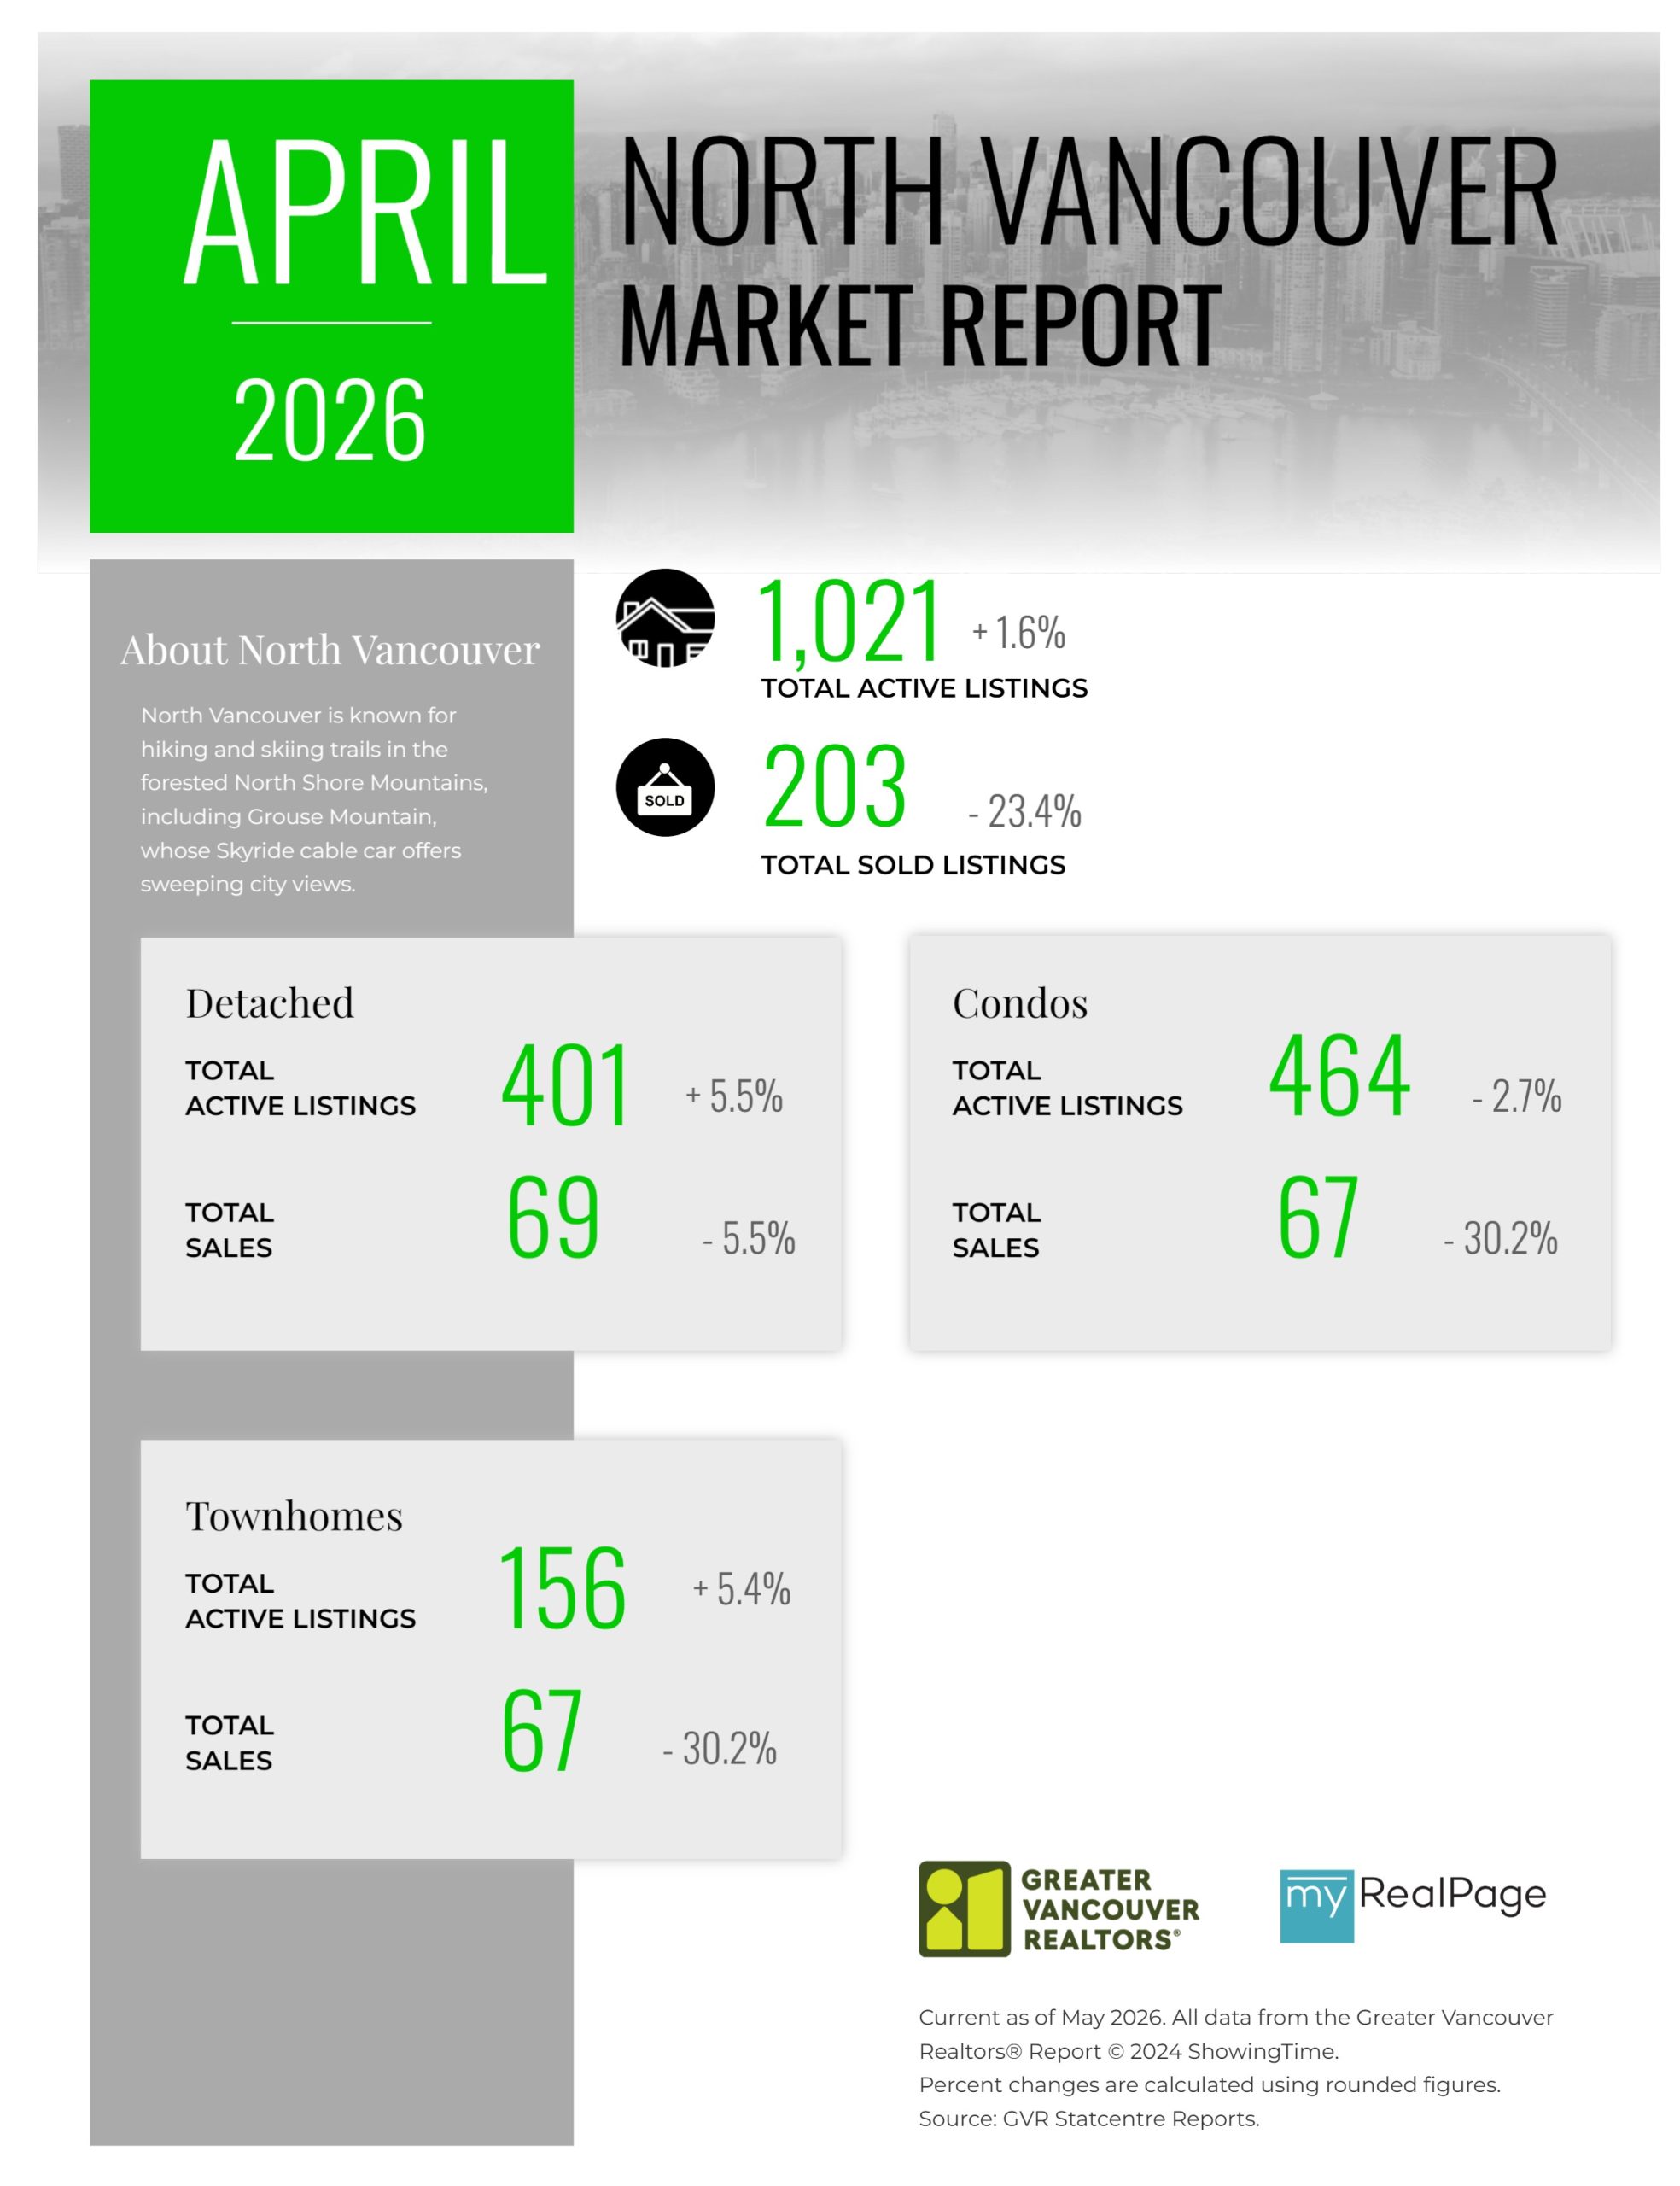
Printable Version – GVR April 2026 Data Infographic Report North Vancouver
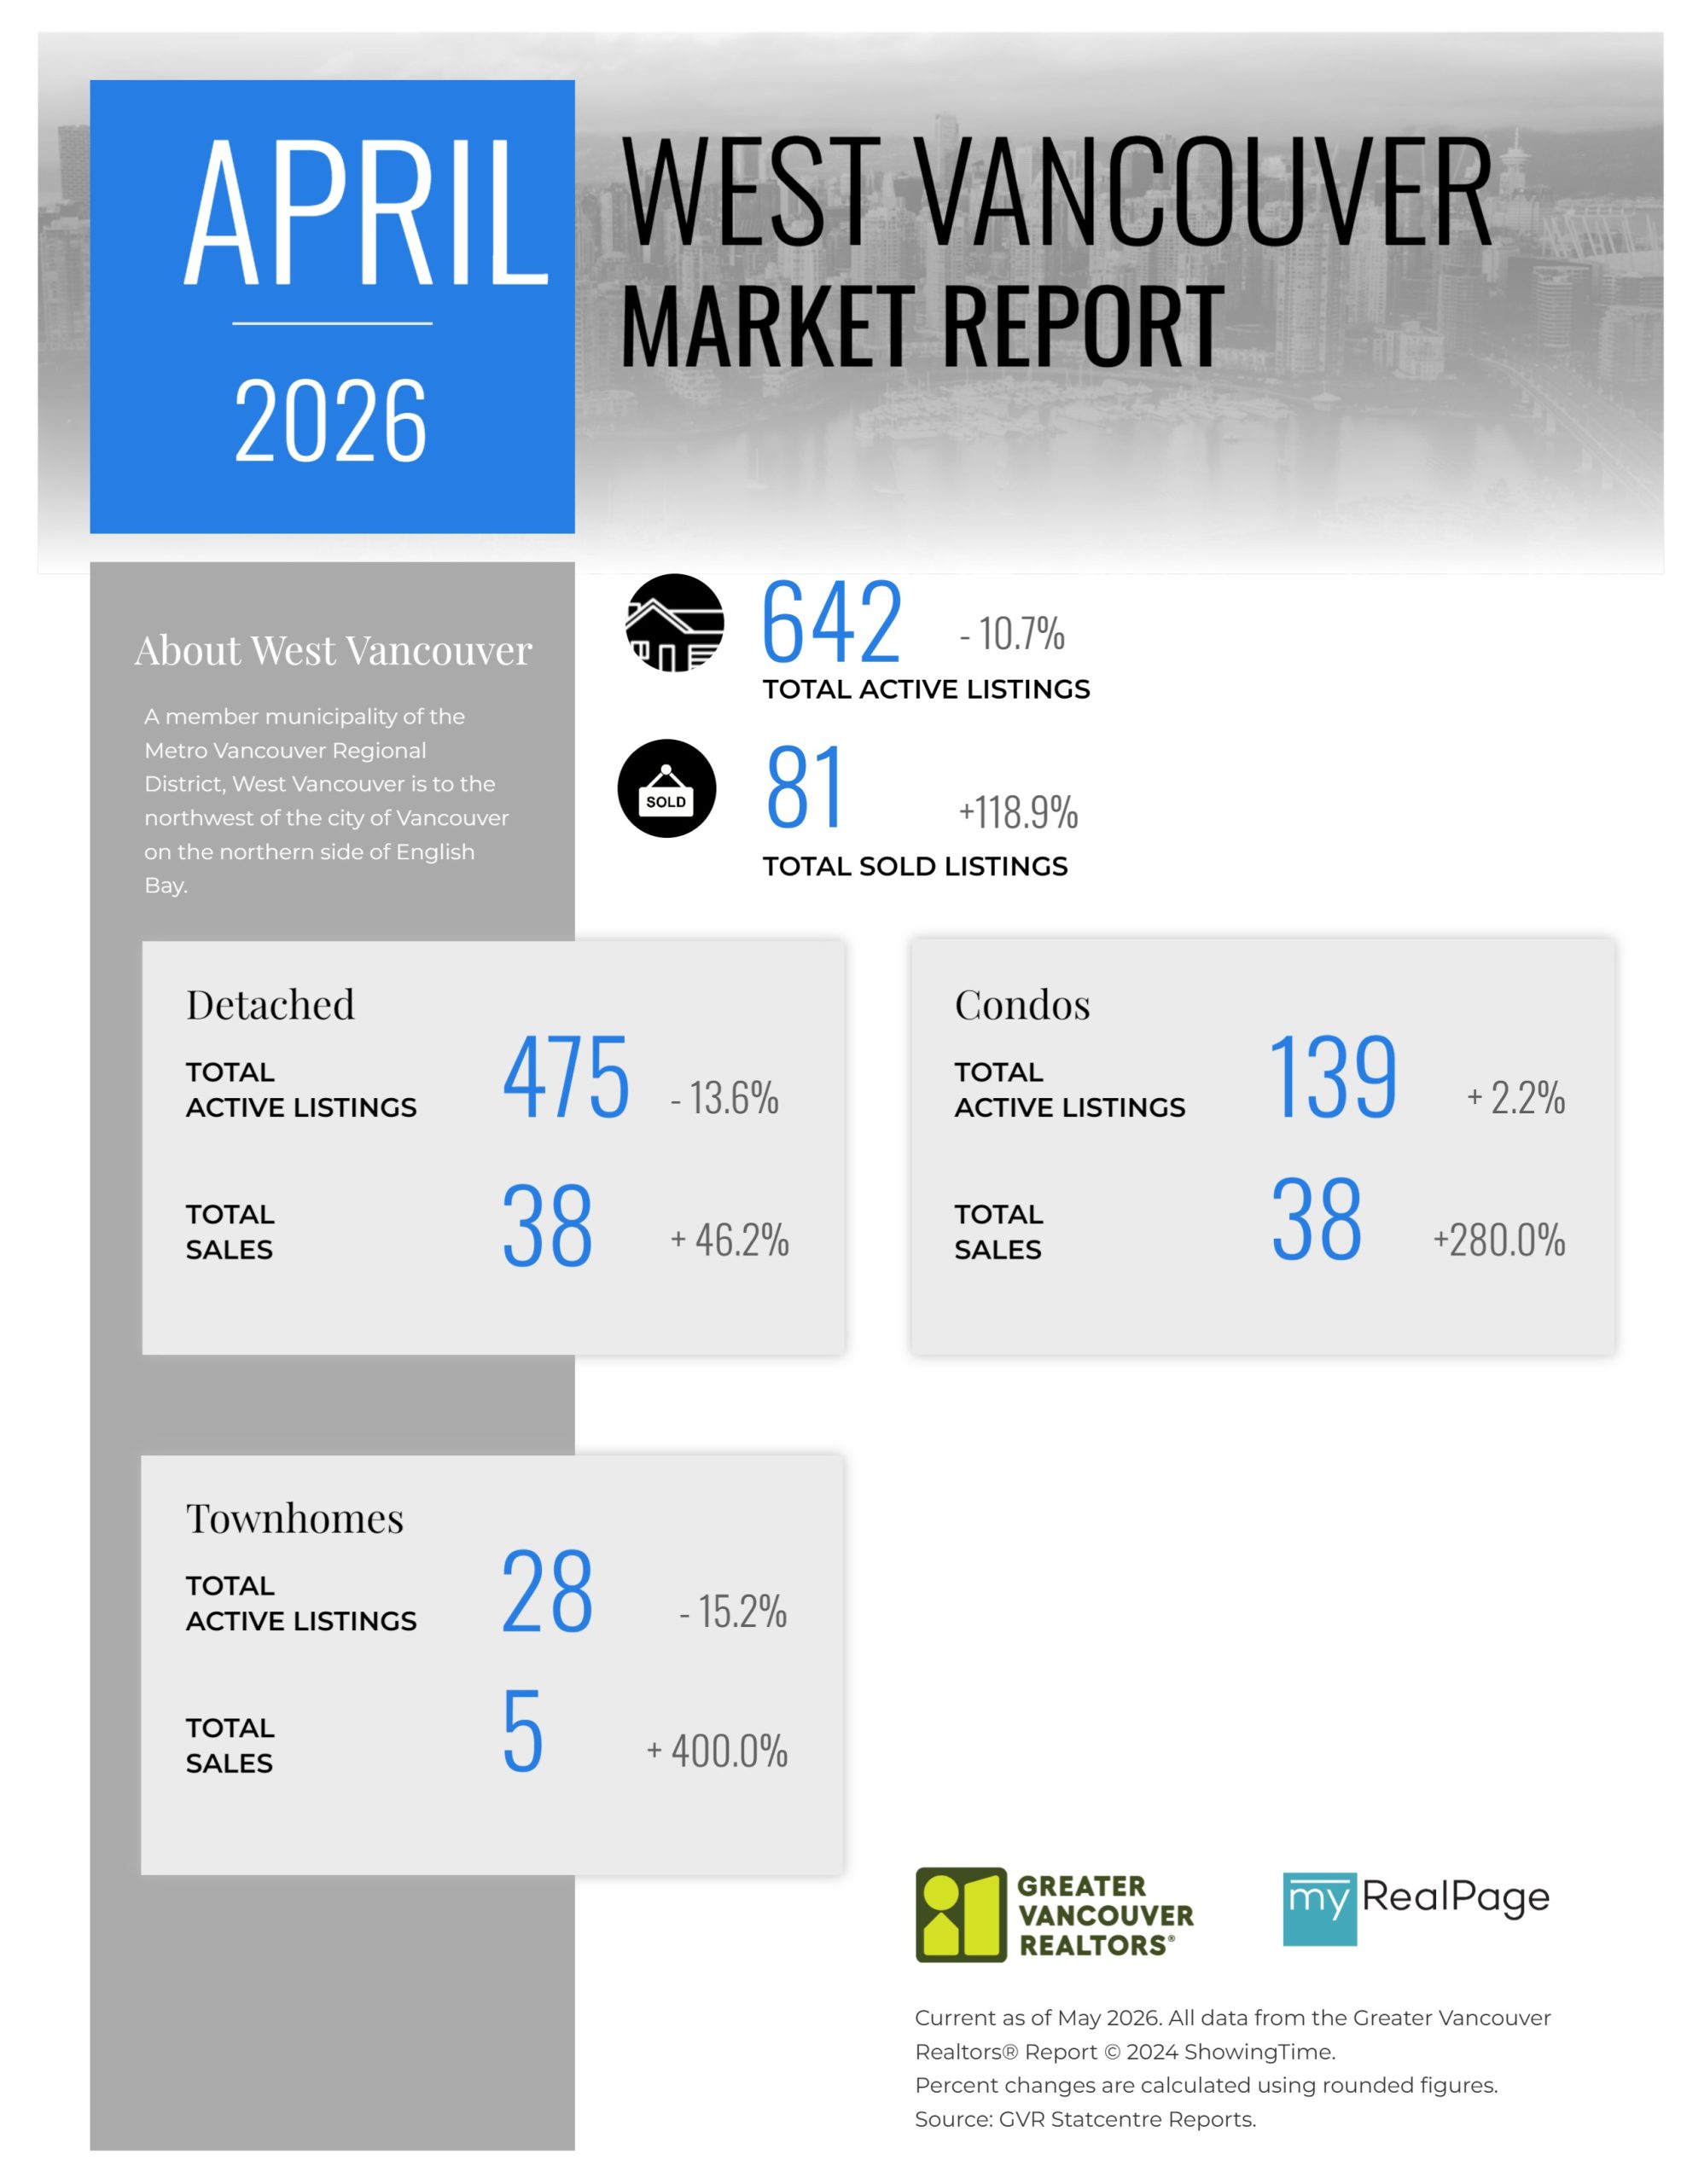
Printable Version – GVR April 2026 Data Infographics Report West Vancouver
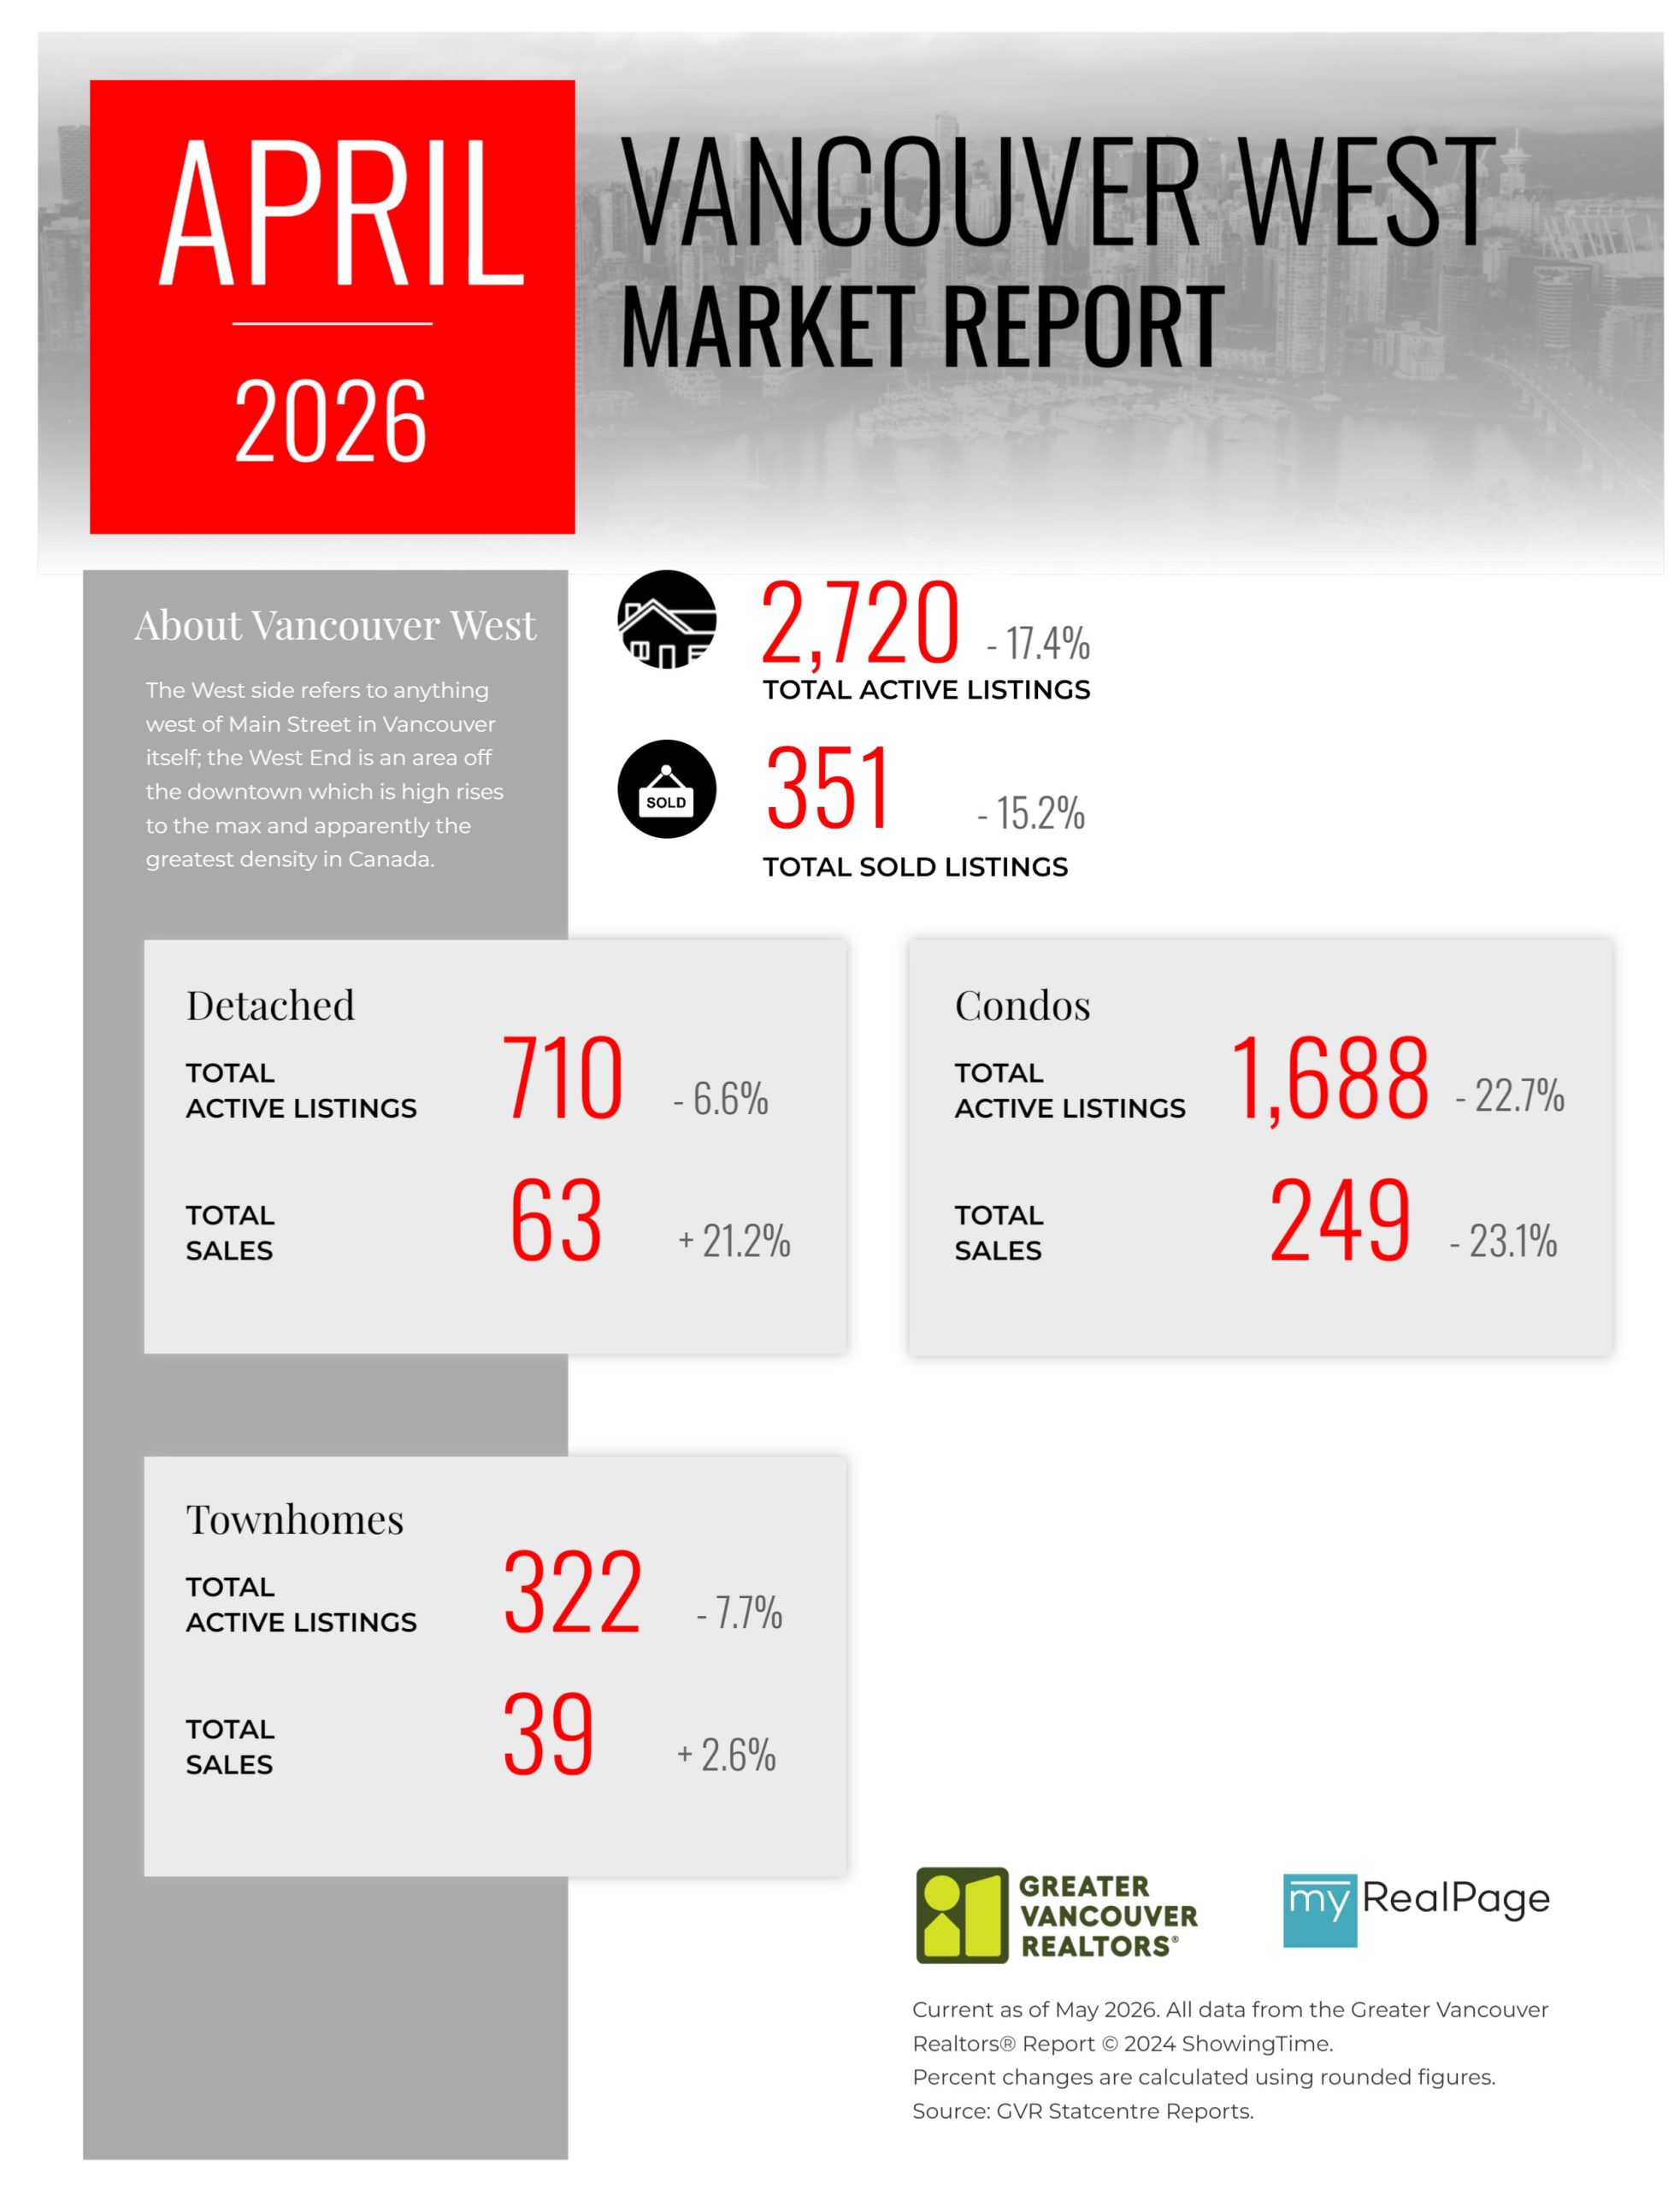
Printable Version – GVR April 2026 Data Infographics Report Vancouver West
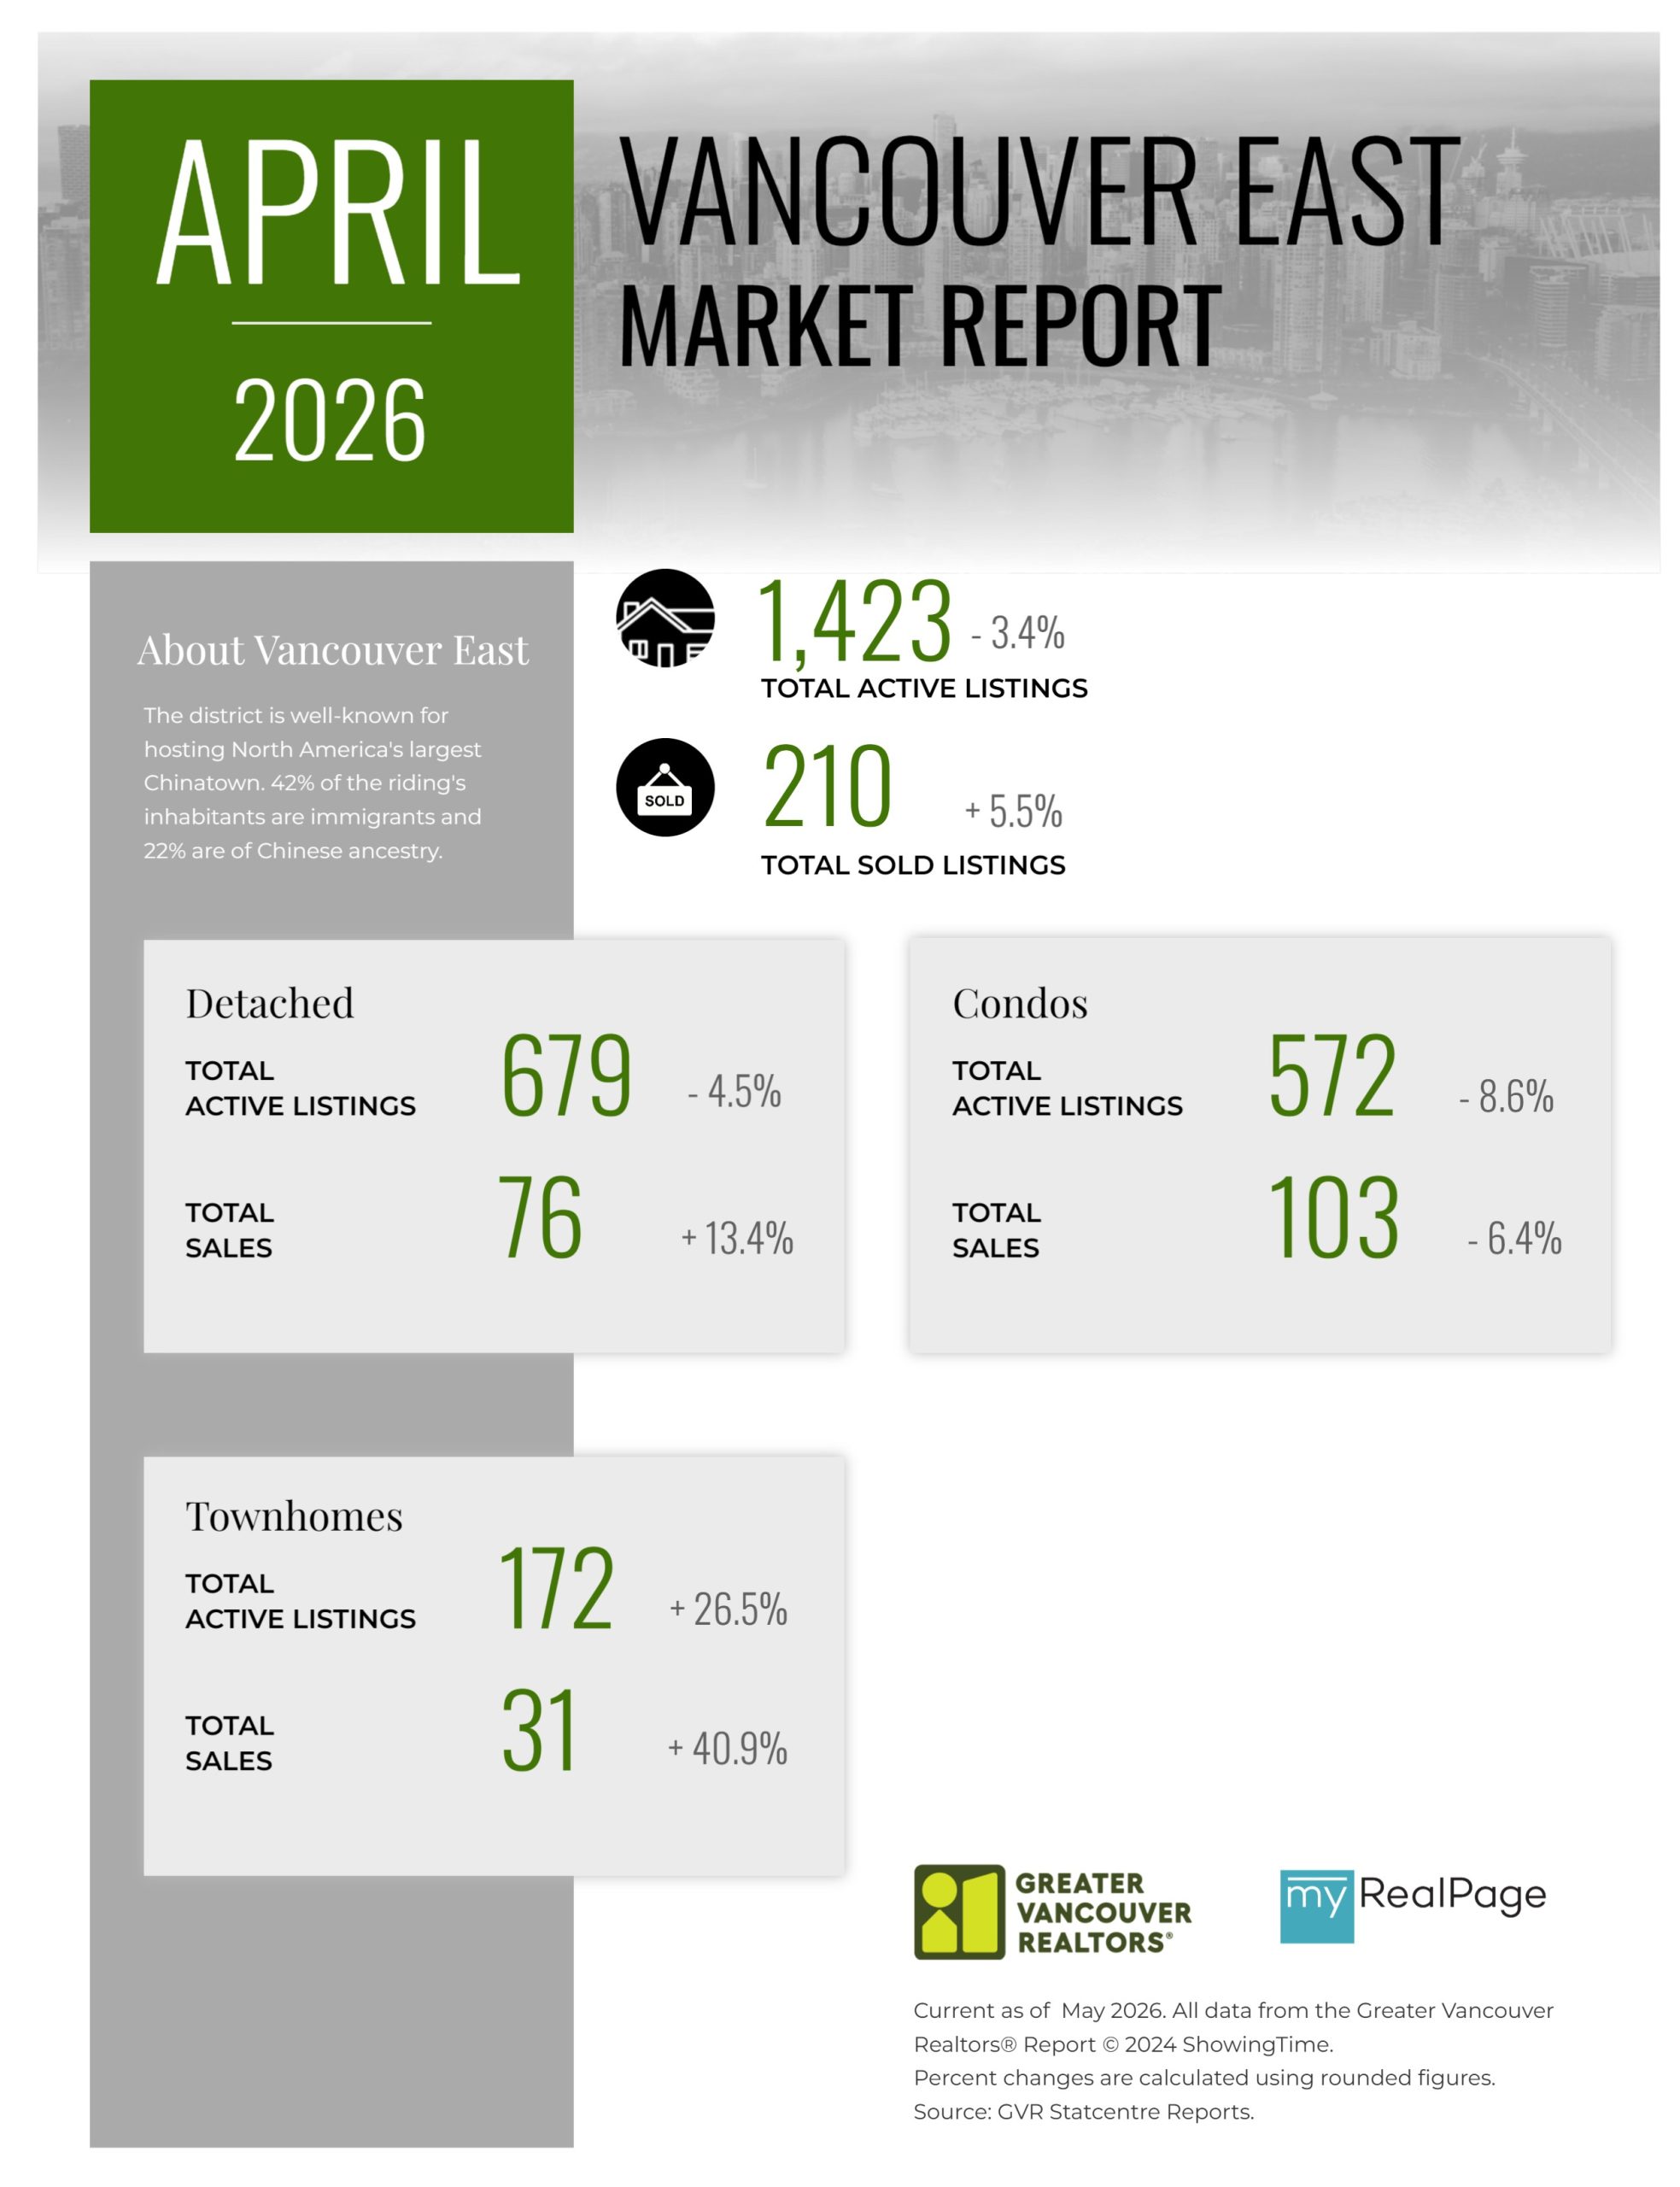
Printable Version – GVR April 2026 Data Infographics Report Vancouver East
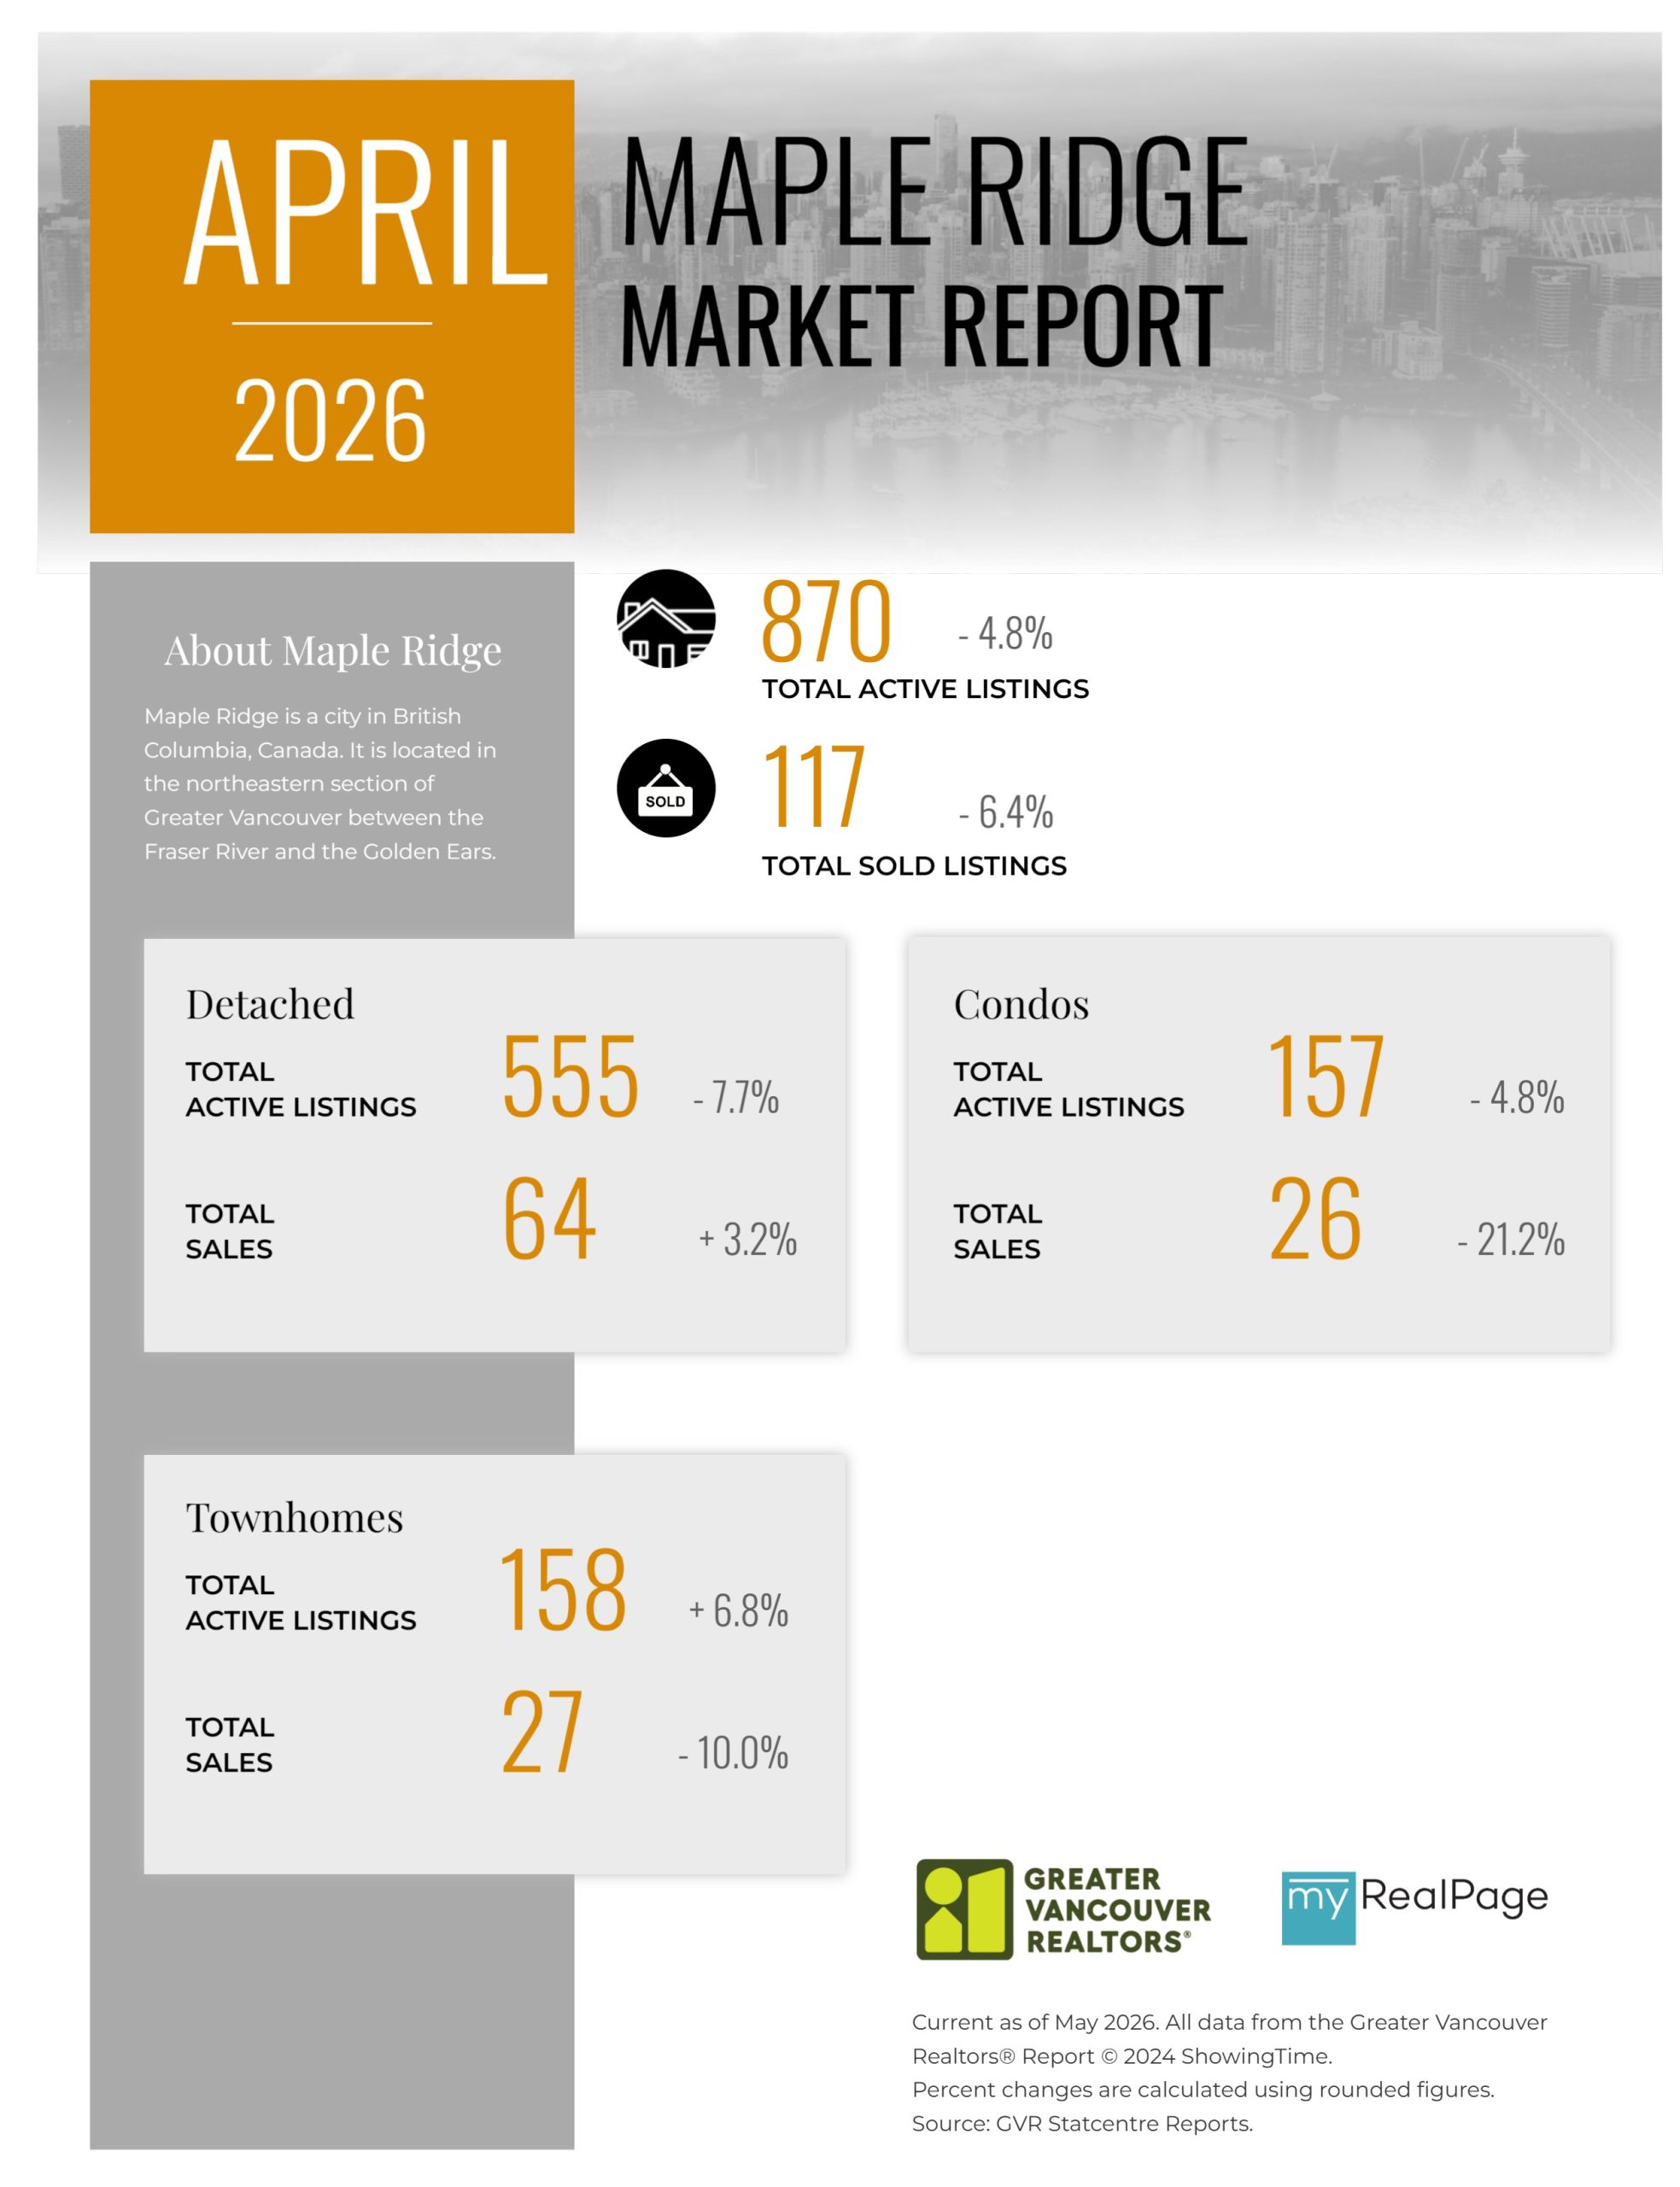
Printable Version – GVR April 2026 Data Infographic Report Maple Ridge
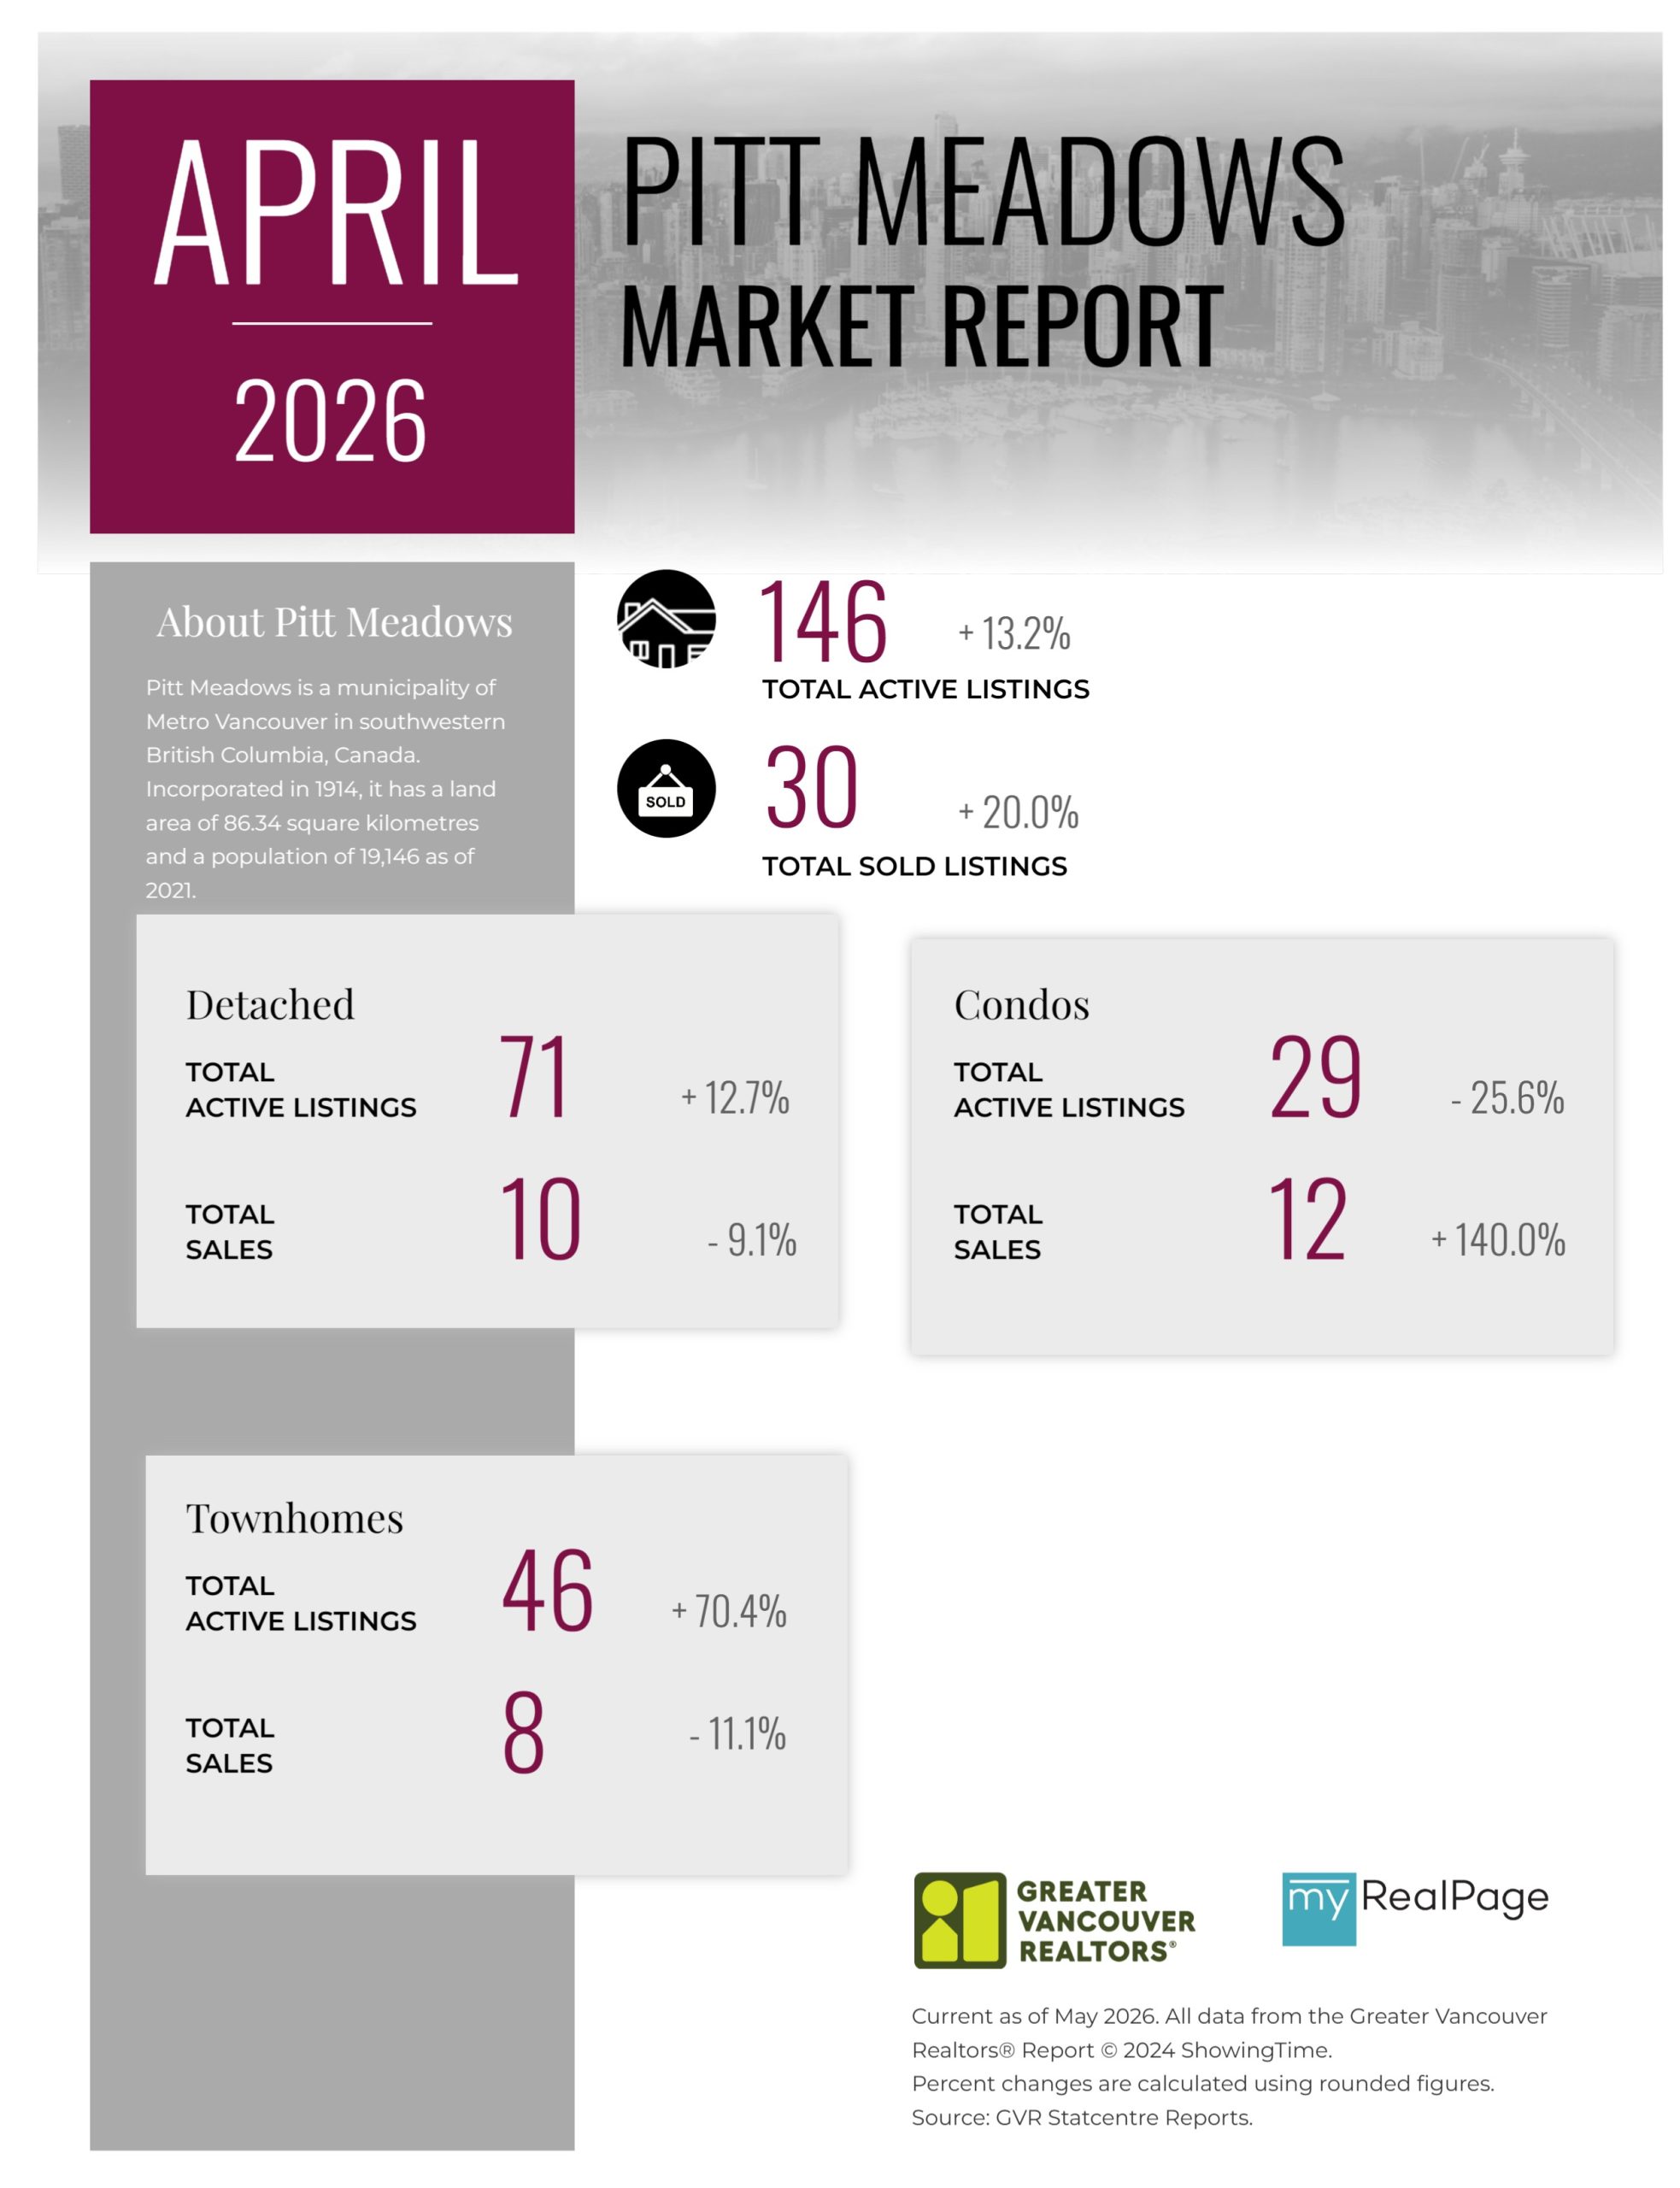
Printable Version – GVR April 2026 Data Infographics Report Pitt Meadows
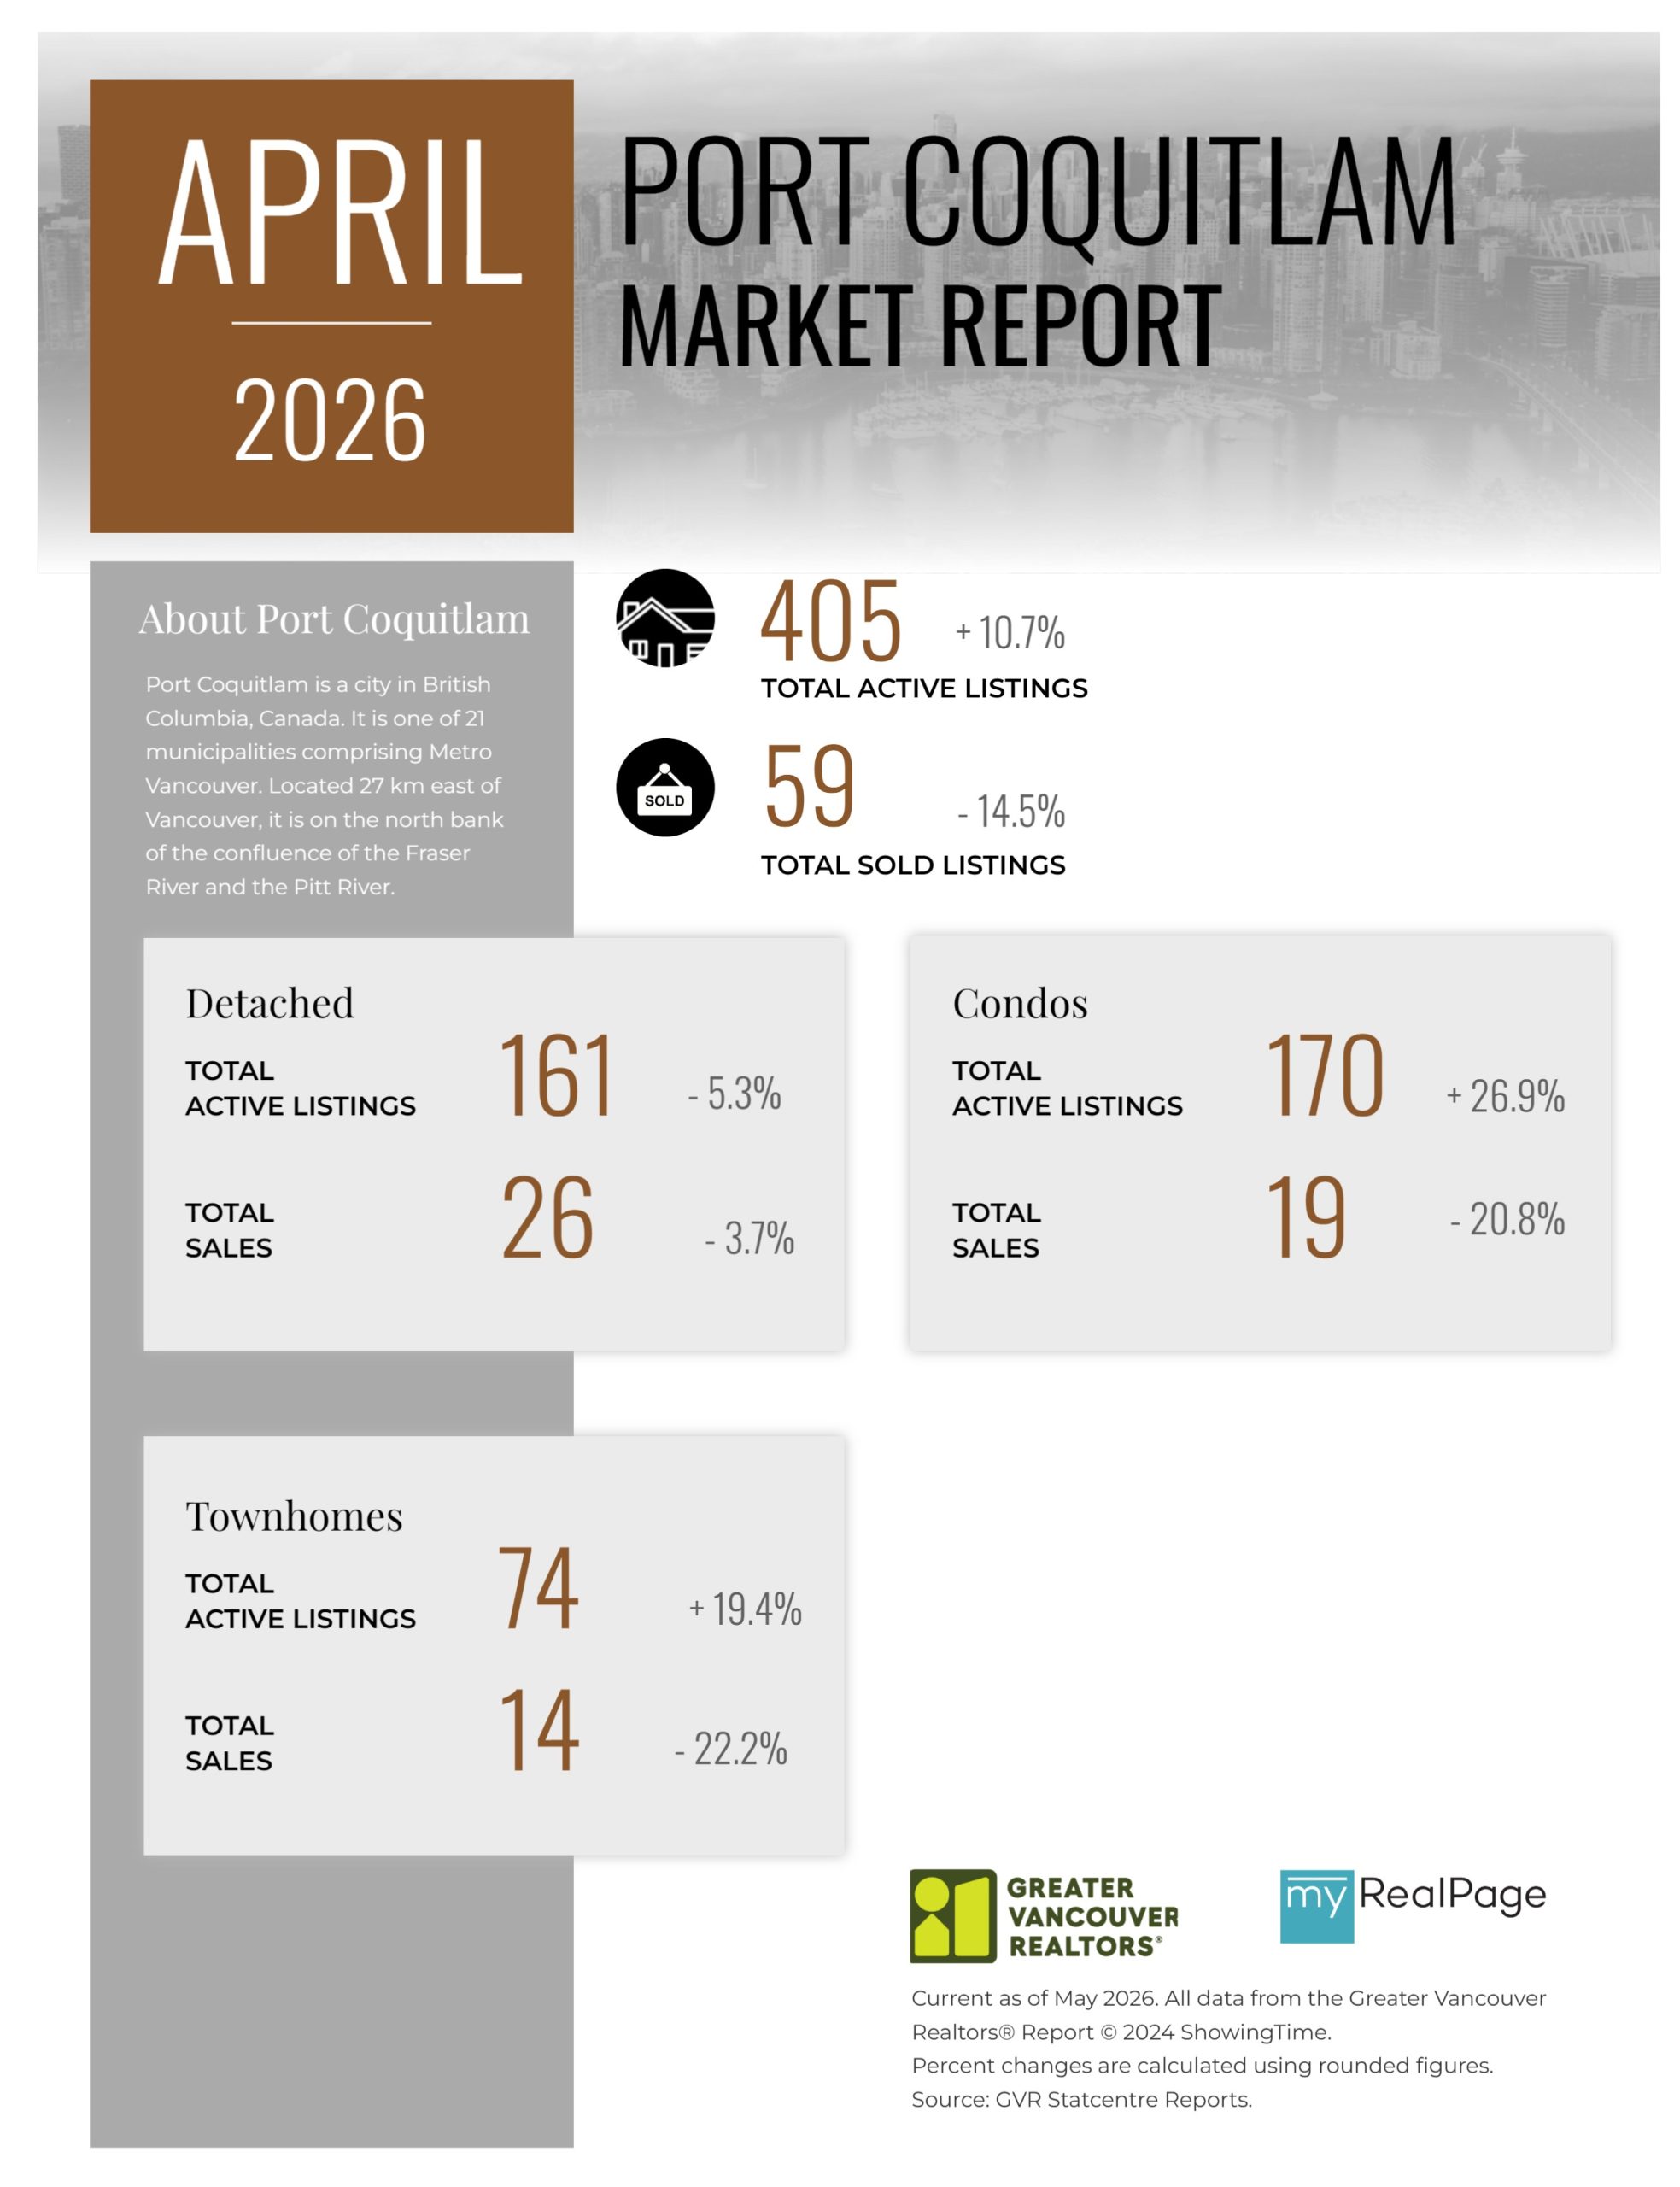
Printable Version – GVR April 2026 Data Infographics Report Port Coquitlam
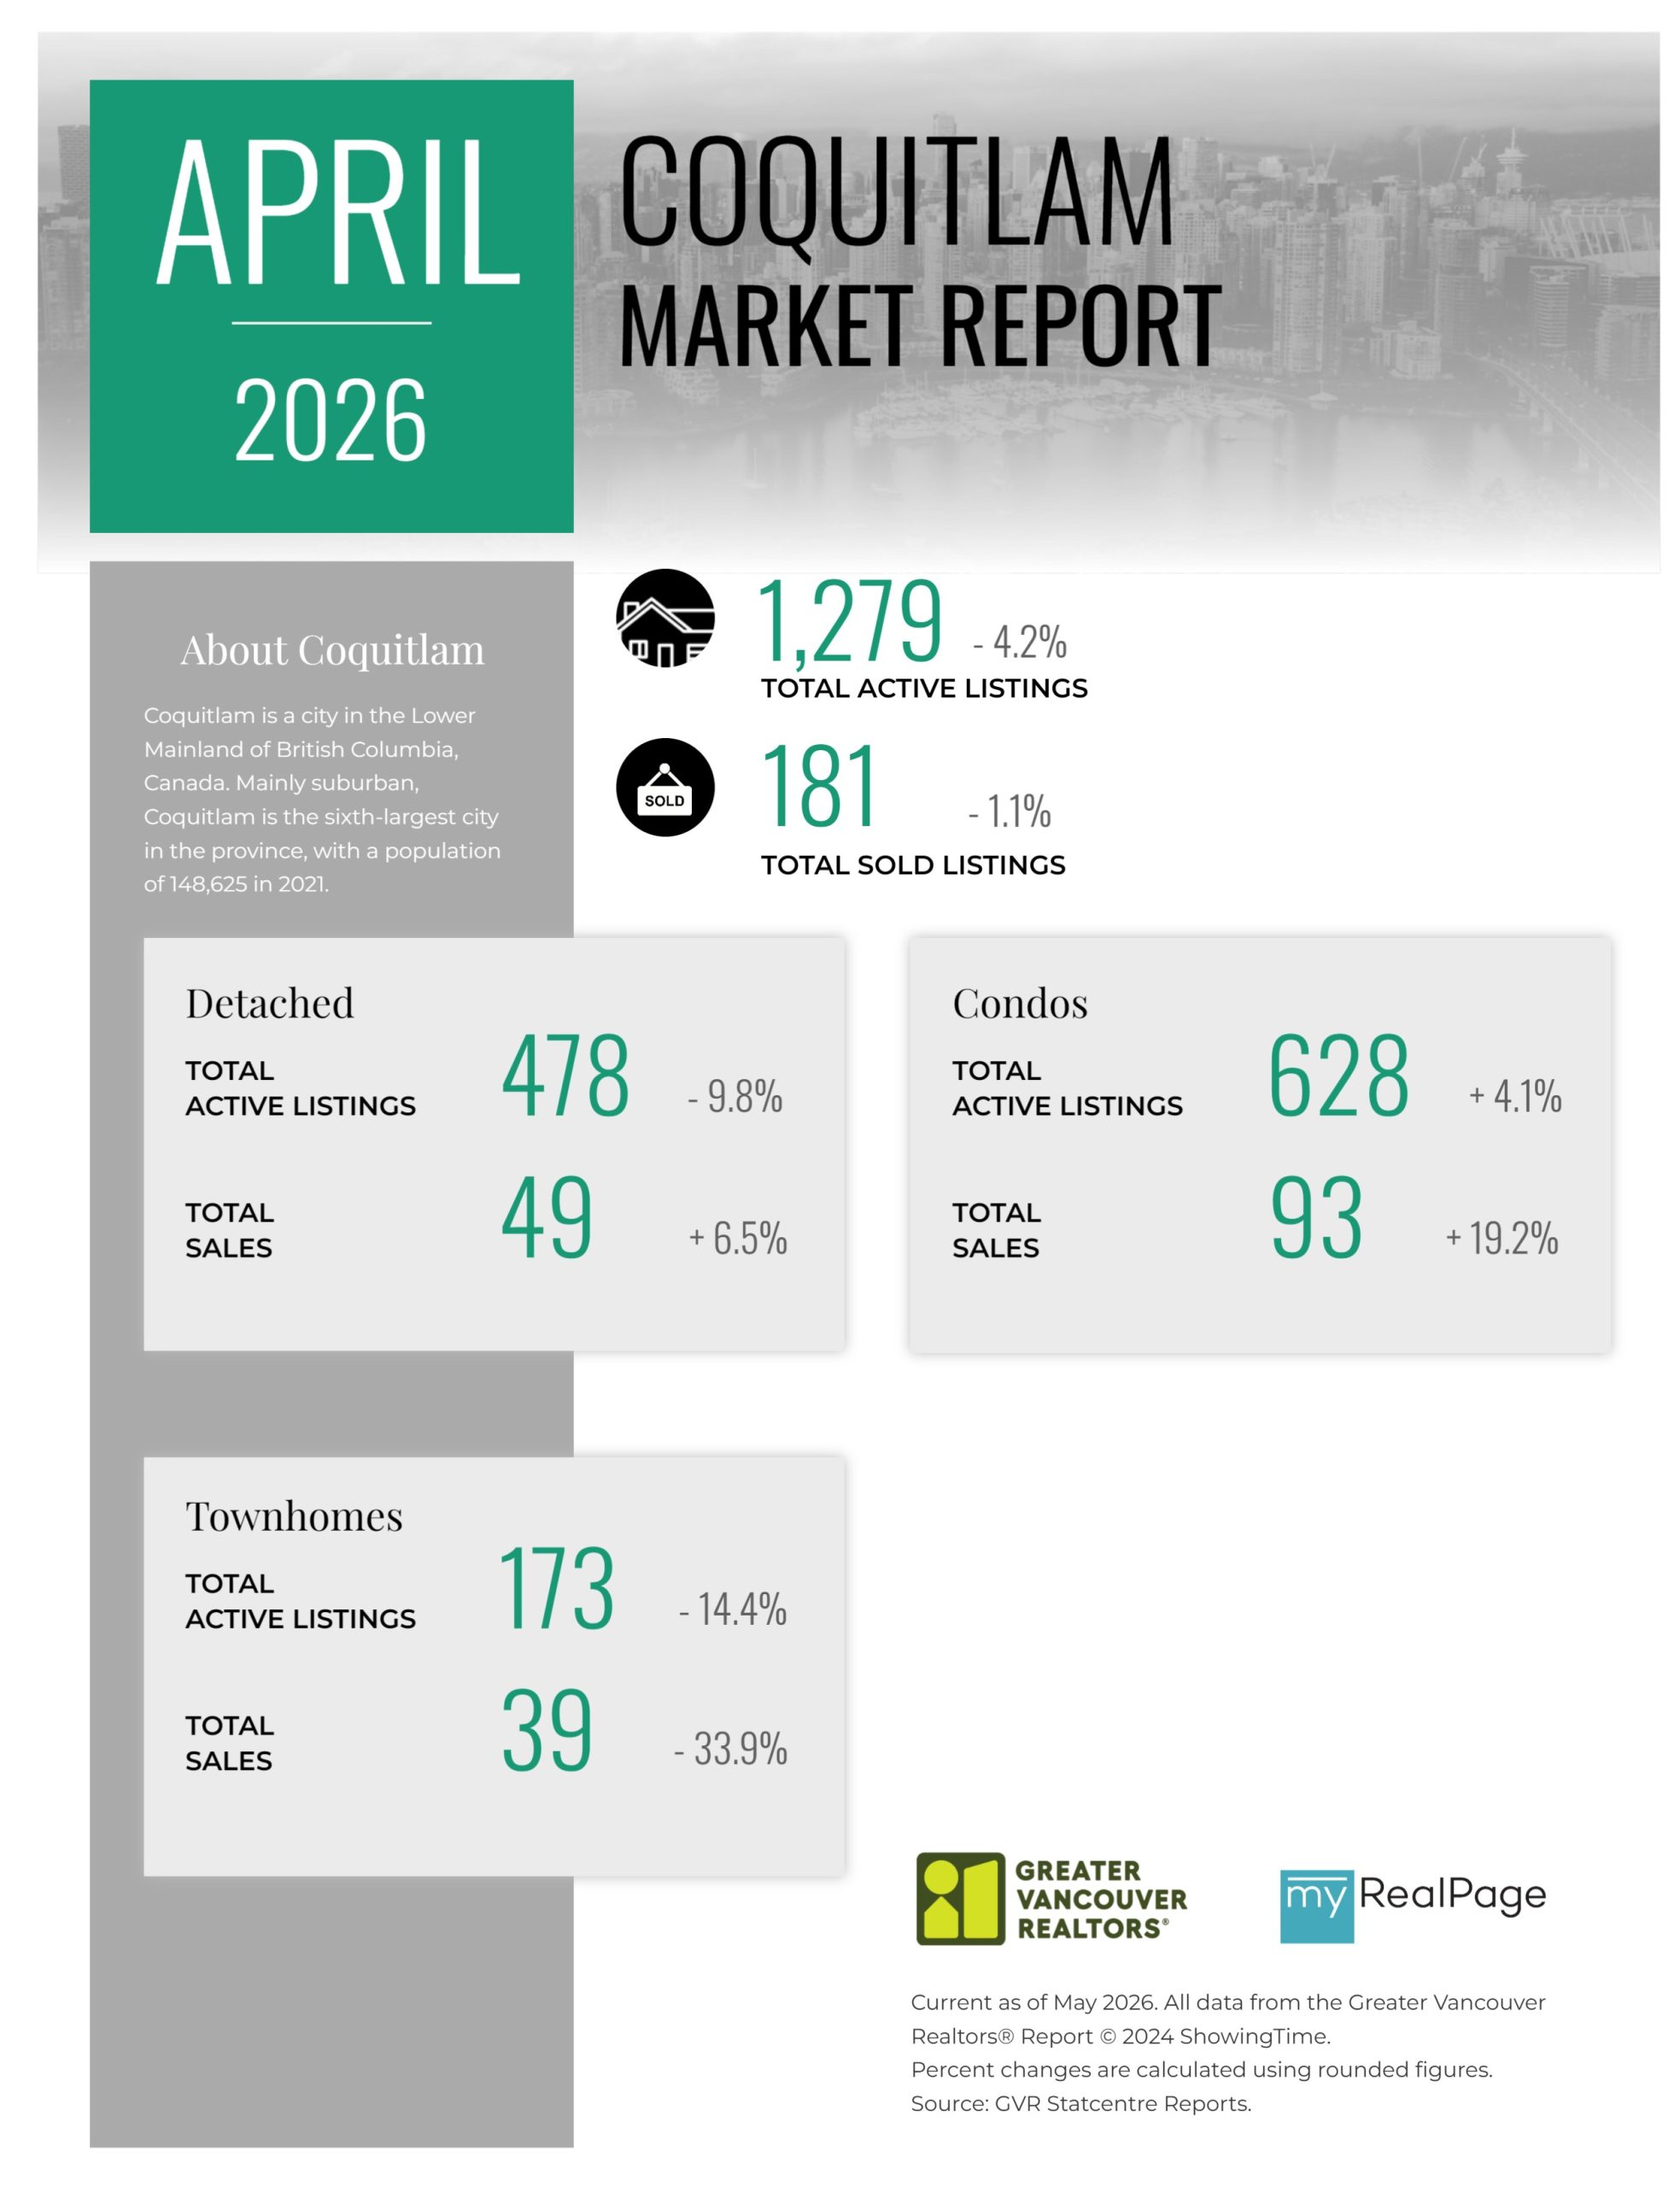
Printable Version – GVR April 2026 Data Infographics Report Coquitlam
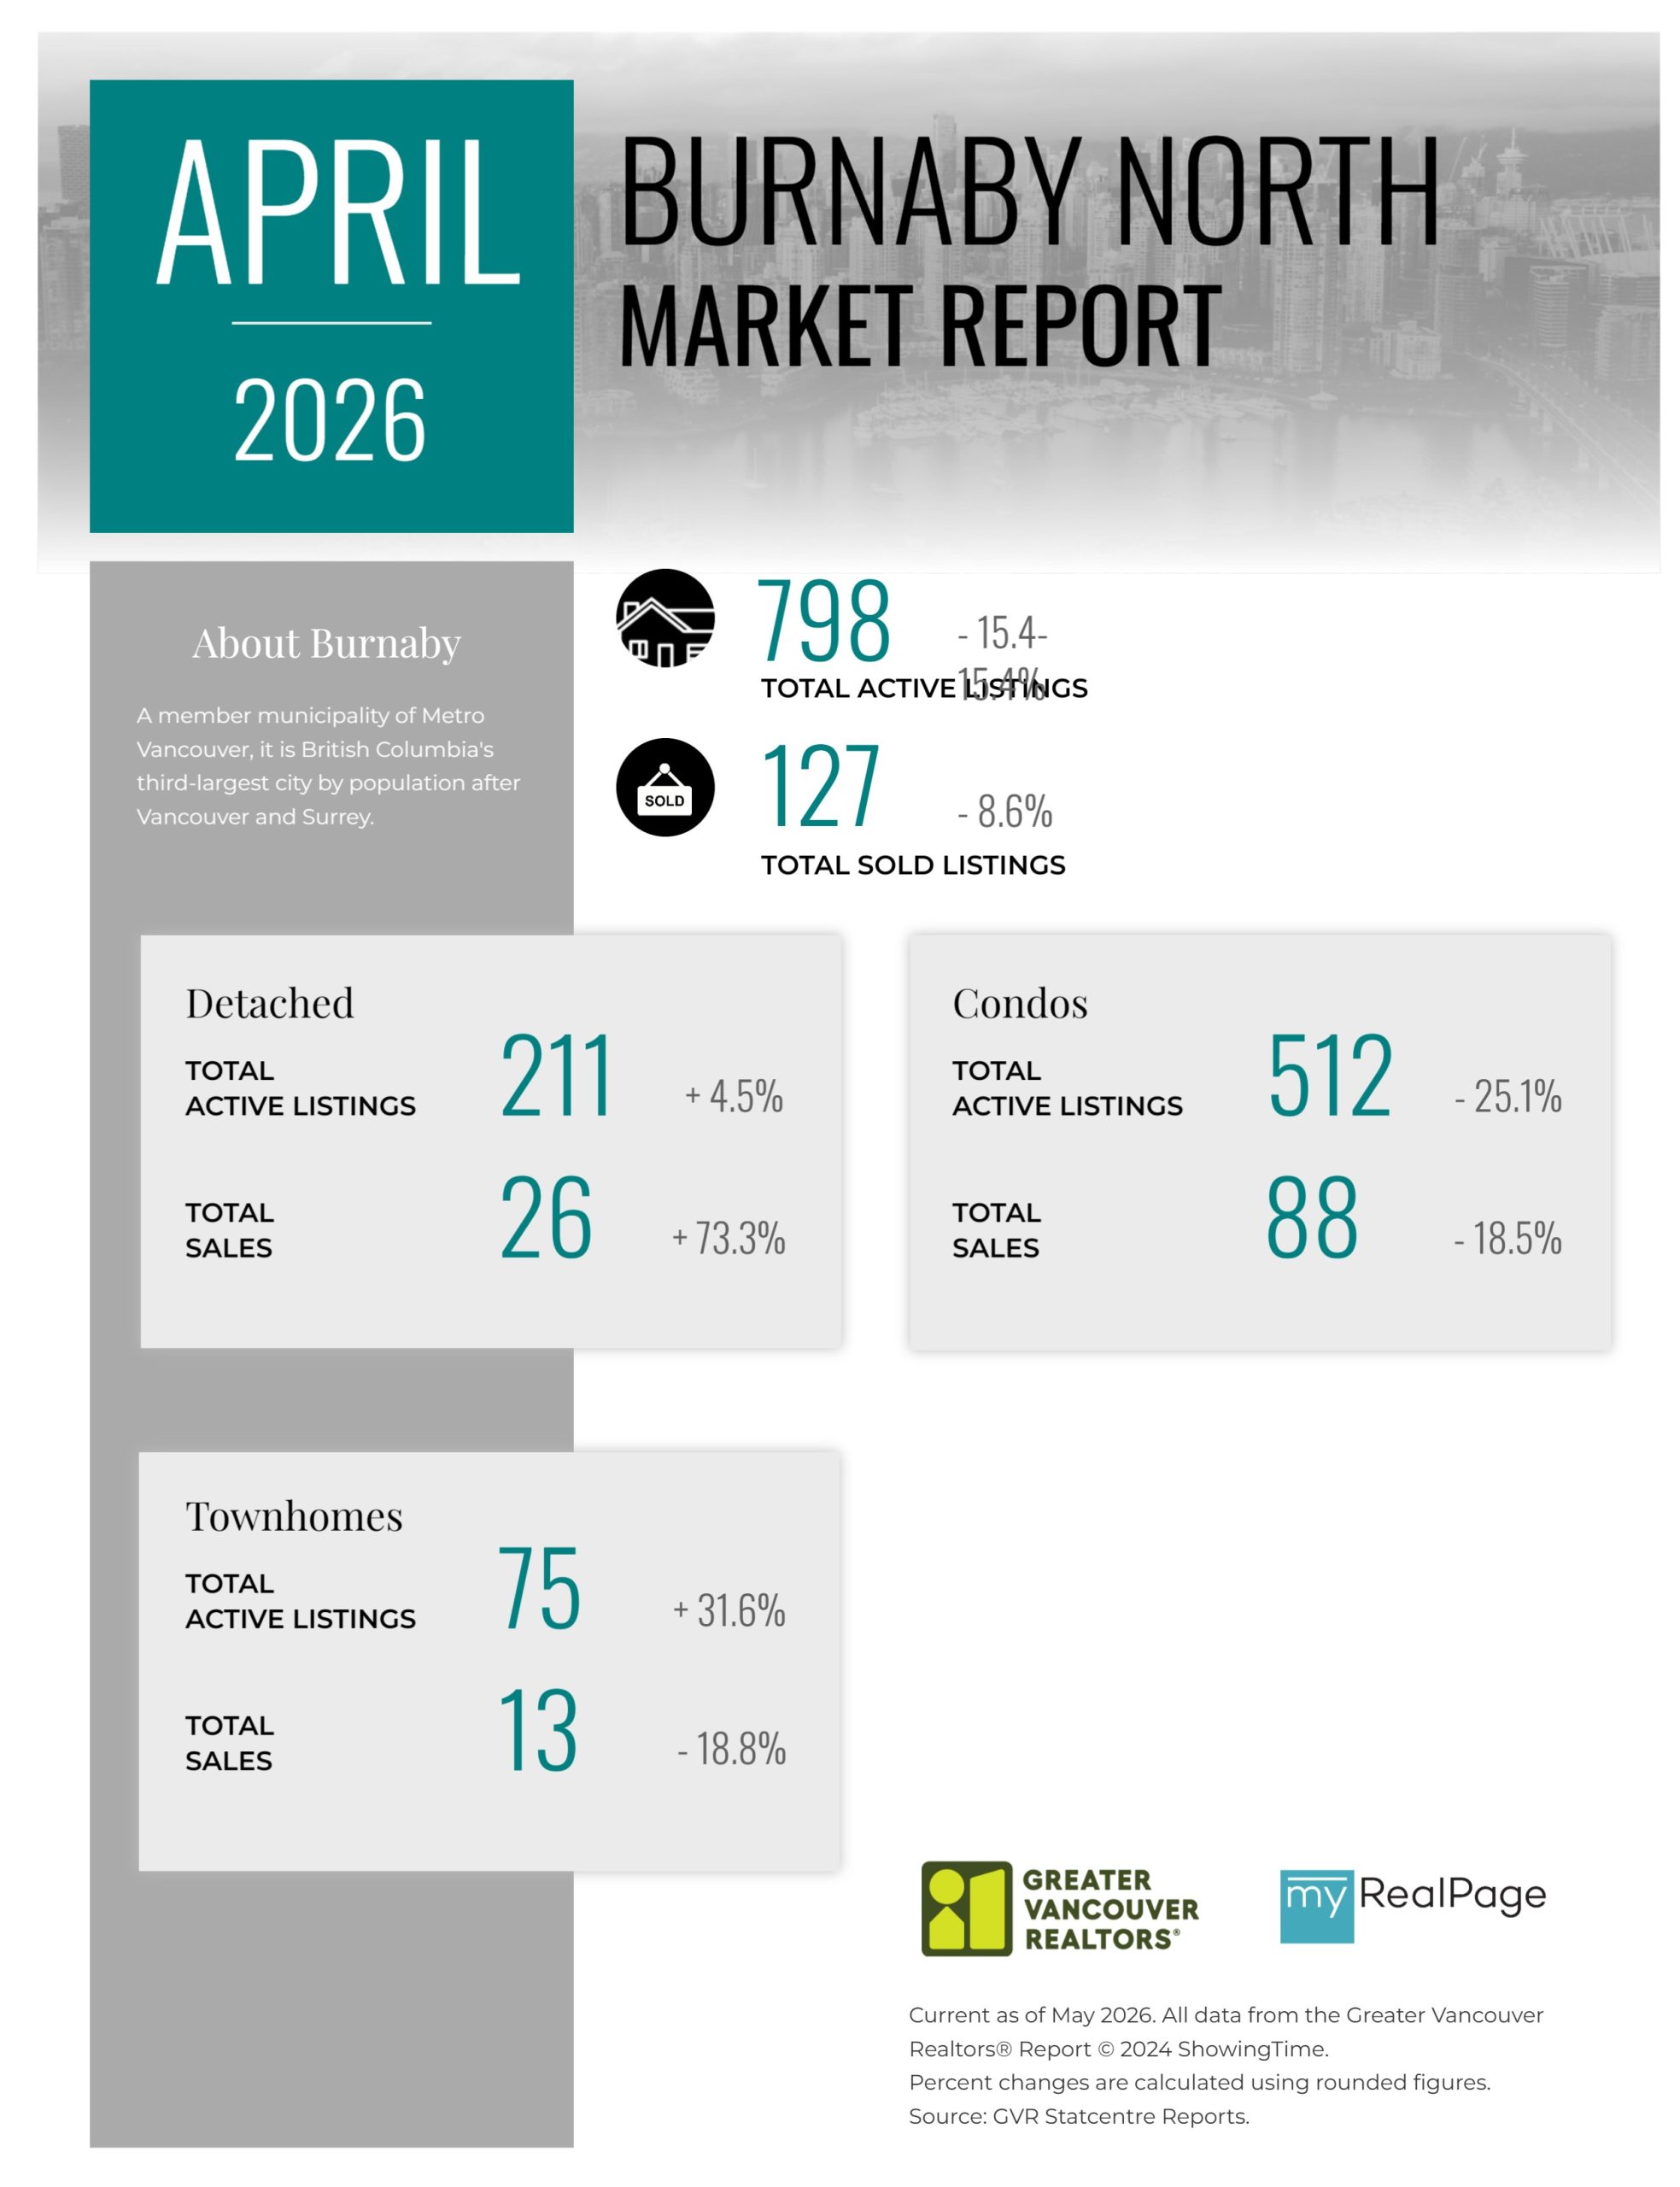
Printable Version – GVR April 2026 Data Infographic Report Burnaby North
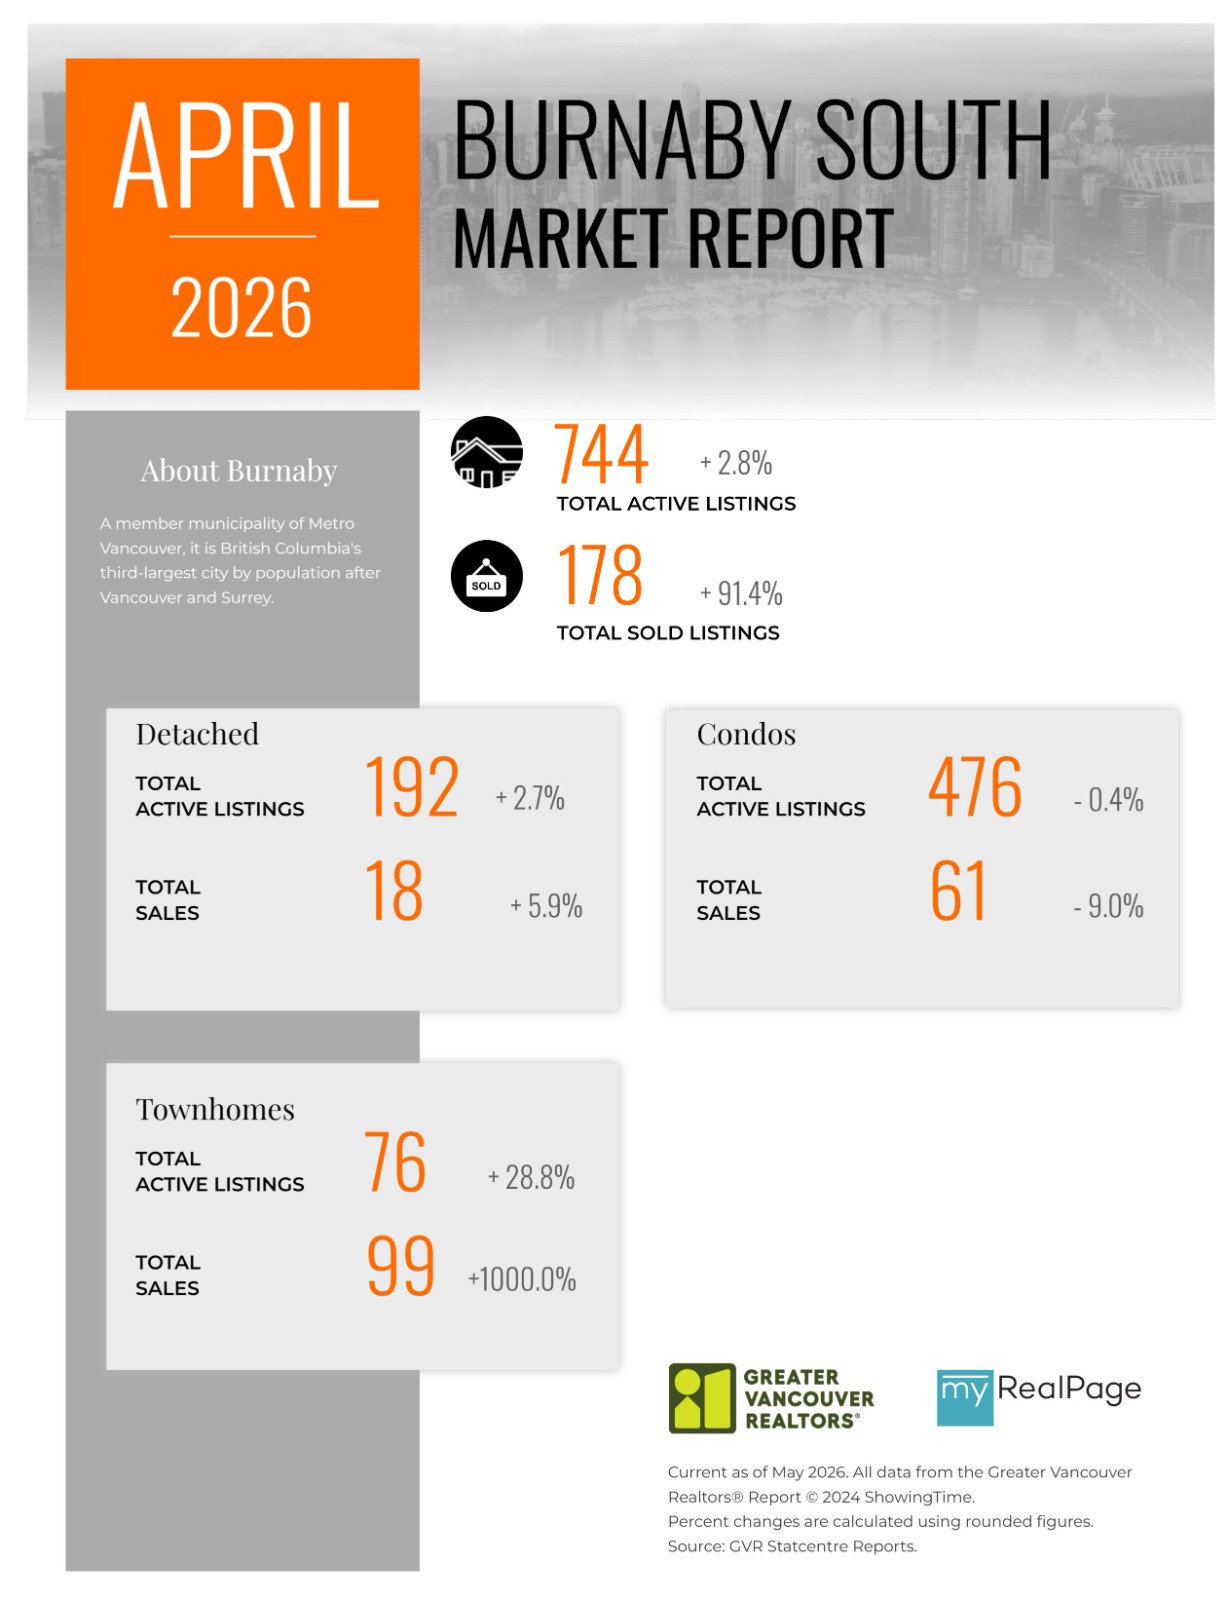
Printable Version – GVR April 2026 Data Infographics Report Burnaby South
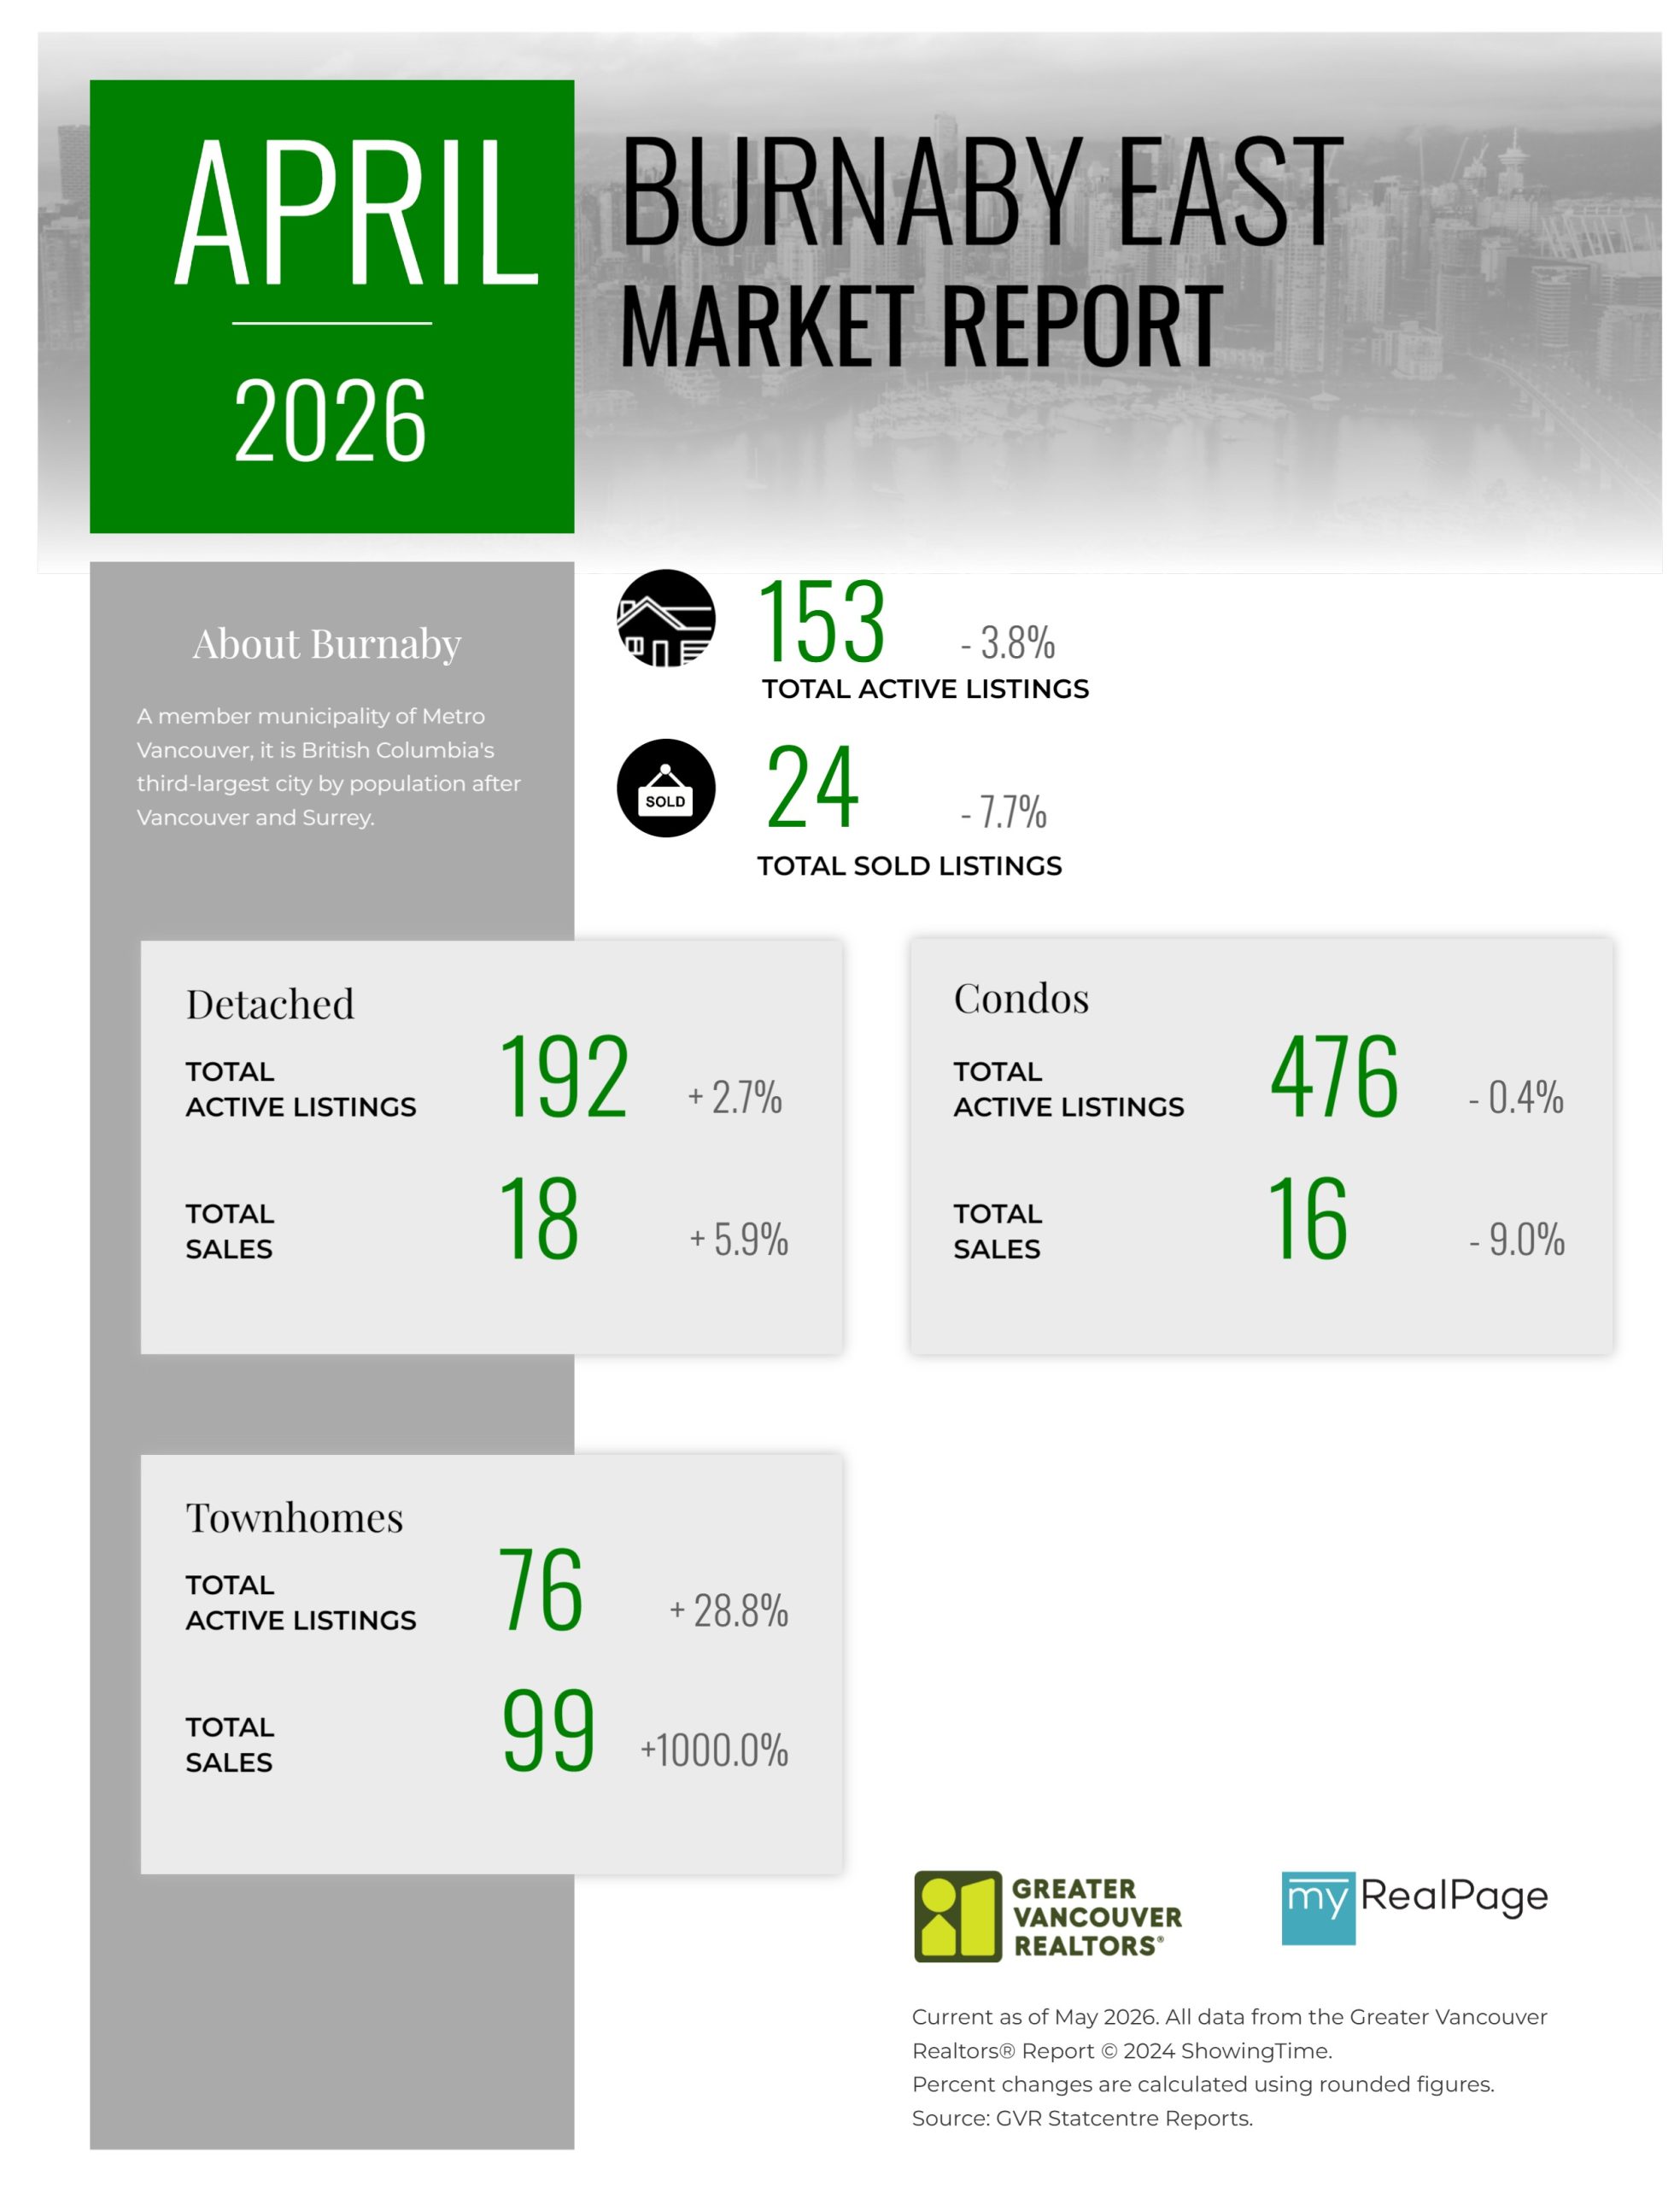
Printable Version – GVR April 2026 Data Infographics Report Burnaby East
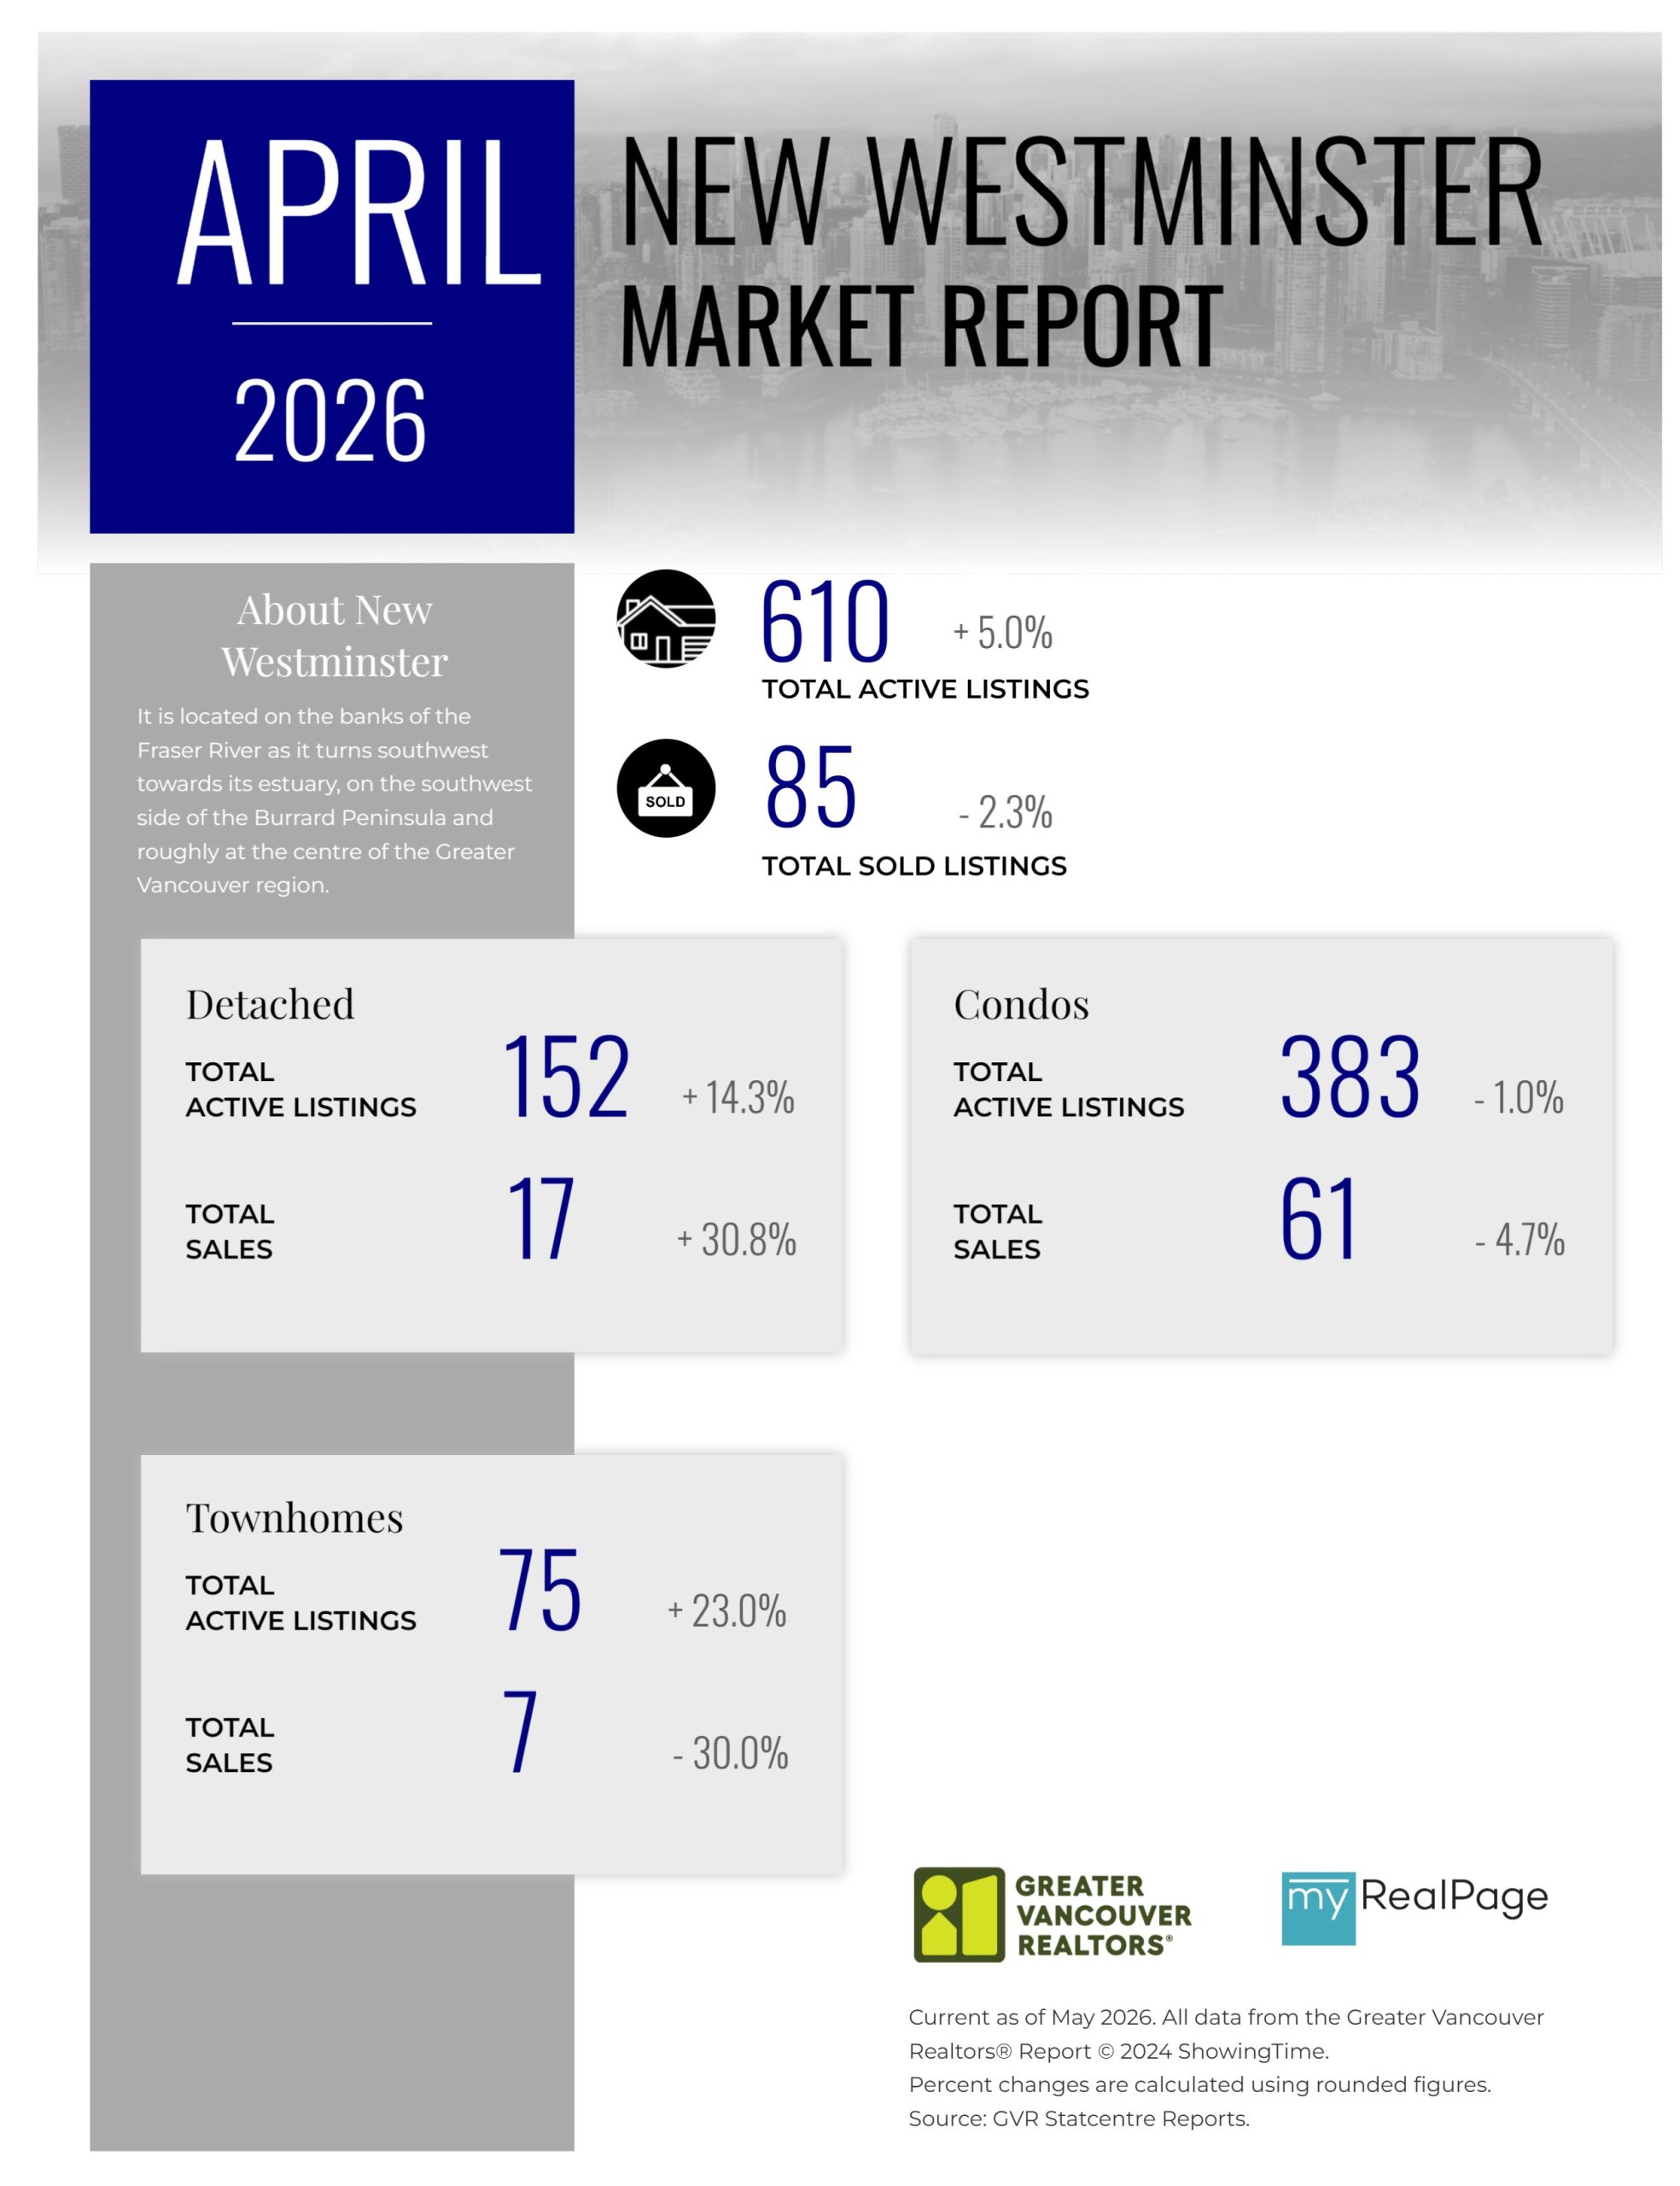
Printable Version – GVR April 2026 Data Infographics Report New Westminster
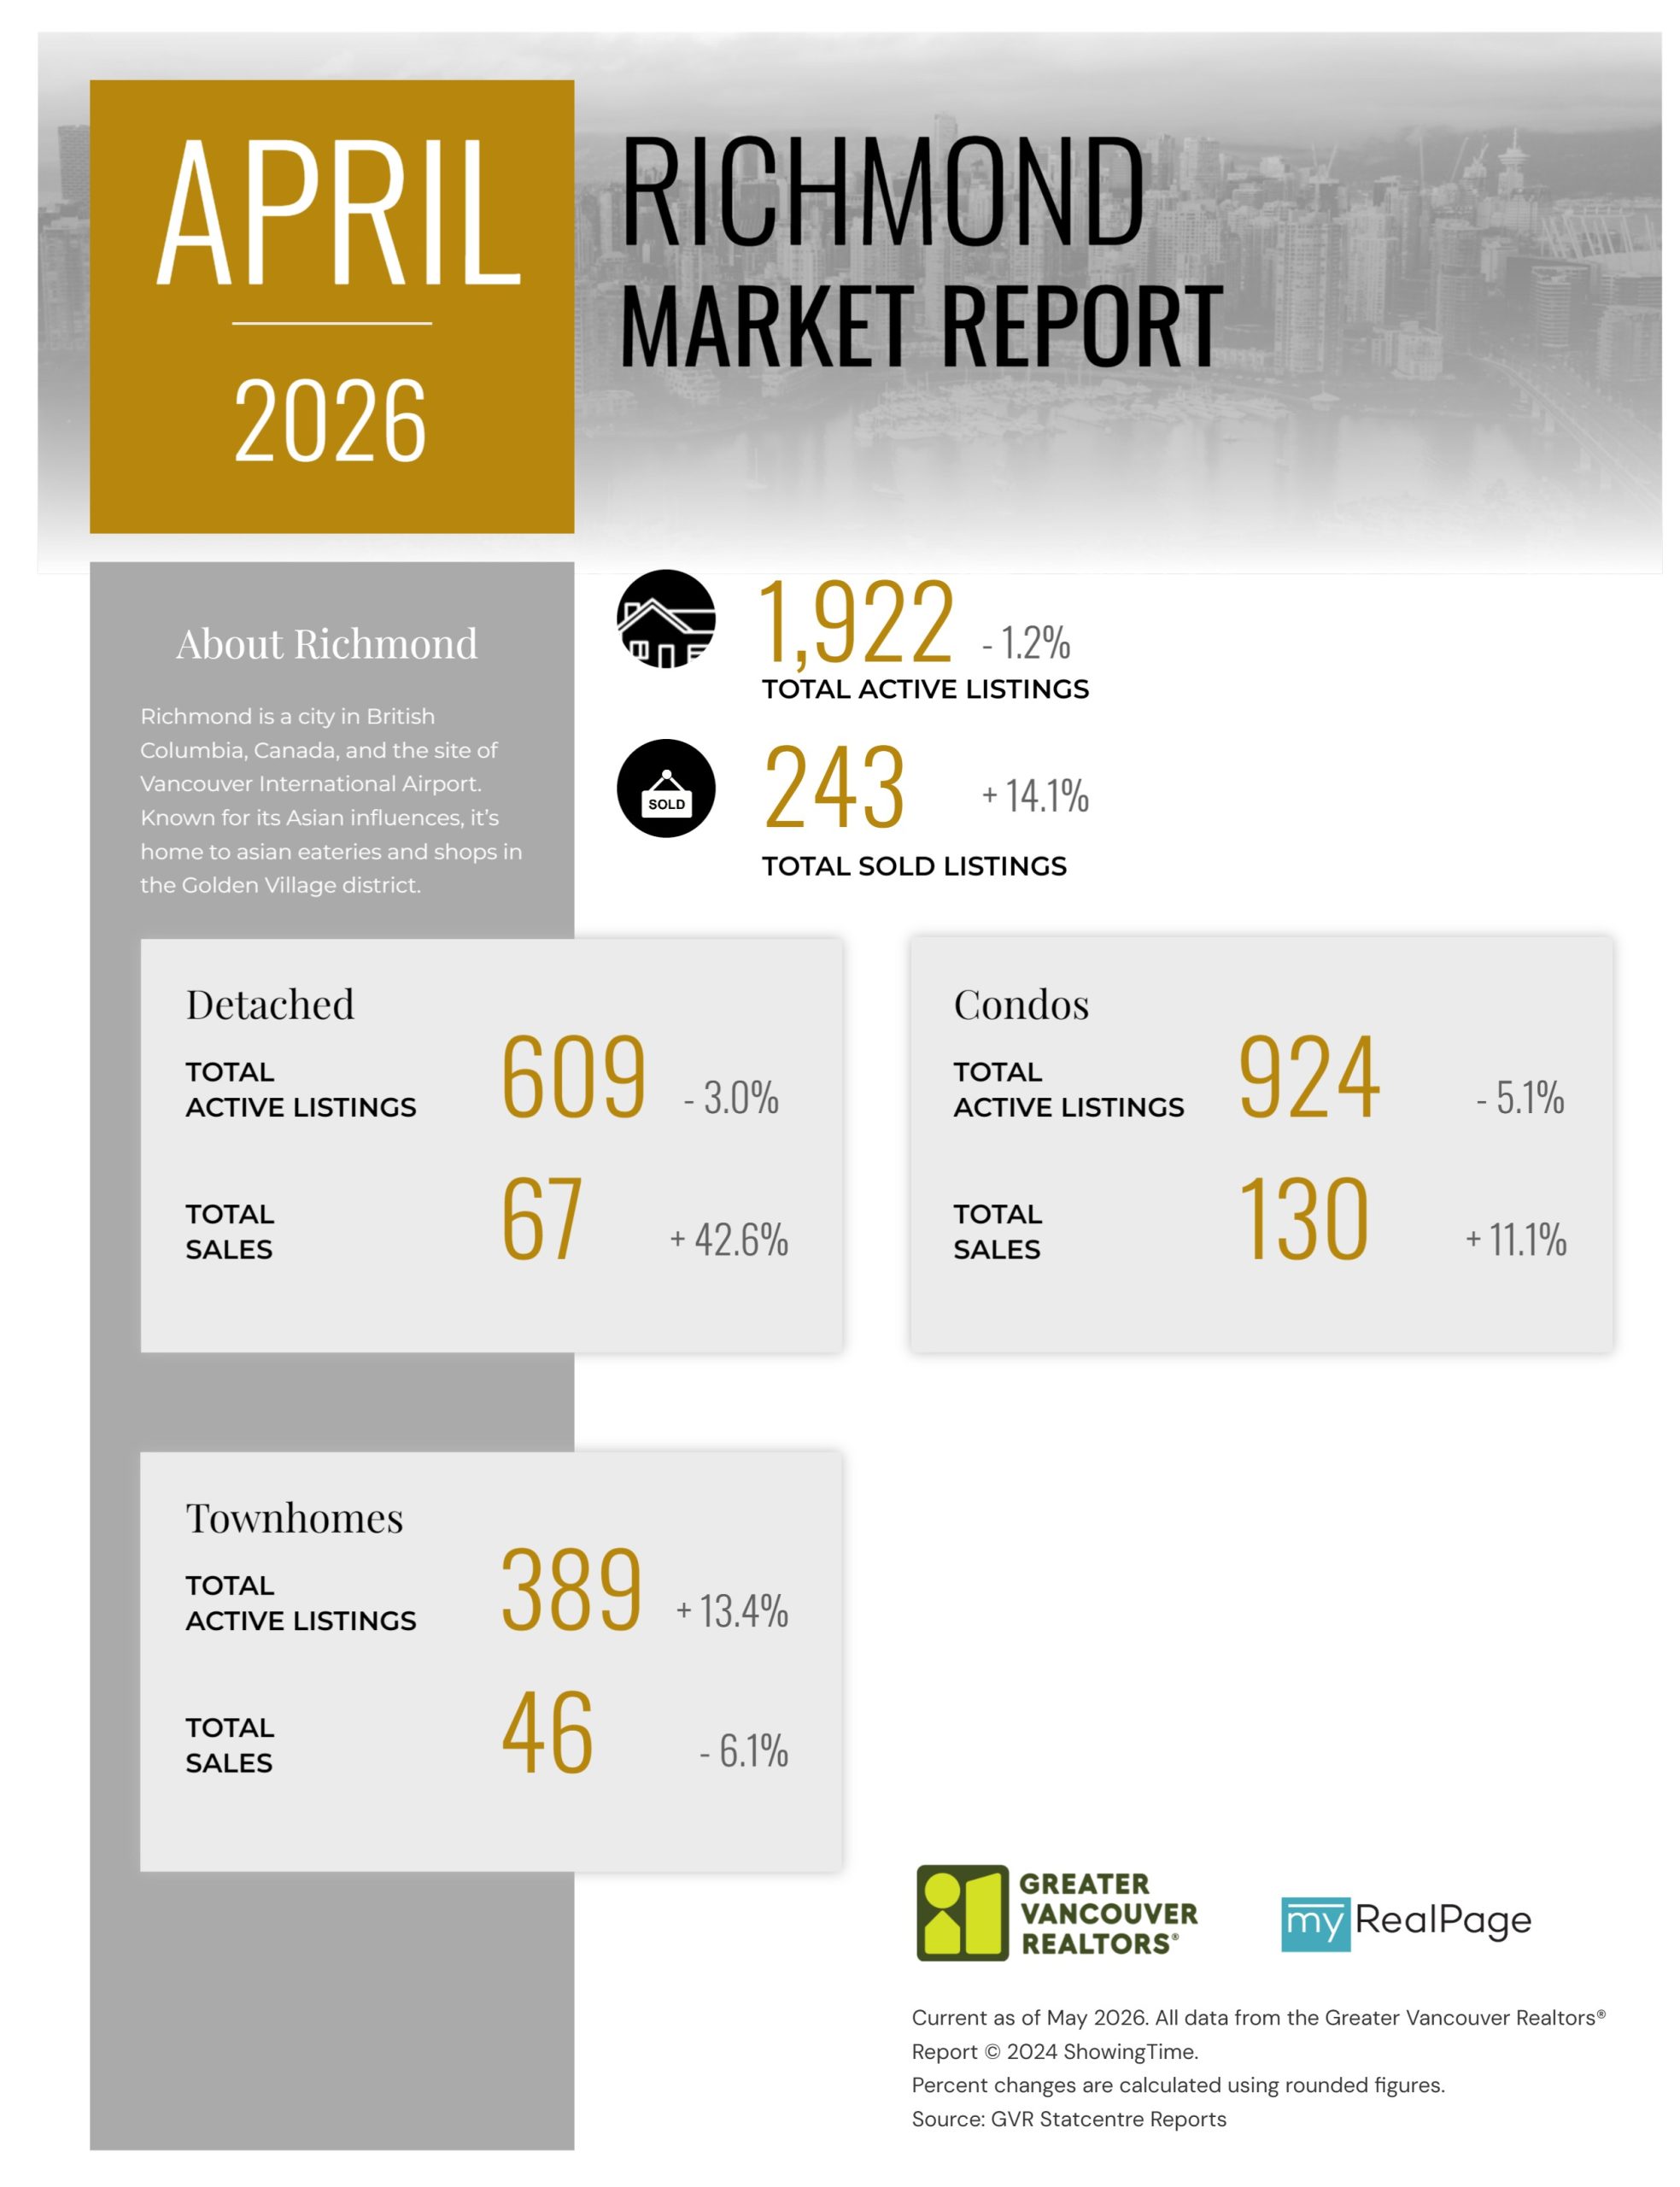
Printable Version – GVR April 2026 Data Infographics Report Richmond
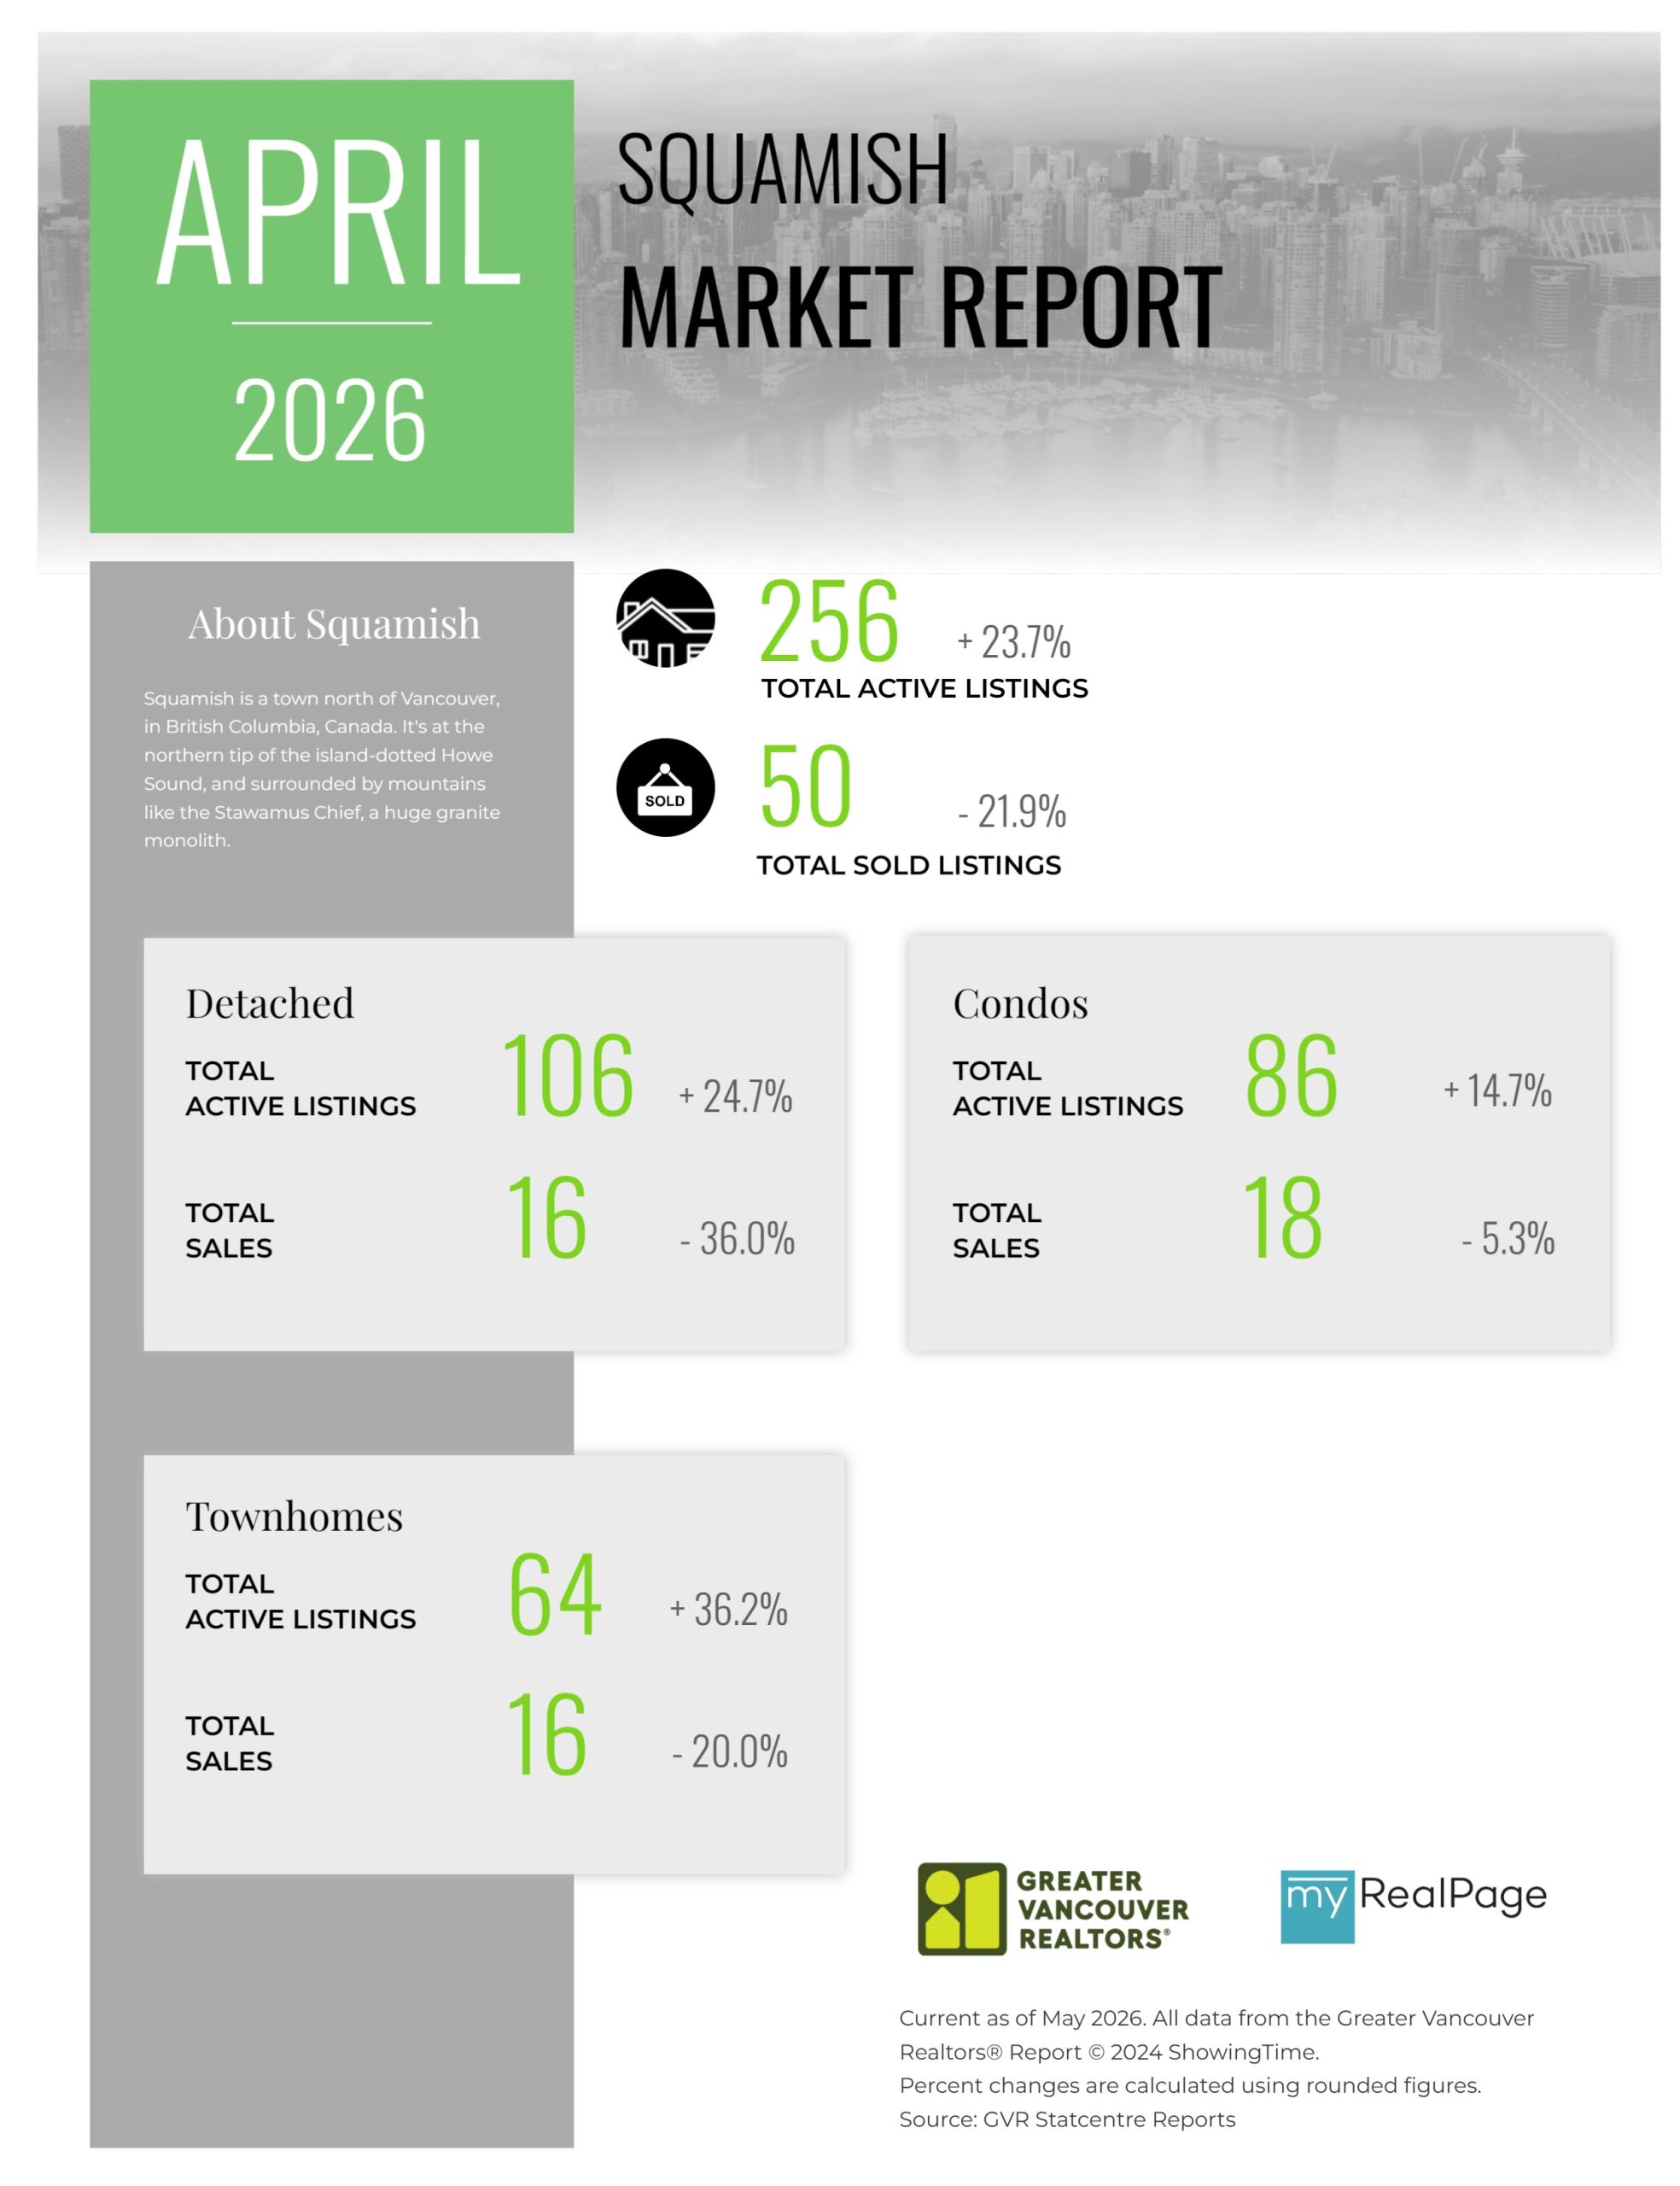
Printable Version – GVR April 2026 Data Infographics Report Squamish
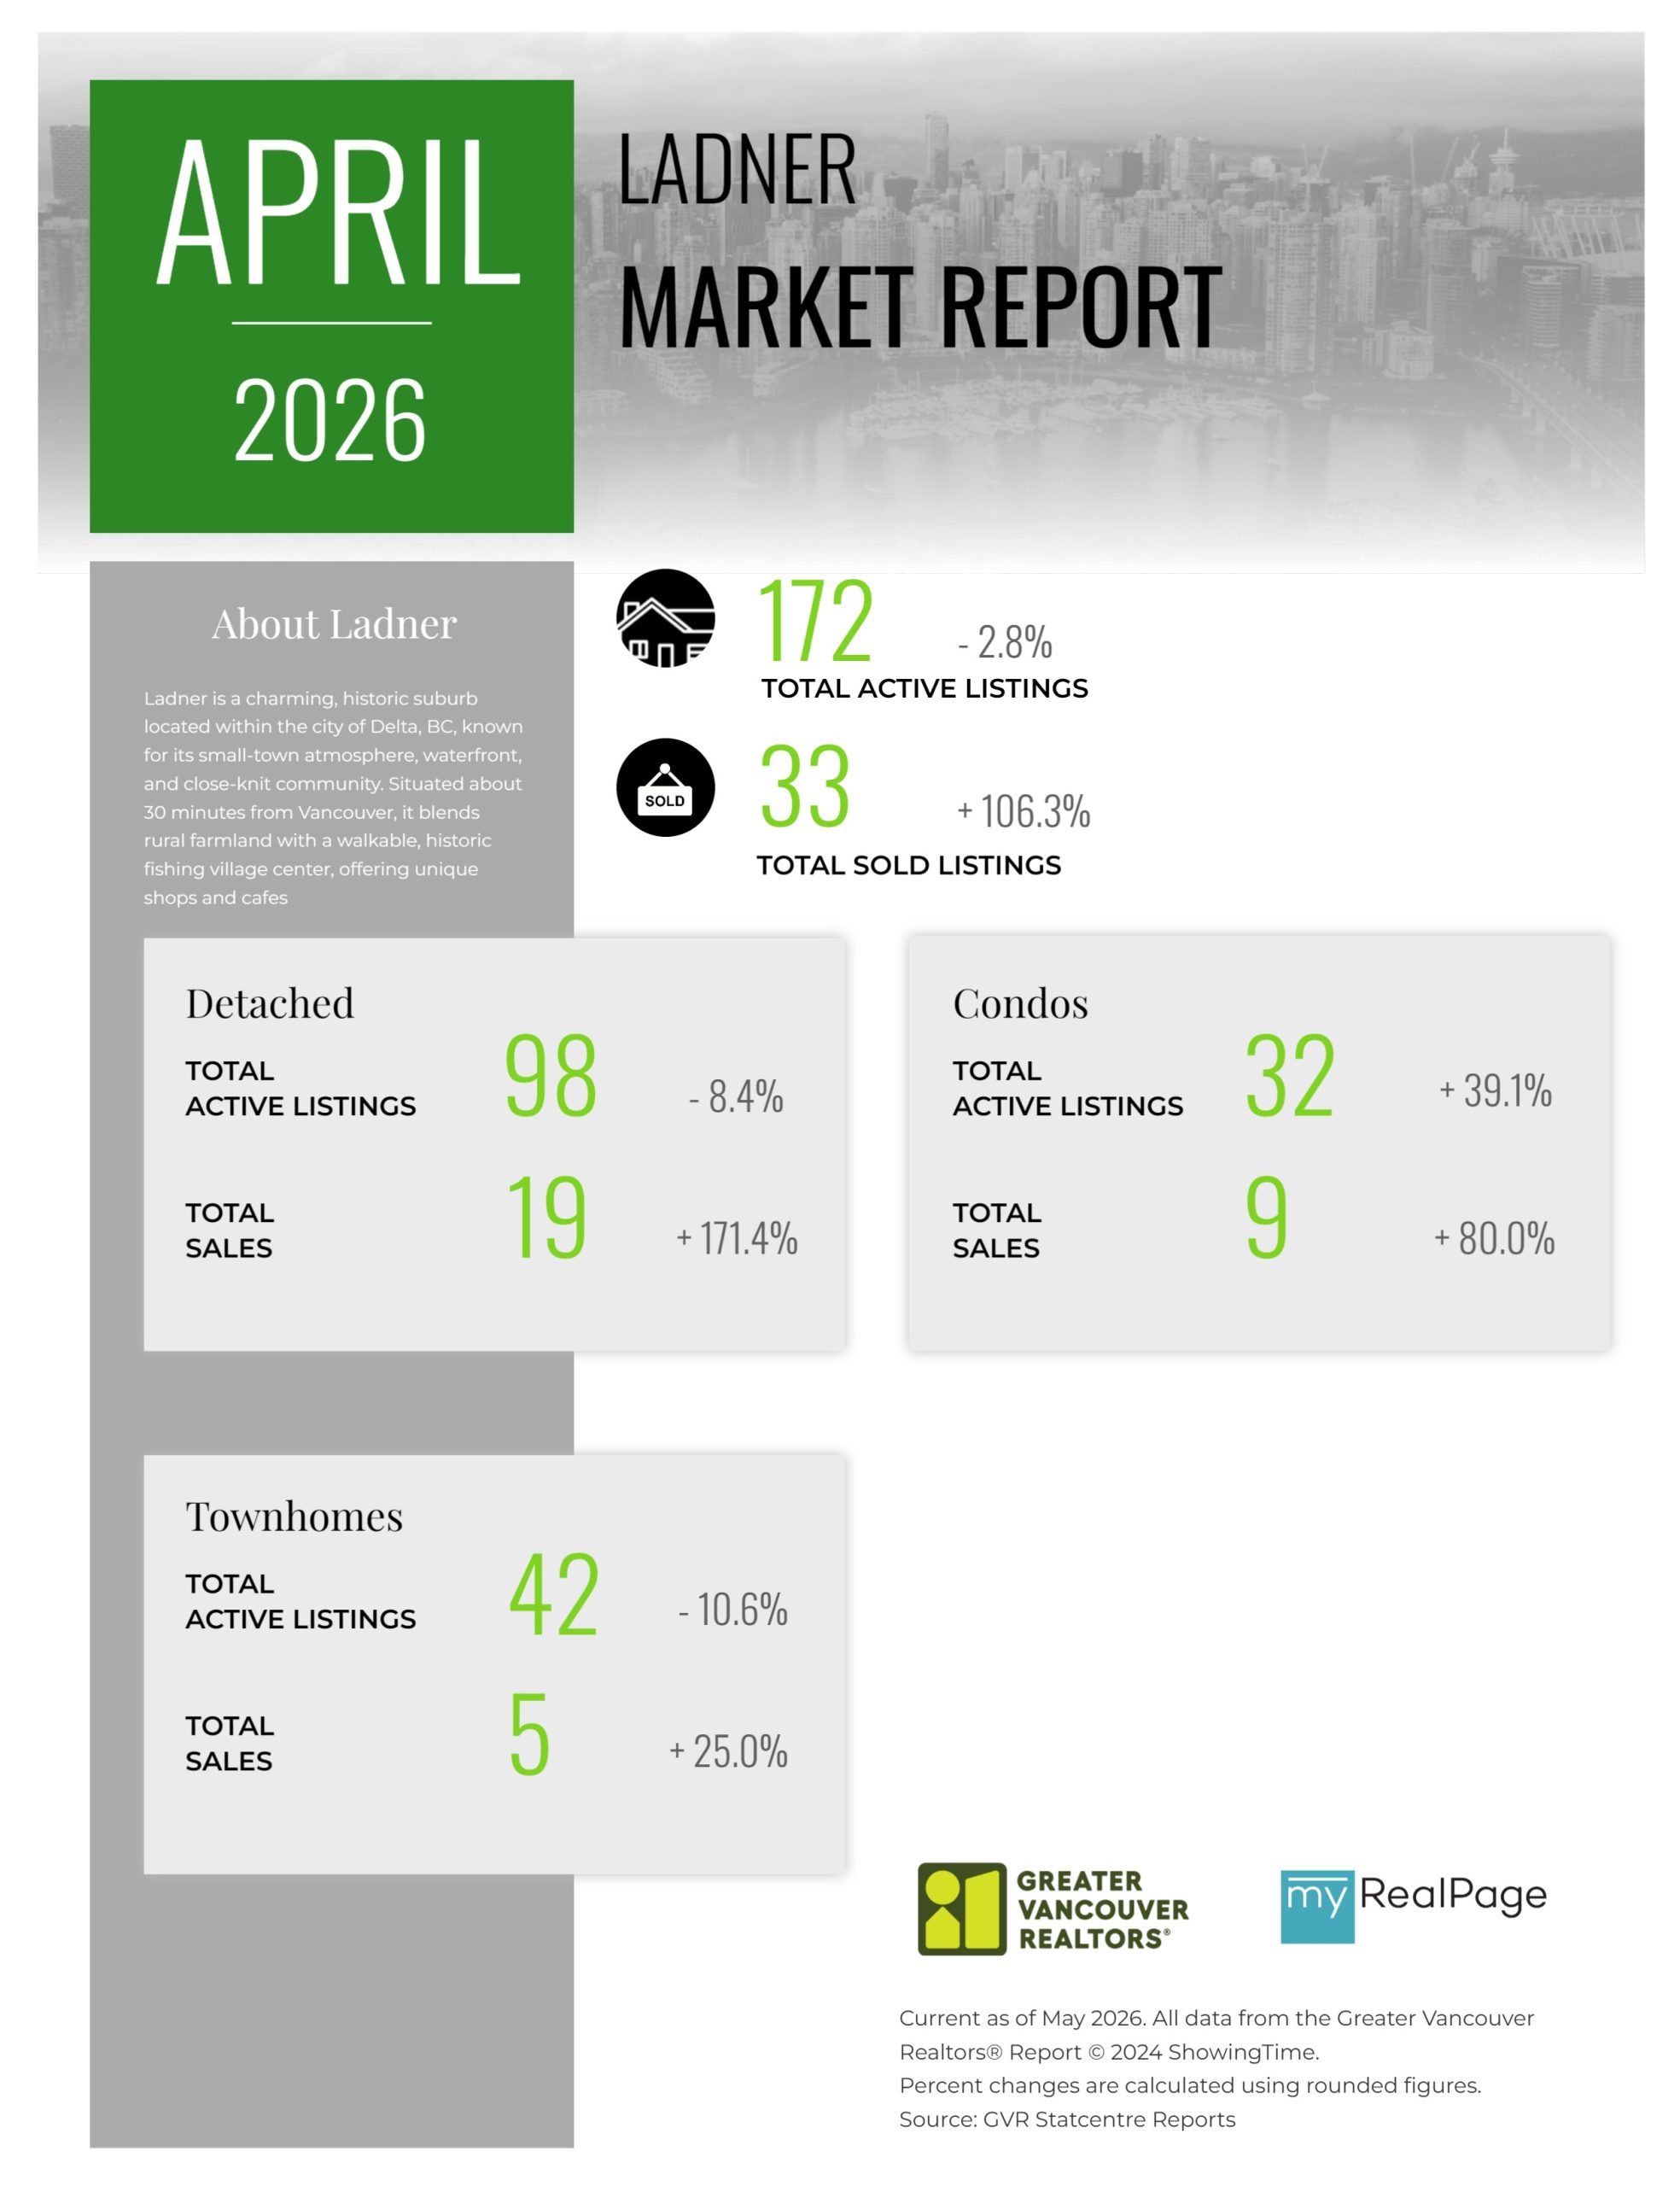
Printable Version – GVR April 2026 Data Infographics Report Ladner
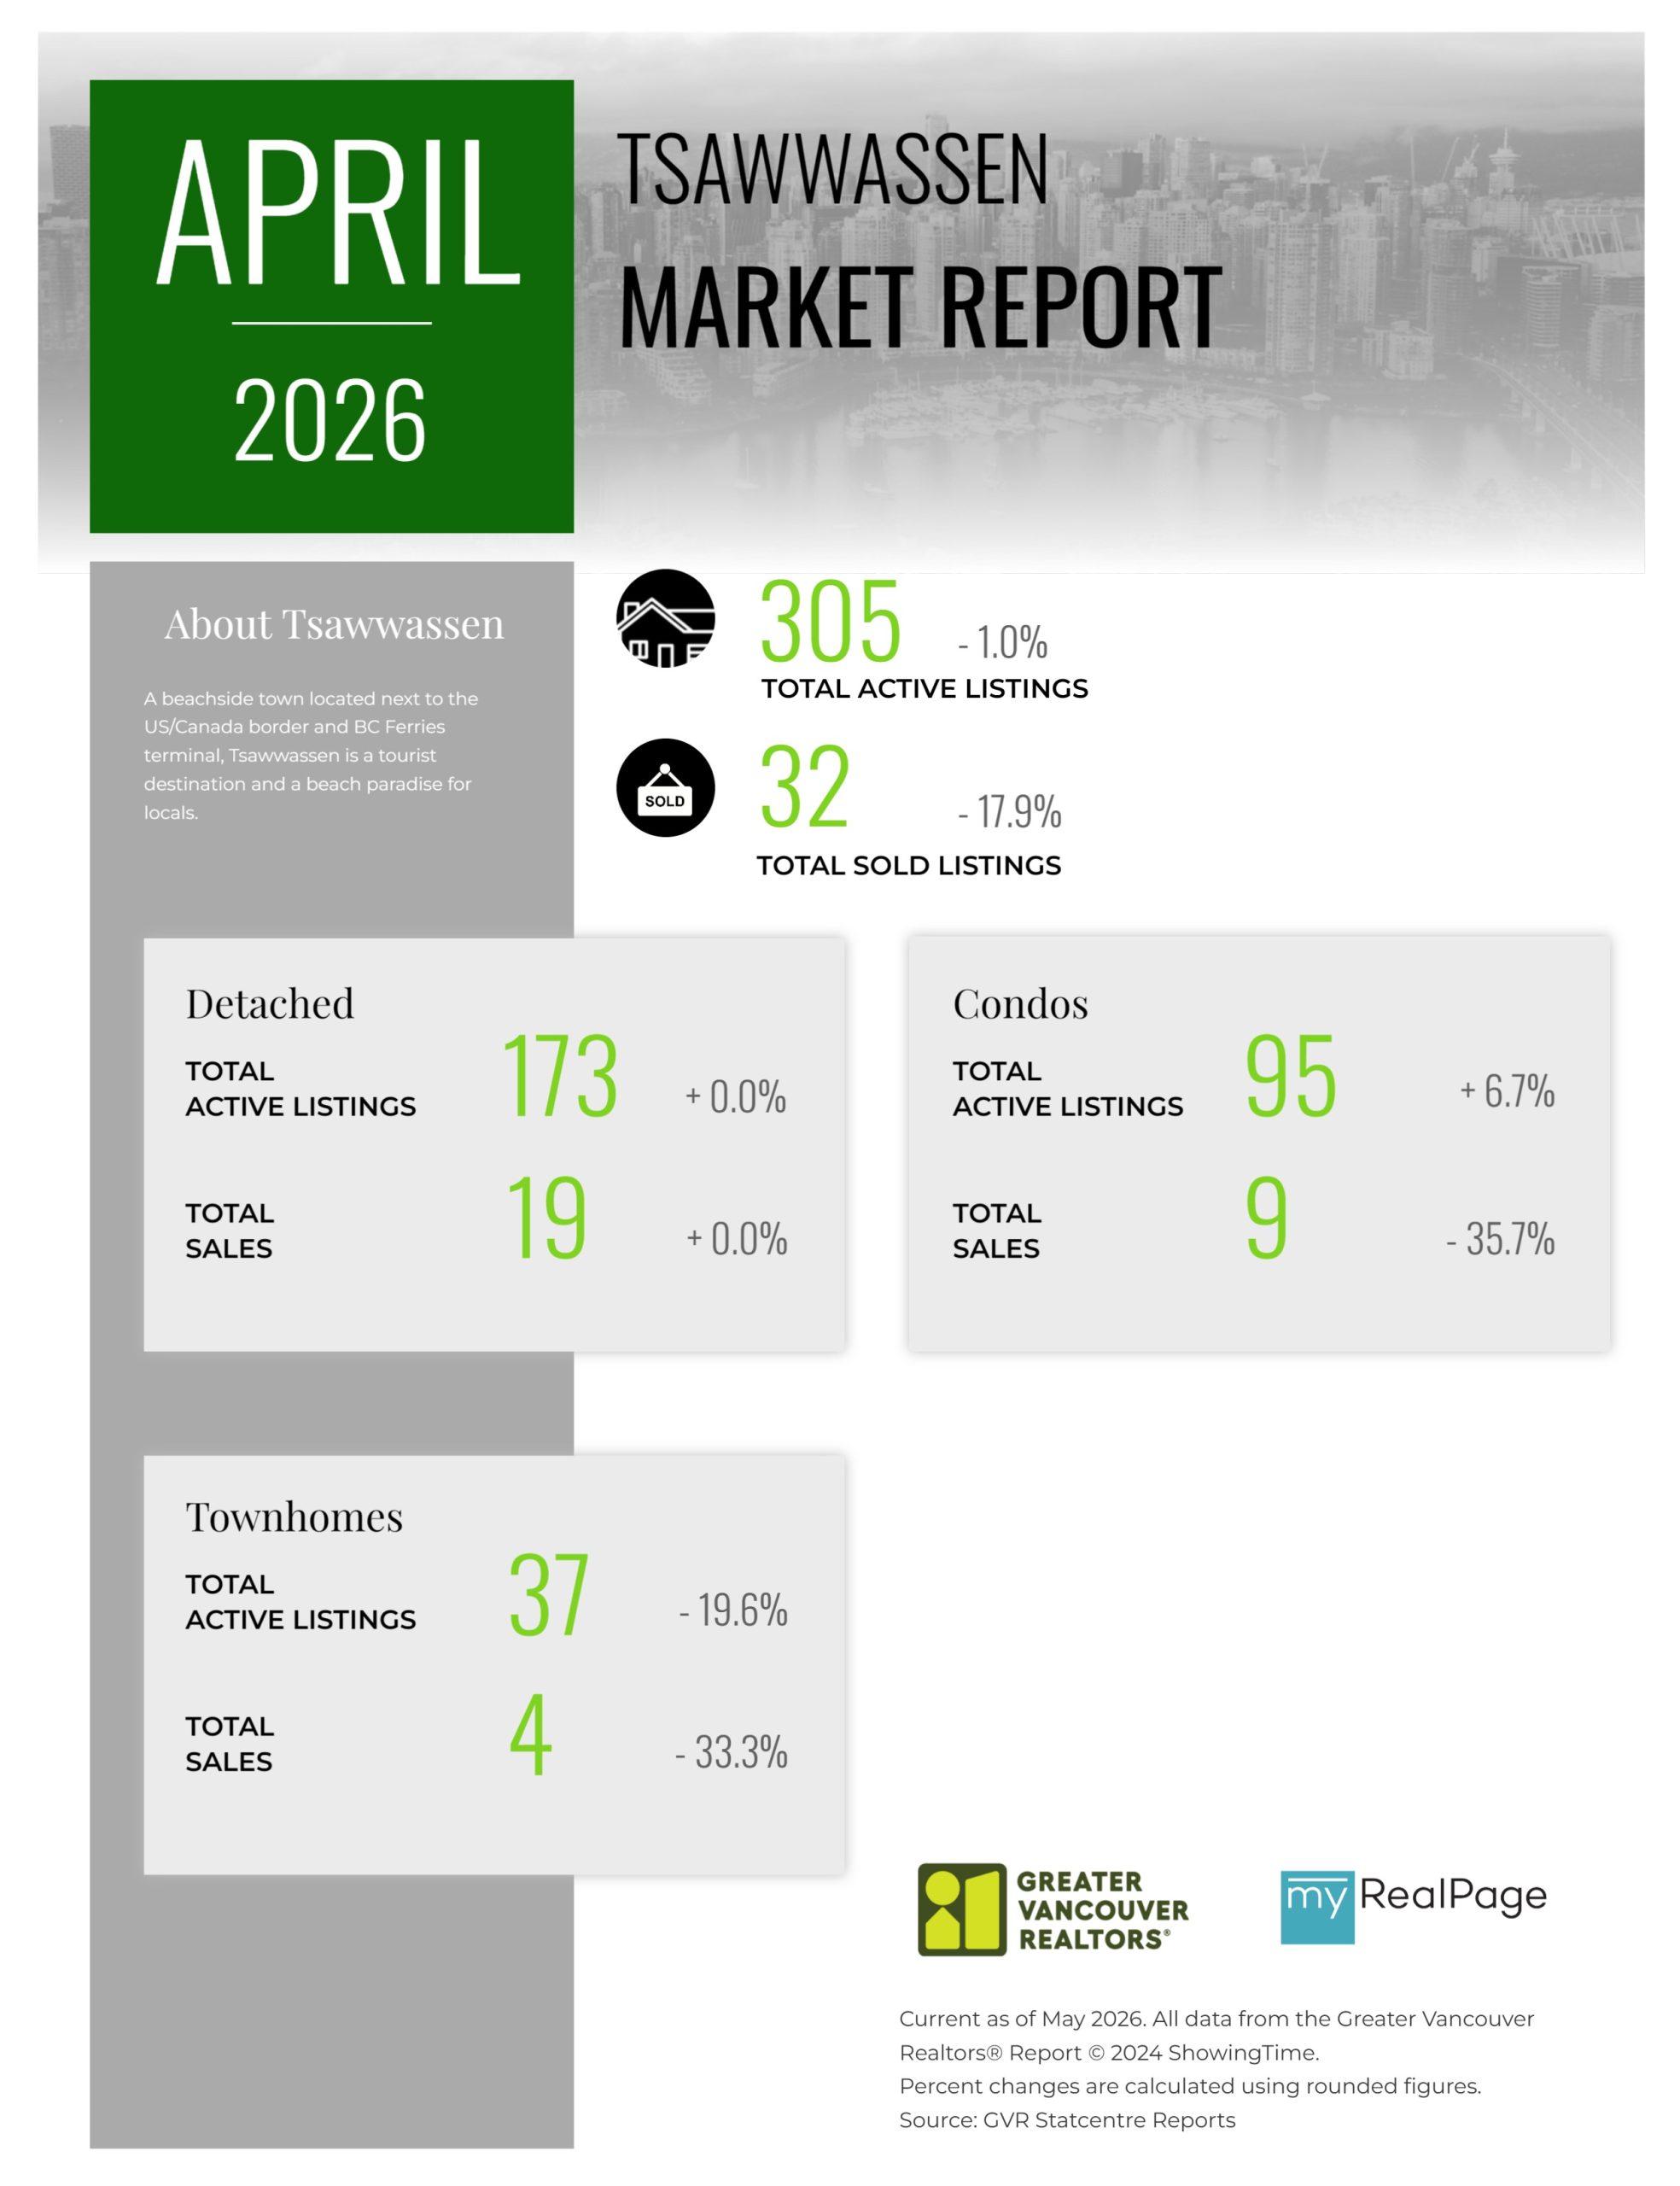
Printable Version – GVR April 2026 Data Infographics Report Tsawwassen
Last Updated on May 8, 2026 by myRealPage
