INFOGRAPHICS: February 2025 GVR Greater Vancouver Market Reports

February brings balance to Metro Vancouver’s housing market
After a 46 per cent year-over-year increase of new listings in January, the number of newly listed properties on the MLS® in Metro Vancouver rose more moderately in February helping keep market conditions in balanced territory.
The Greater Vancouver REALTORS® (GVR) reports that residential sales in the region totalled 1,827 on Metro Vancouver’s Multiple Listing Service® (MLS®) in February 2025, an 11.7 per cent decrease from the 2,070 sales recorded in February 2024. This total was 28.9 per cent below the 10-year seasonal average (2,571).
“After the rush of new listings in January, home sales and new listings in February were closer to historical averages, which has positioned the overall market in balanced conditions. With a potential Bank of Canada rate cut on the table for mid-March, homebuyers may find slightly improved borrowing conditions while enjoying the largest selection of homes on the market since pre-pandemic times.”
Read the full report on the REBGV website!
The following data is a comparison between February 2025 and February 2024 numbers, and is current as of March of 2025. For last month’s update, you can check out our previous post!
Or follow this link for all our GVR Infographics!
These infographics cover current trends in several areas within the Greater Vancouver region. Click on the images for a larger view!
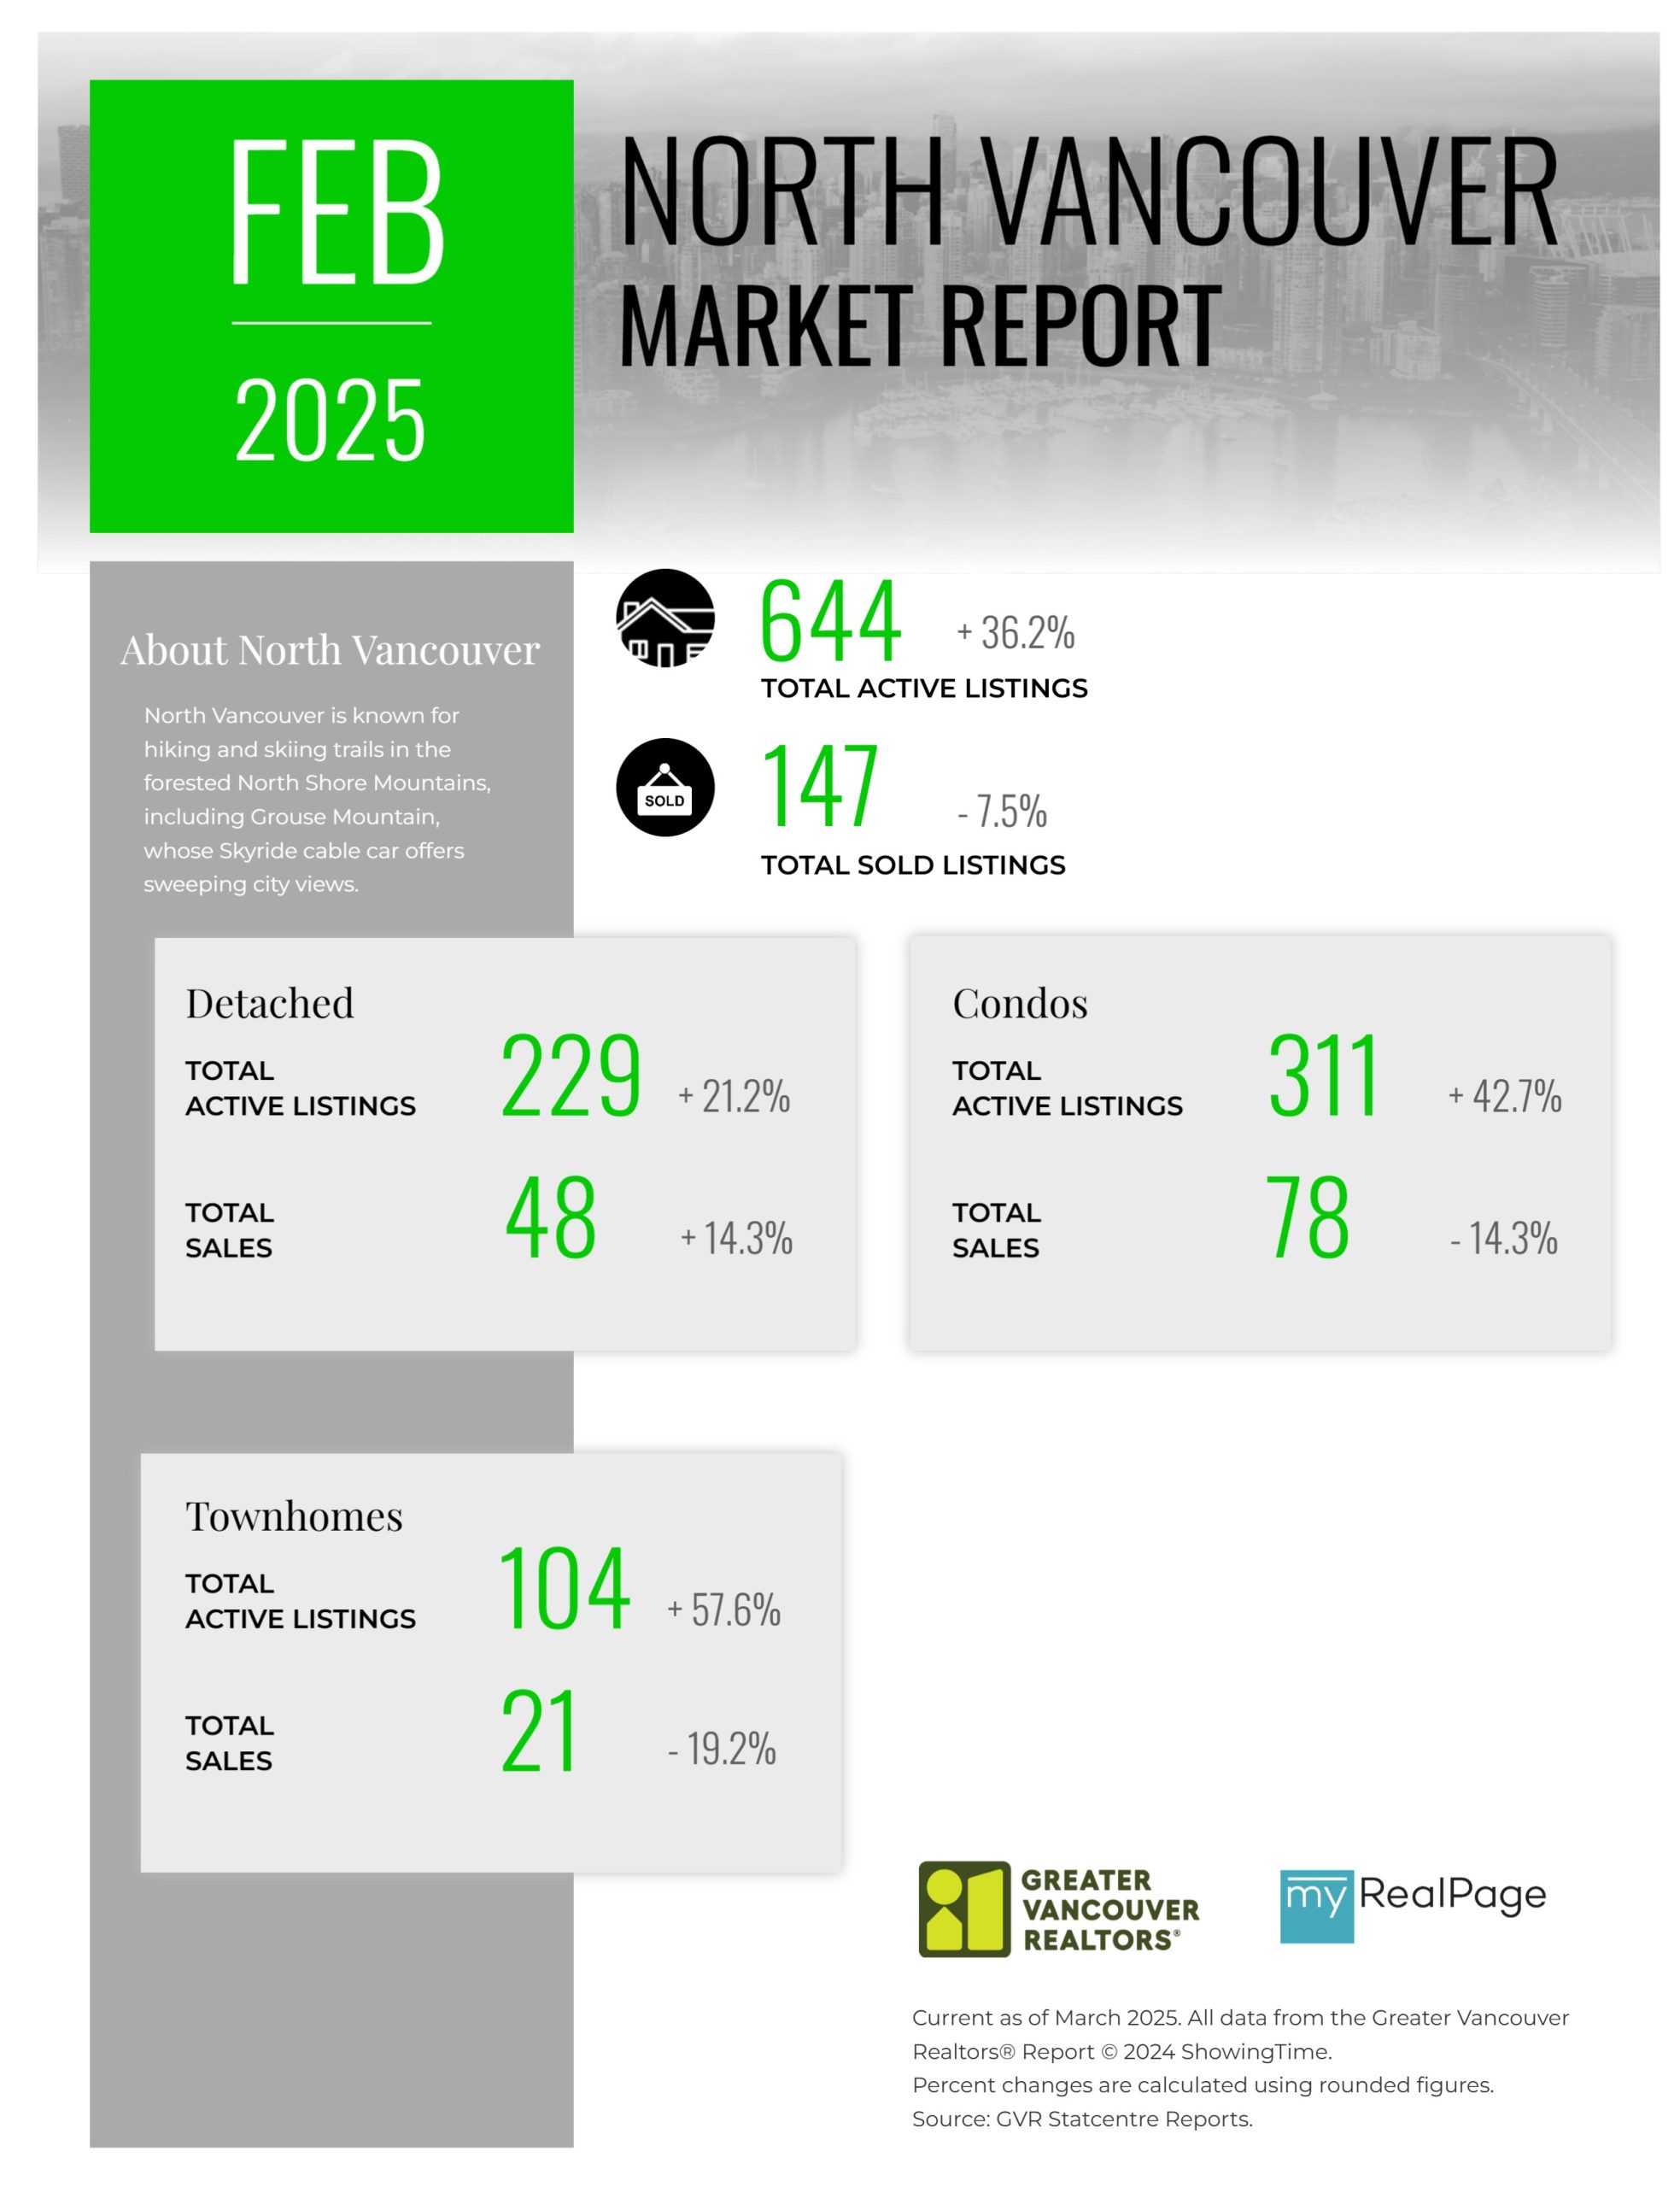
Printable Version – GVR February 2025 Data Infographic Report North Vancouver
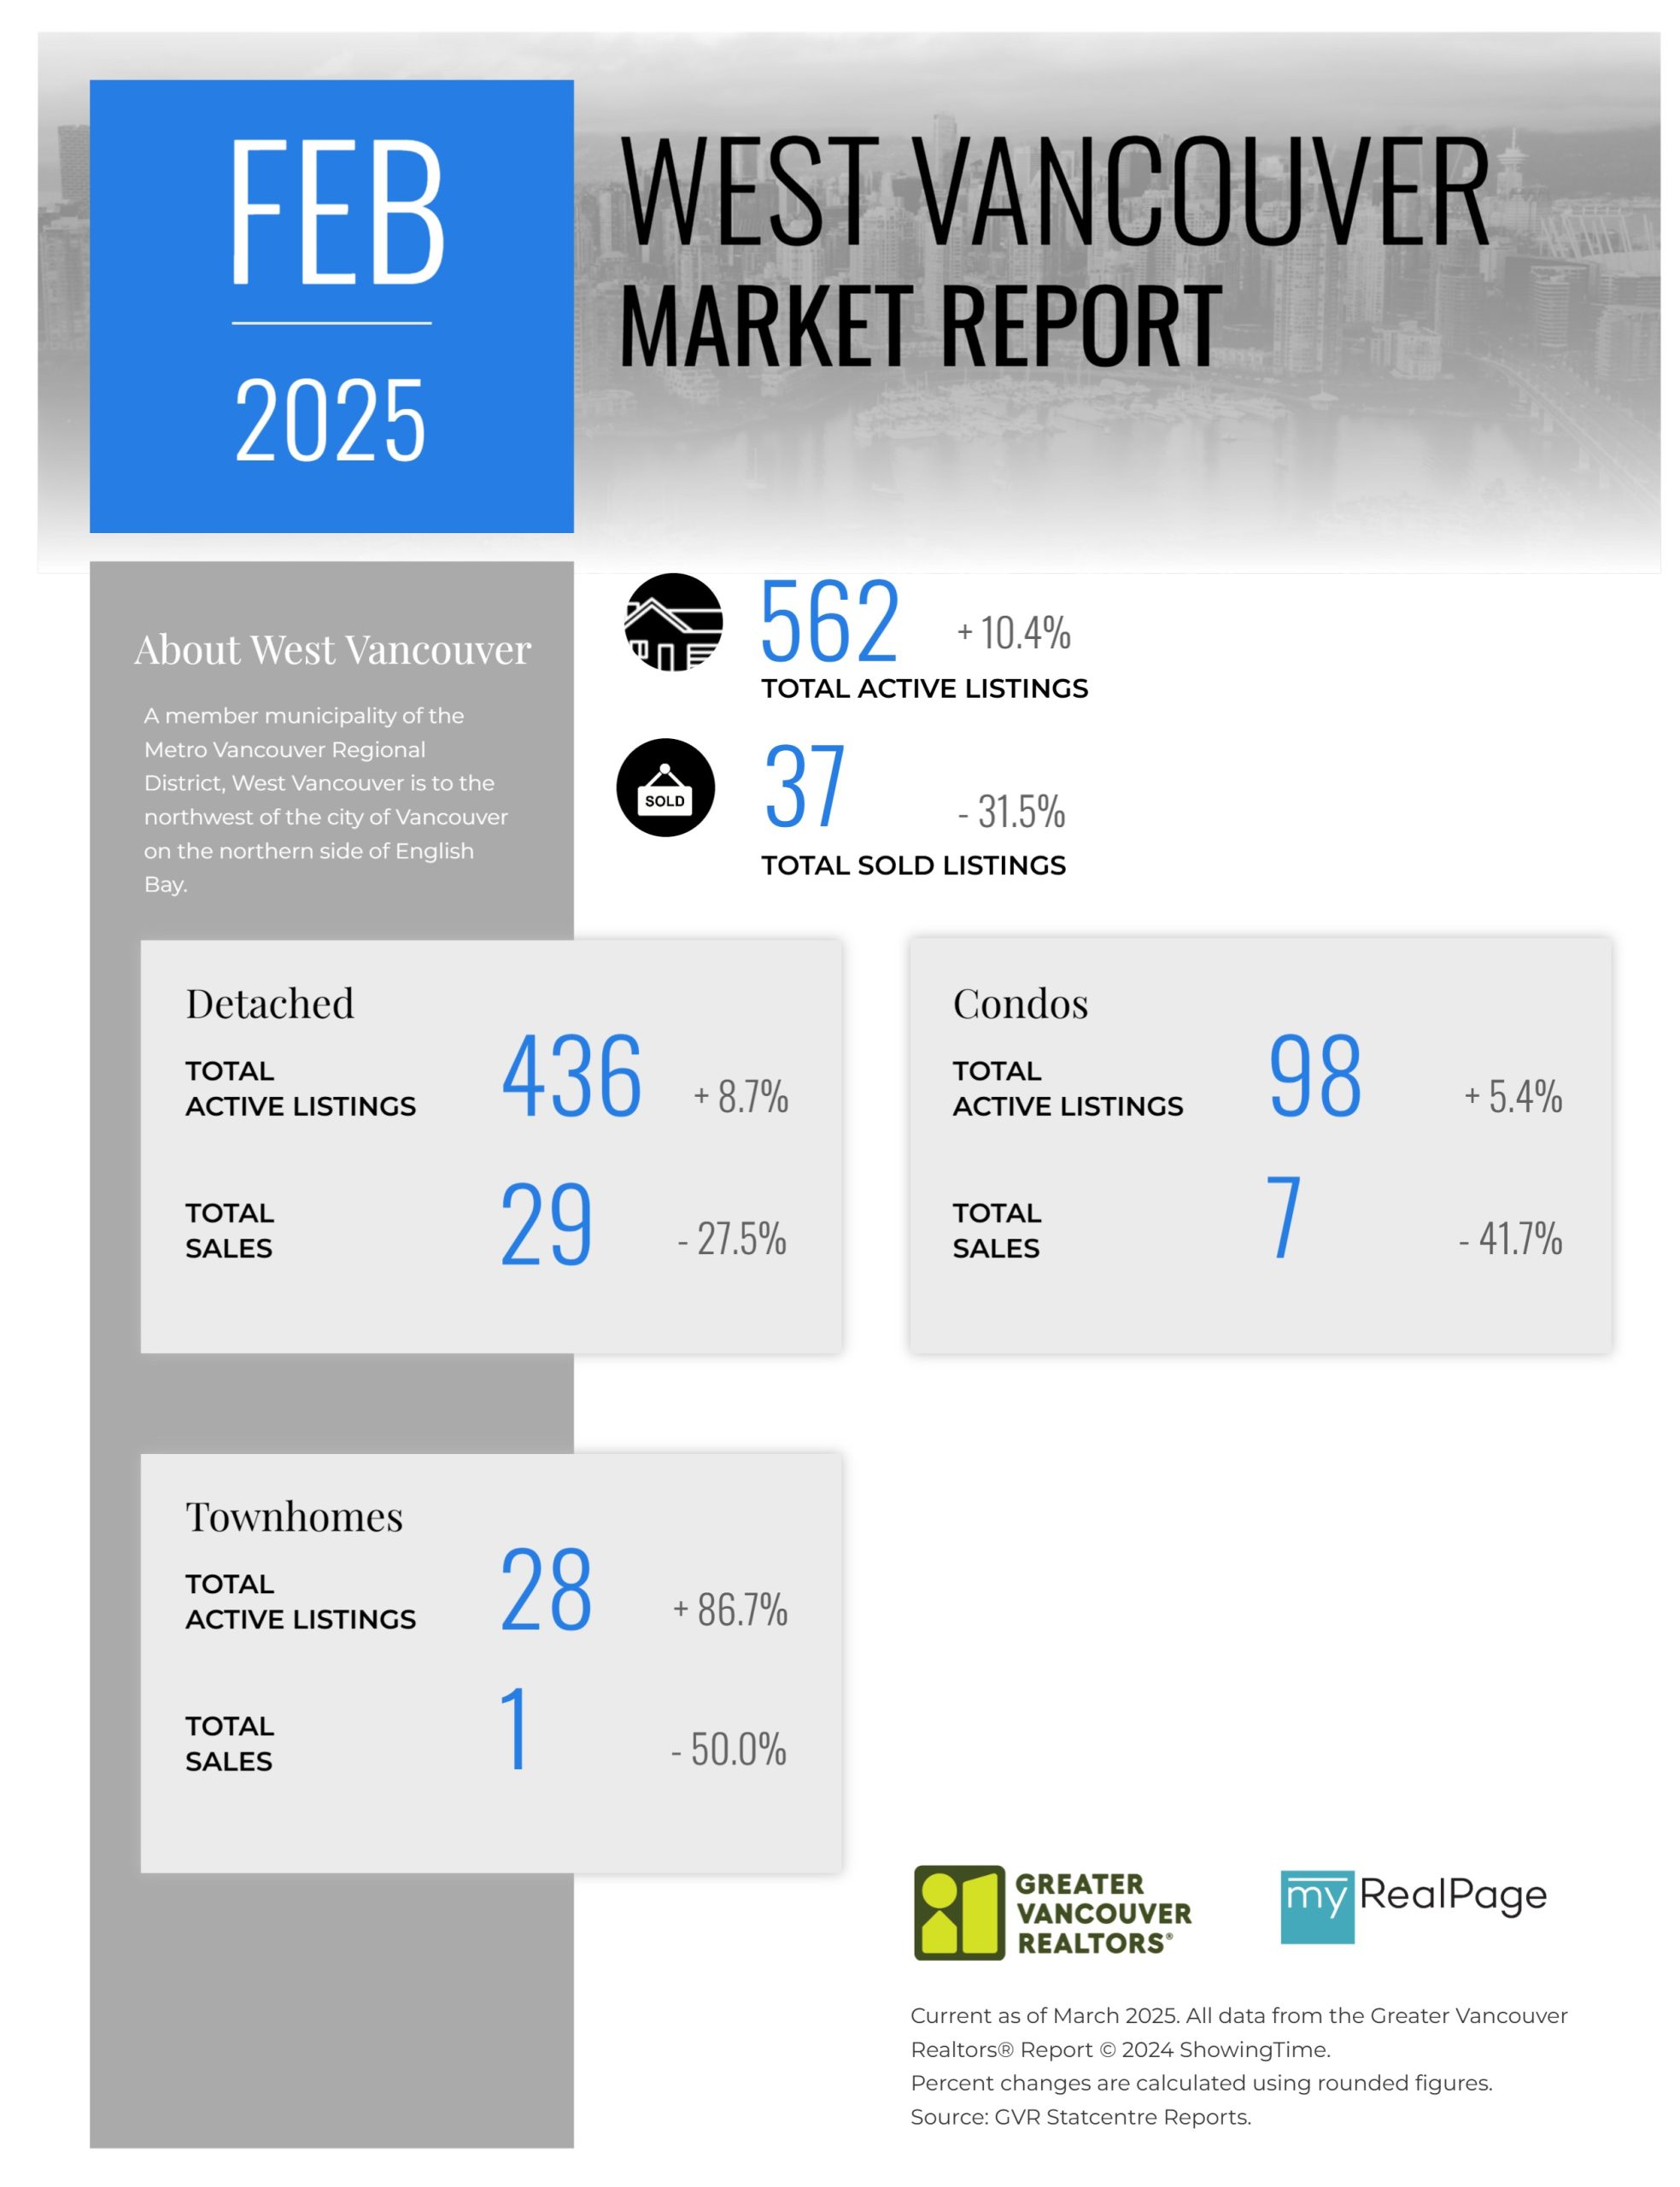
Printable Version – GVR February 2025 Data Infographics Report West Vancouver
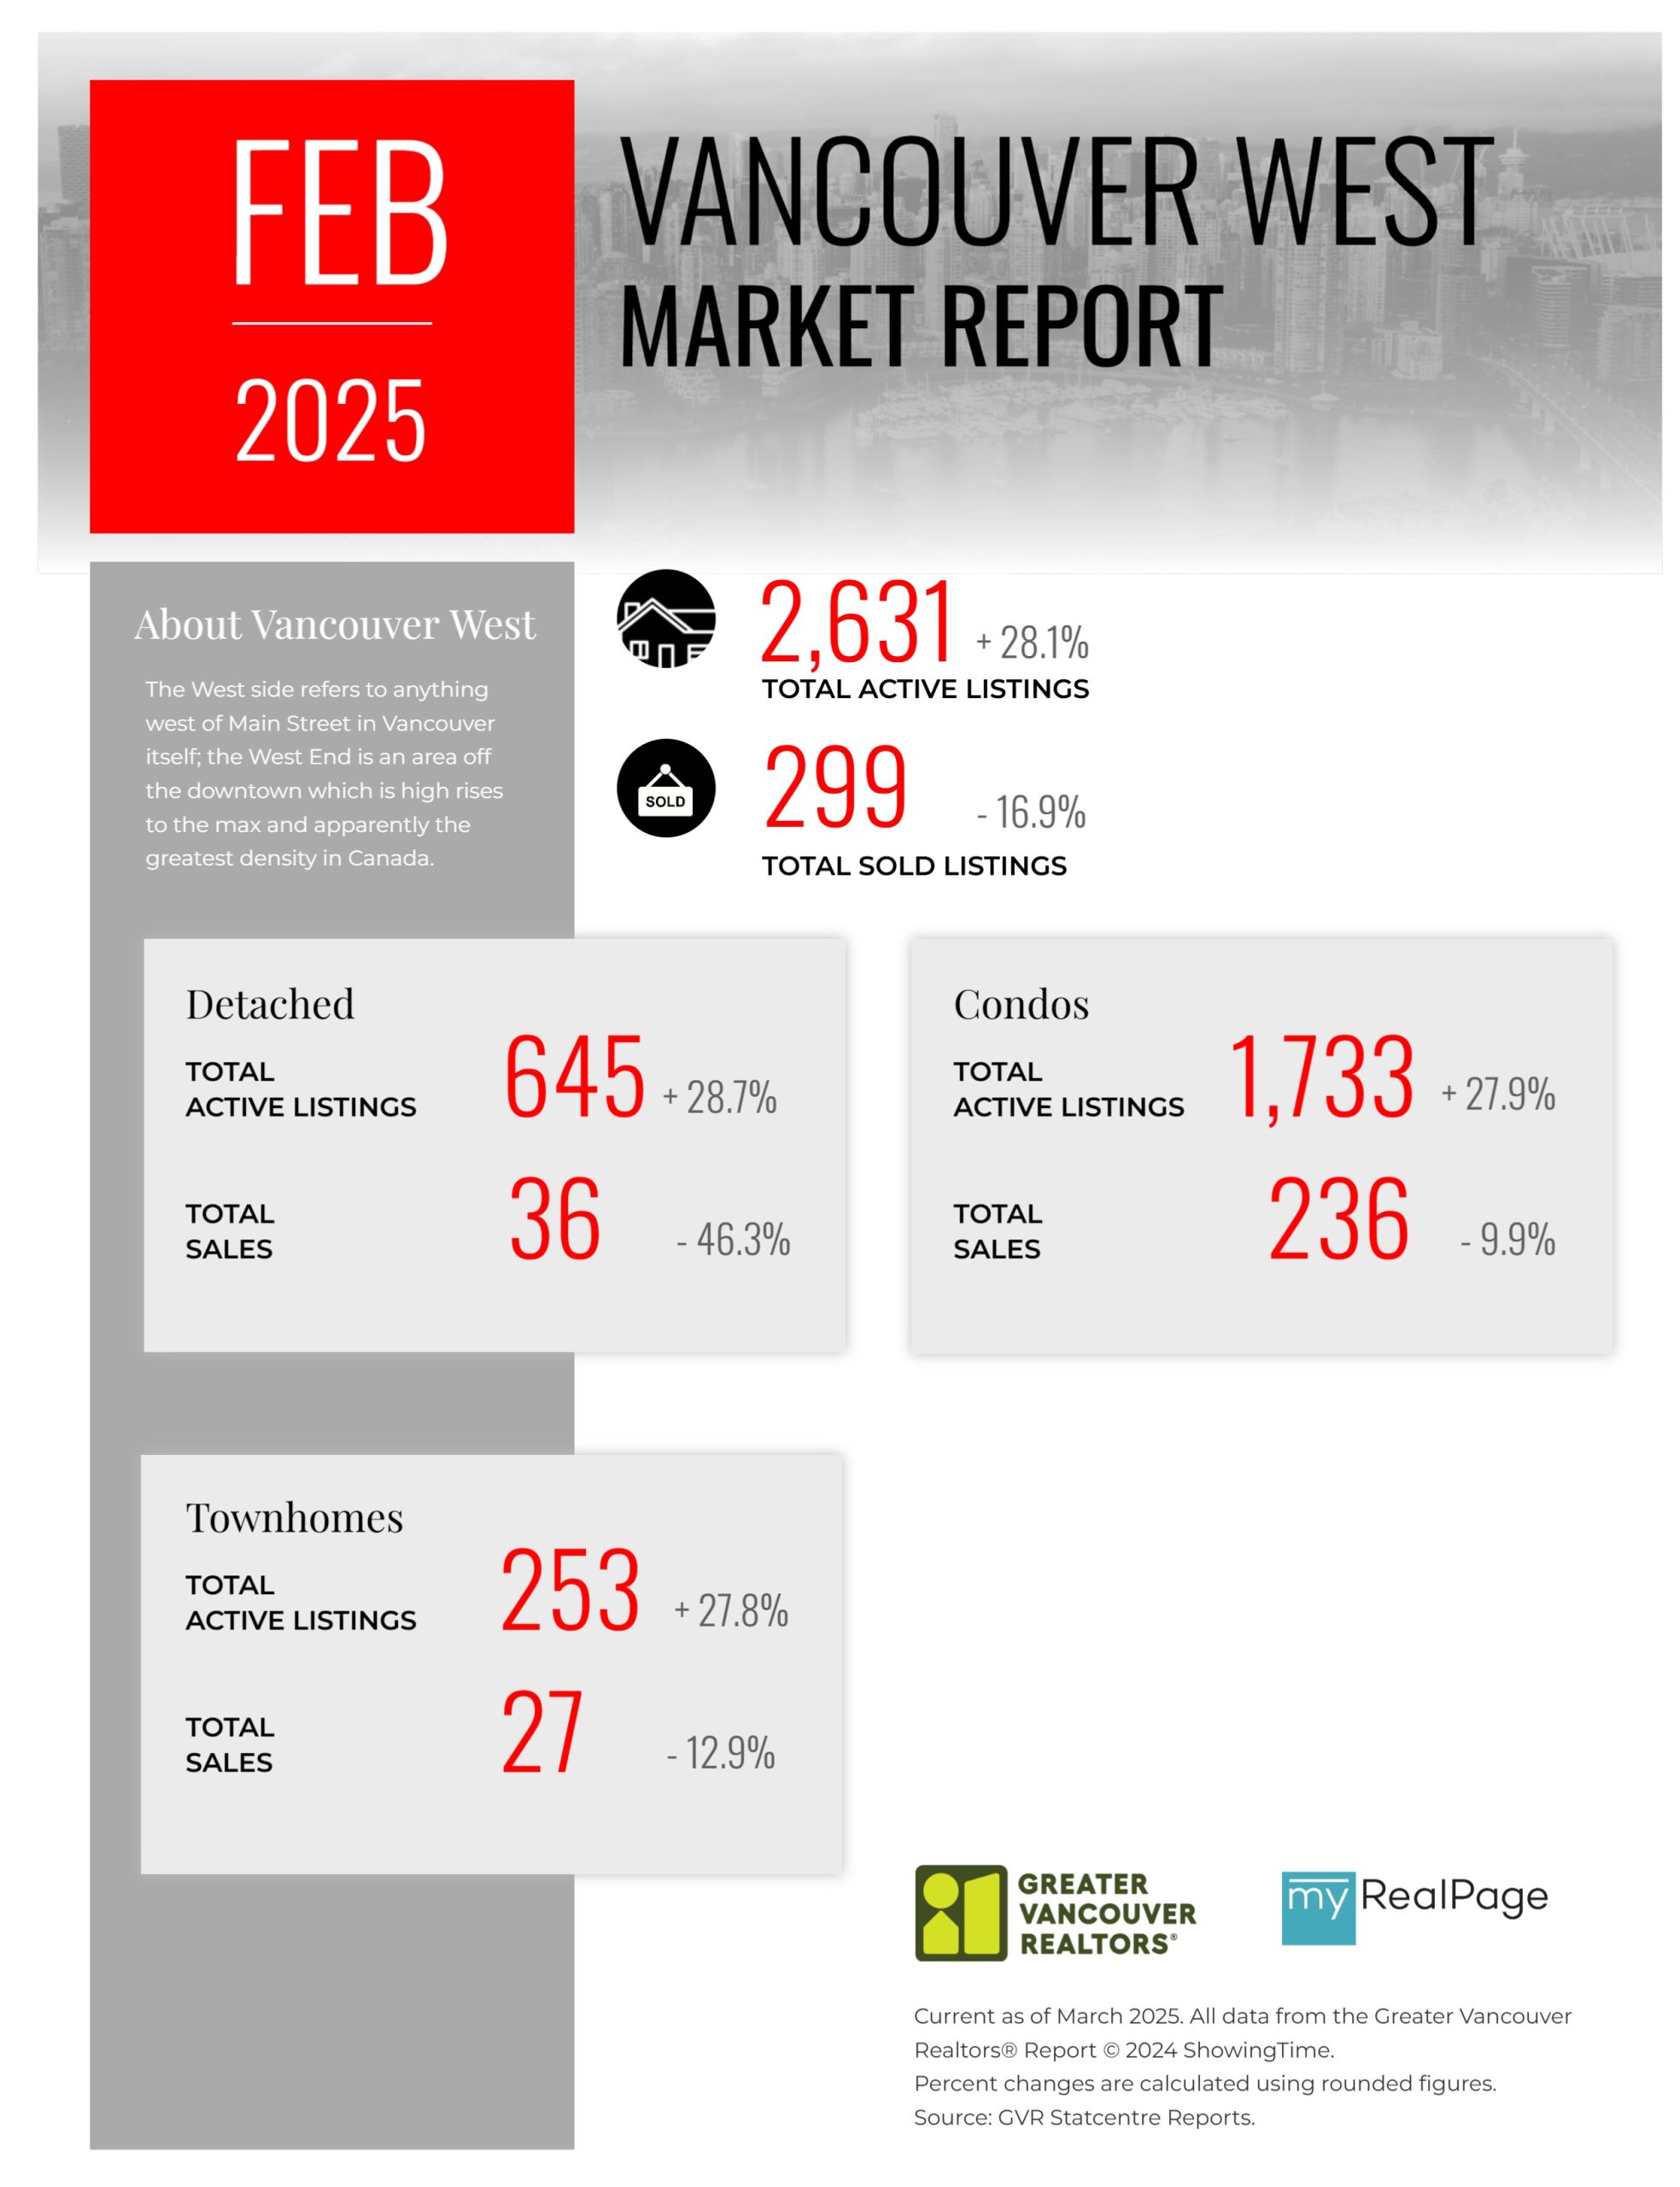
Printable Version – GVR February 2025 Data Infographics Report Vancouver West
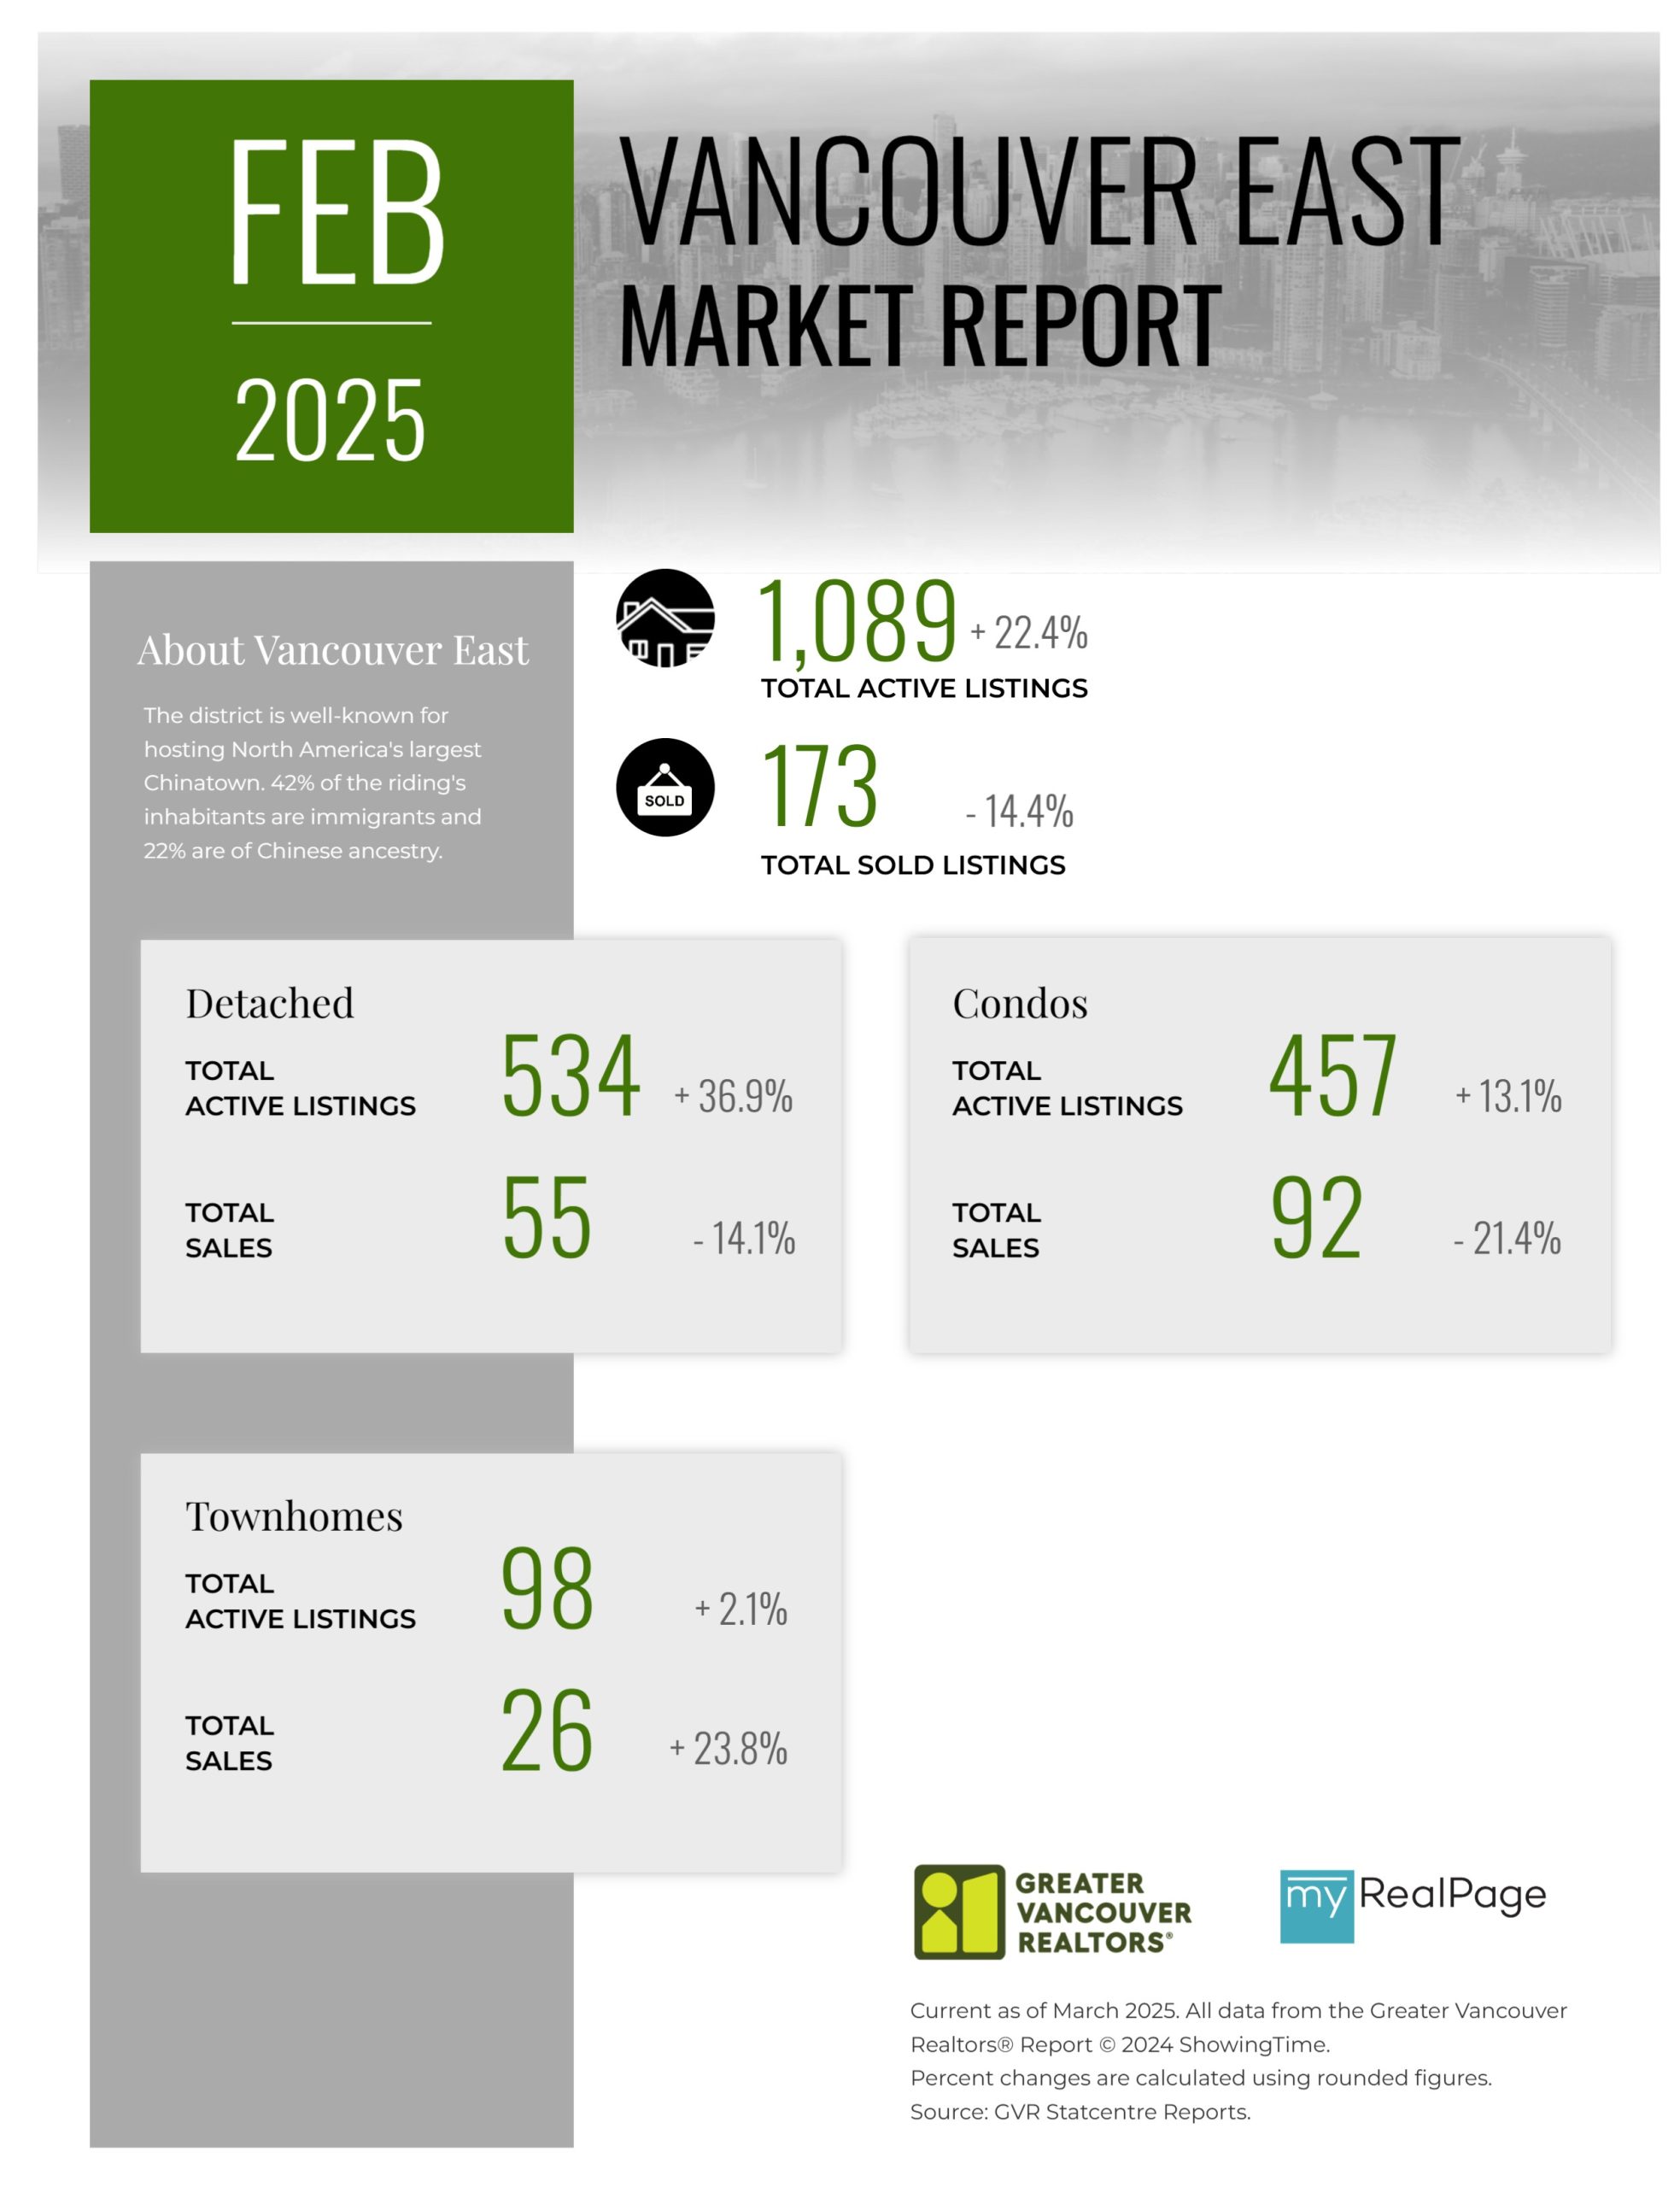
Printable Version – GVR February 2025 Data Infographics Report Vancouver East
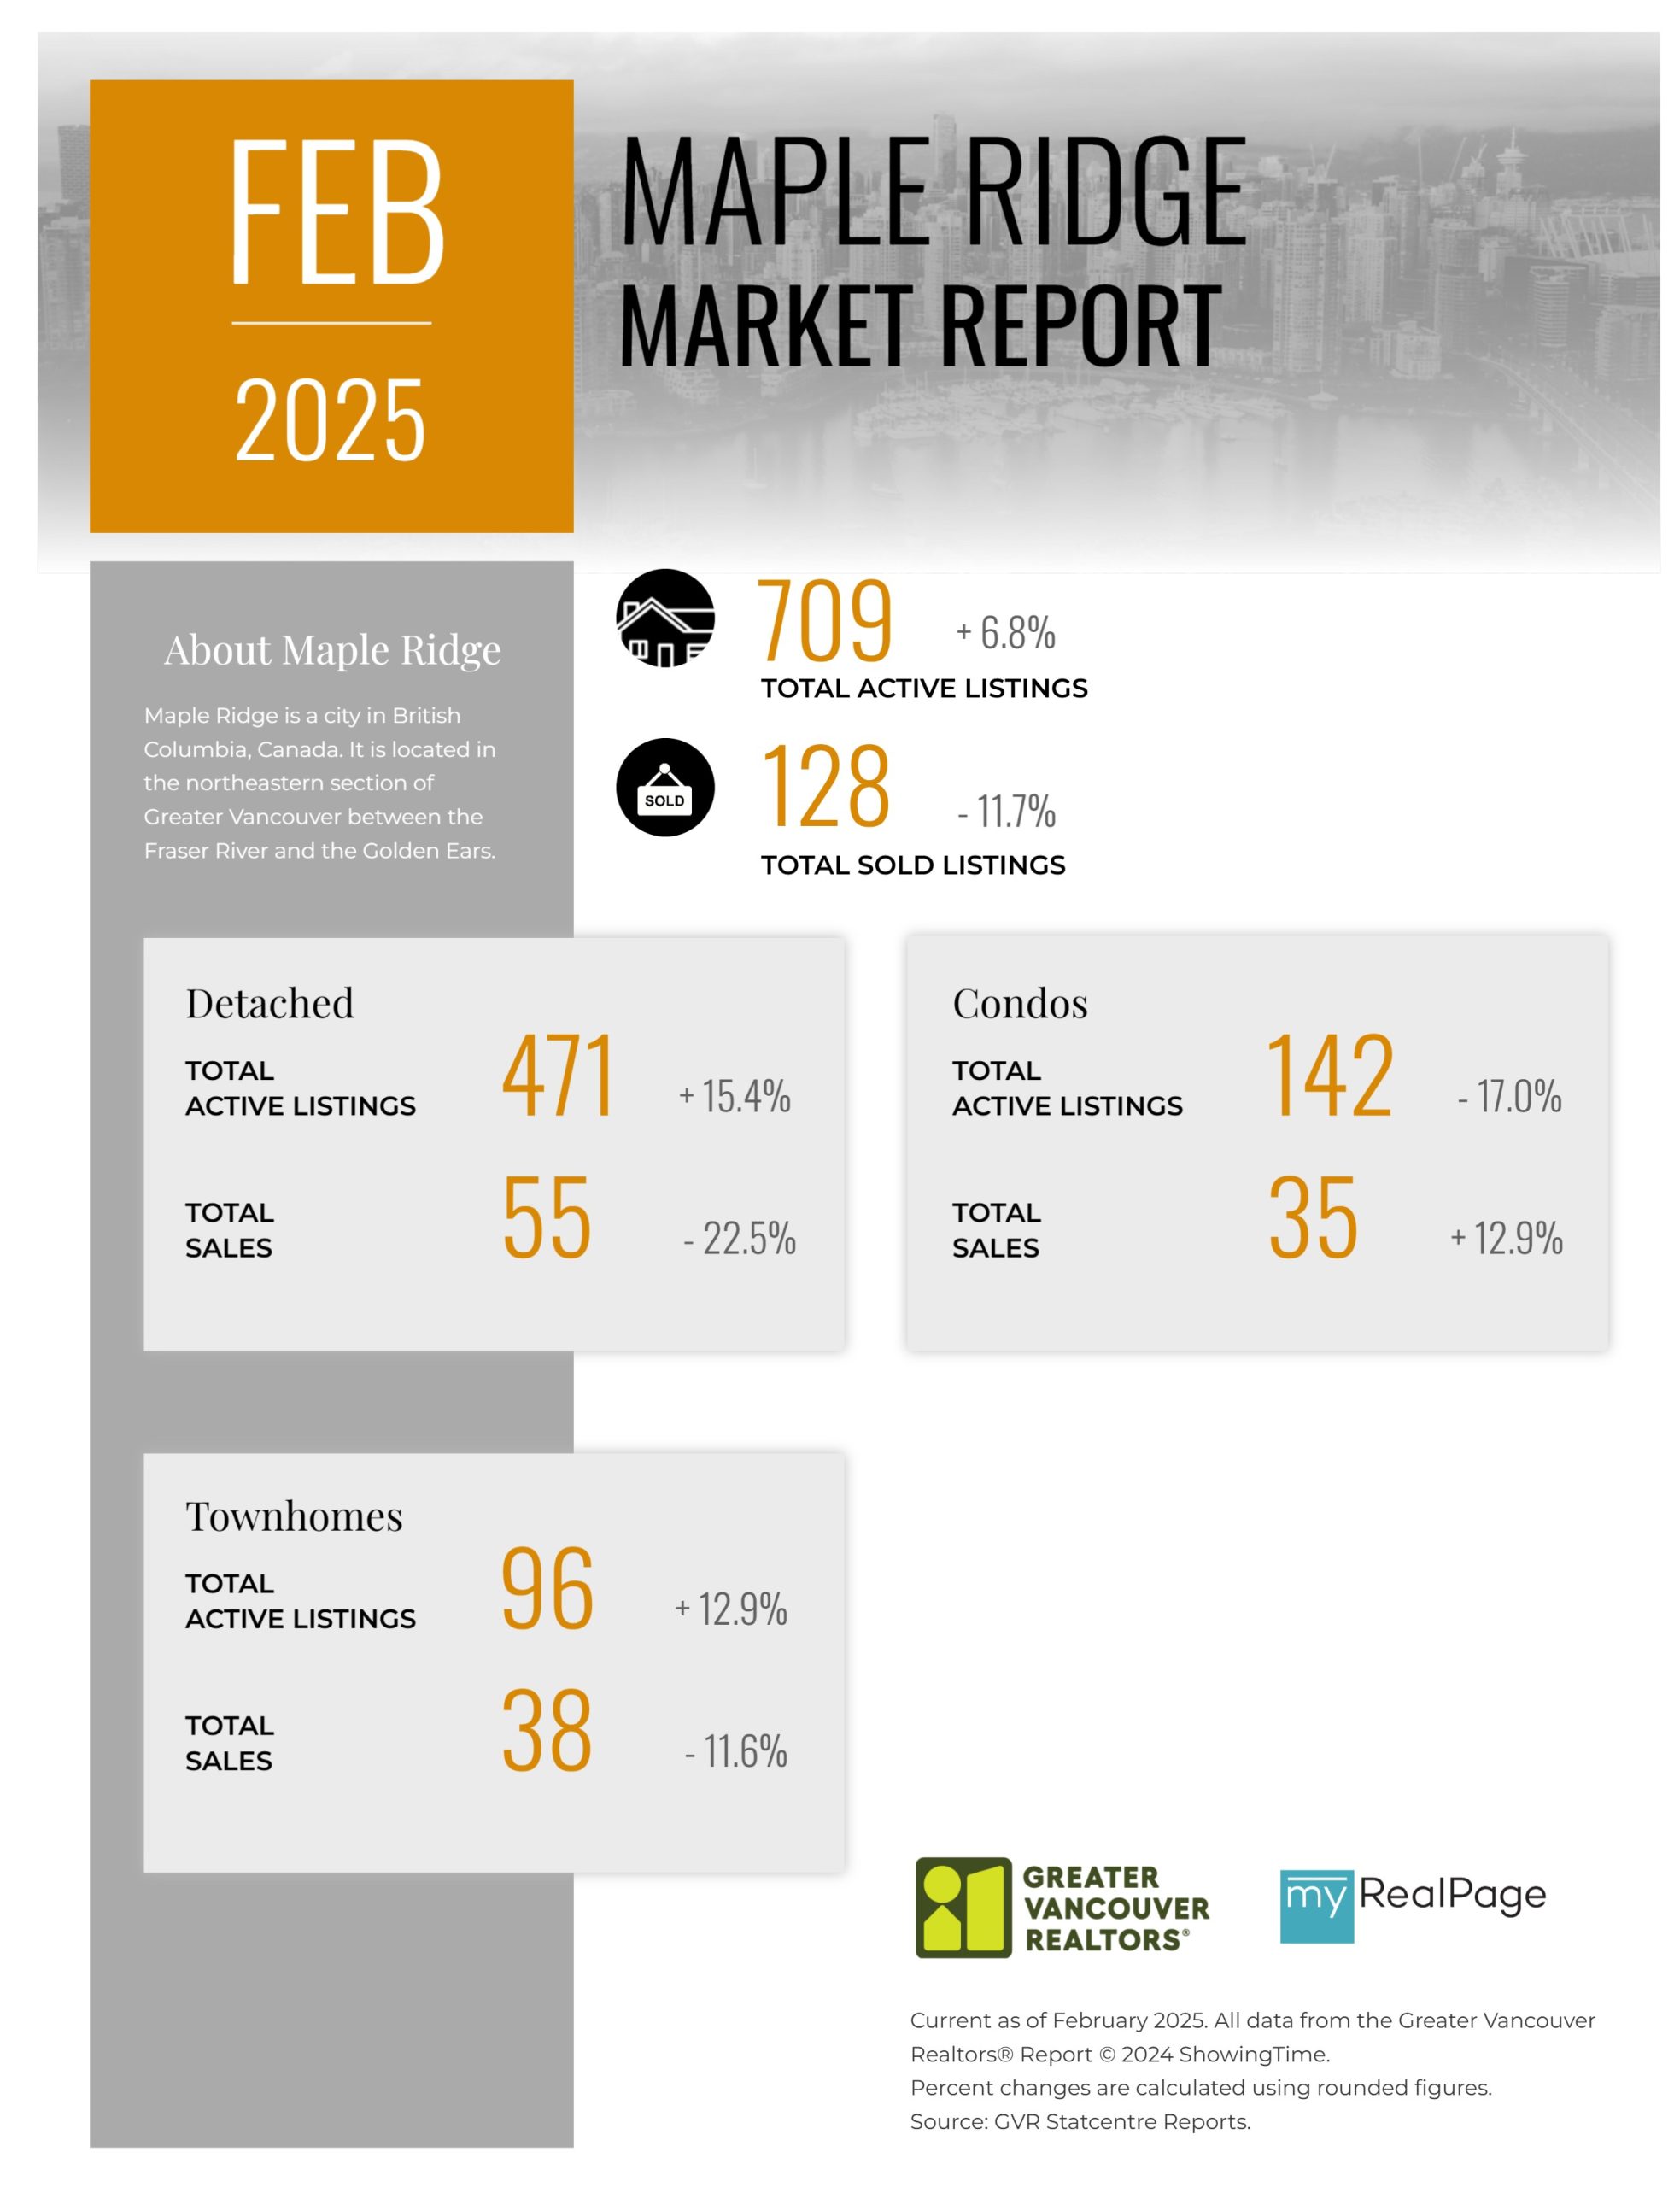
Printable Version – GVR February 2025 Data Infographic Report Maple Ridge
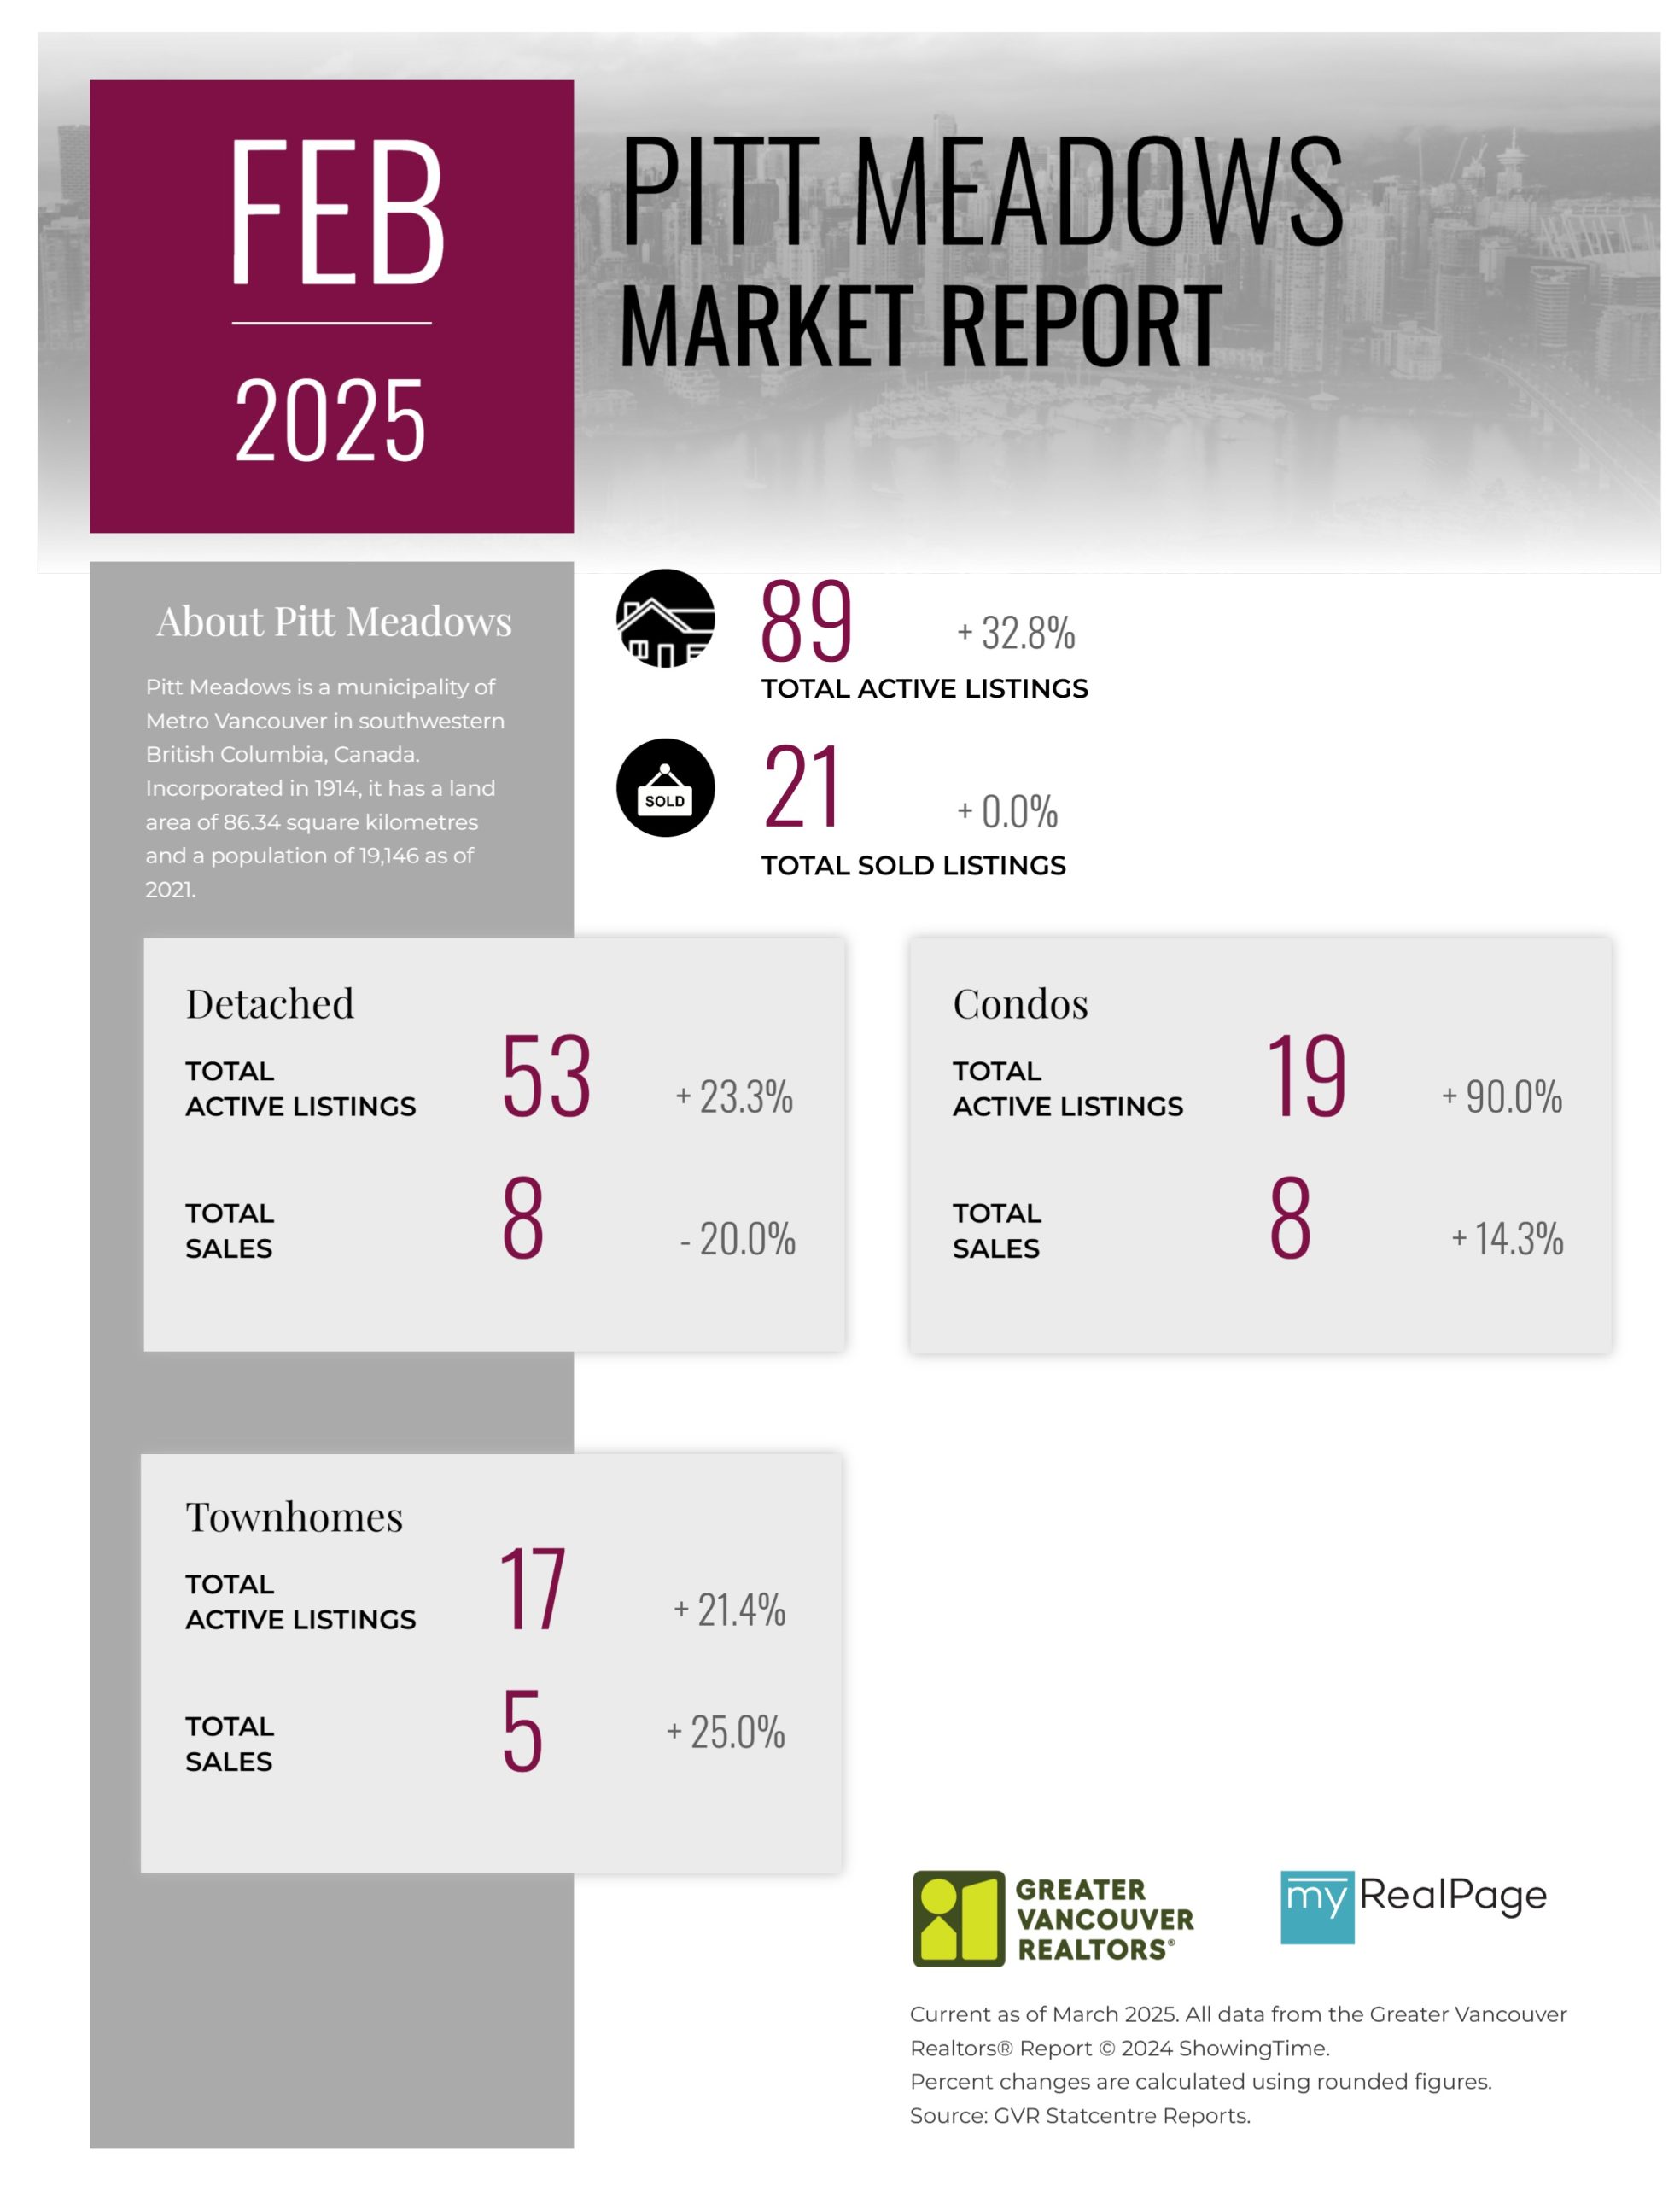
Printable Version – GVR February 2025 Data Infographics Report Pitt Meadows
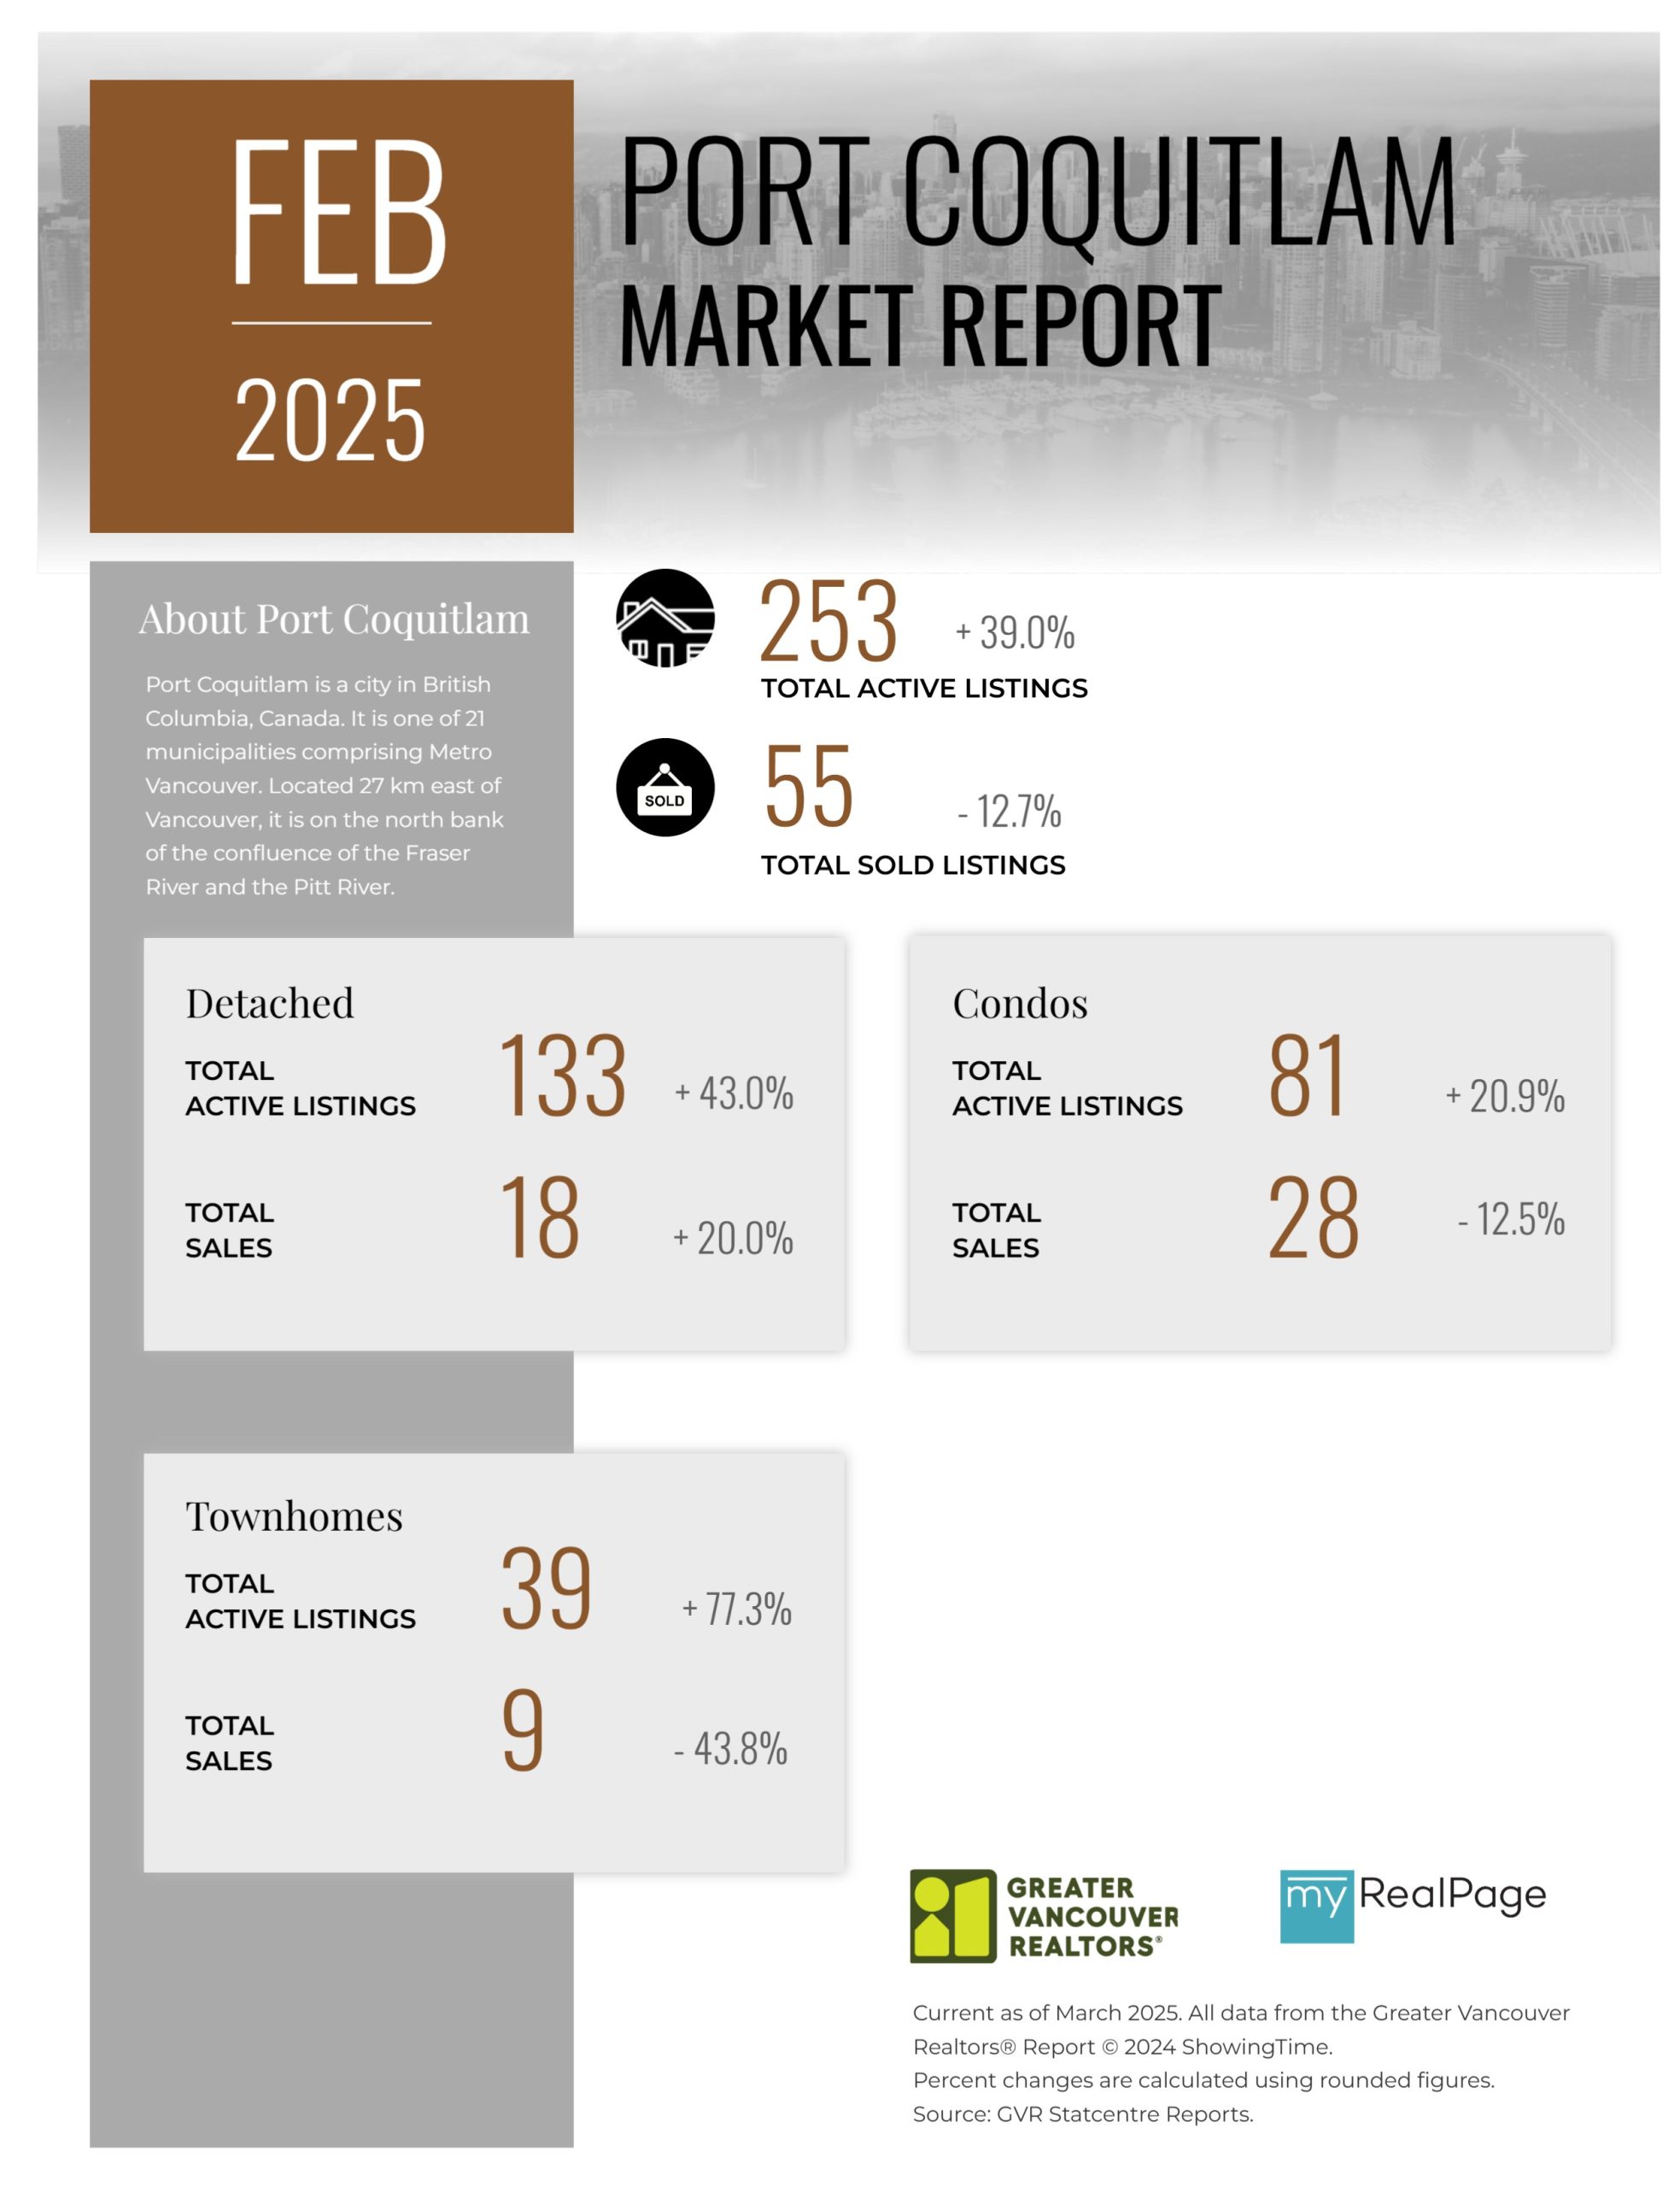
Printable Version – GVR January 2025 Data Infographics Report Port Coquitlam
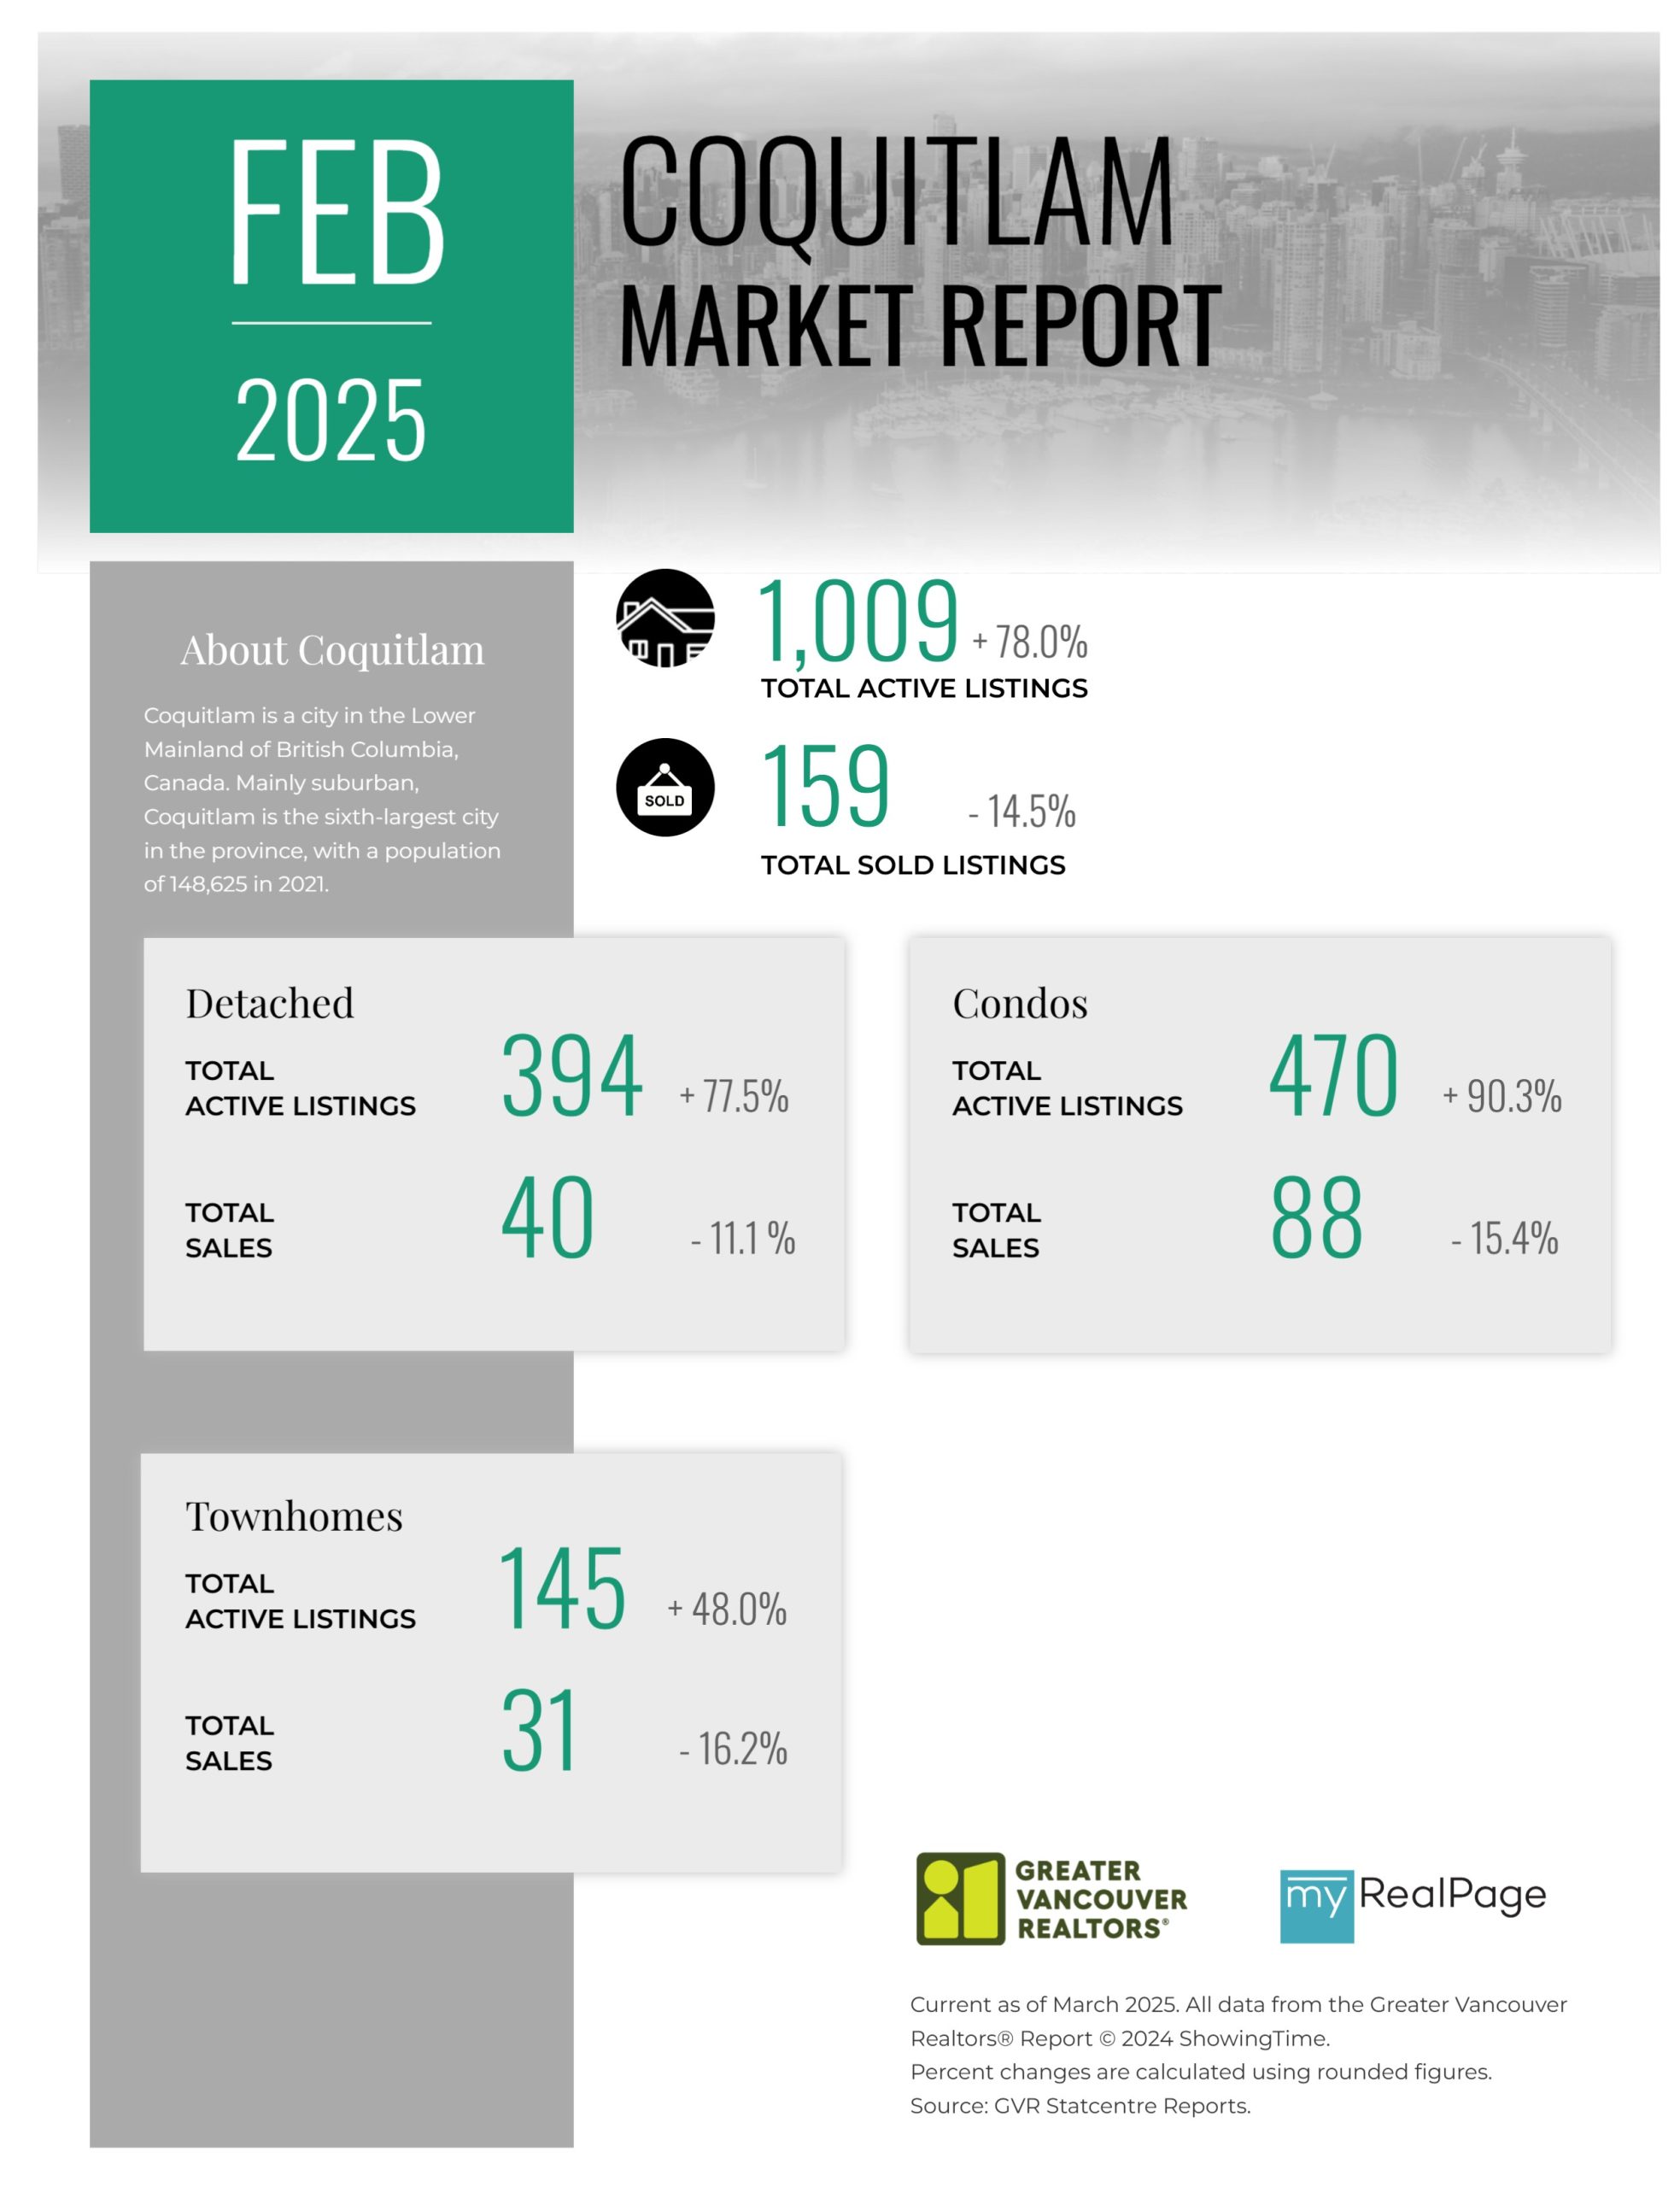
Printable Version – GVR February 2025 Data Infographics Report Coquitlam
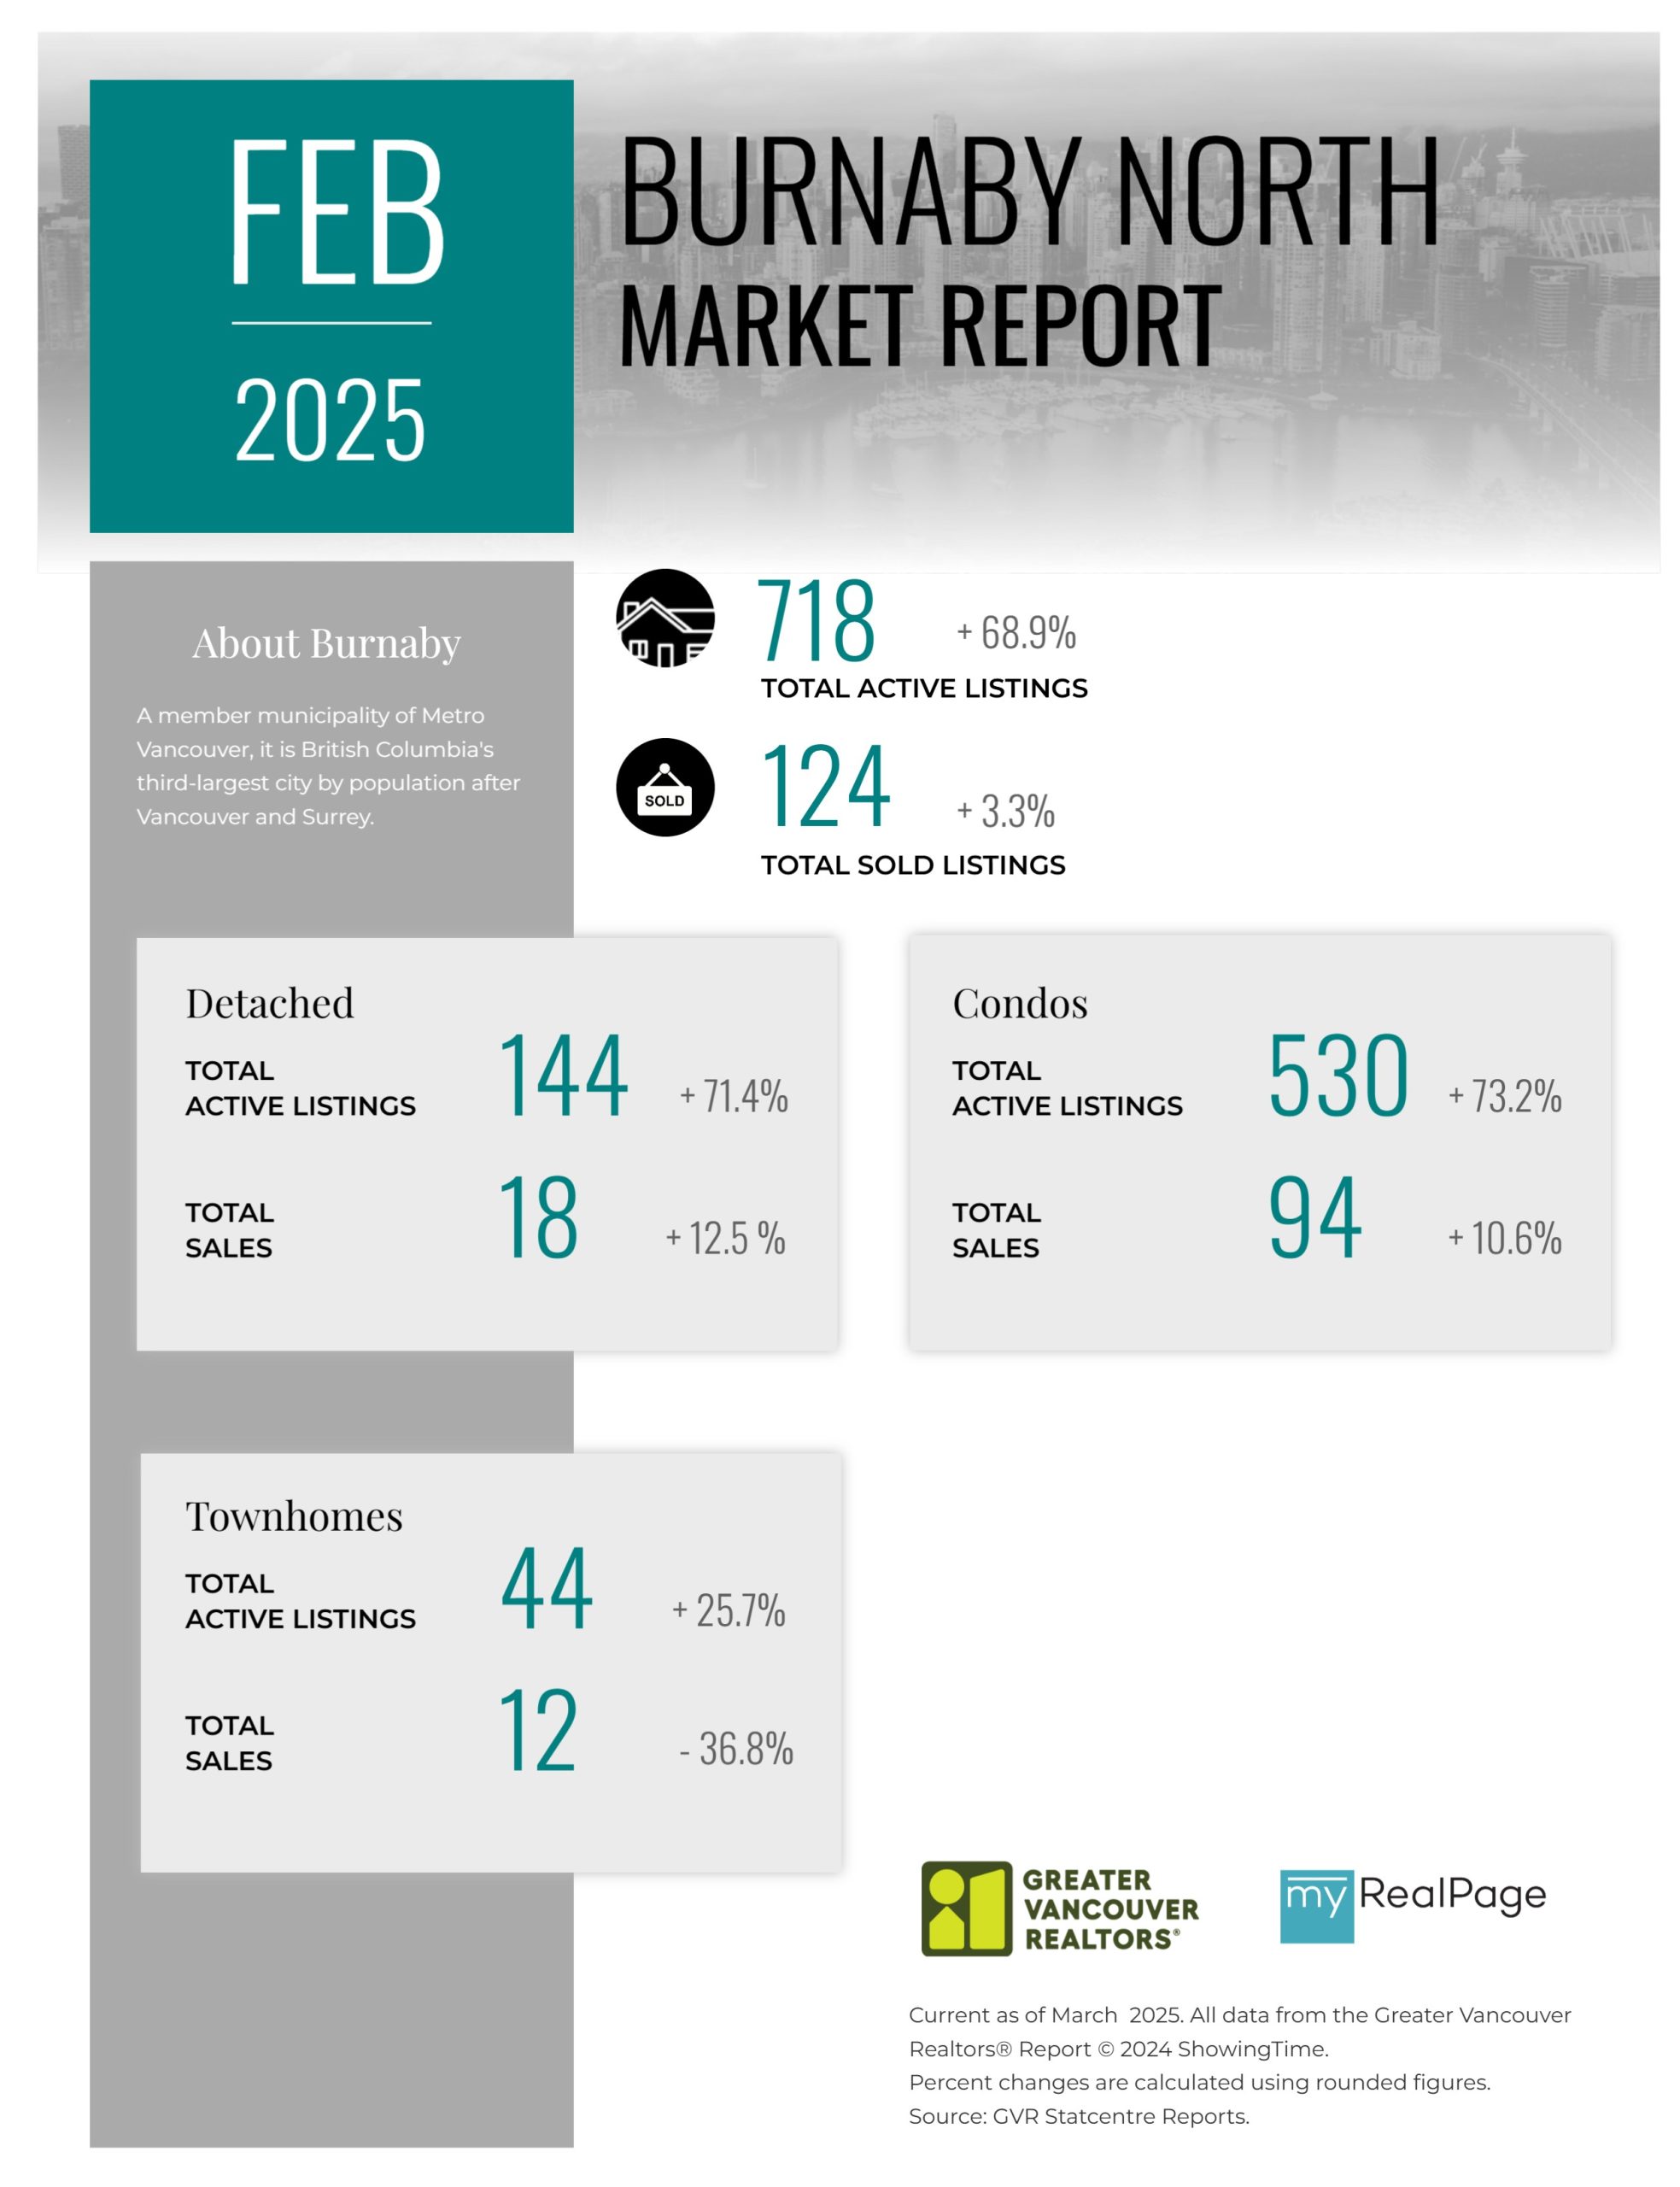
Printable Version – GVR February 2025 Data Infographic Report Burnaby North
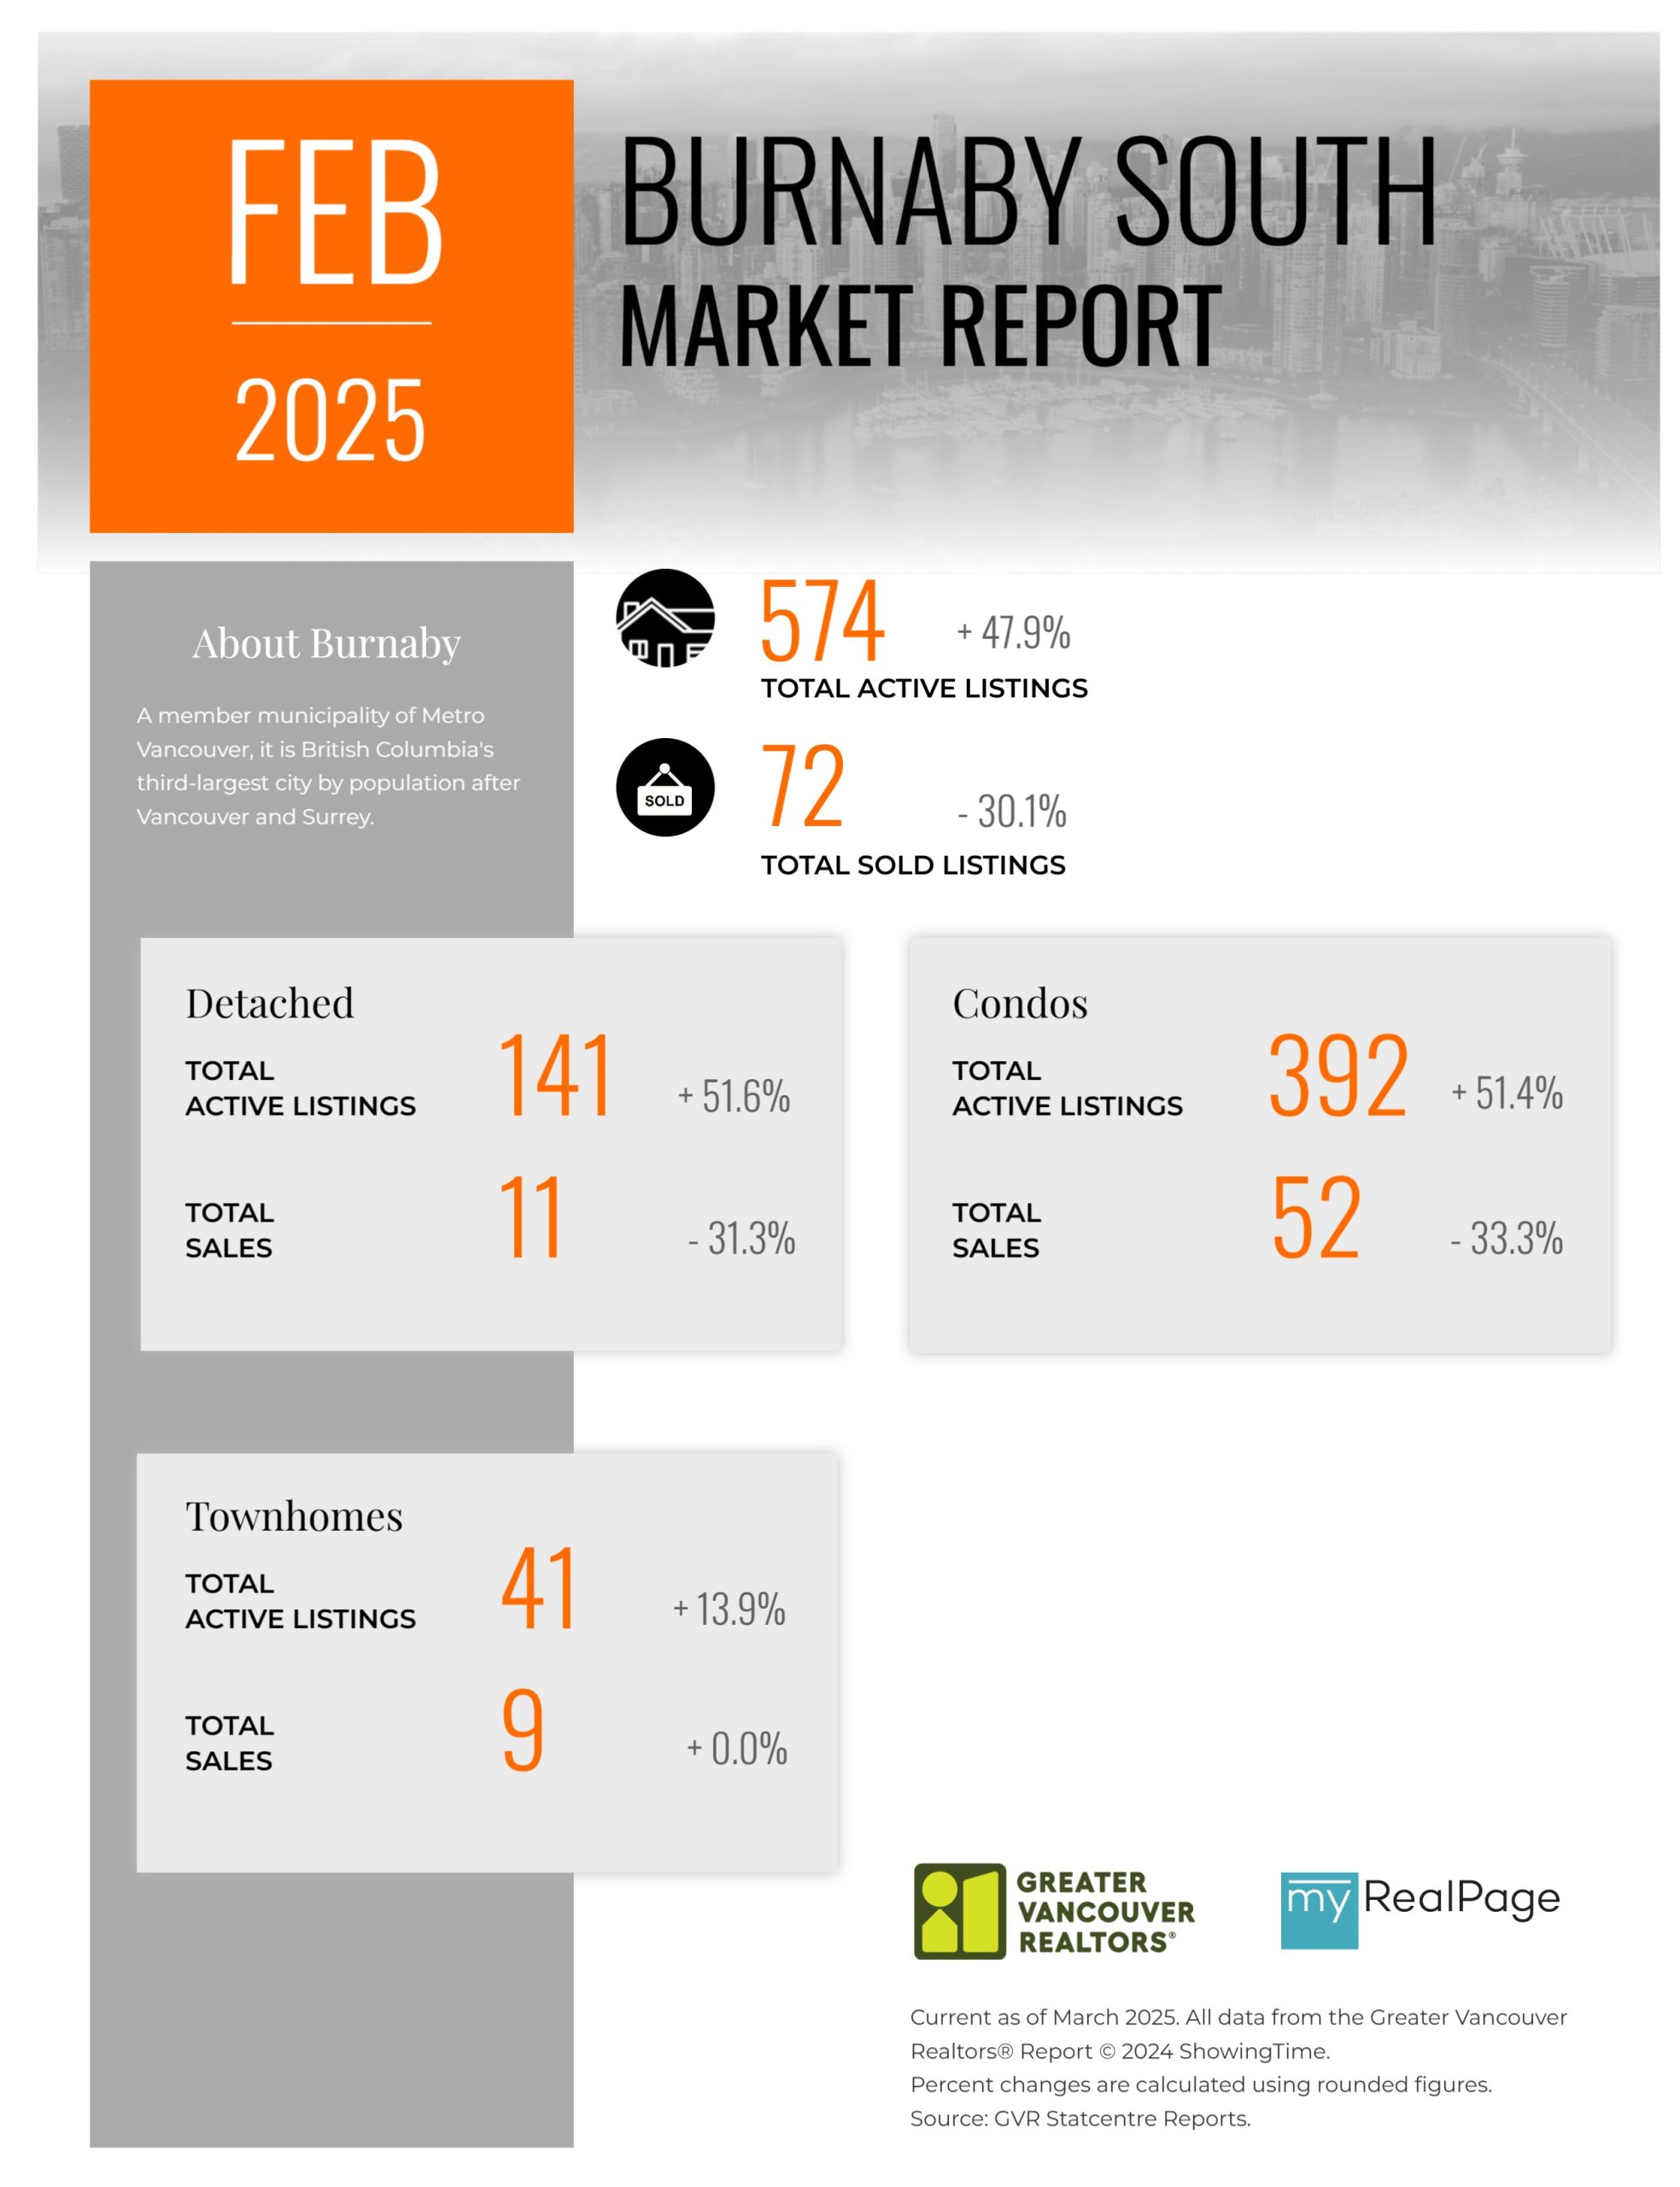
Printable Version – GVR February 2025 Data Infographics Report Burnaby South
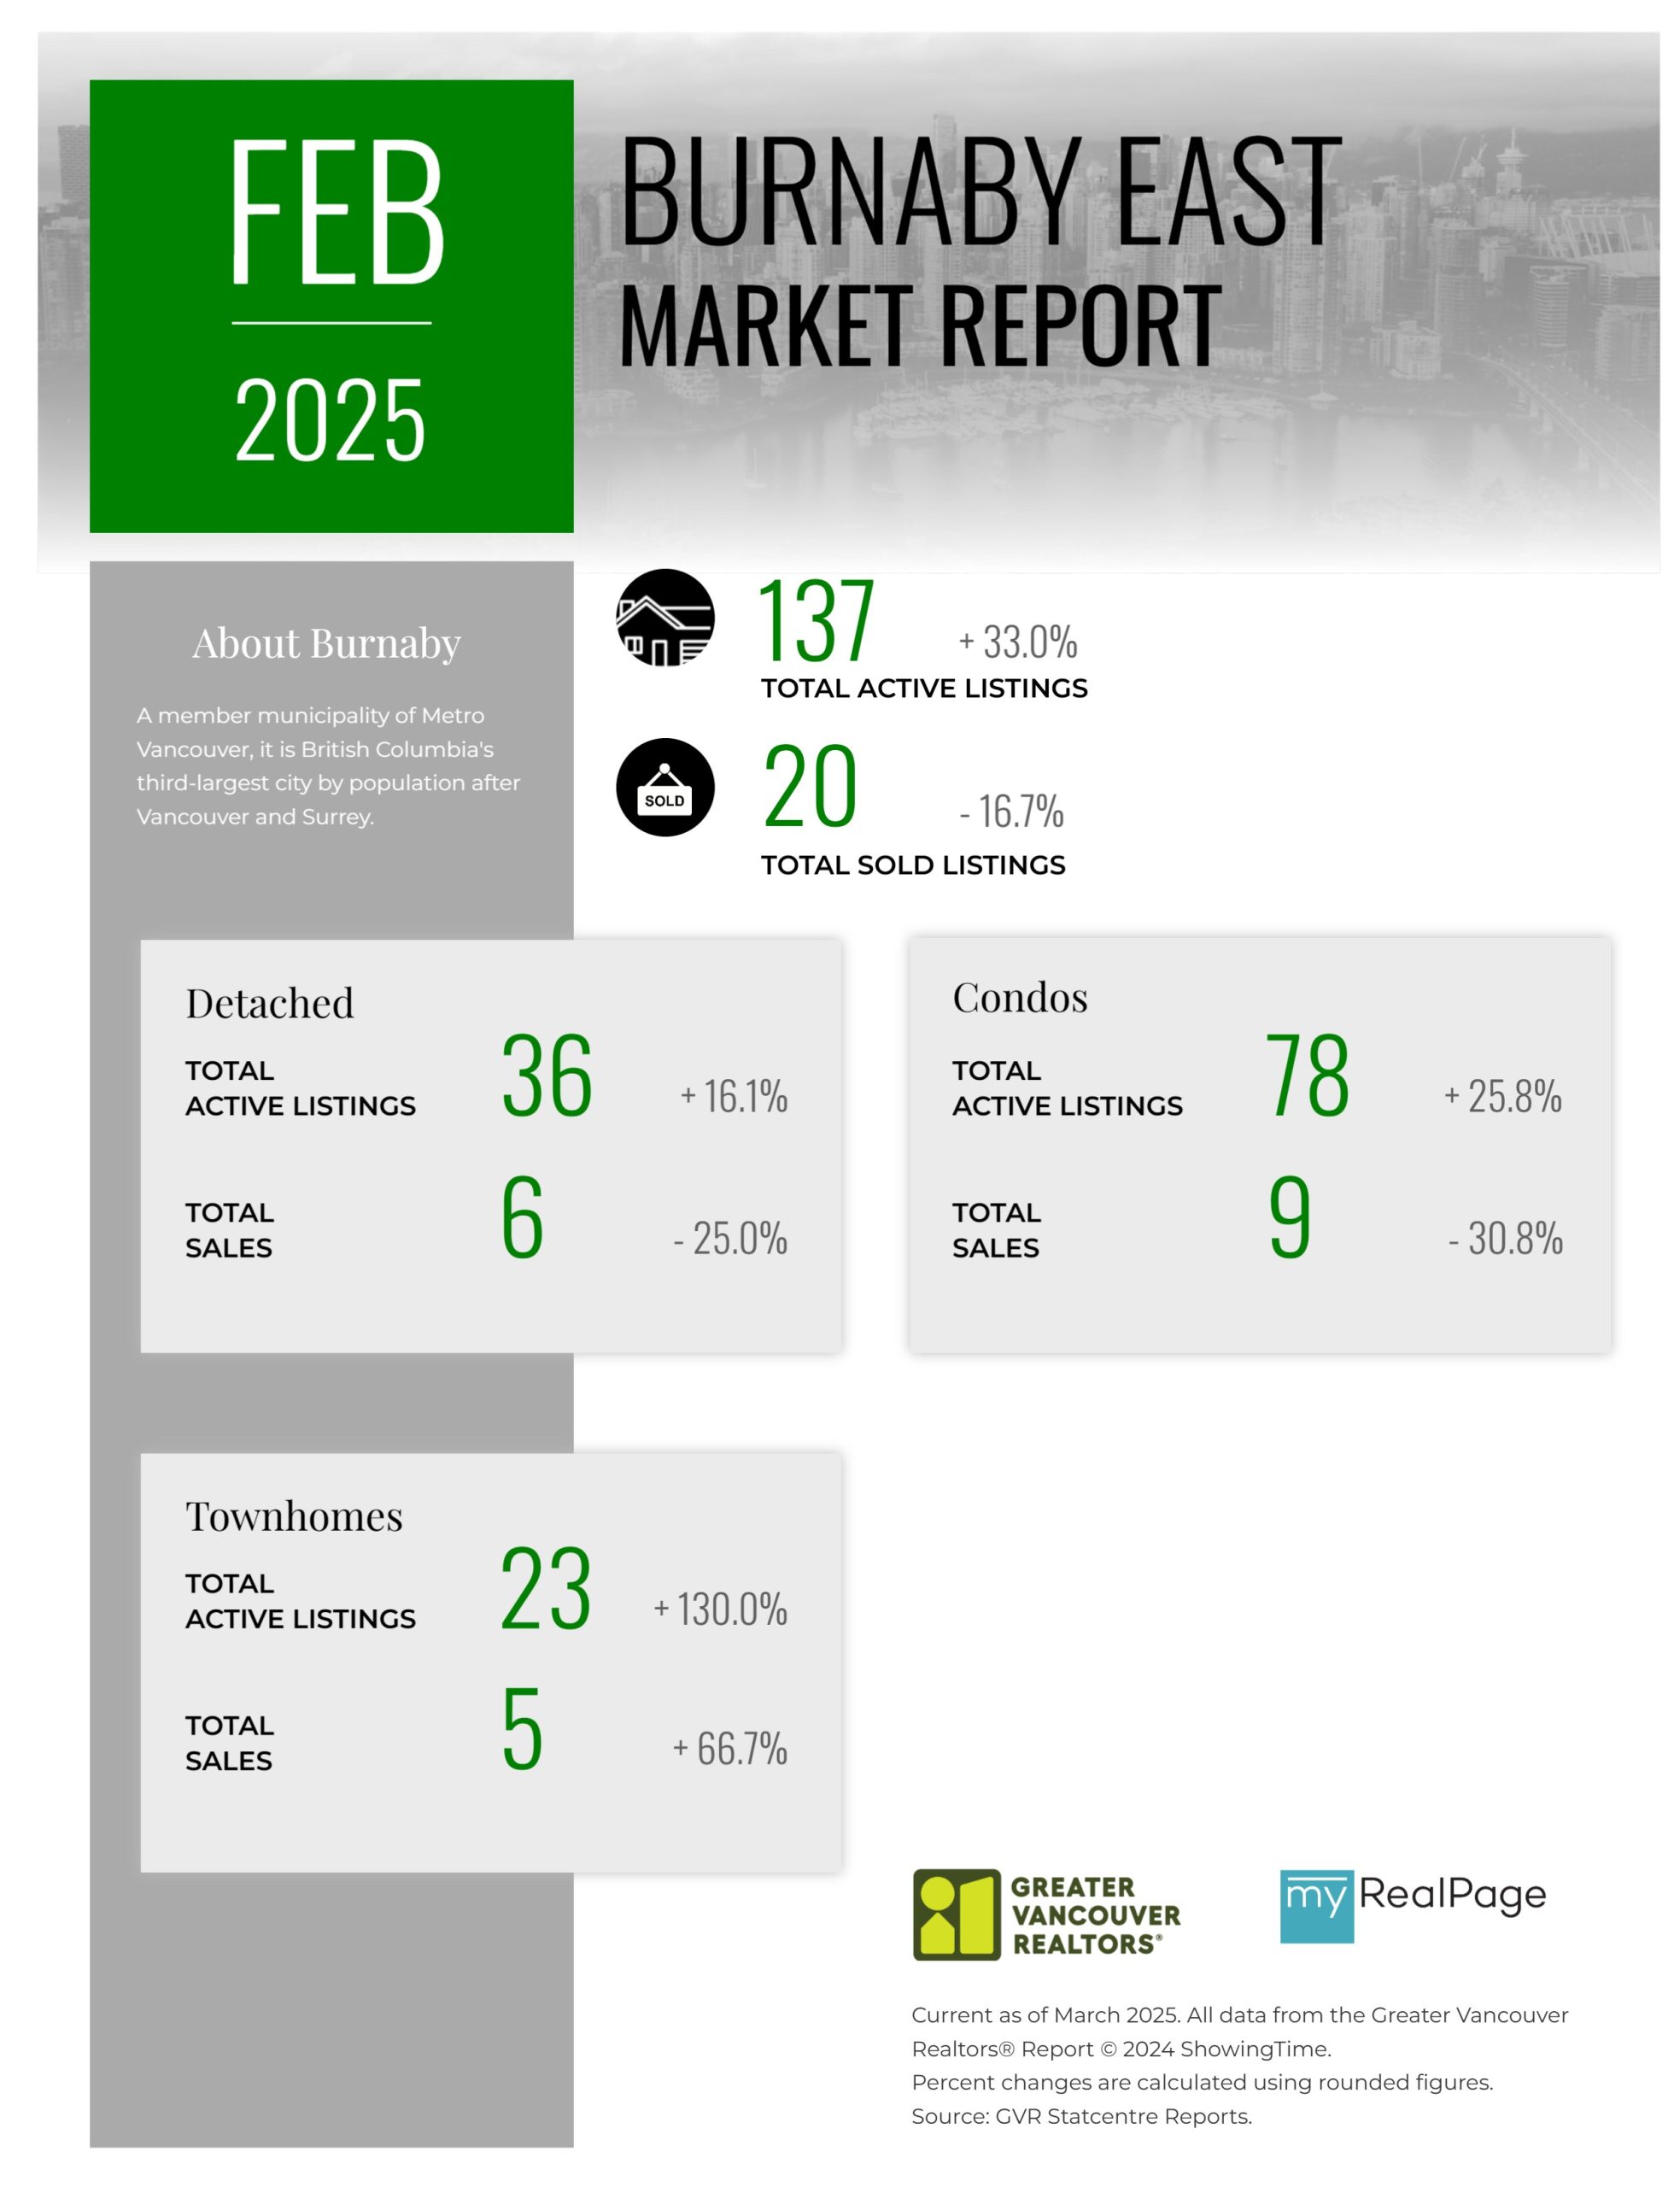
Printable Version – GVR February 2025 Data Infographics Report Burnaby East
Printable Version – GVR February 2025 Data Infographics Report New Westminster
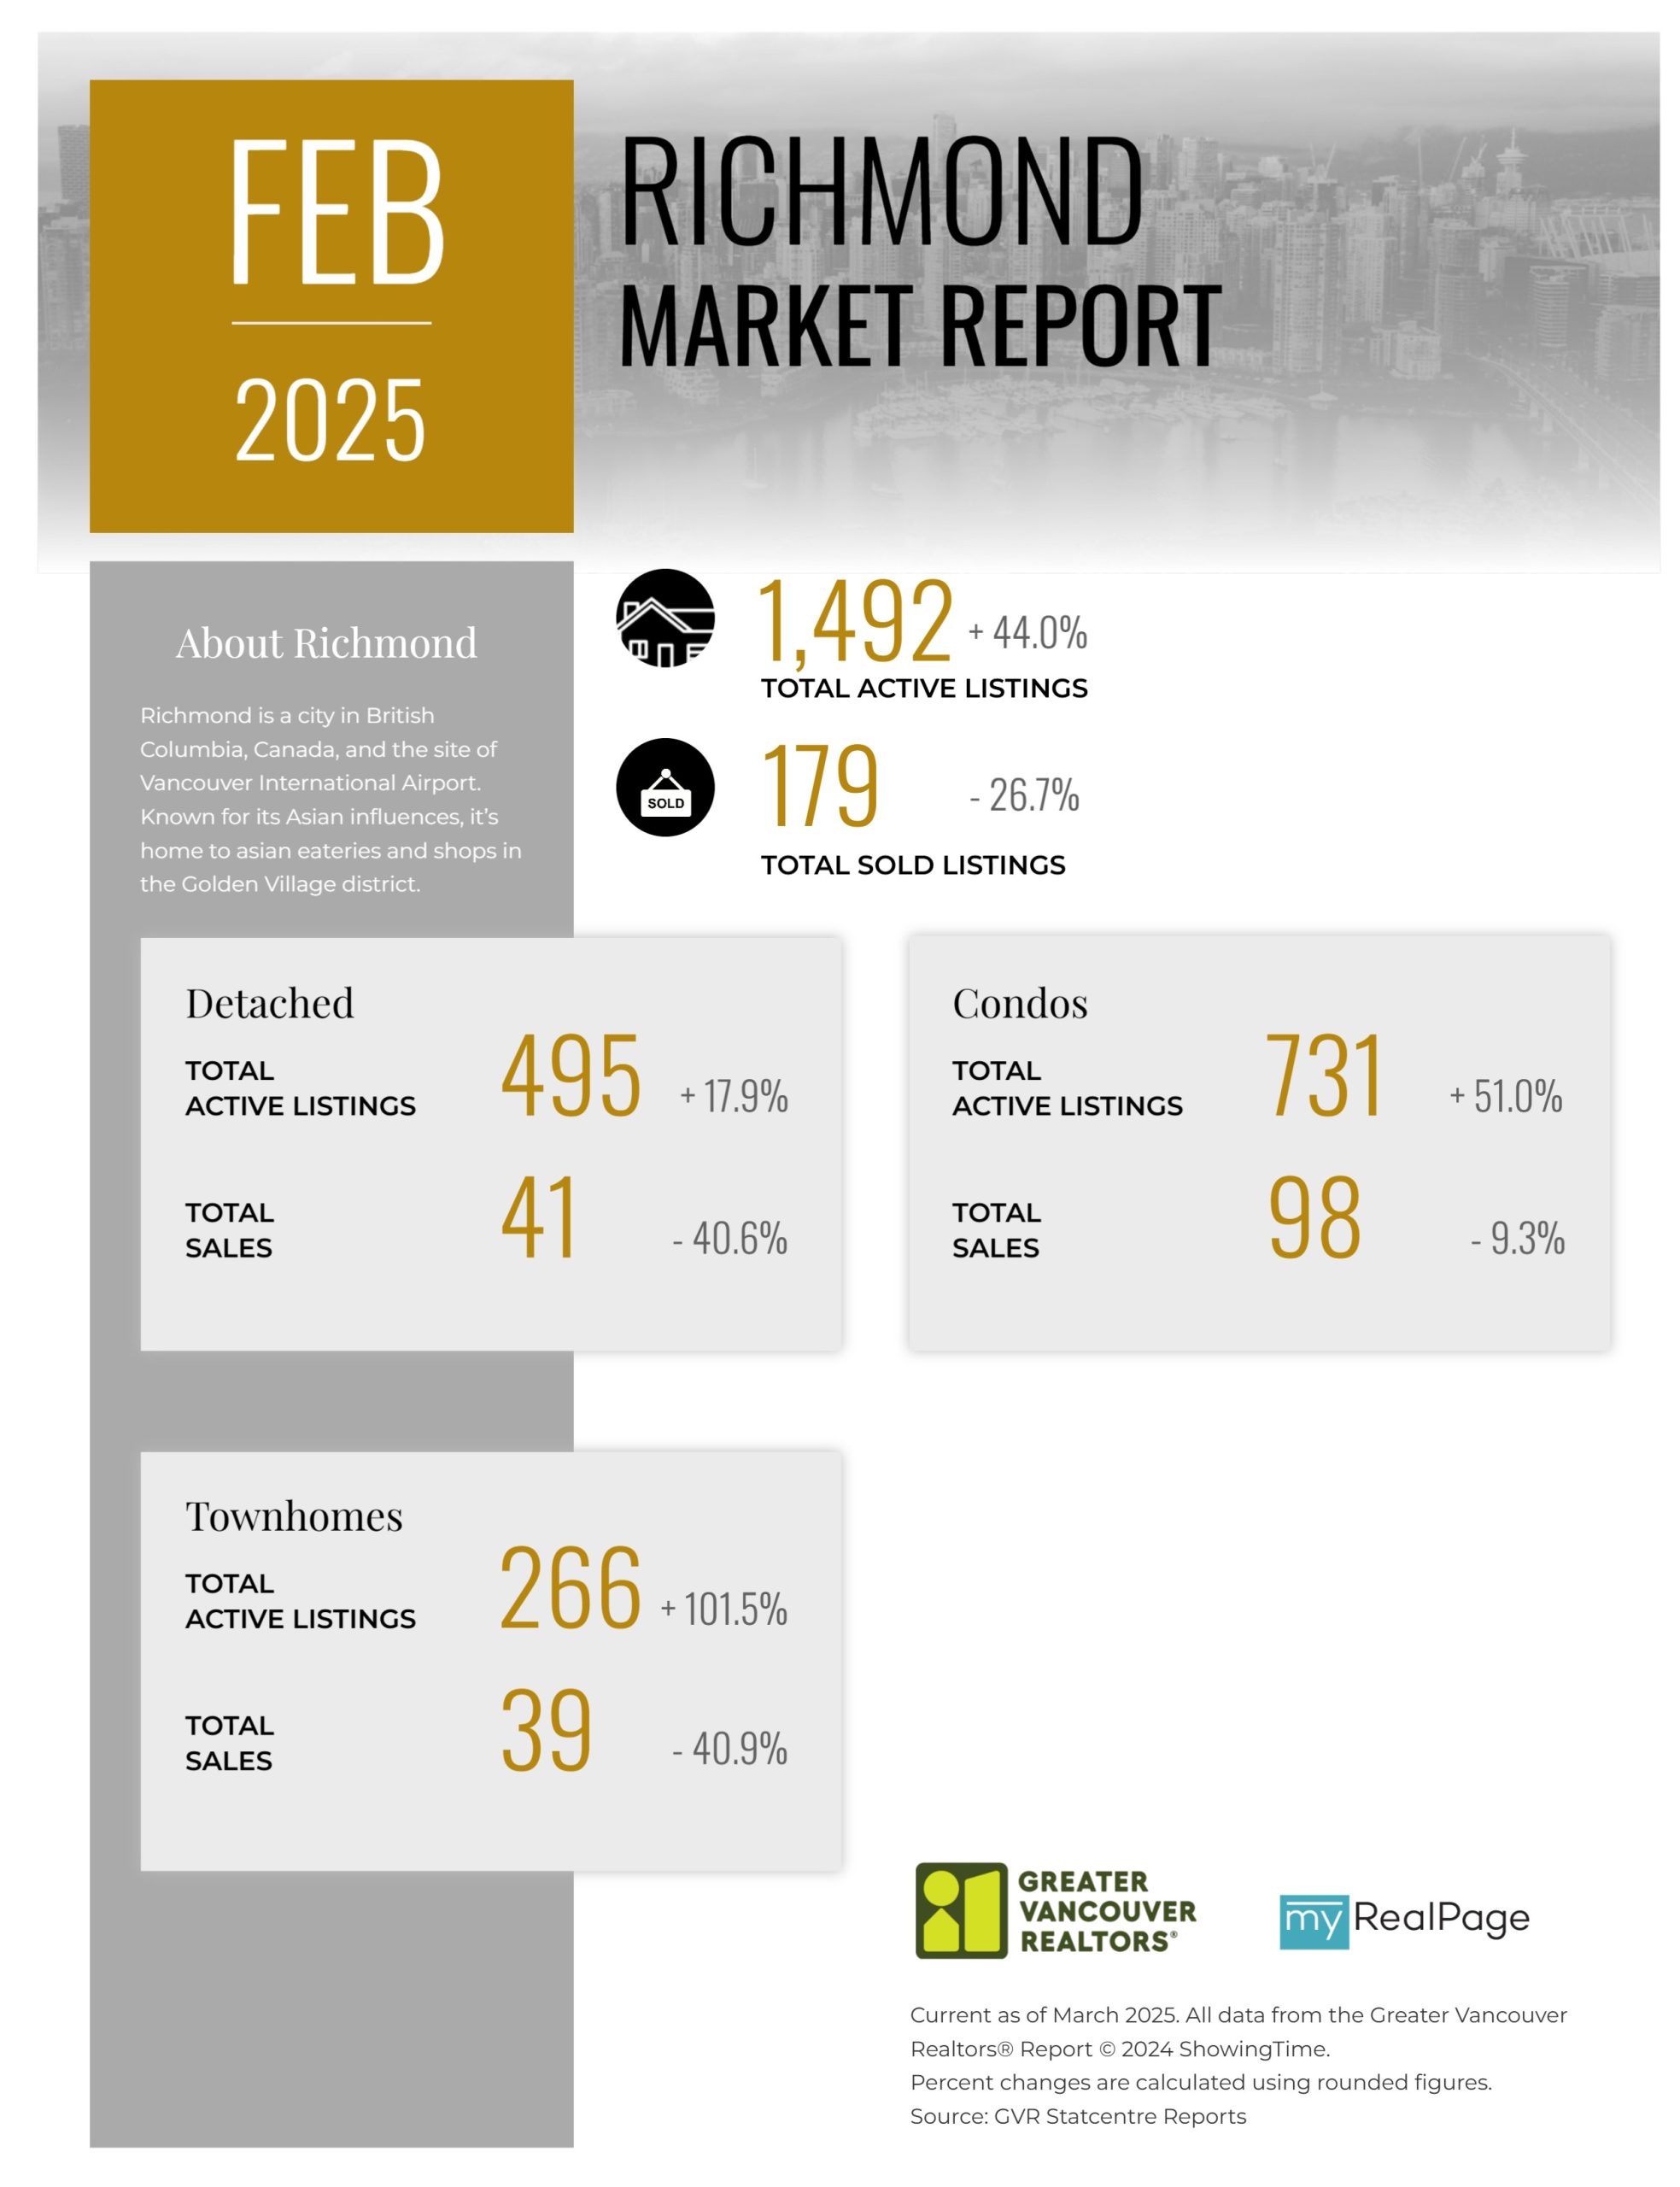
Printable Version – GVR February 2025 Data Infographics Report Richmond
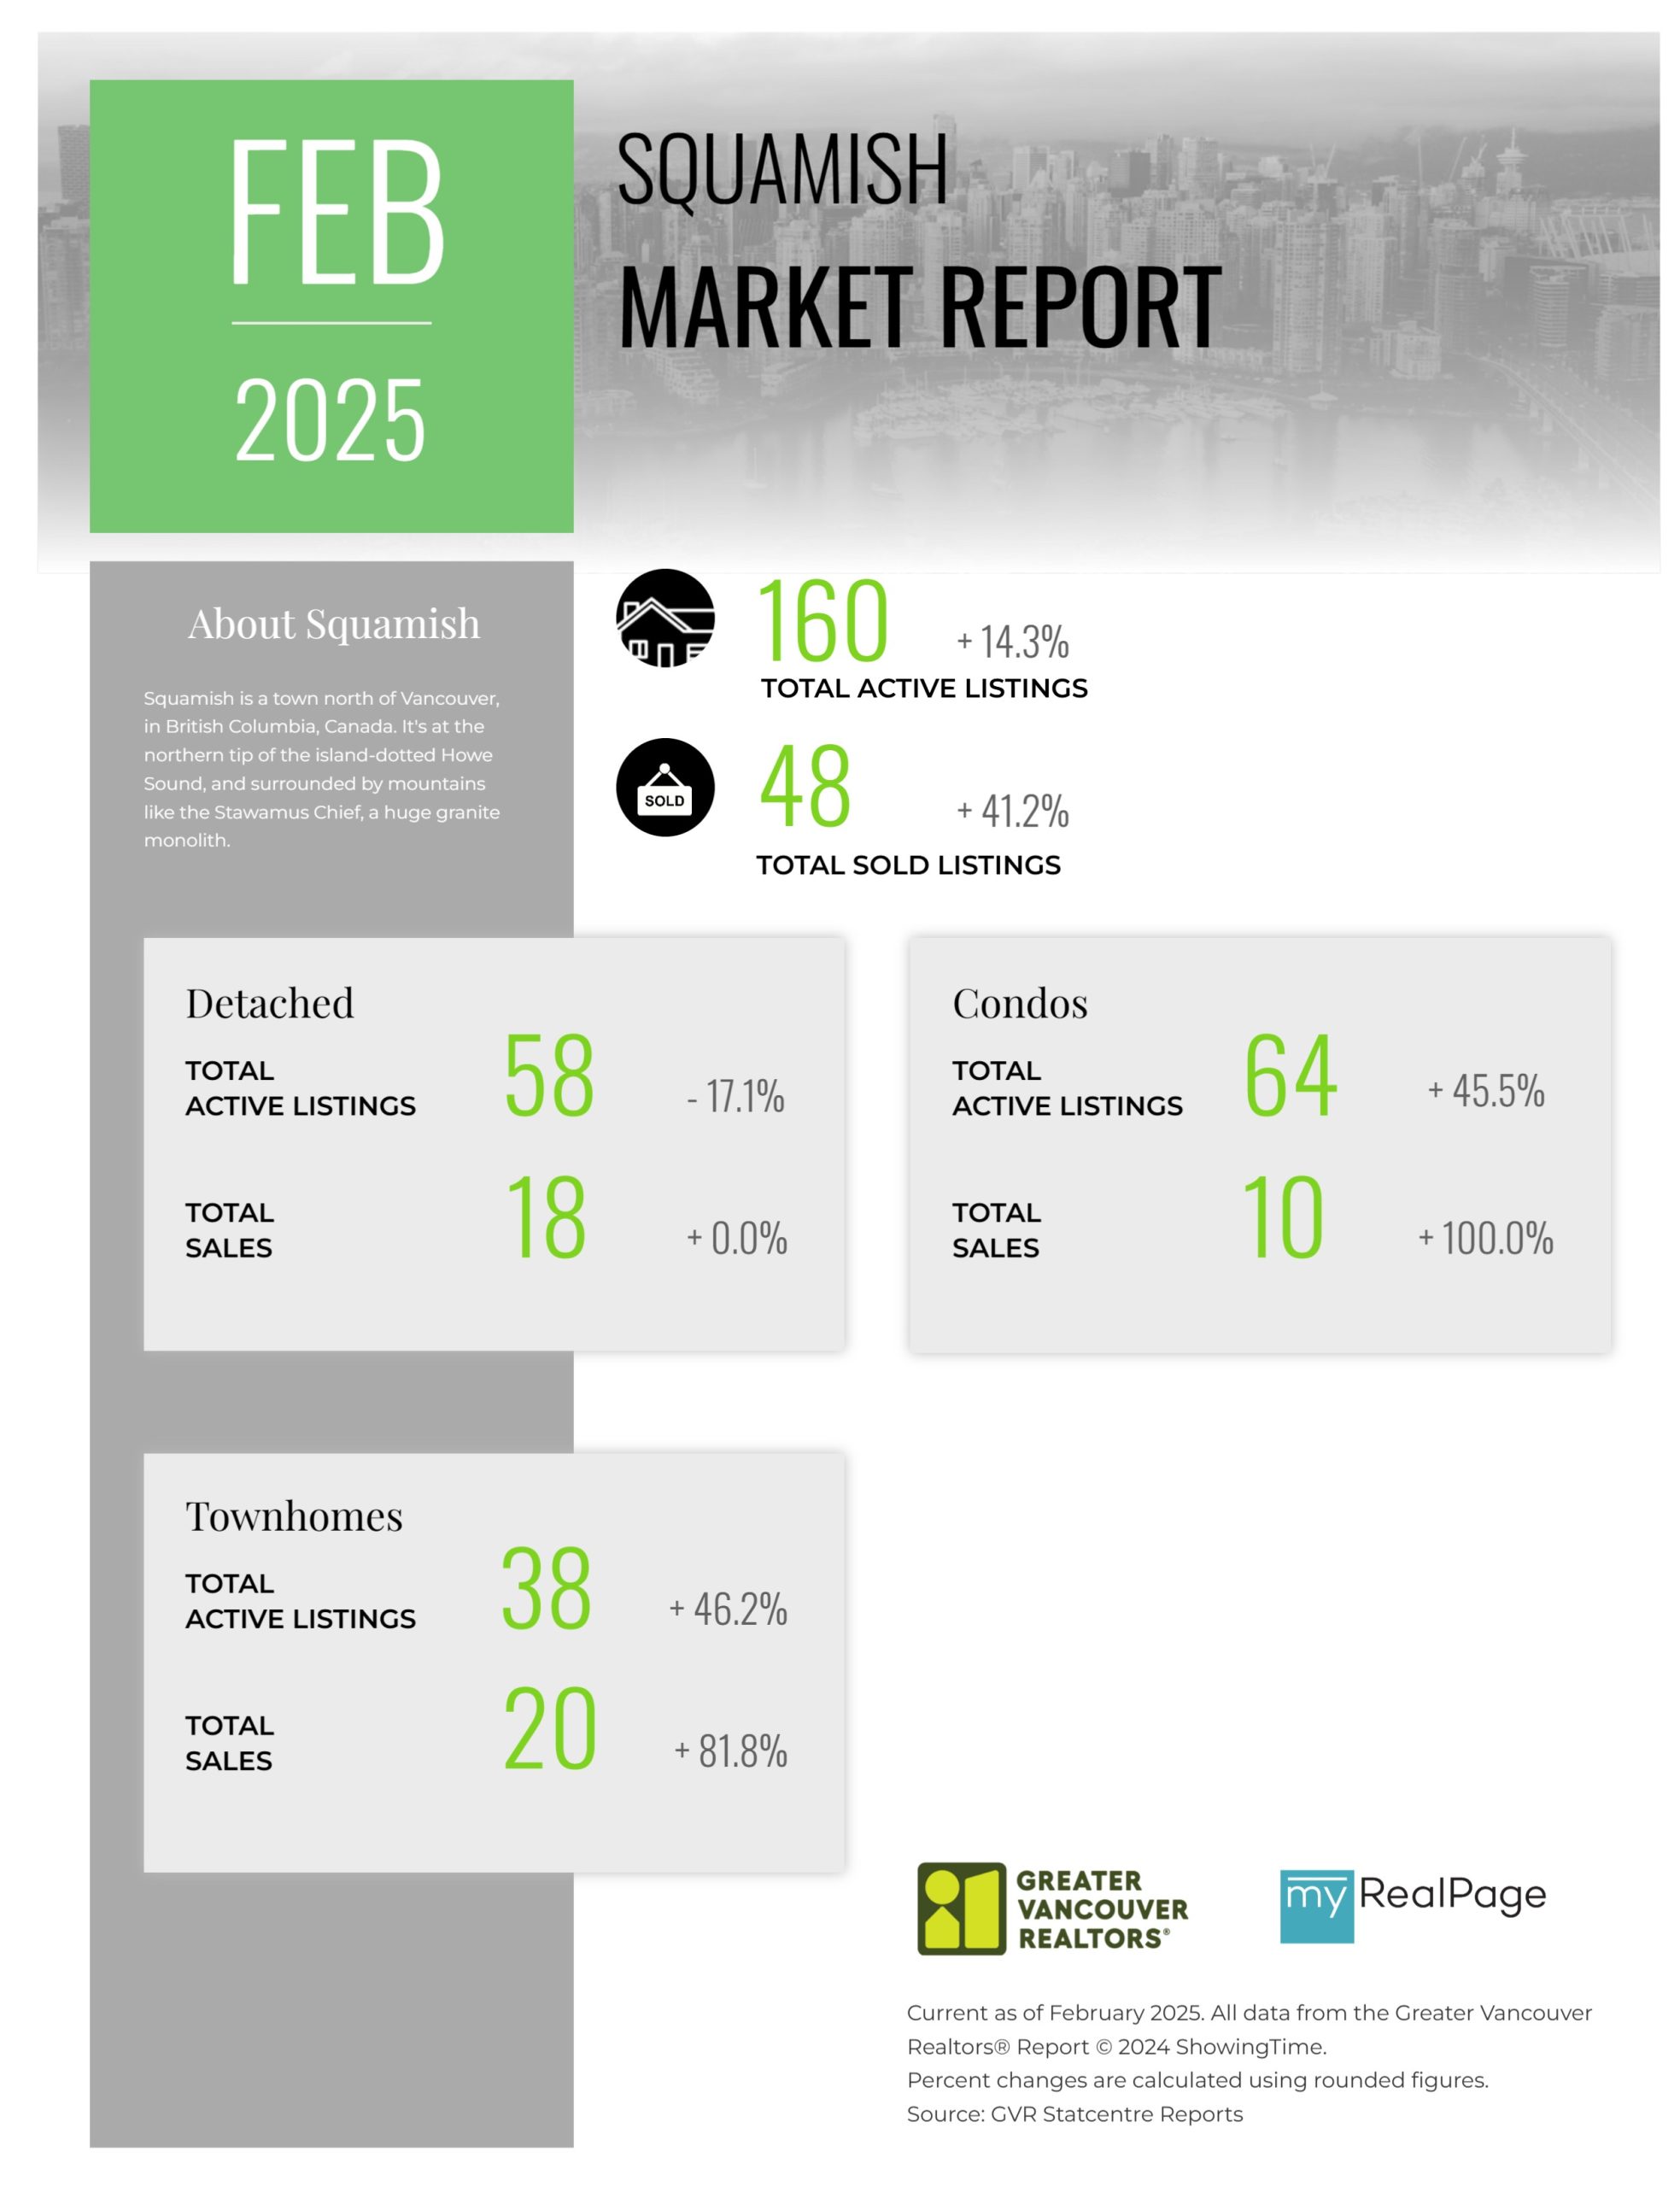
Printable Version – GVR February 2025 Data Infographics Report Squamish

Last Updated on March 10, 2025 by myRealPage
