INFOGRAPHICS: January 2025 GVR Greater Vancouver Market Reports

Home sellers off to an active start in 2025
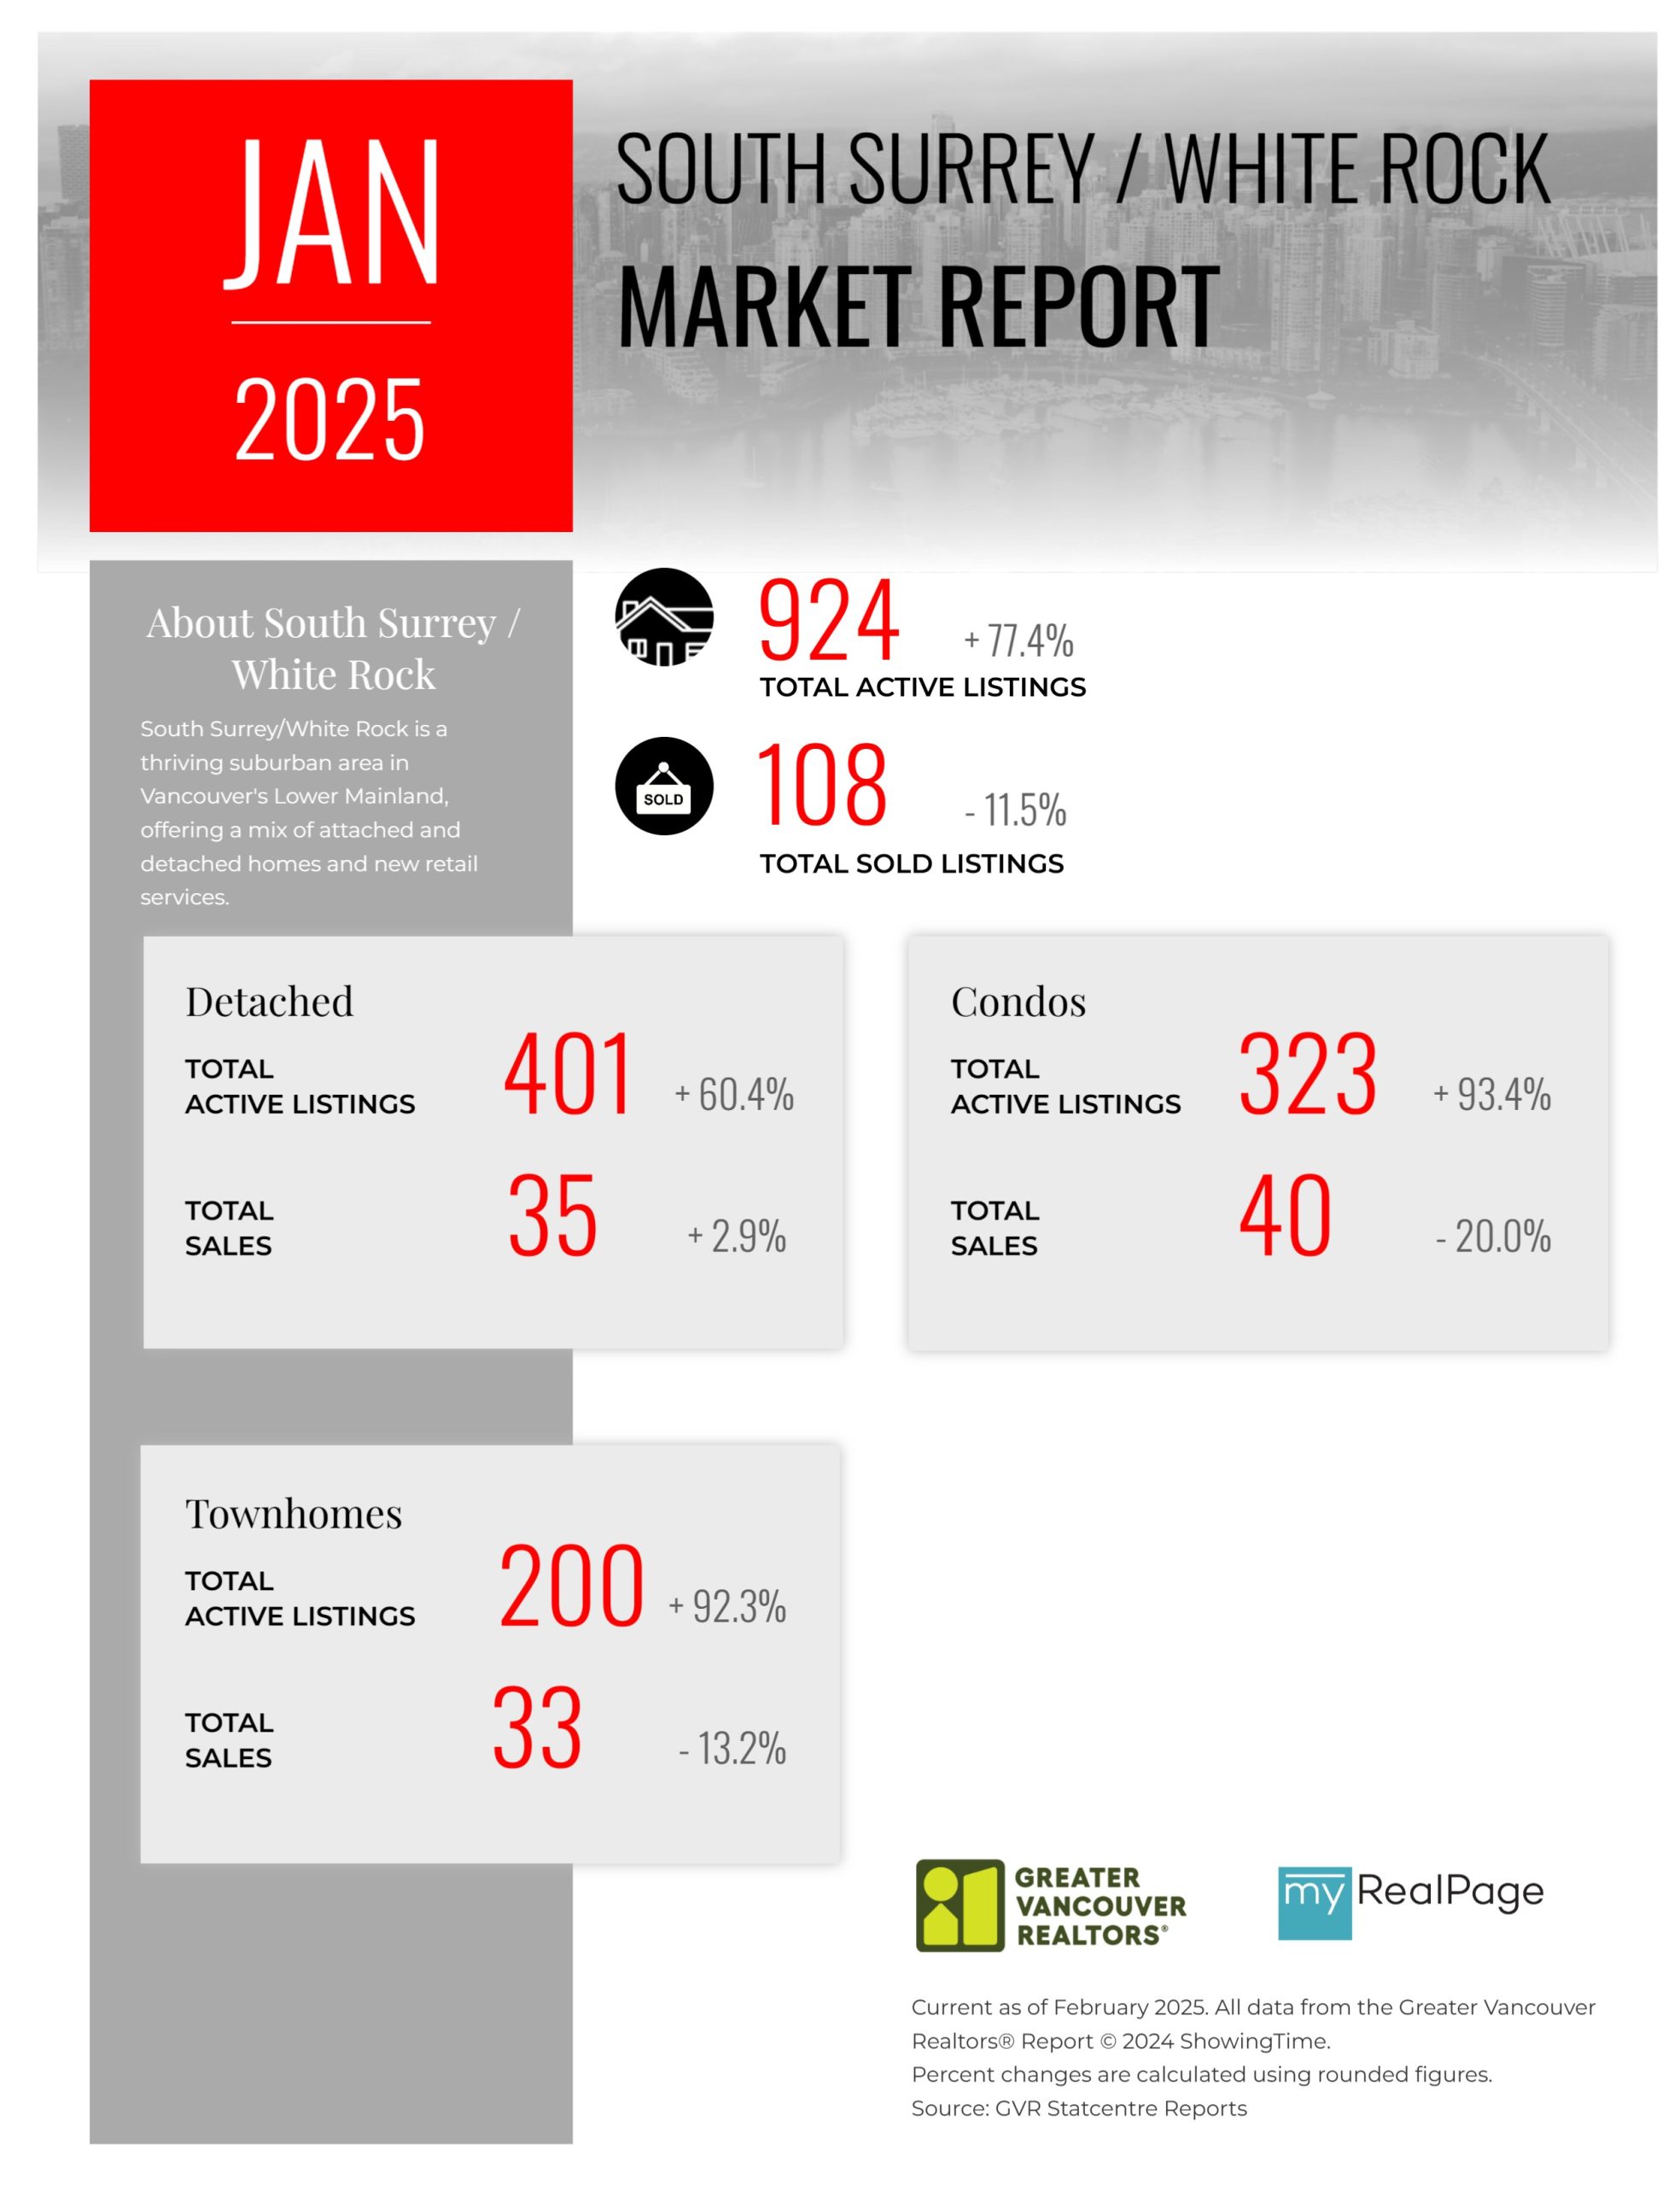
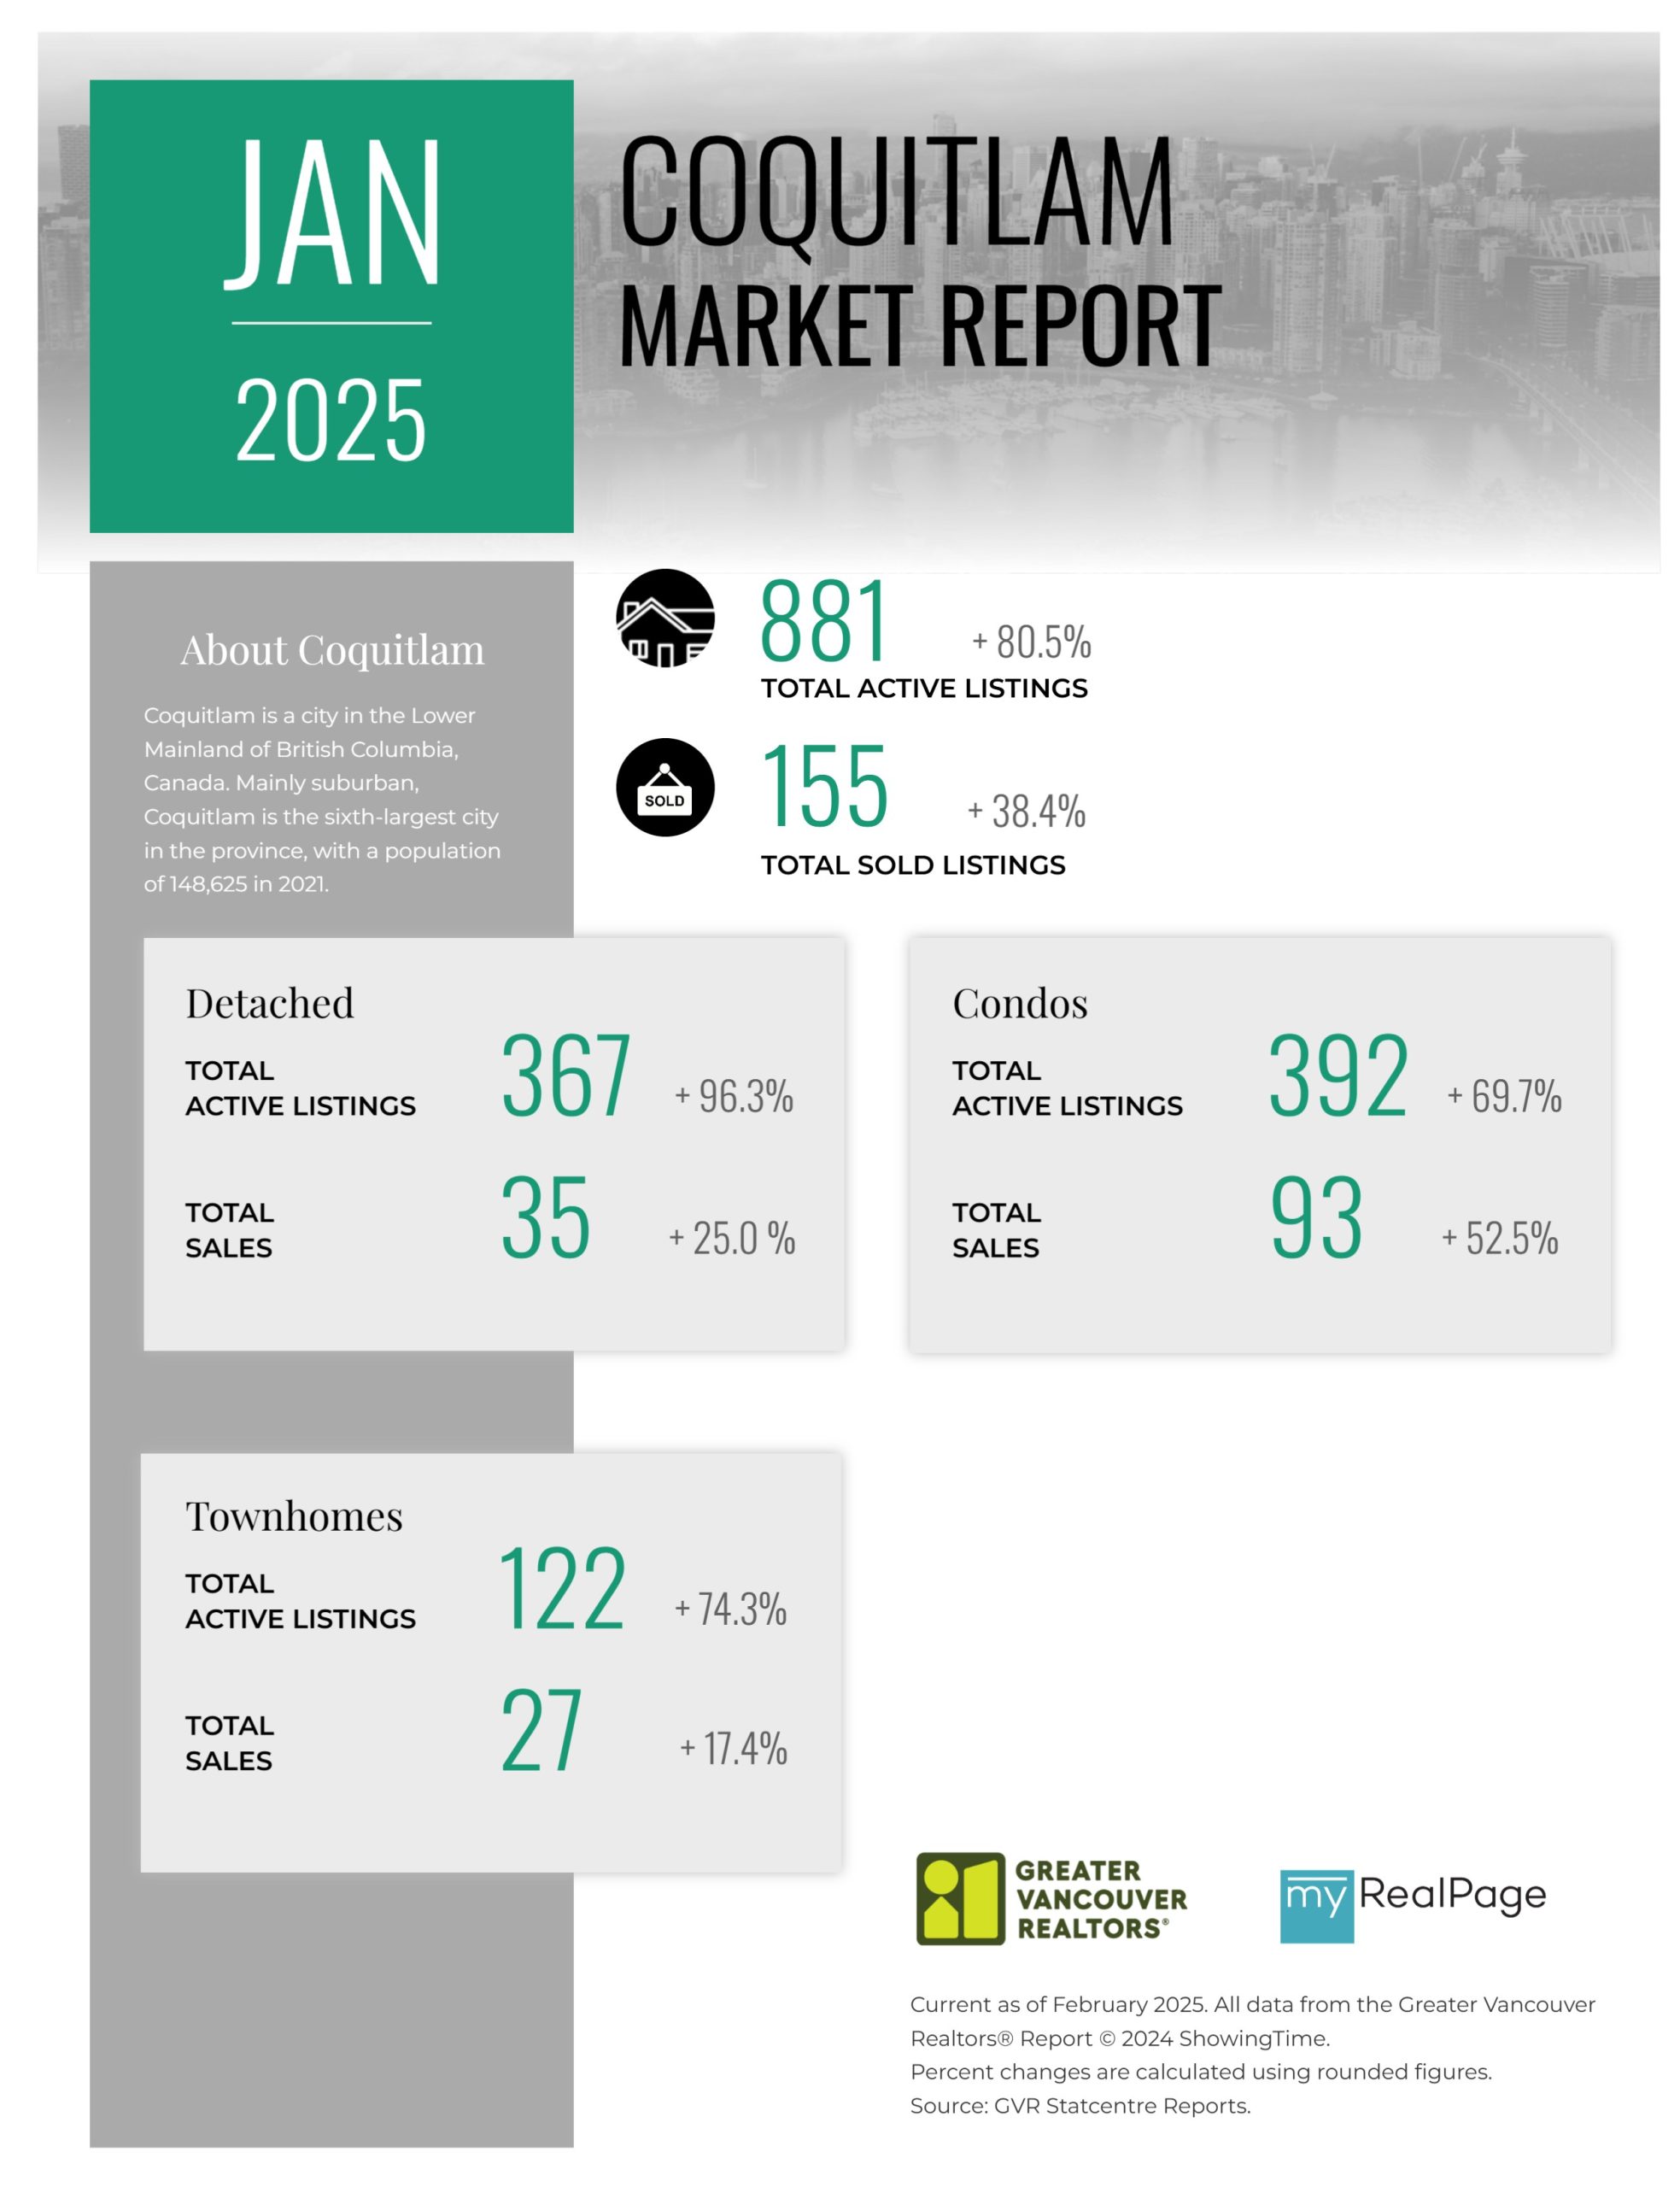
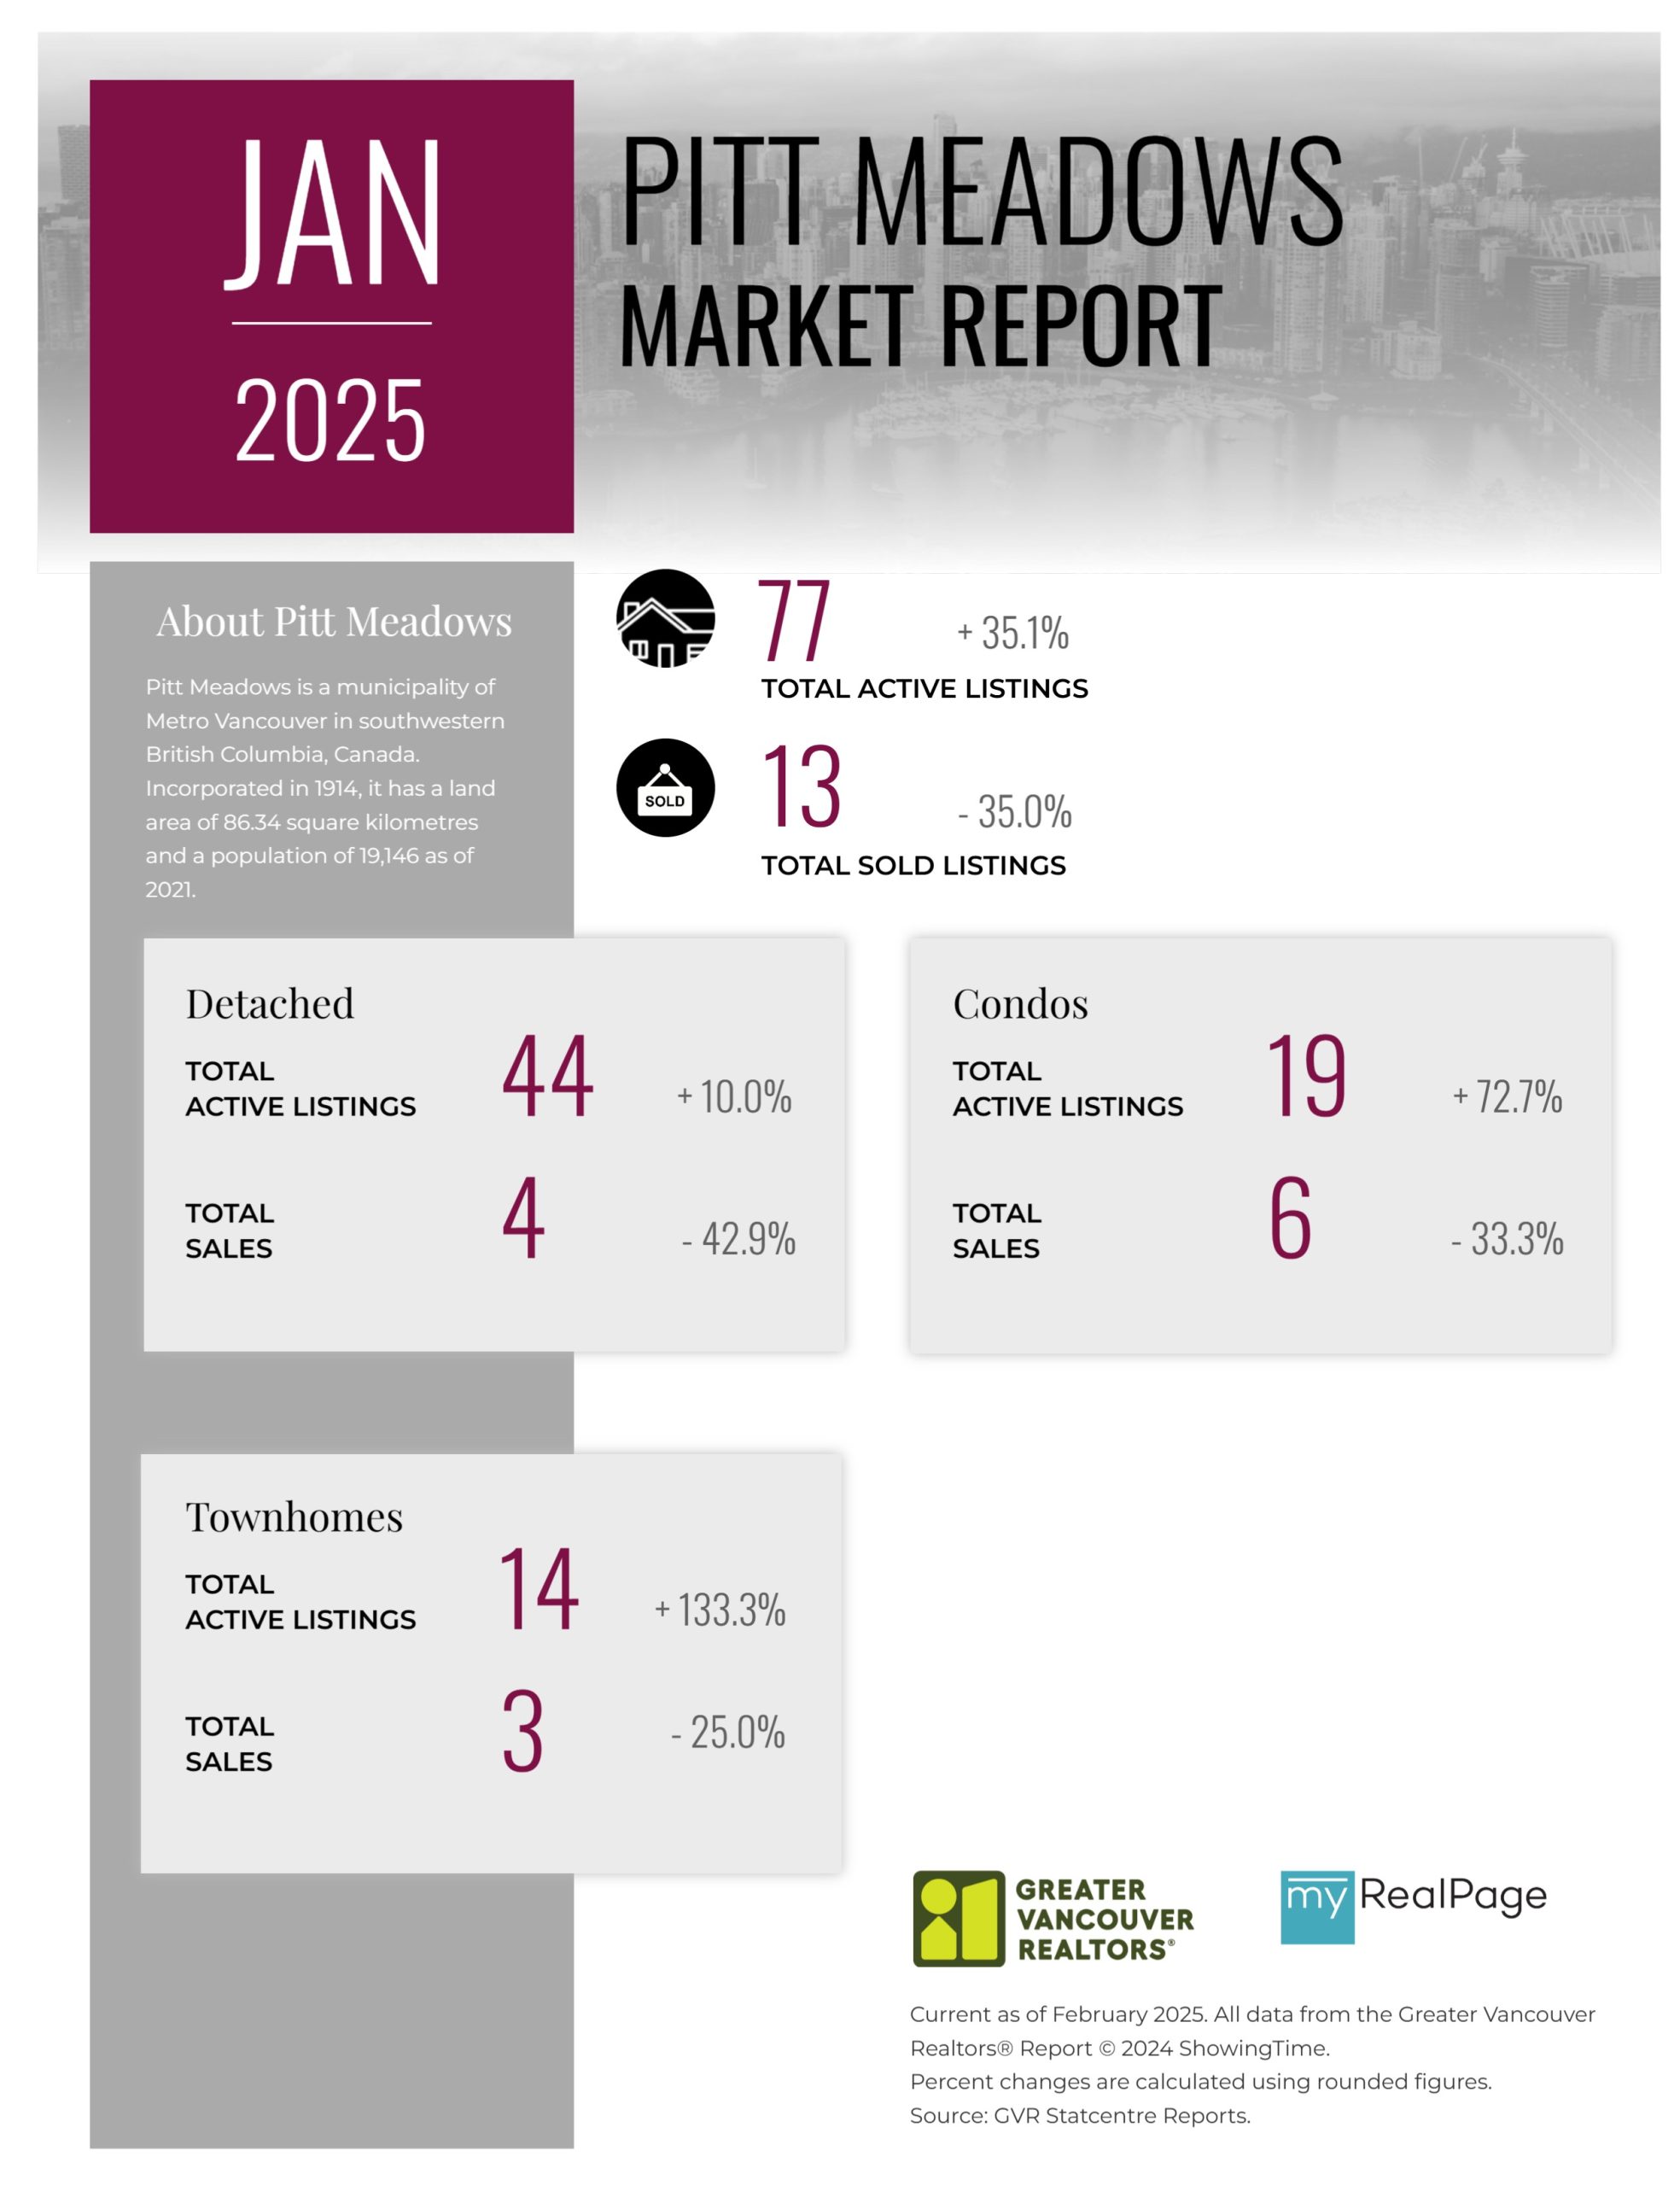
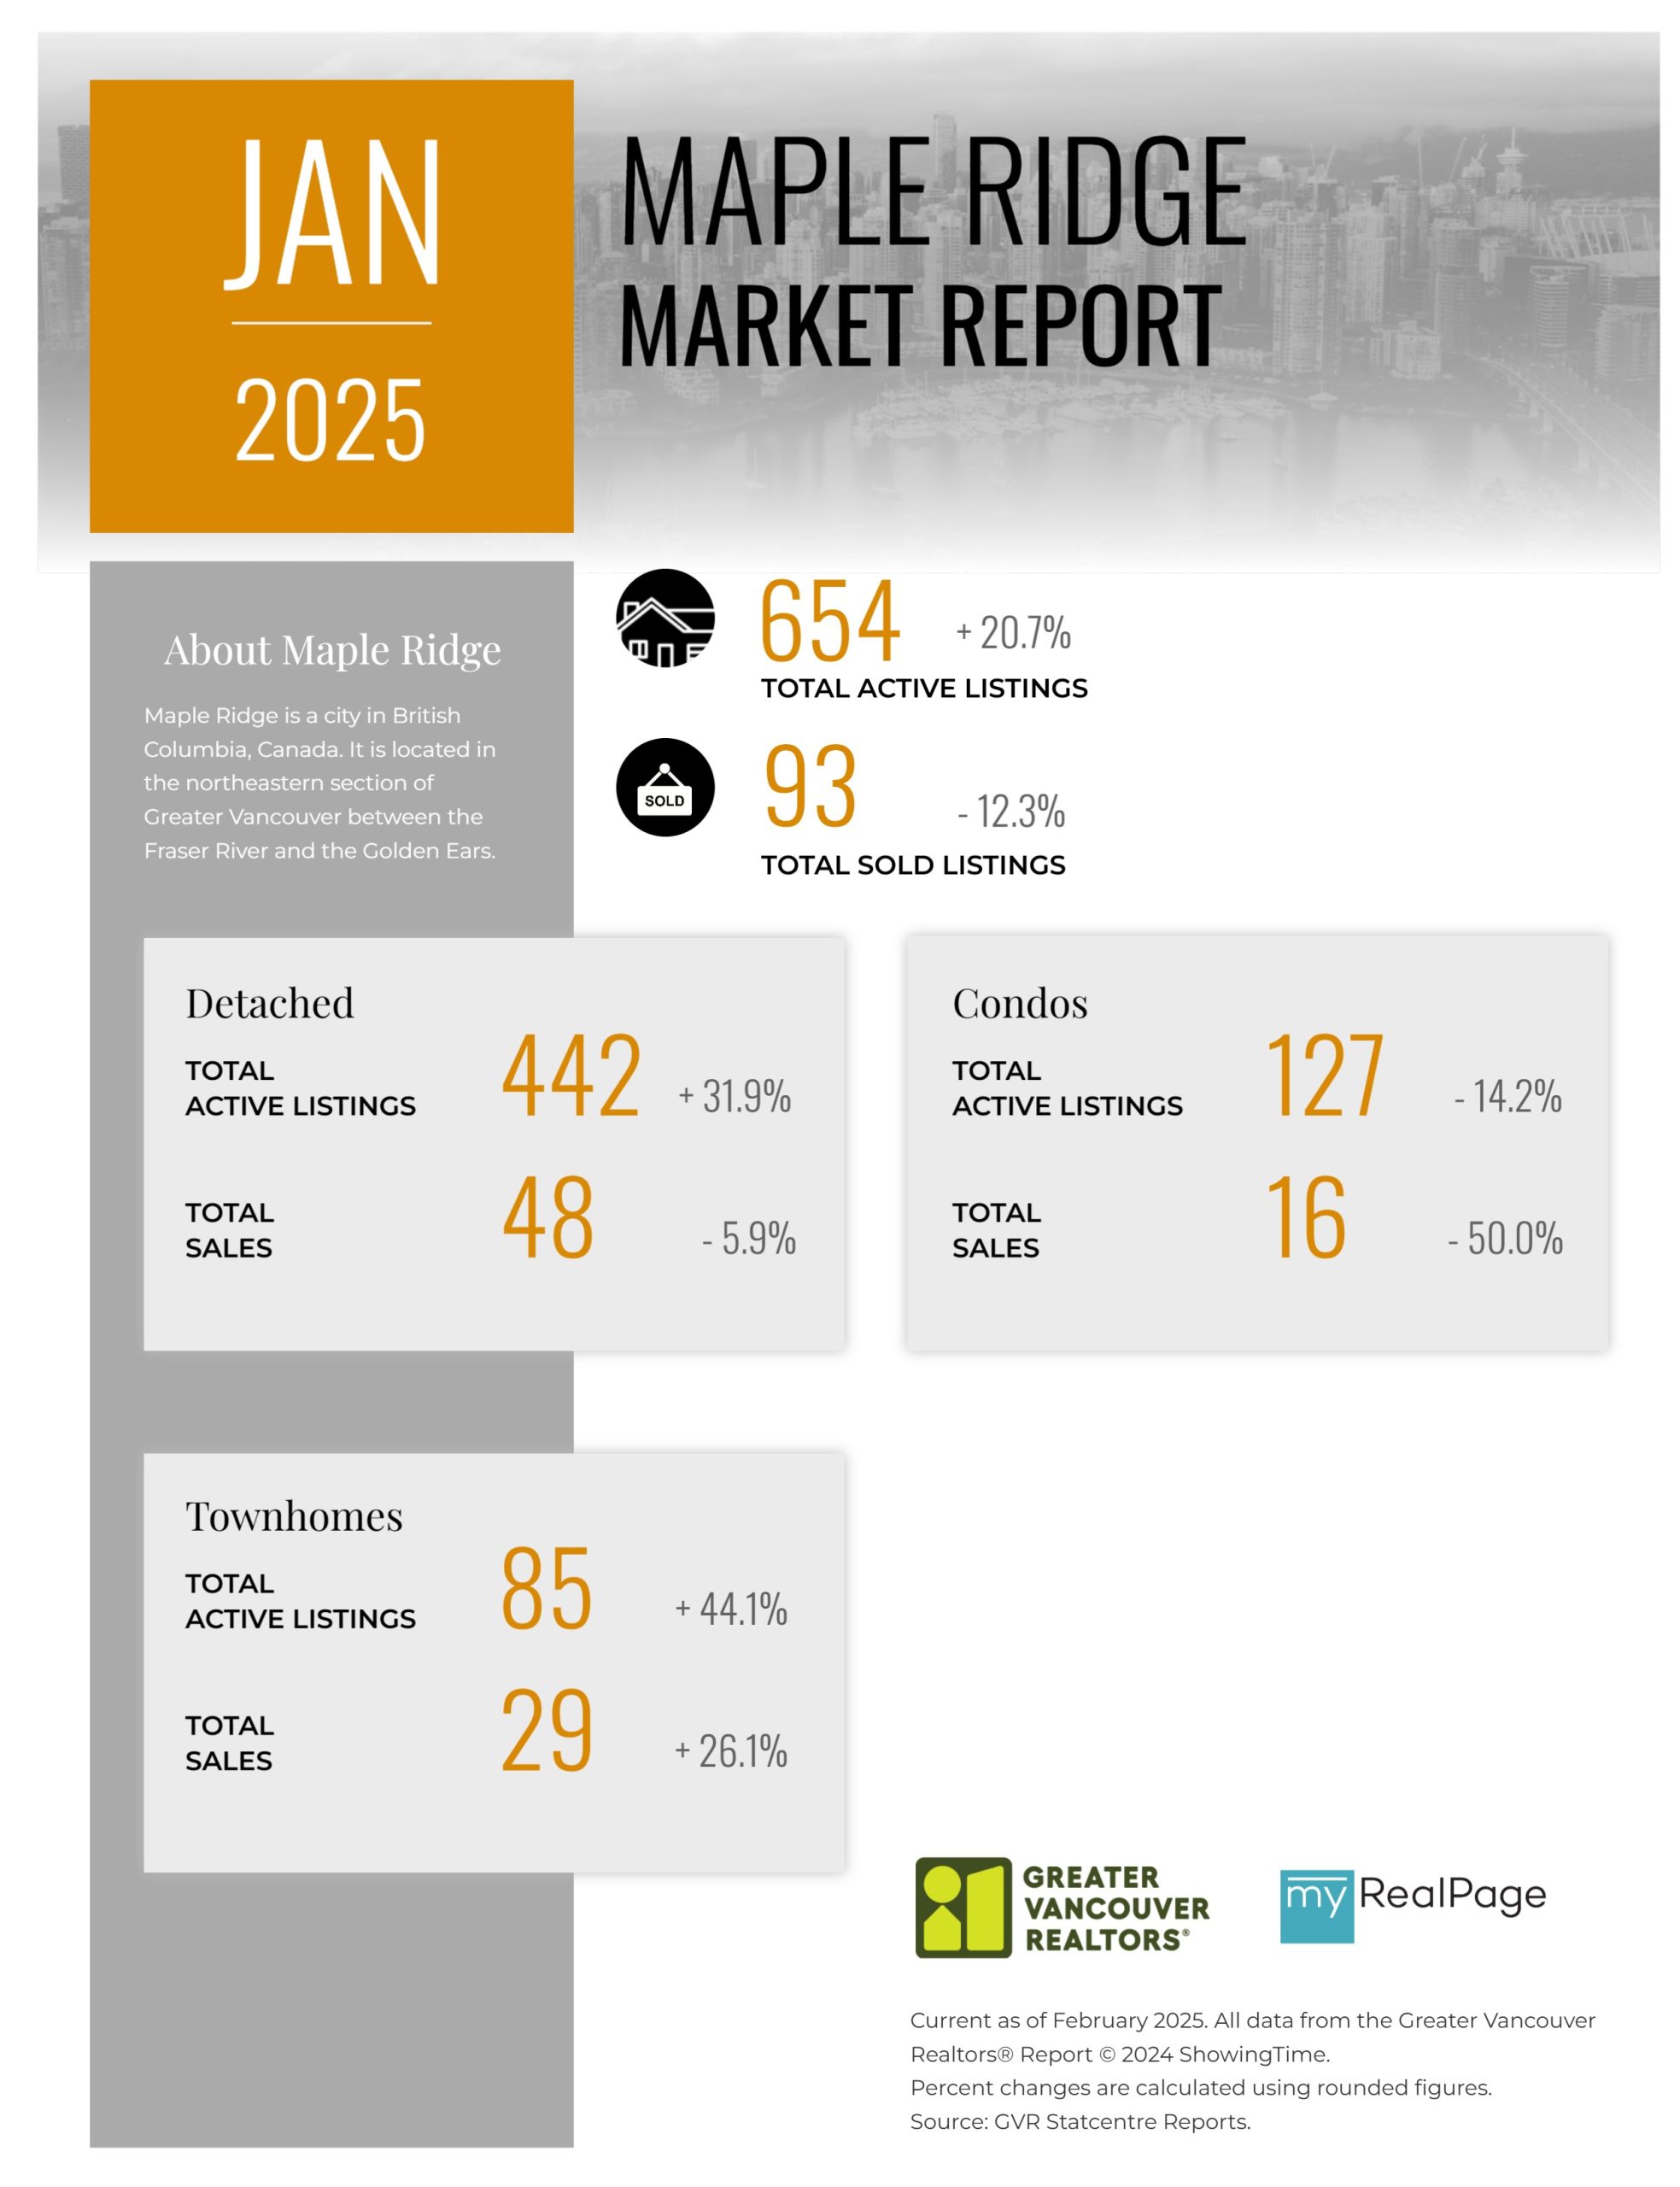
Homes newly listed on the MLS® in Metro Vancouver* rose 46 per cent year-over-year in January, as sellers appear eager to enter the market to start the year.
The Greater Vancouver REALTORS® (GVR) reports that residential sales in the region totalled 1,552 in January 2025, an 8.8 per cent increase from the 1,427 sales recorded in January 2024. This was 11.3 per cent below the 10-year seasonal average (1,749).
“In the three months preceding January, we’ve watched buyer demand gain momentum, but it appears that momentum is now shifting toward sellers to start the new year. Even with this increase in new listing activity, sales continue to outpace last years’ figures, signaling some buyer appetite remains after the upswing that finished off 2024.” Andrew Lis, GVR director of economics and data analytics
Read the full report on the REBGV website!
The following data is a comparison between January 2025 and January 2024 numbers, and is current as of February of 2025. For last month’s update, you can check out our previous post!
Or follow this link for all our GVR Infographics!
These infographics cover current trends in several areas within the Greater Vancouver region. Click on the images for a larger view!
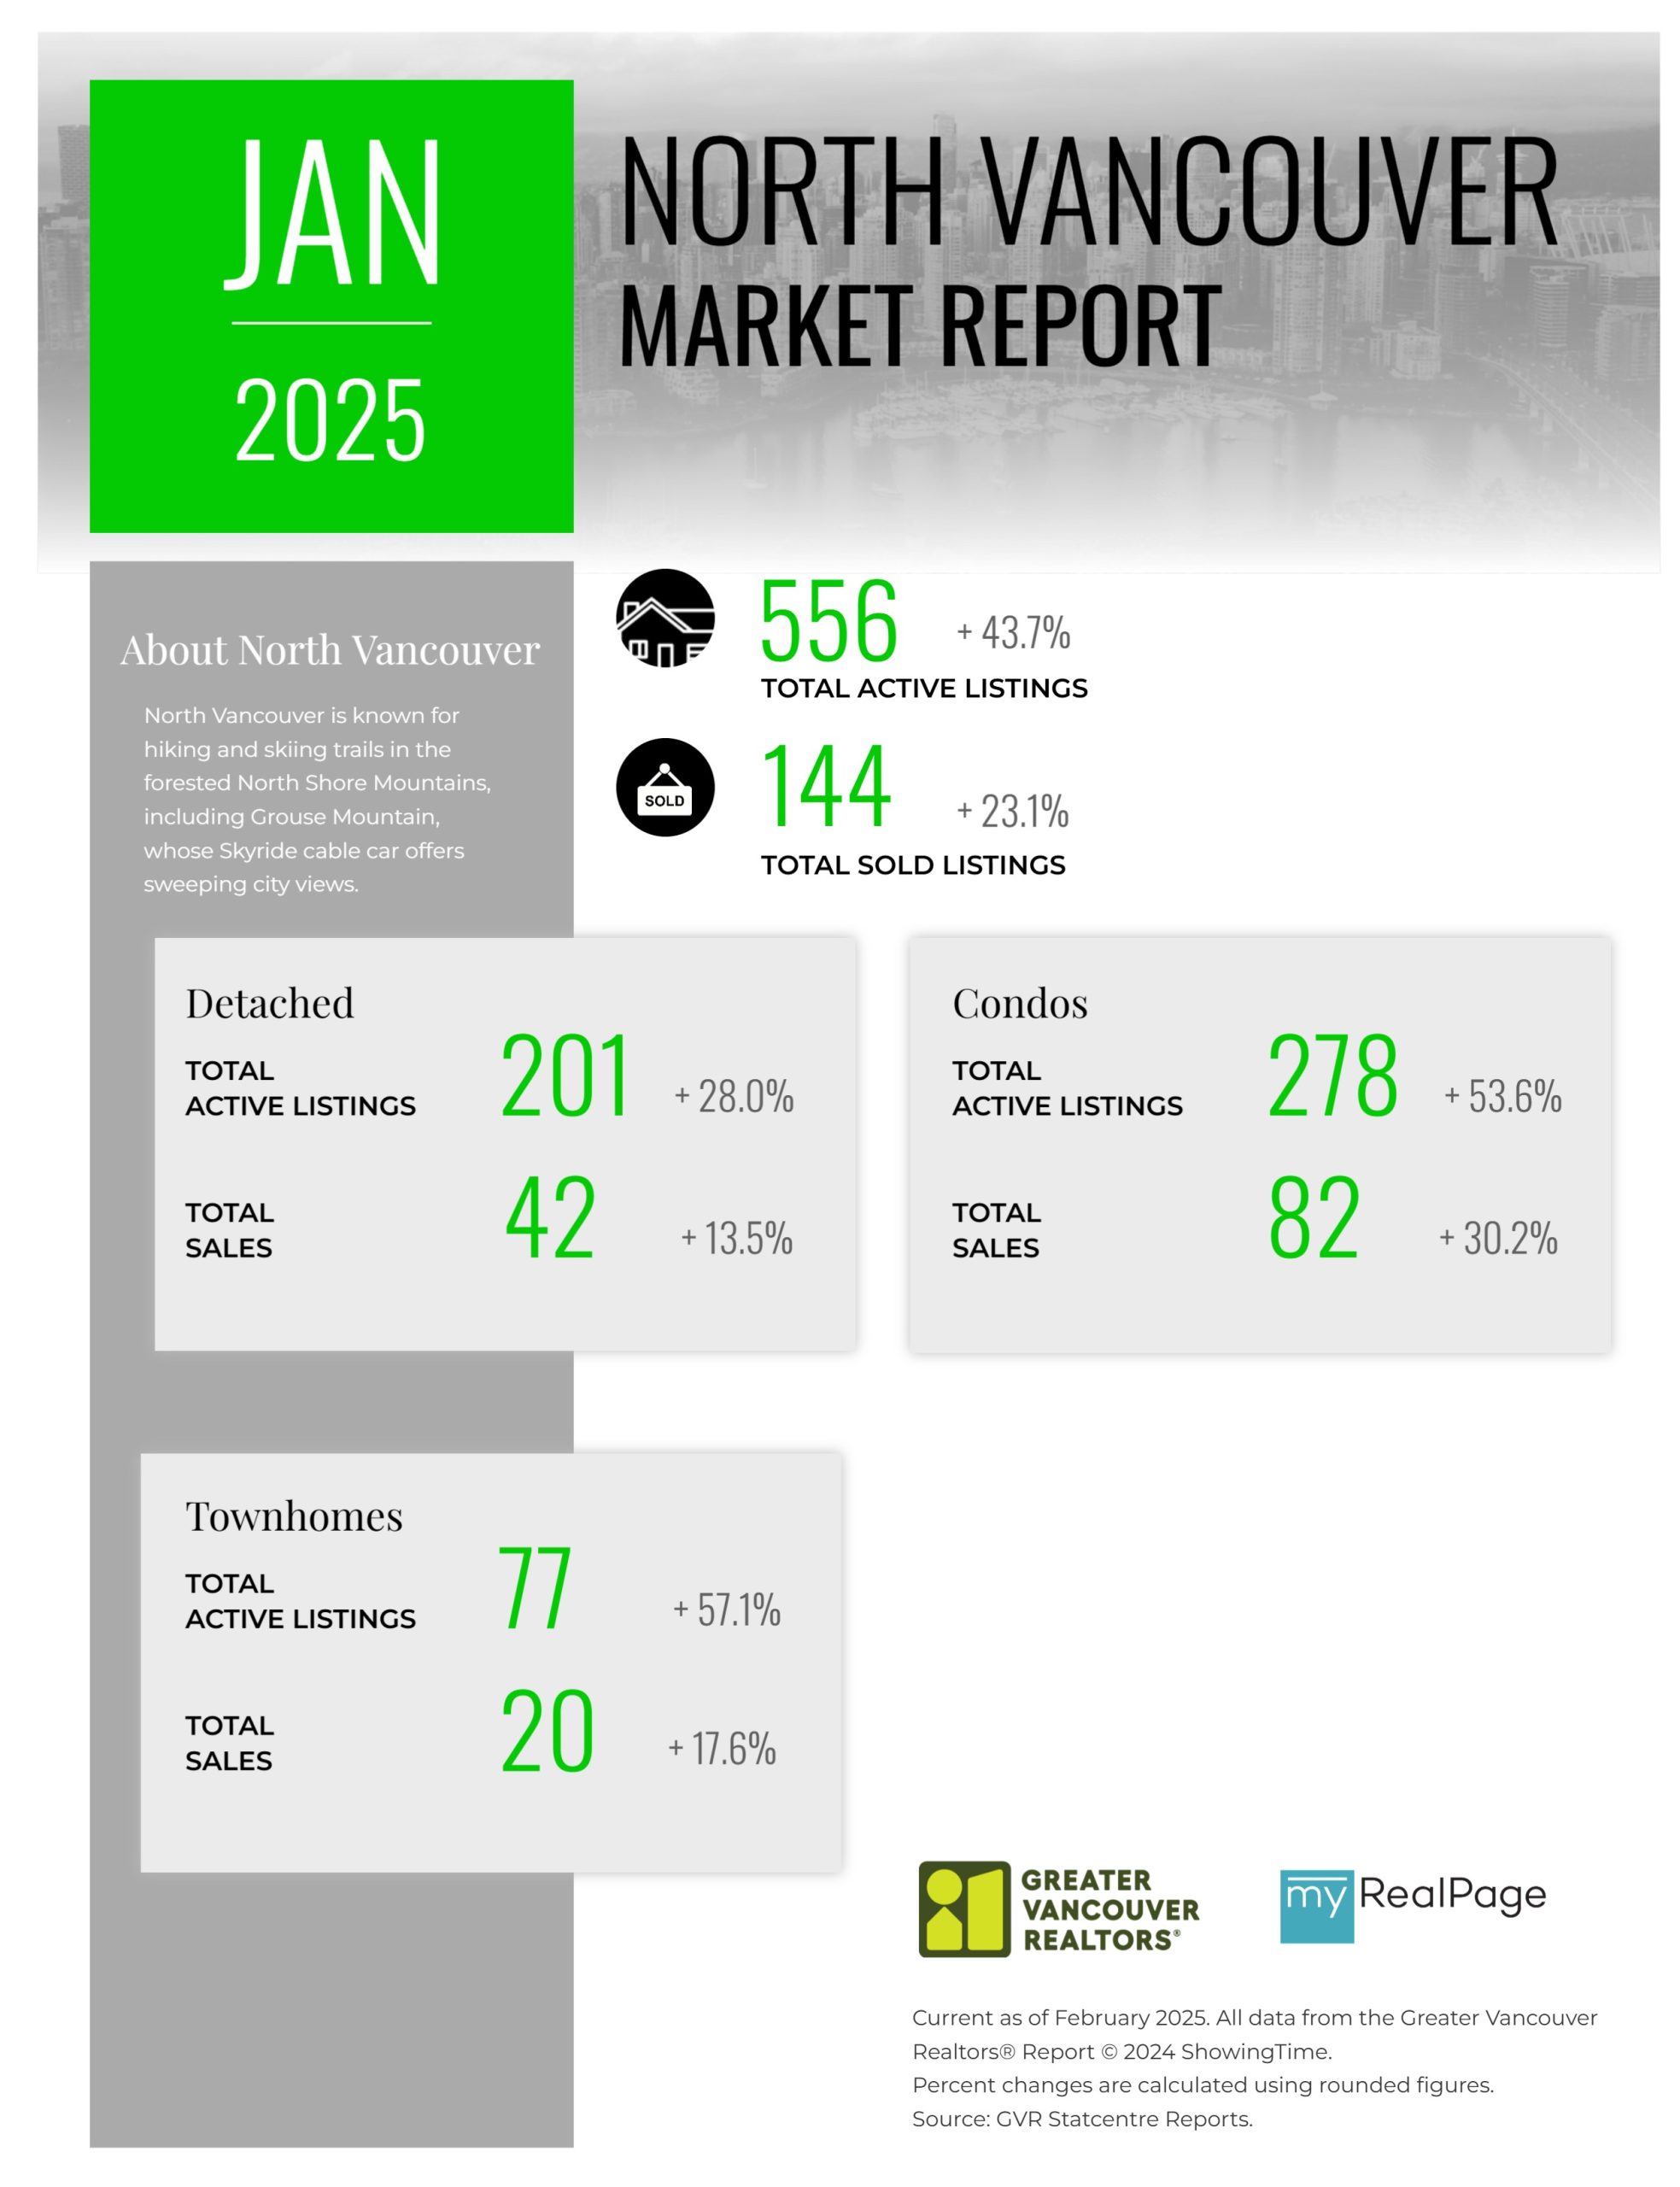
Printable Version – GVR January 2025 Data Infographic Report North Vancouver
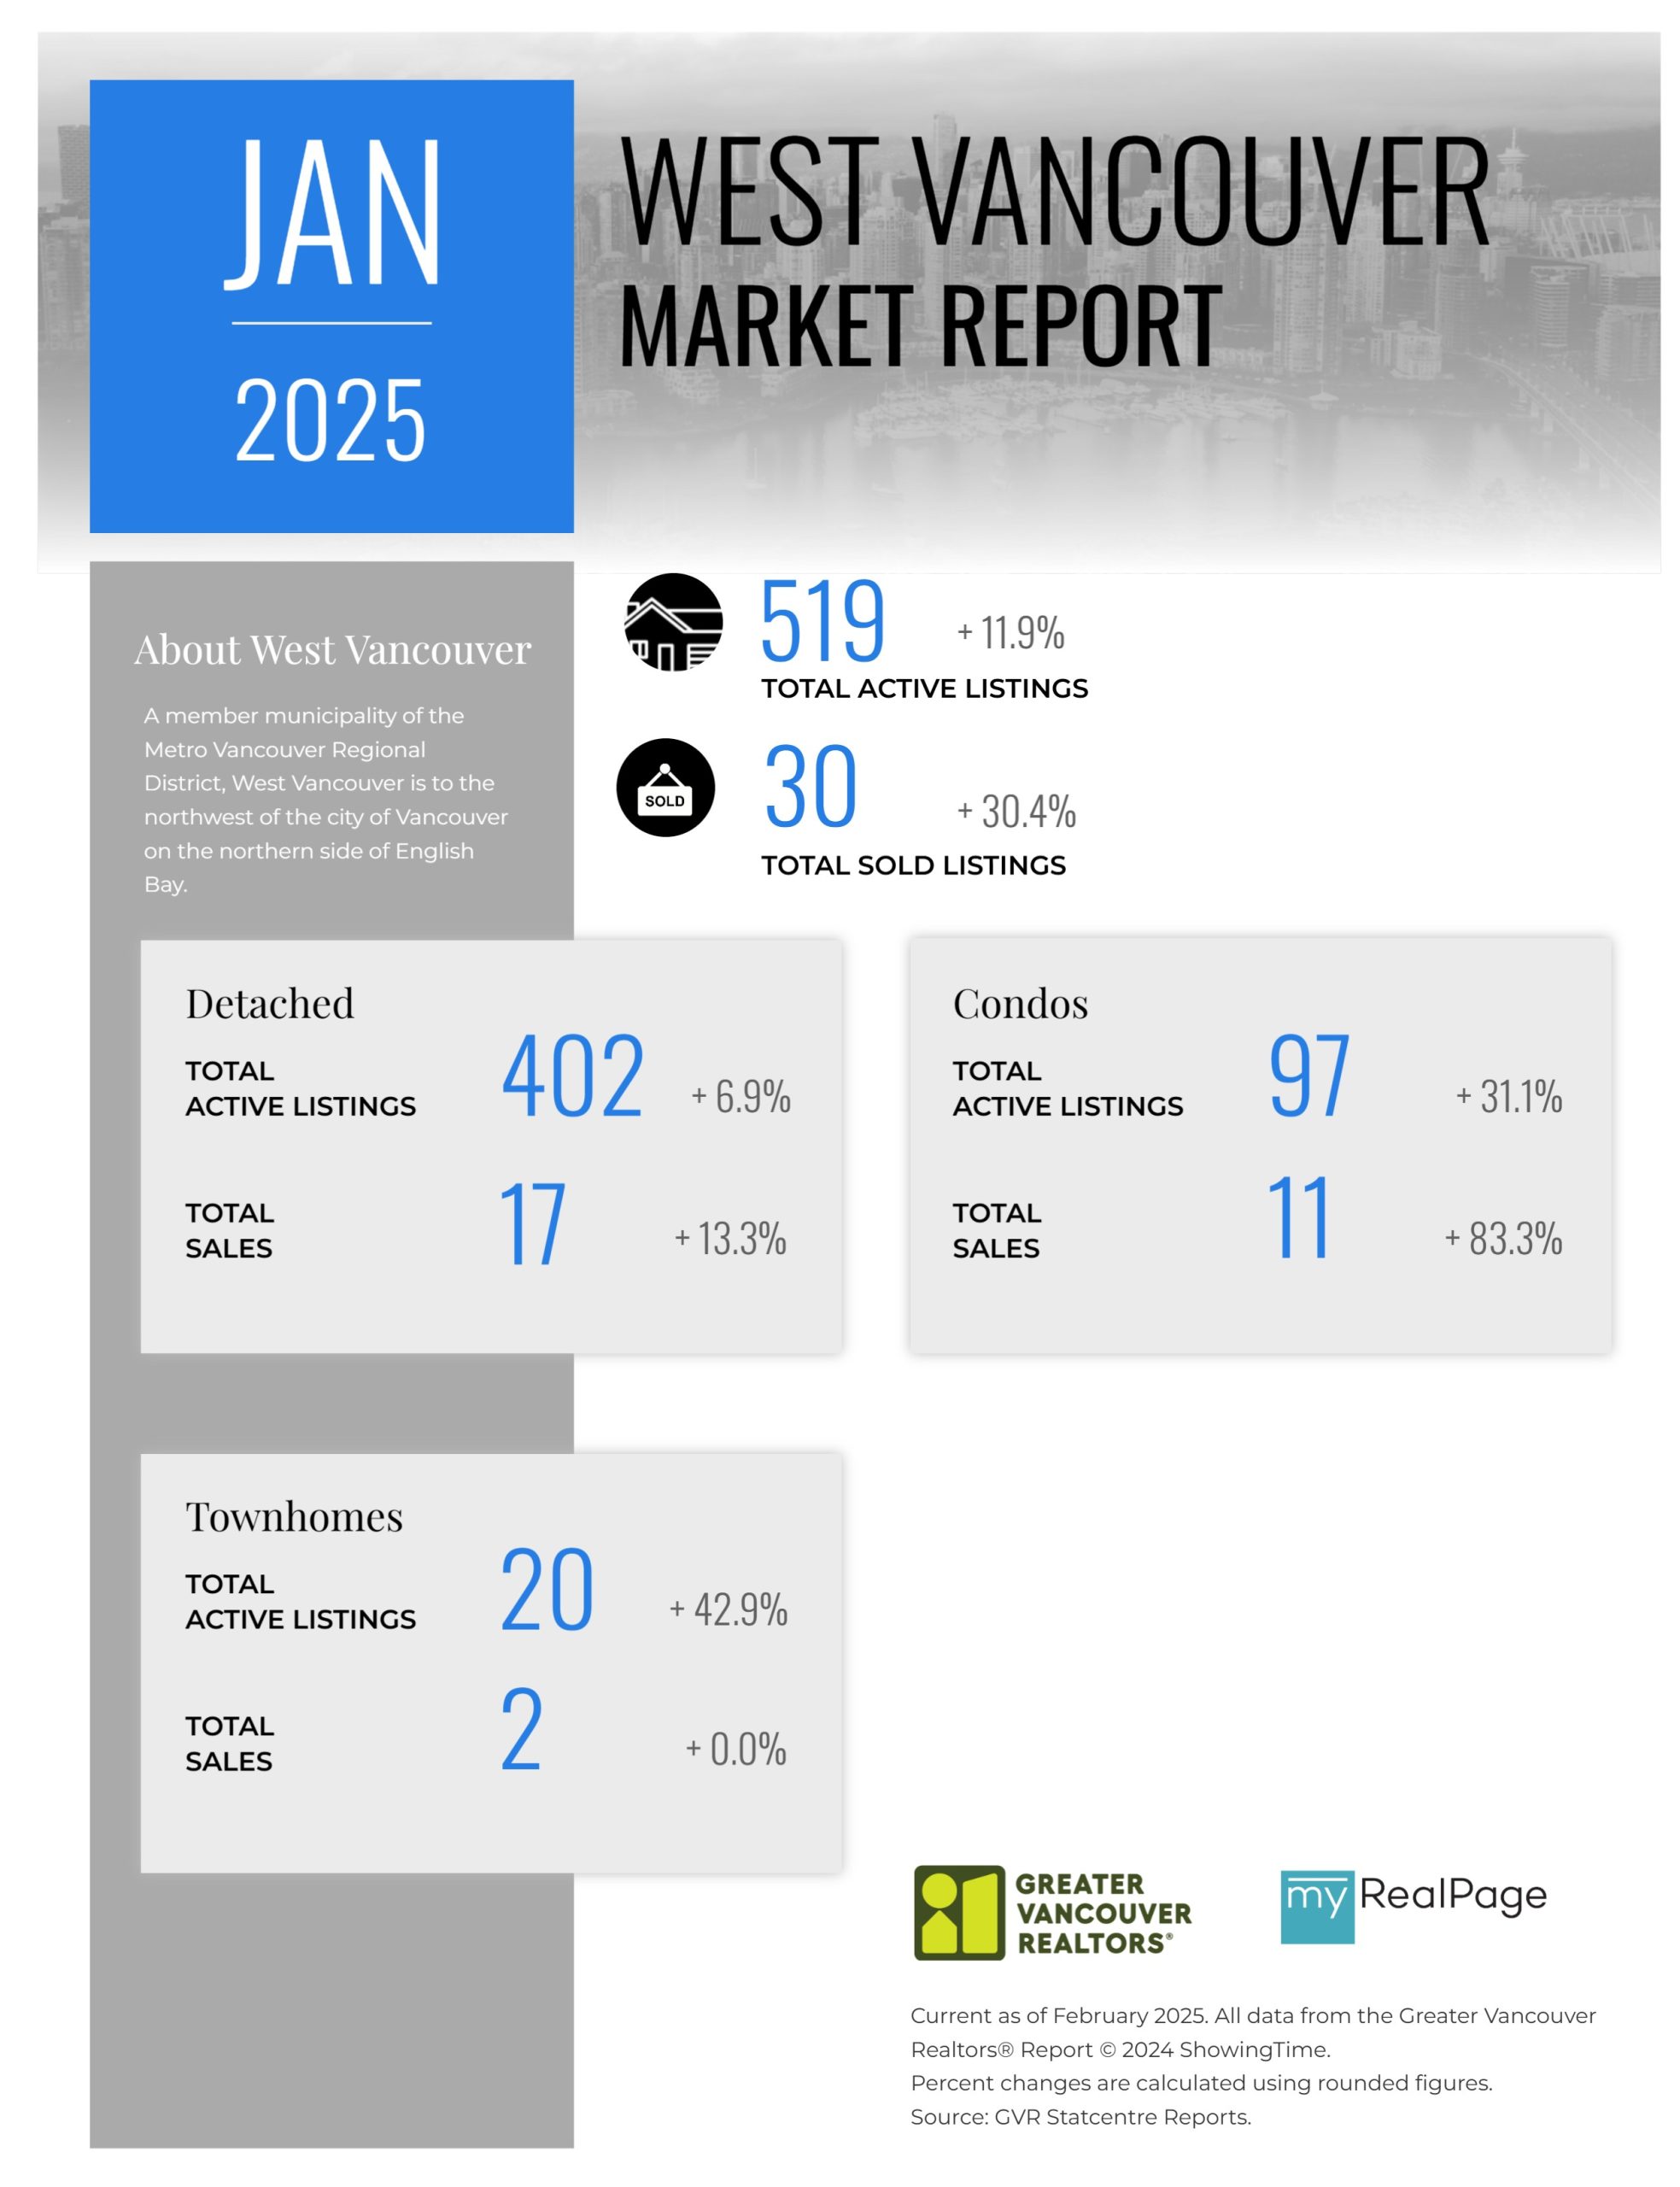
Printable Version – GVR January 2025 Data Infographics Report West Vancouver
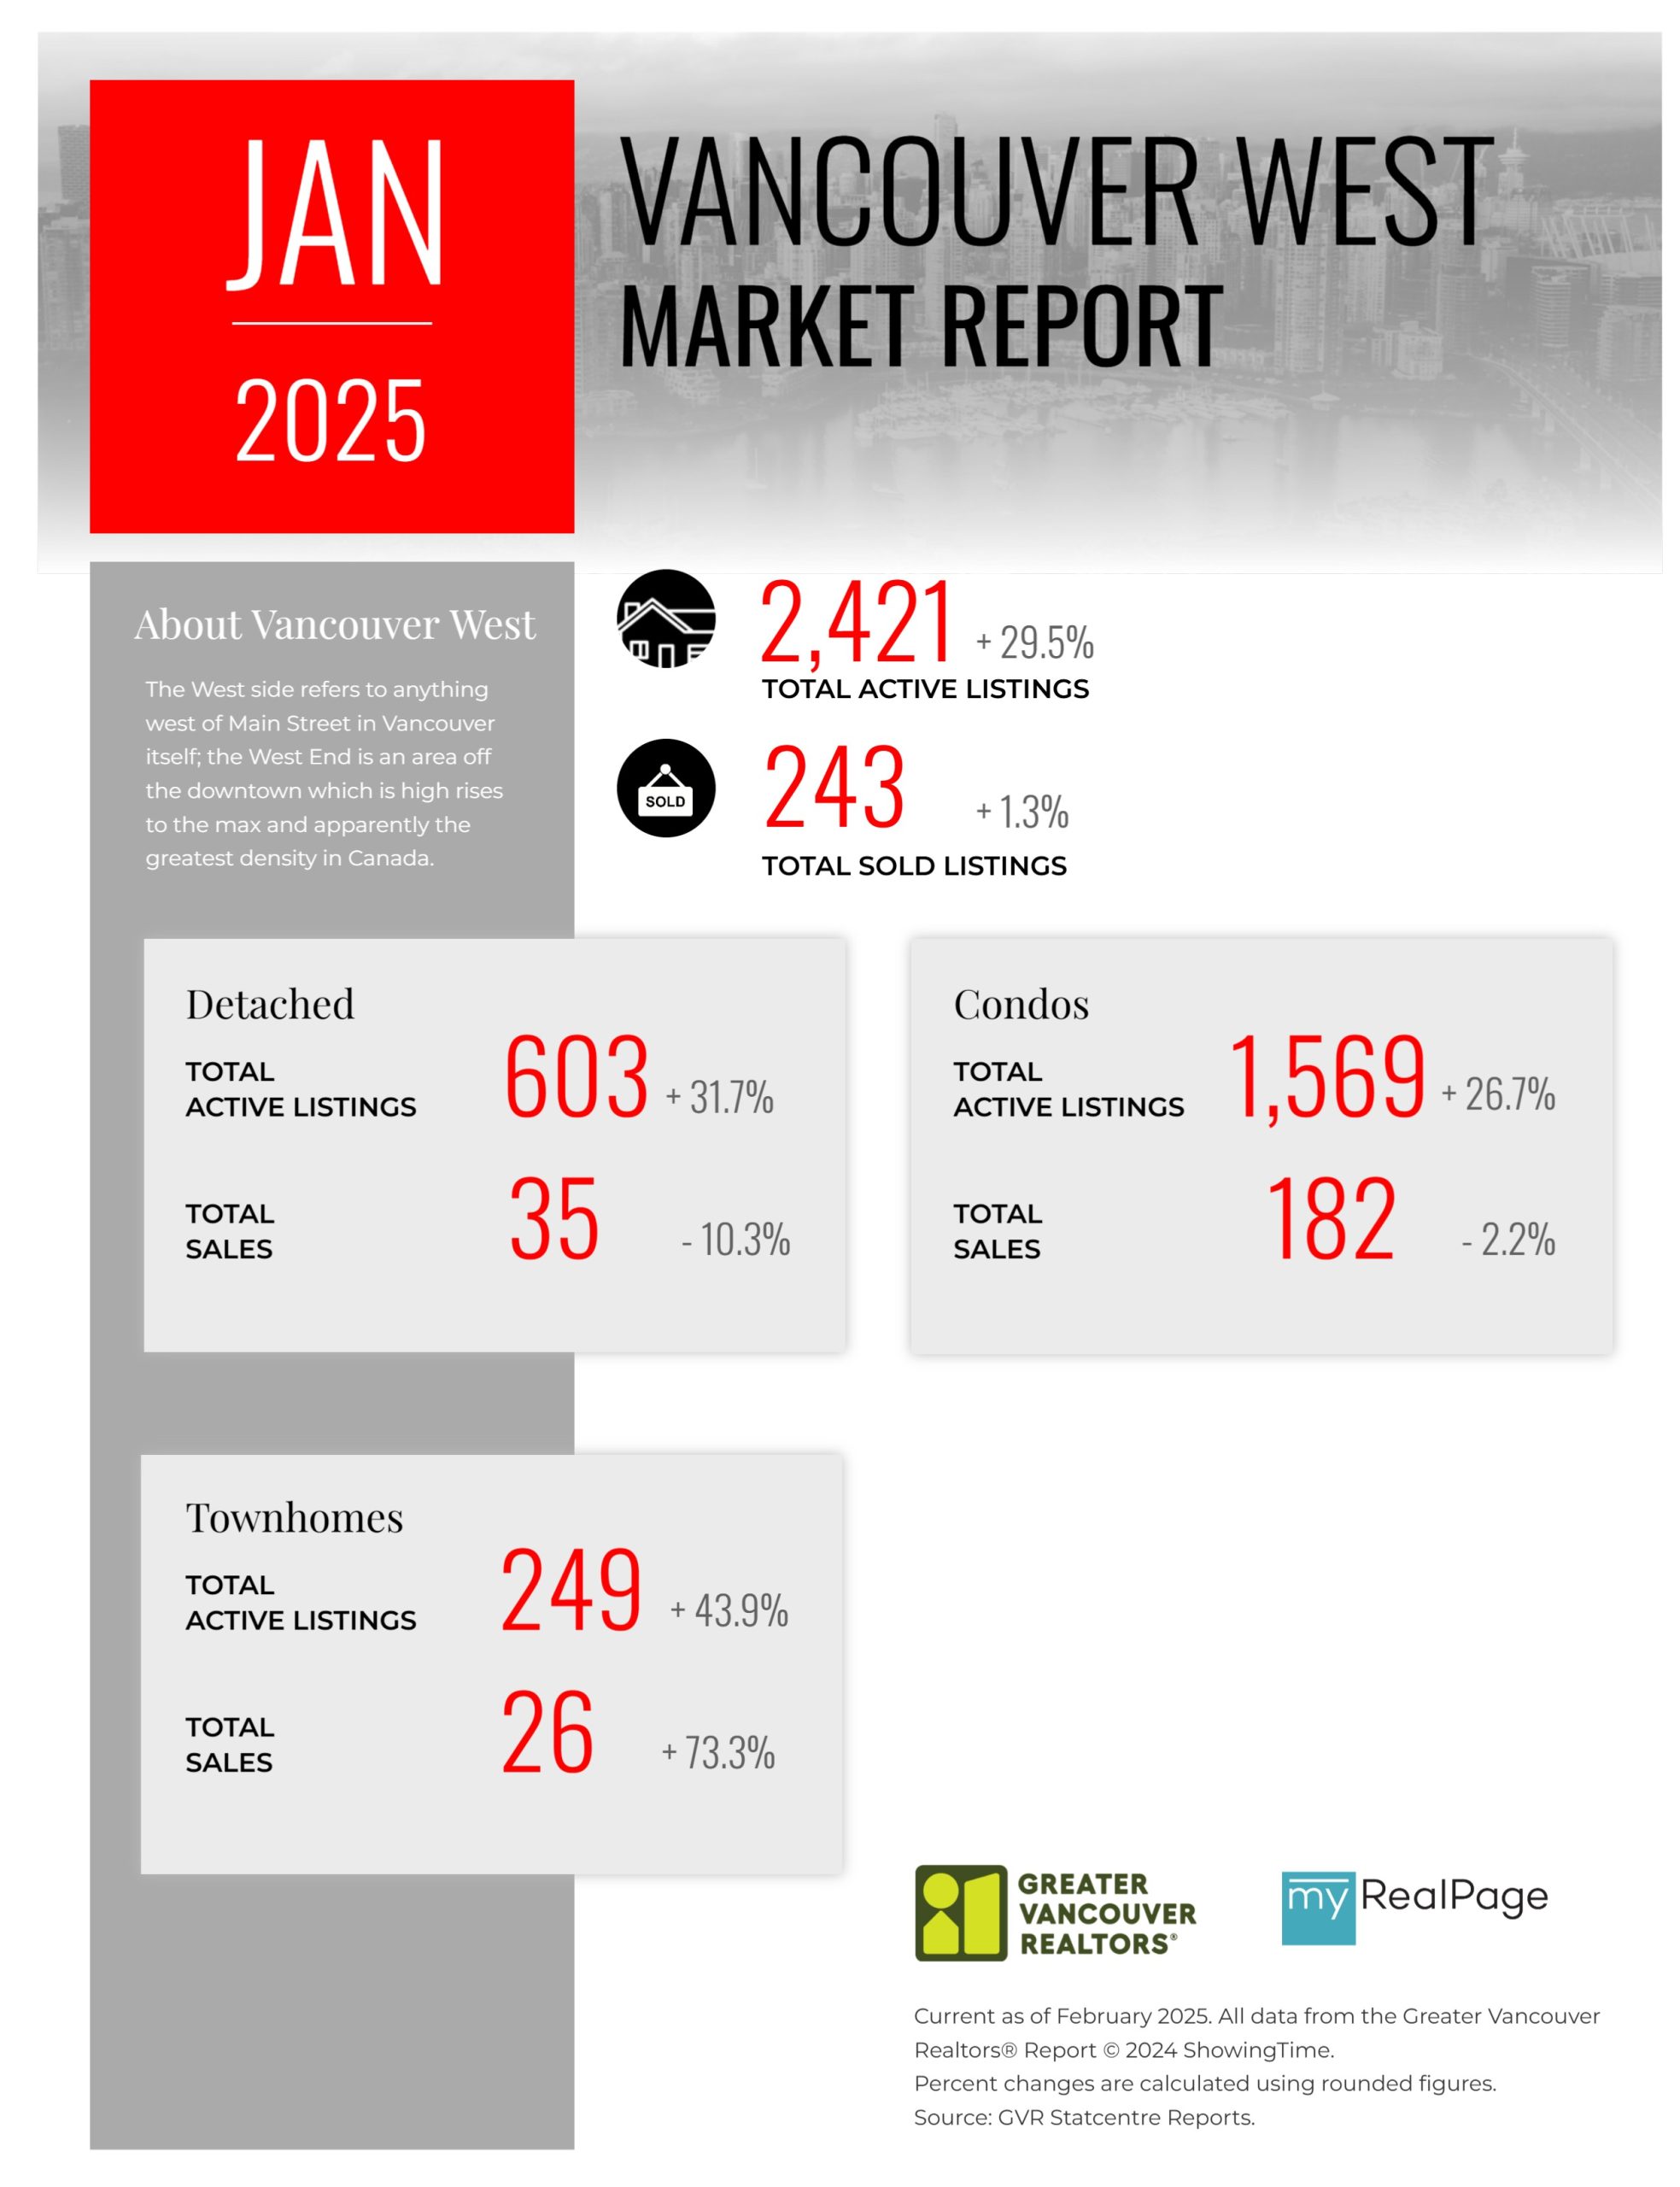
Printable Version – GVR January 2025 Data Infographics Report Vancouver West
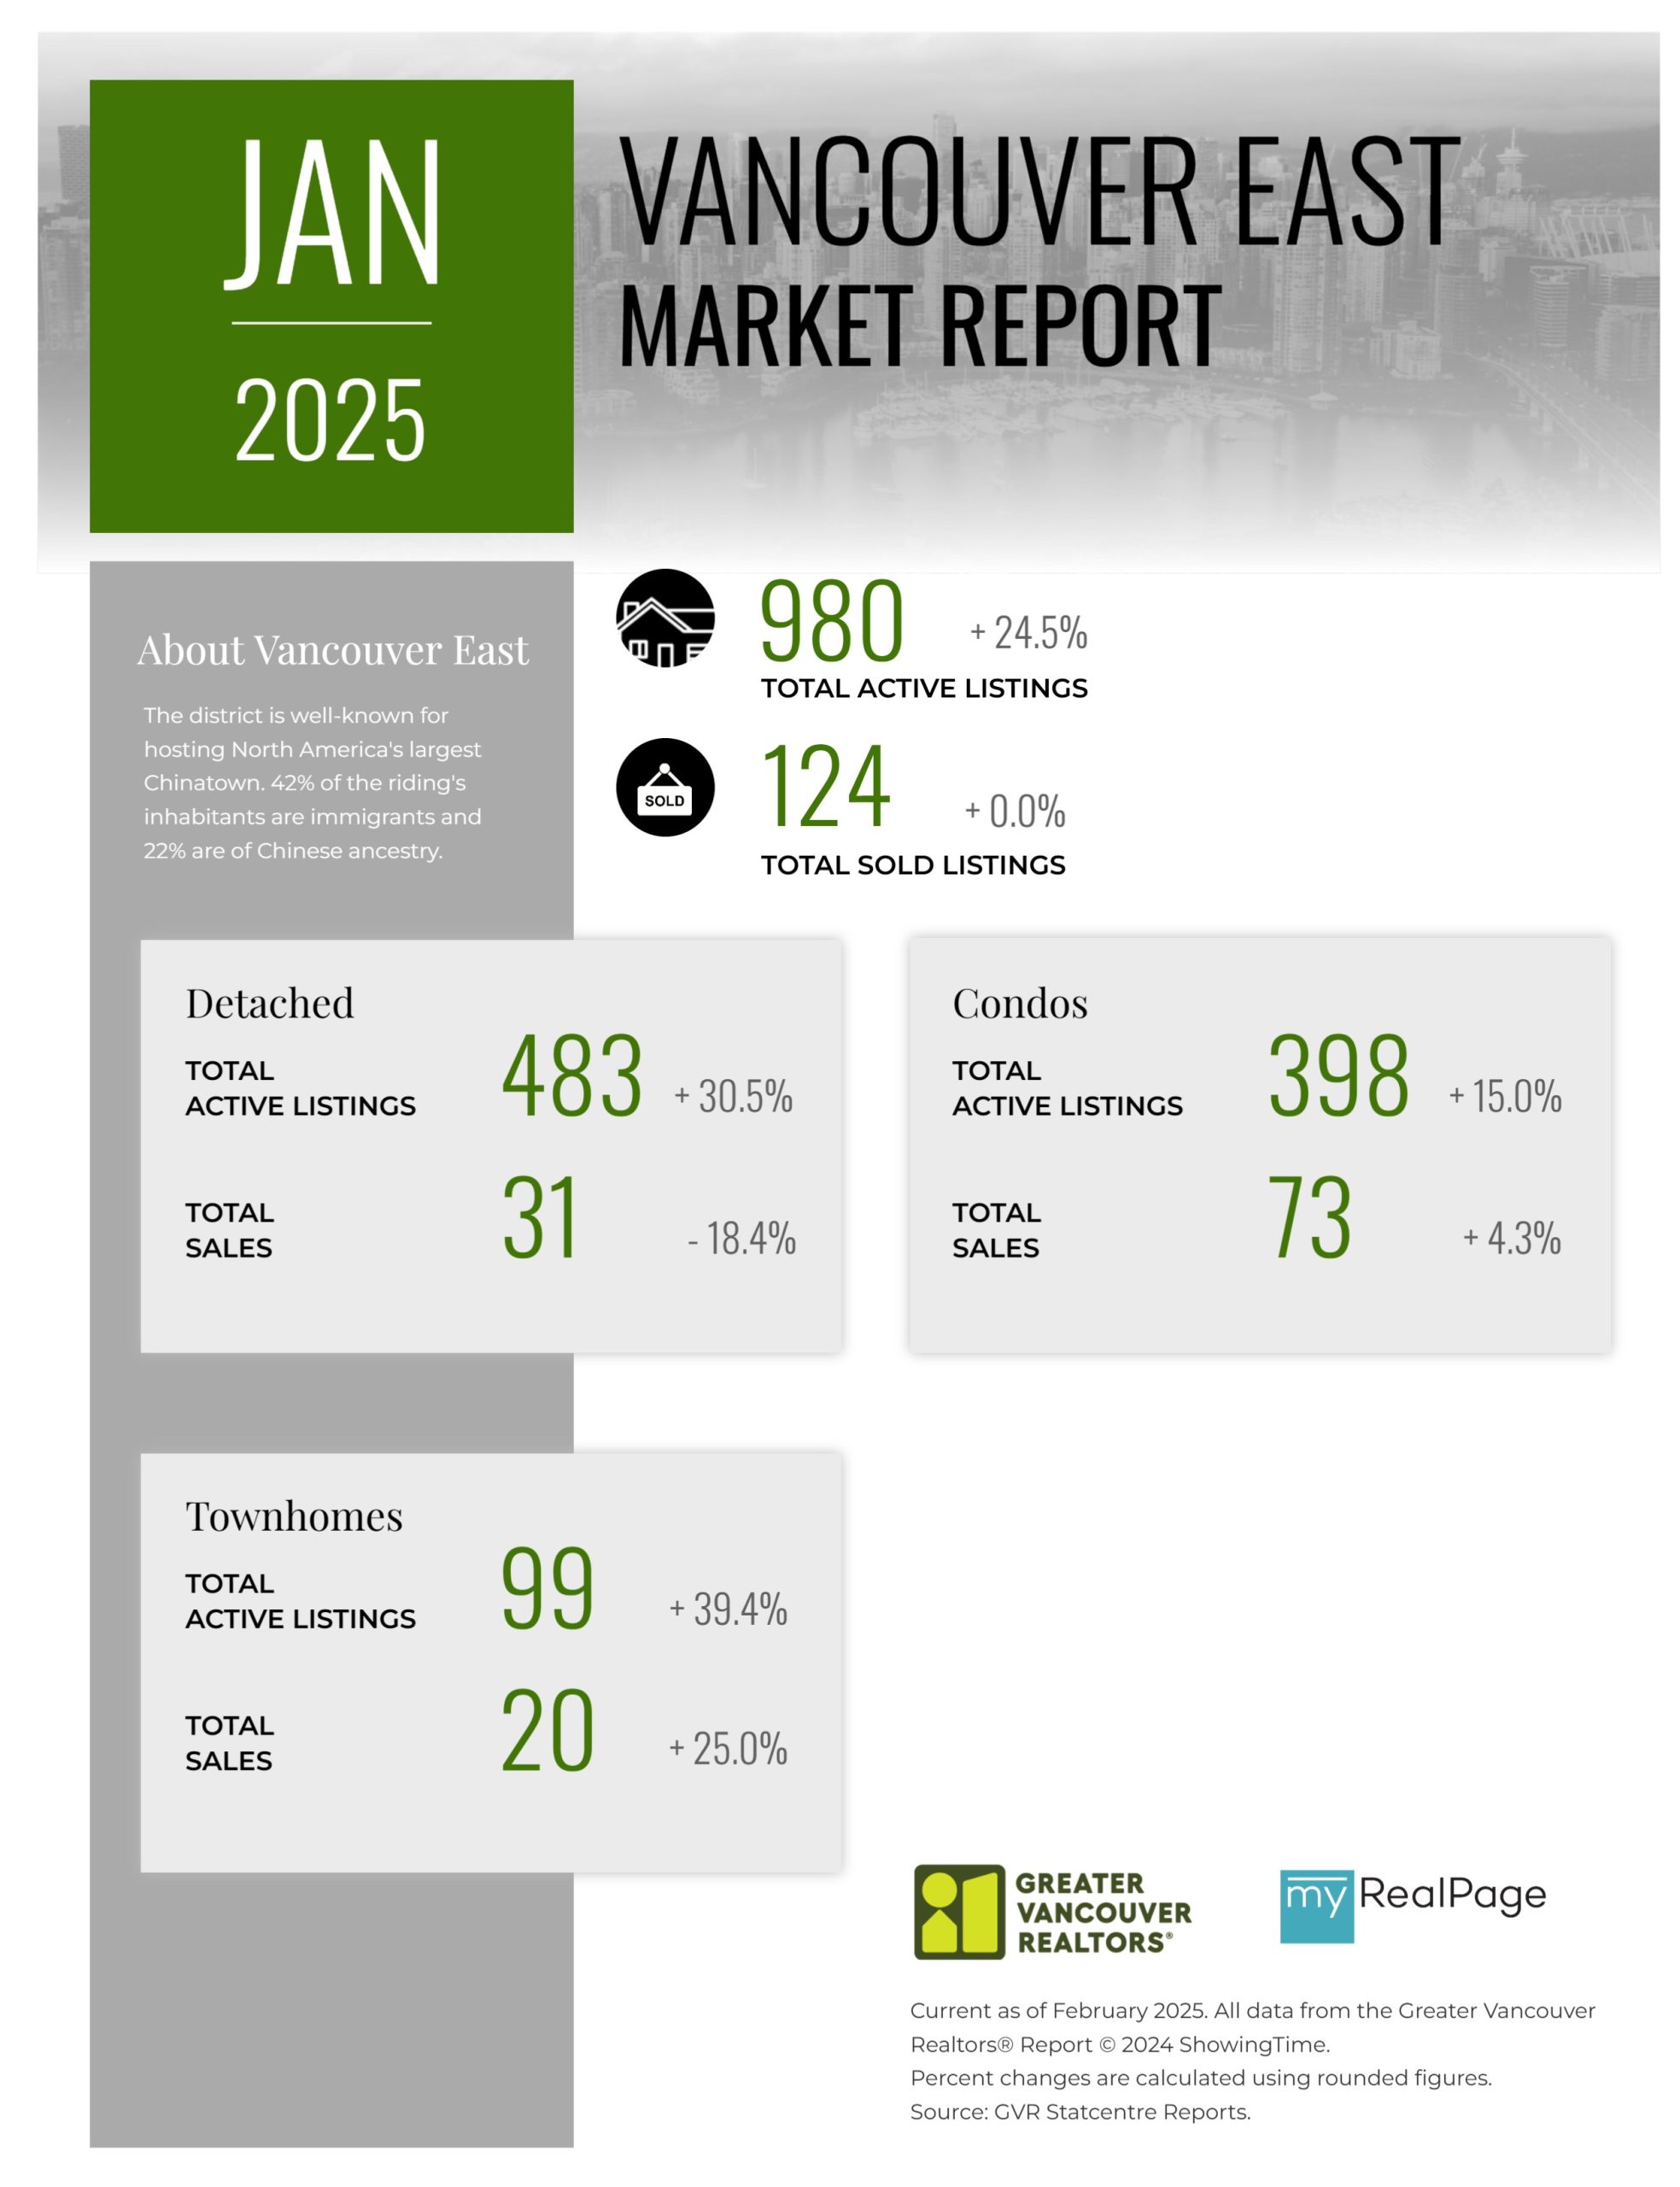
Printable Version – GVR January 2025 Data Infographics Report Vancouver East
Printable Version – GVR January 2025 Data Infographic Report Maple Ridge
Printable Version – GVR January 2025 Data Infographics Report Pitt Meadows
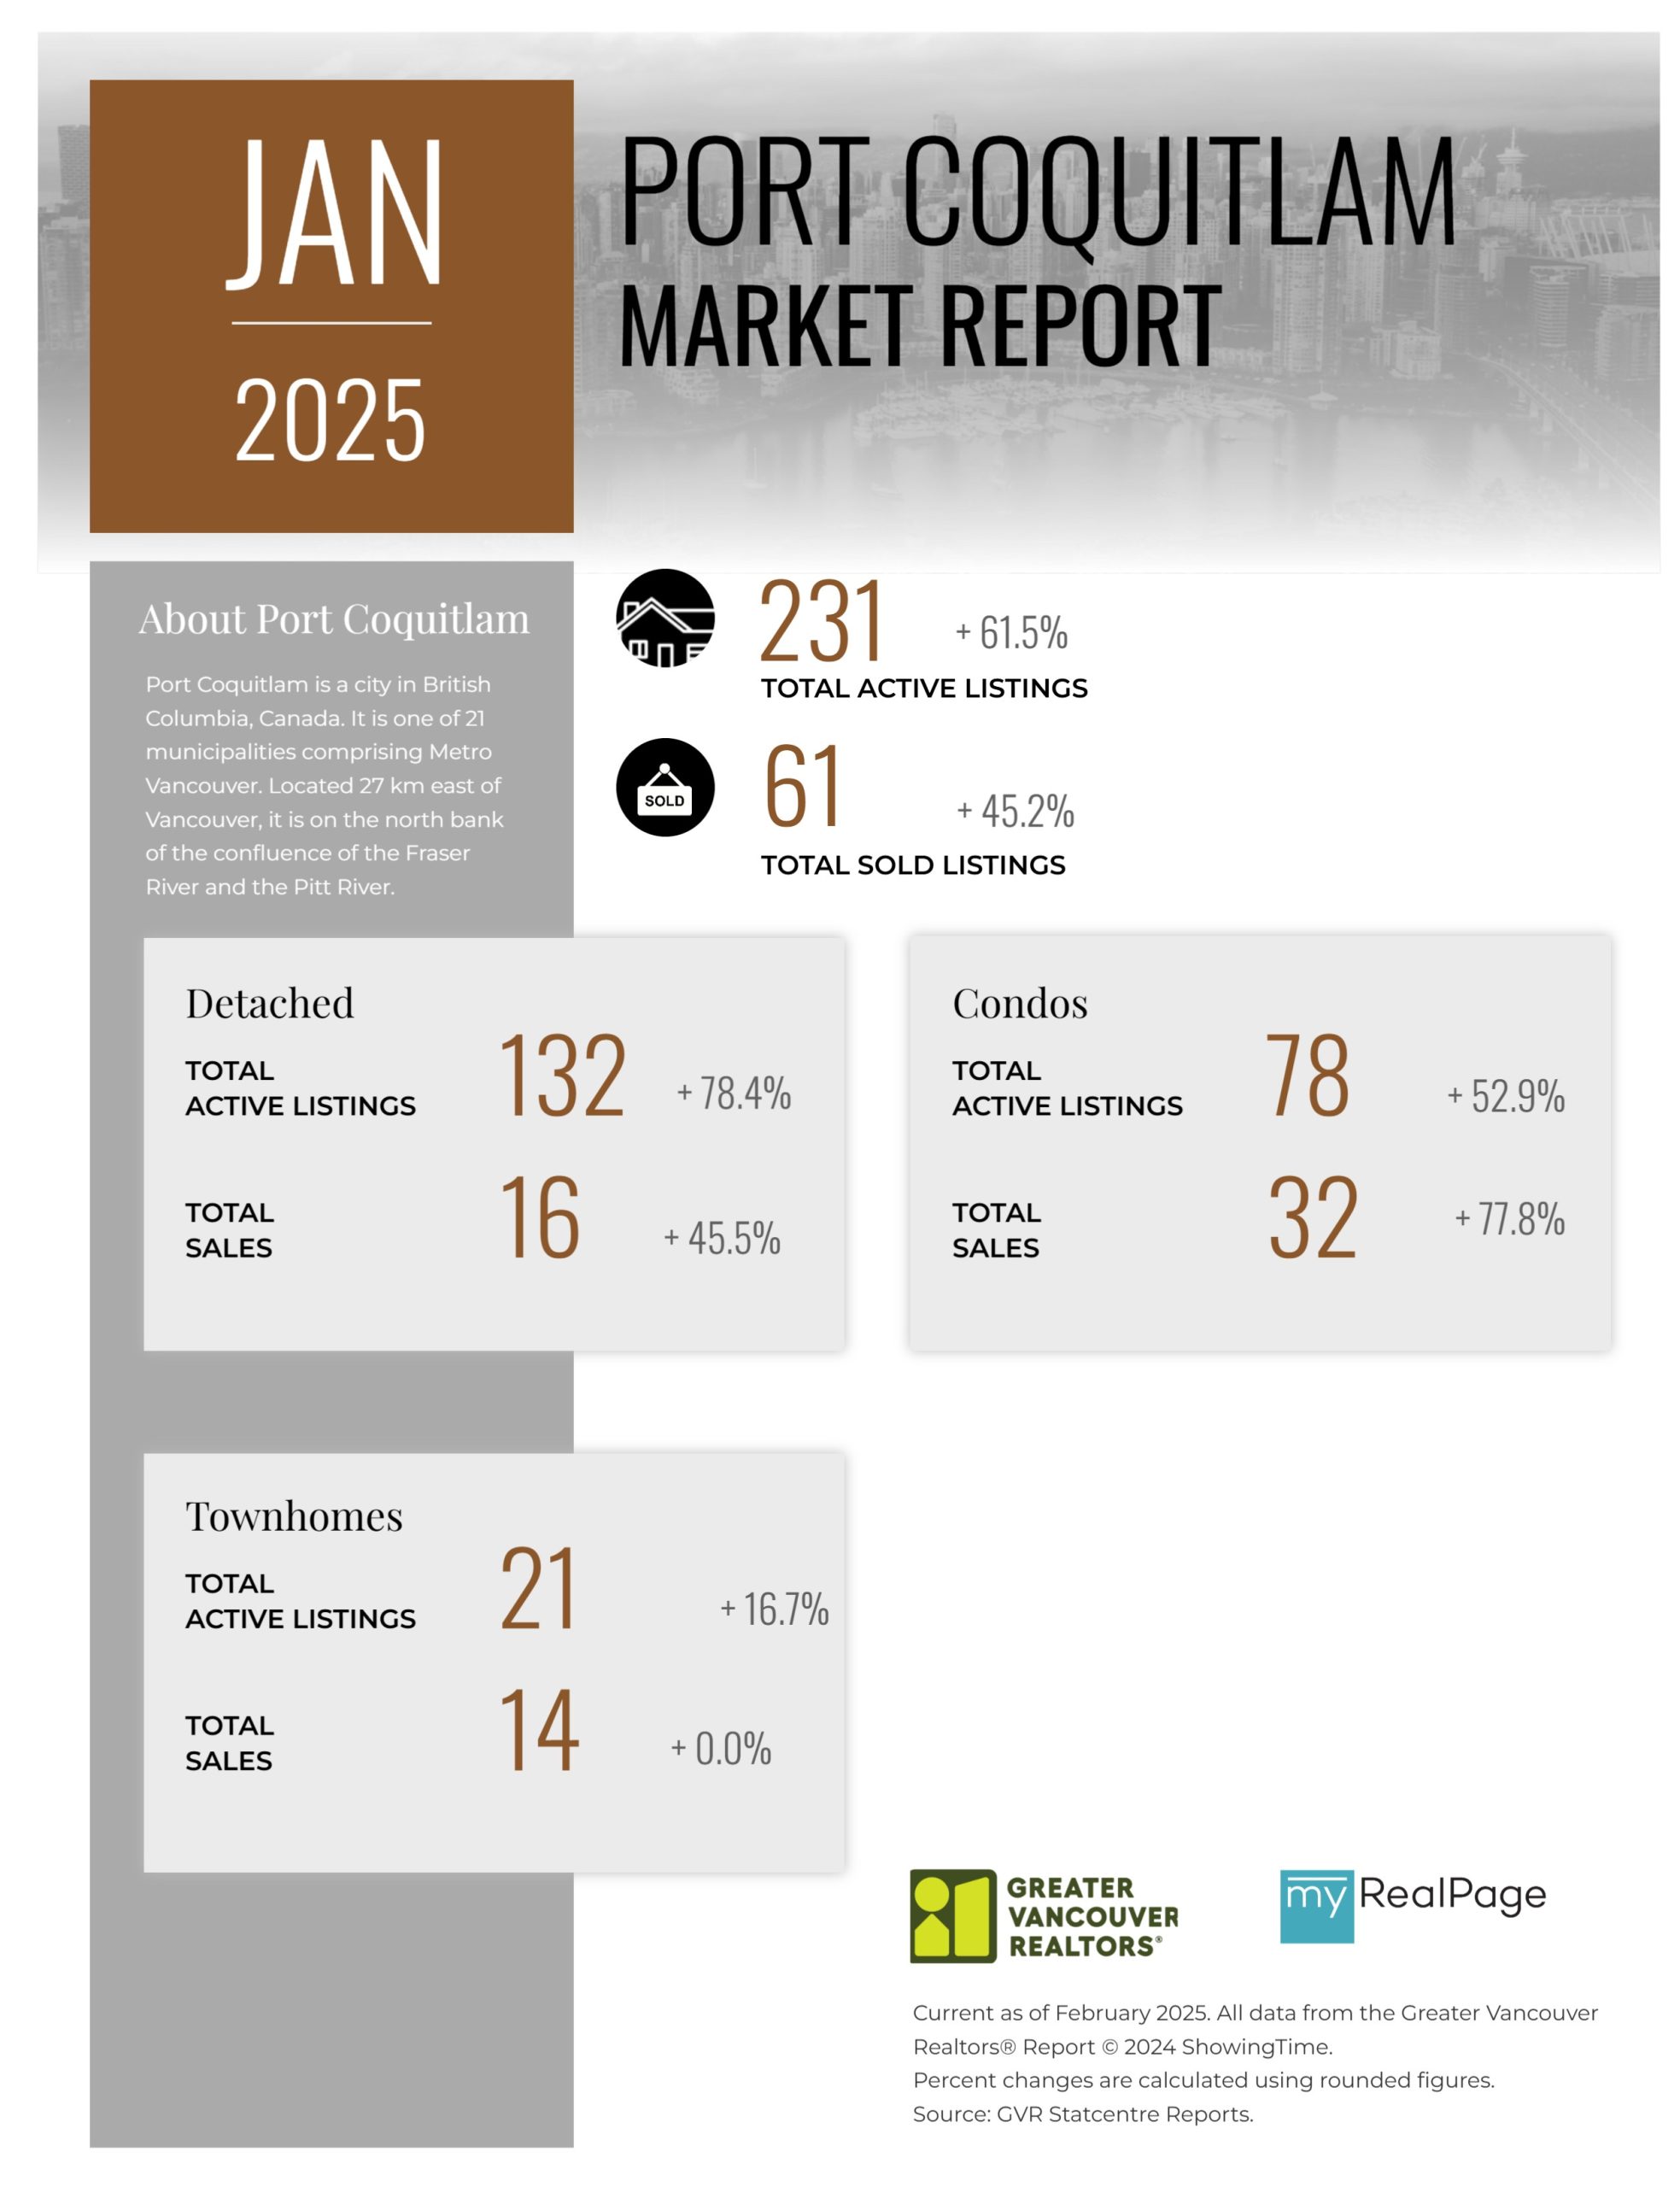
Printable Version – GVR January 2025 Data Infographics Report Port Coquitlam
Printable Version – GVR January 2025 Data Infographics Report Coquitlam
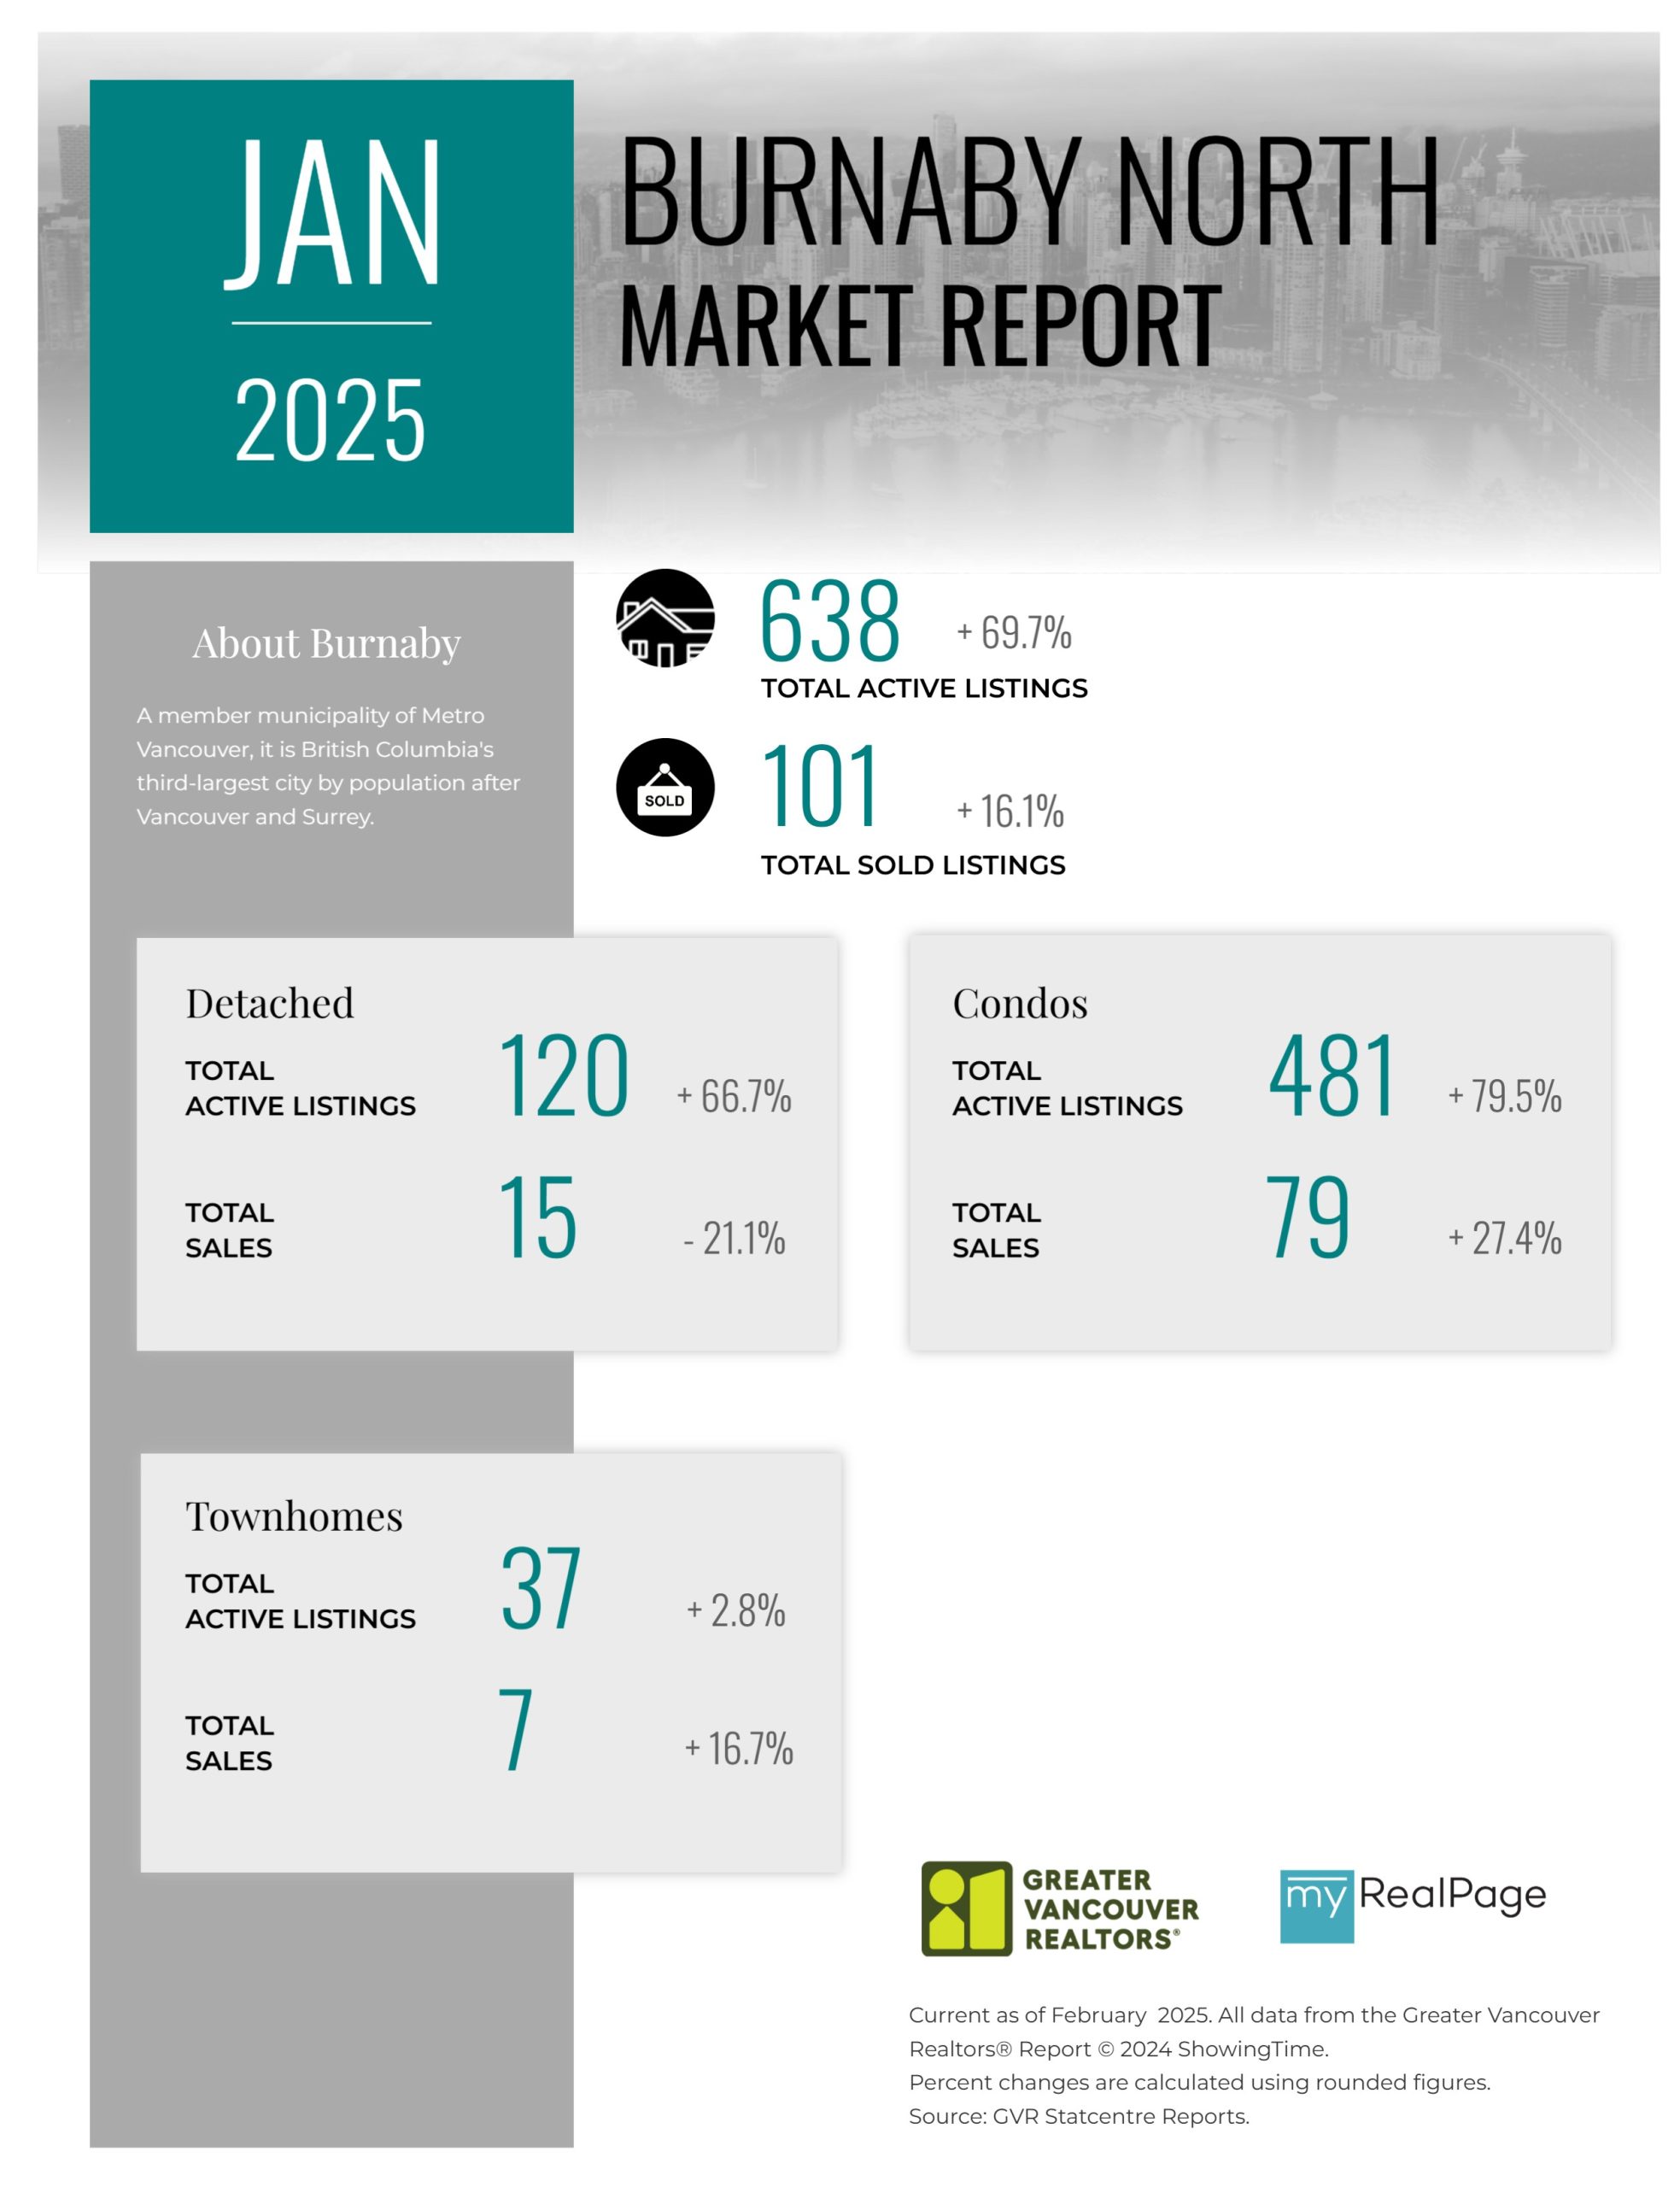
Printable Version – GVR January 2025 Data Infographic Report Burnaby North
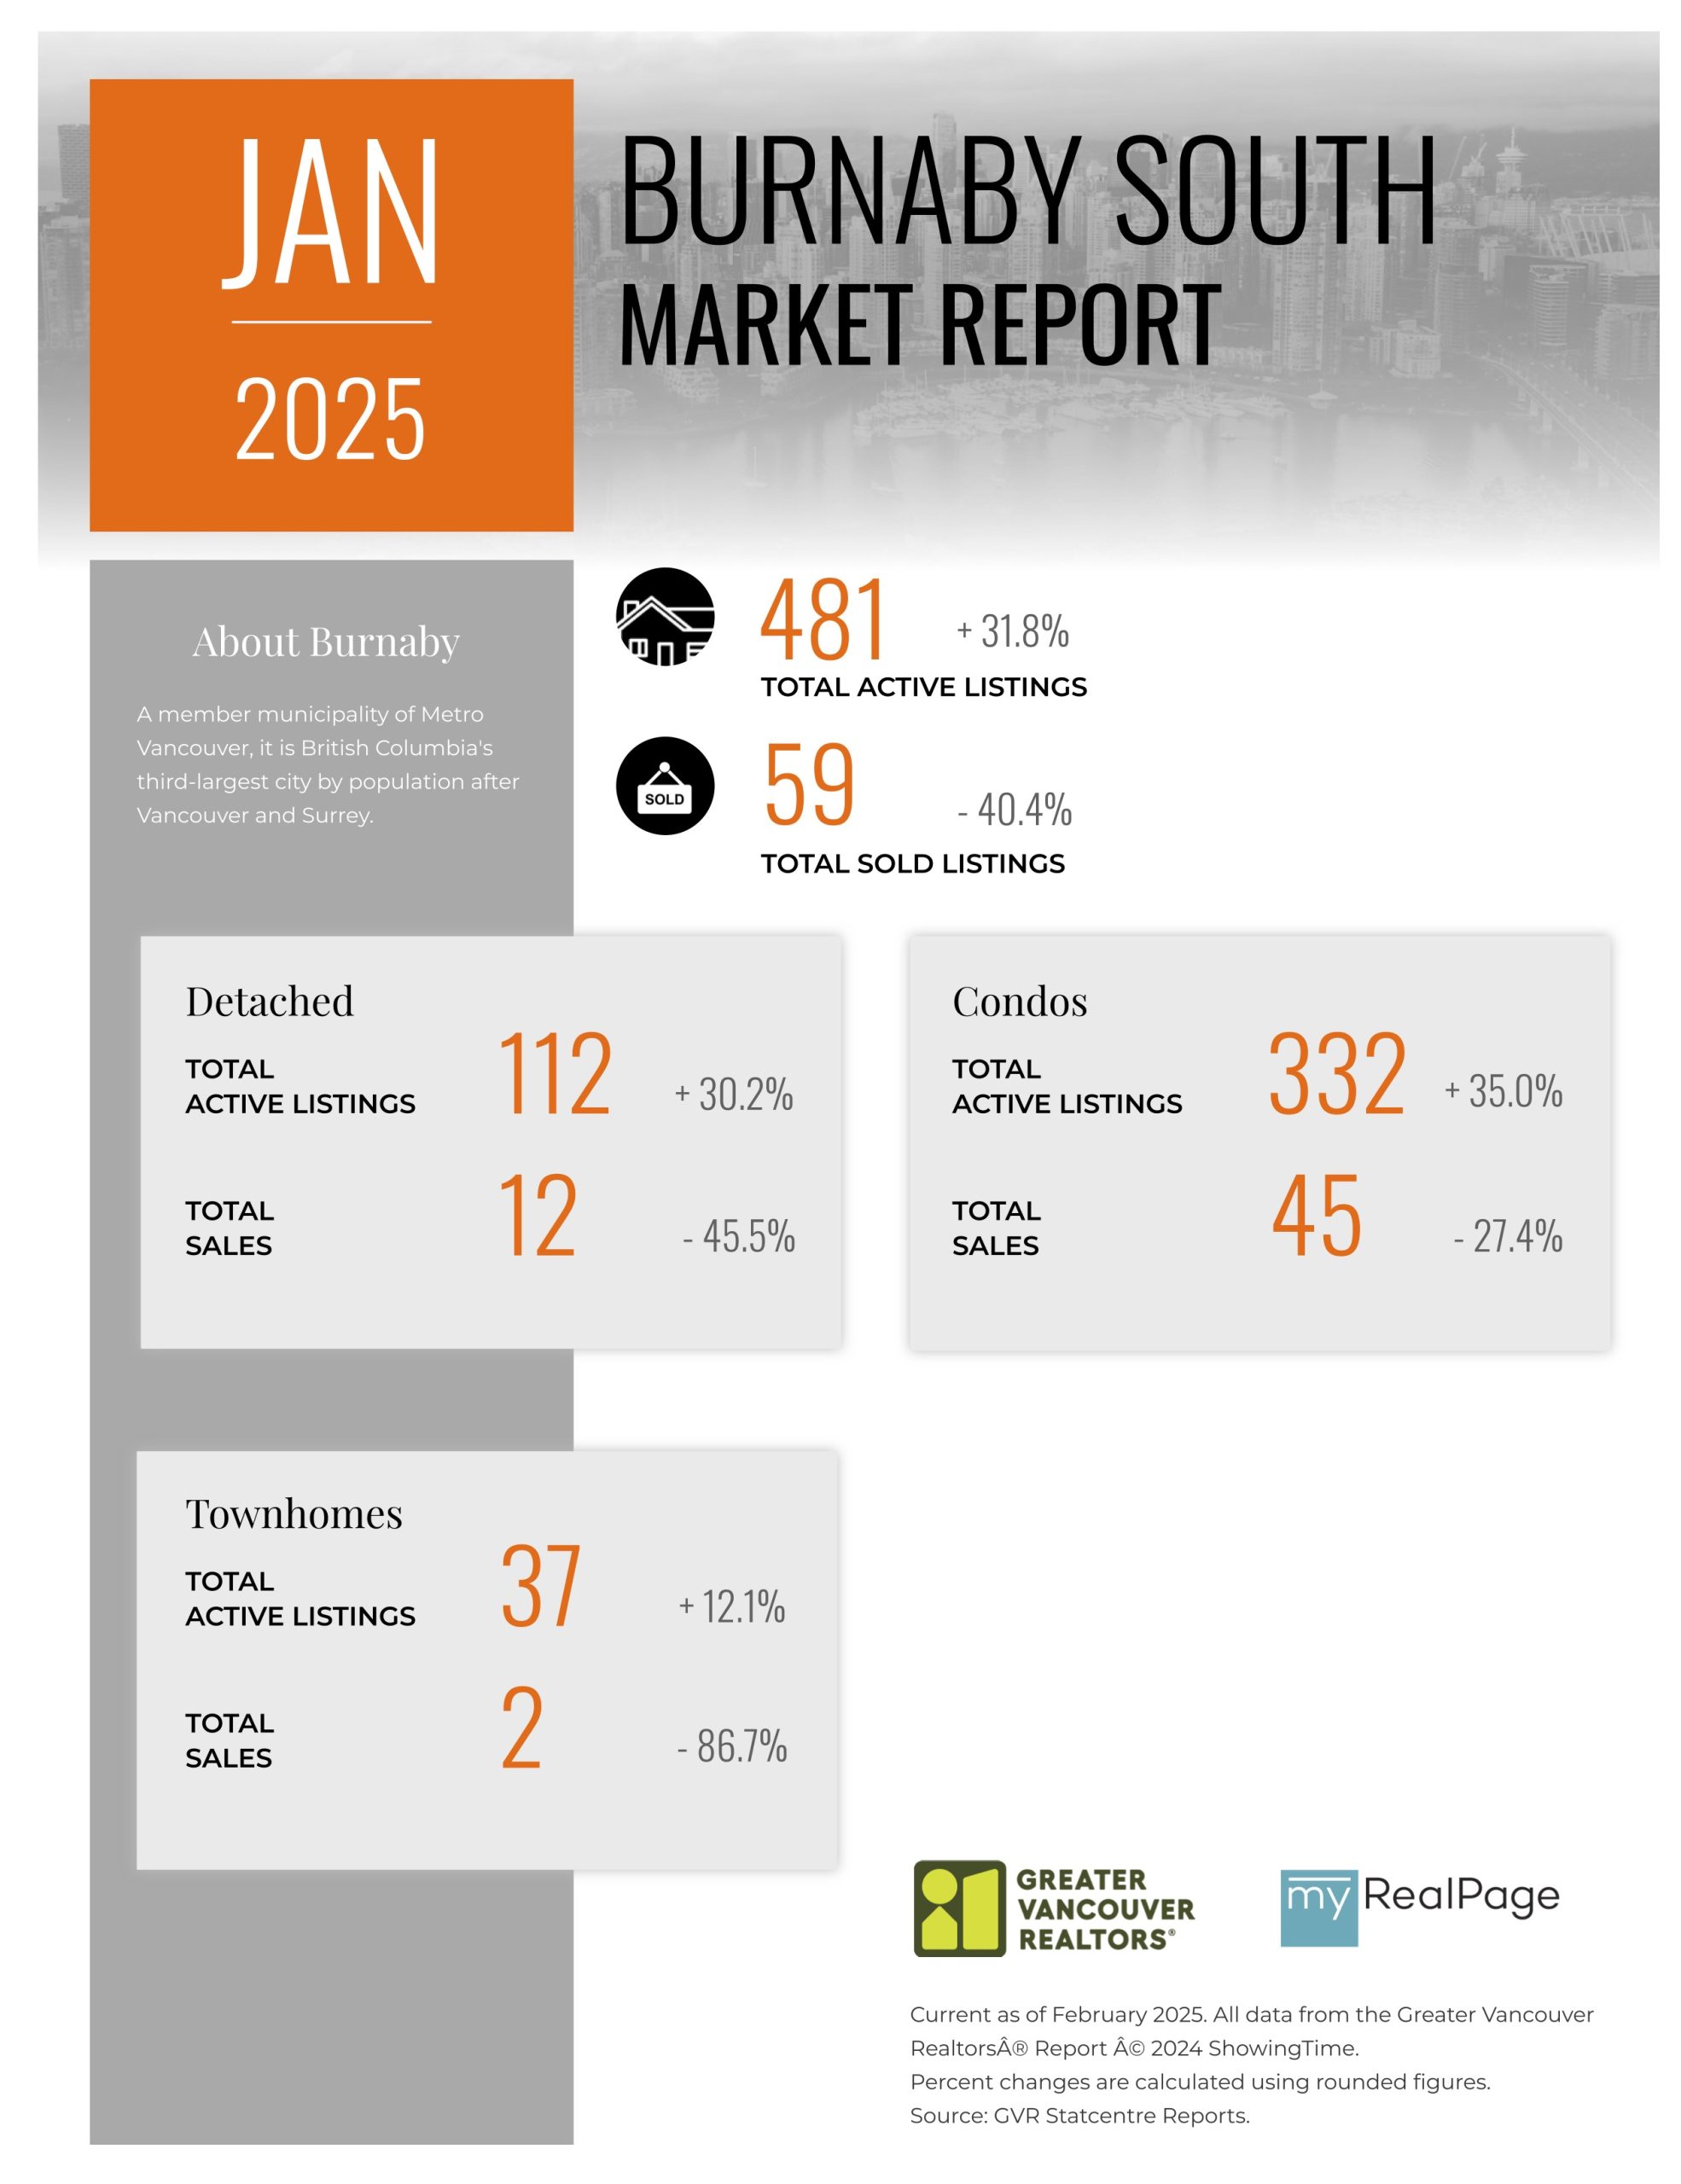
Printable Version – GVR January 2025 Data Infographics Report Burnaby South
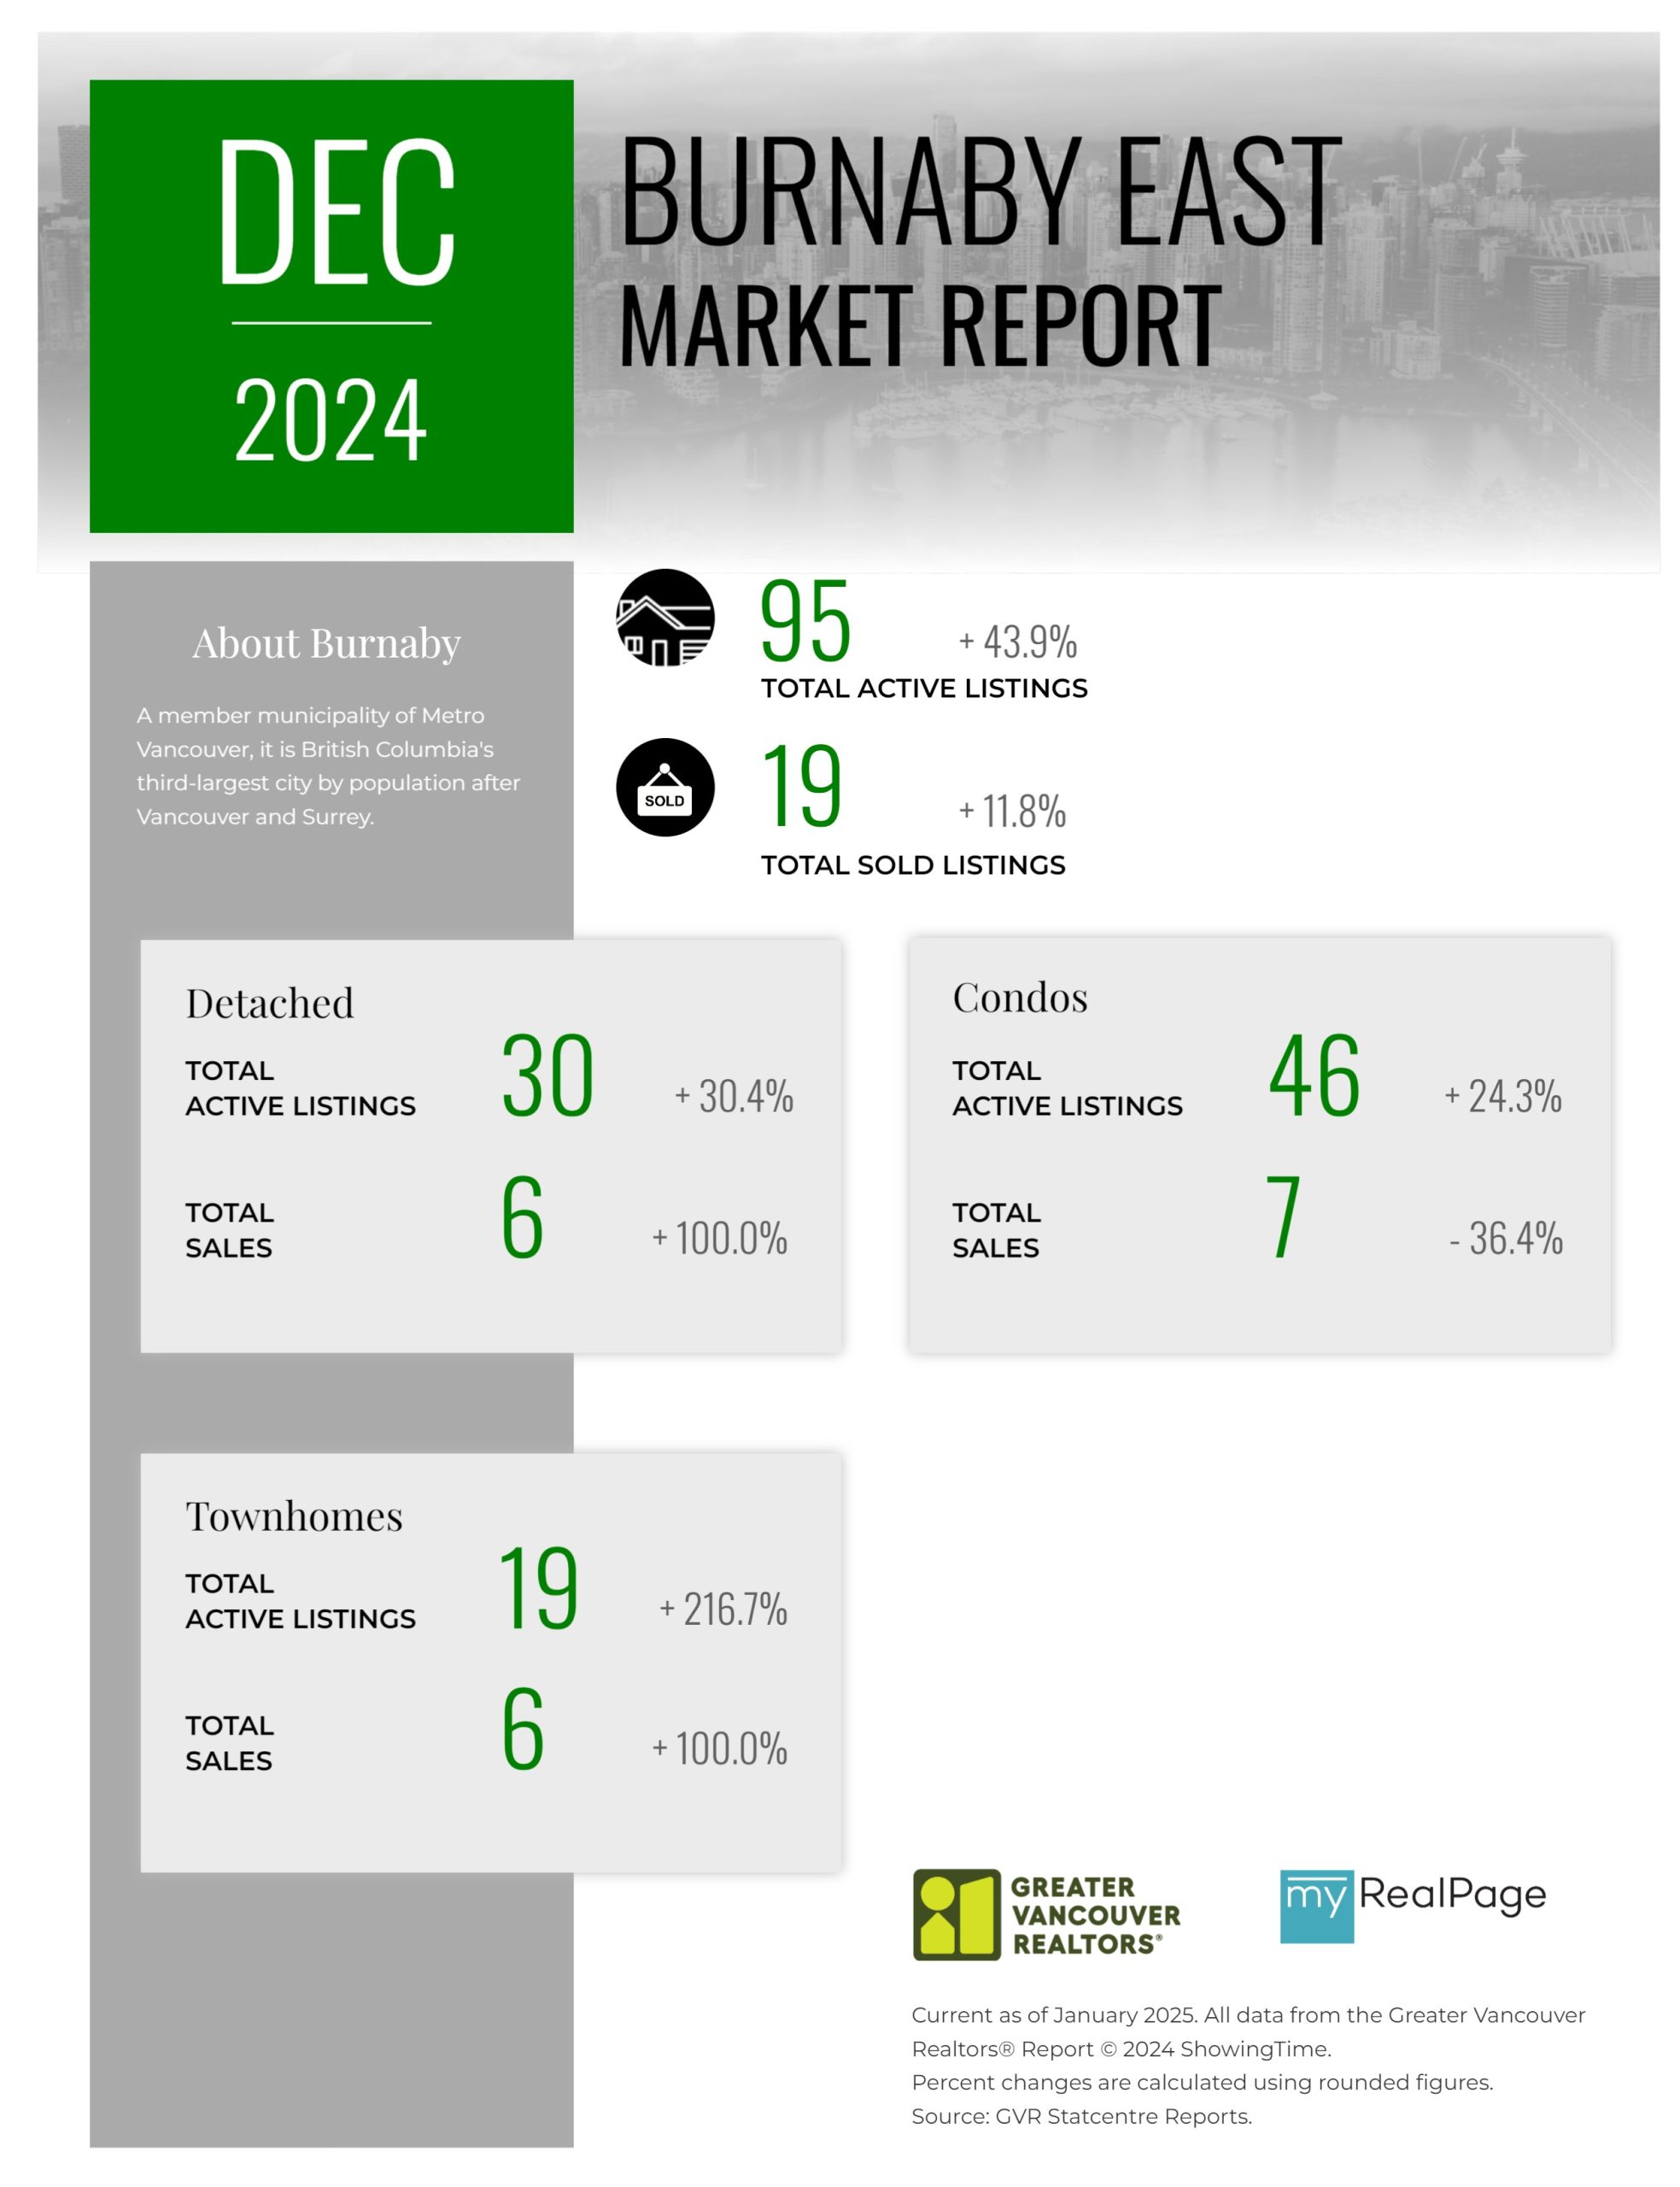
Printable Version – GVR January 2025 Data Infographics Report Burnaby East
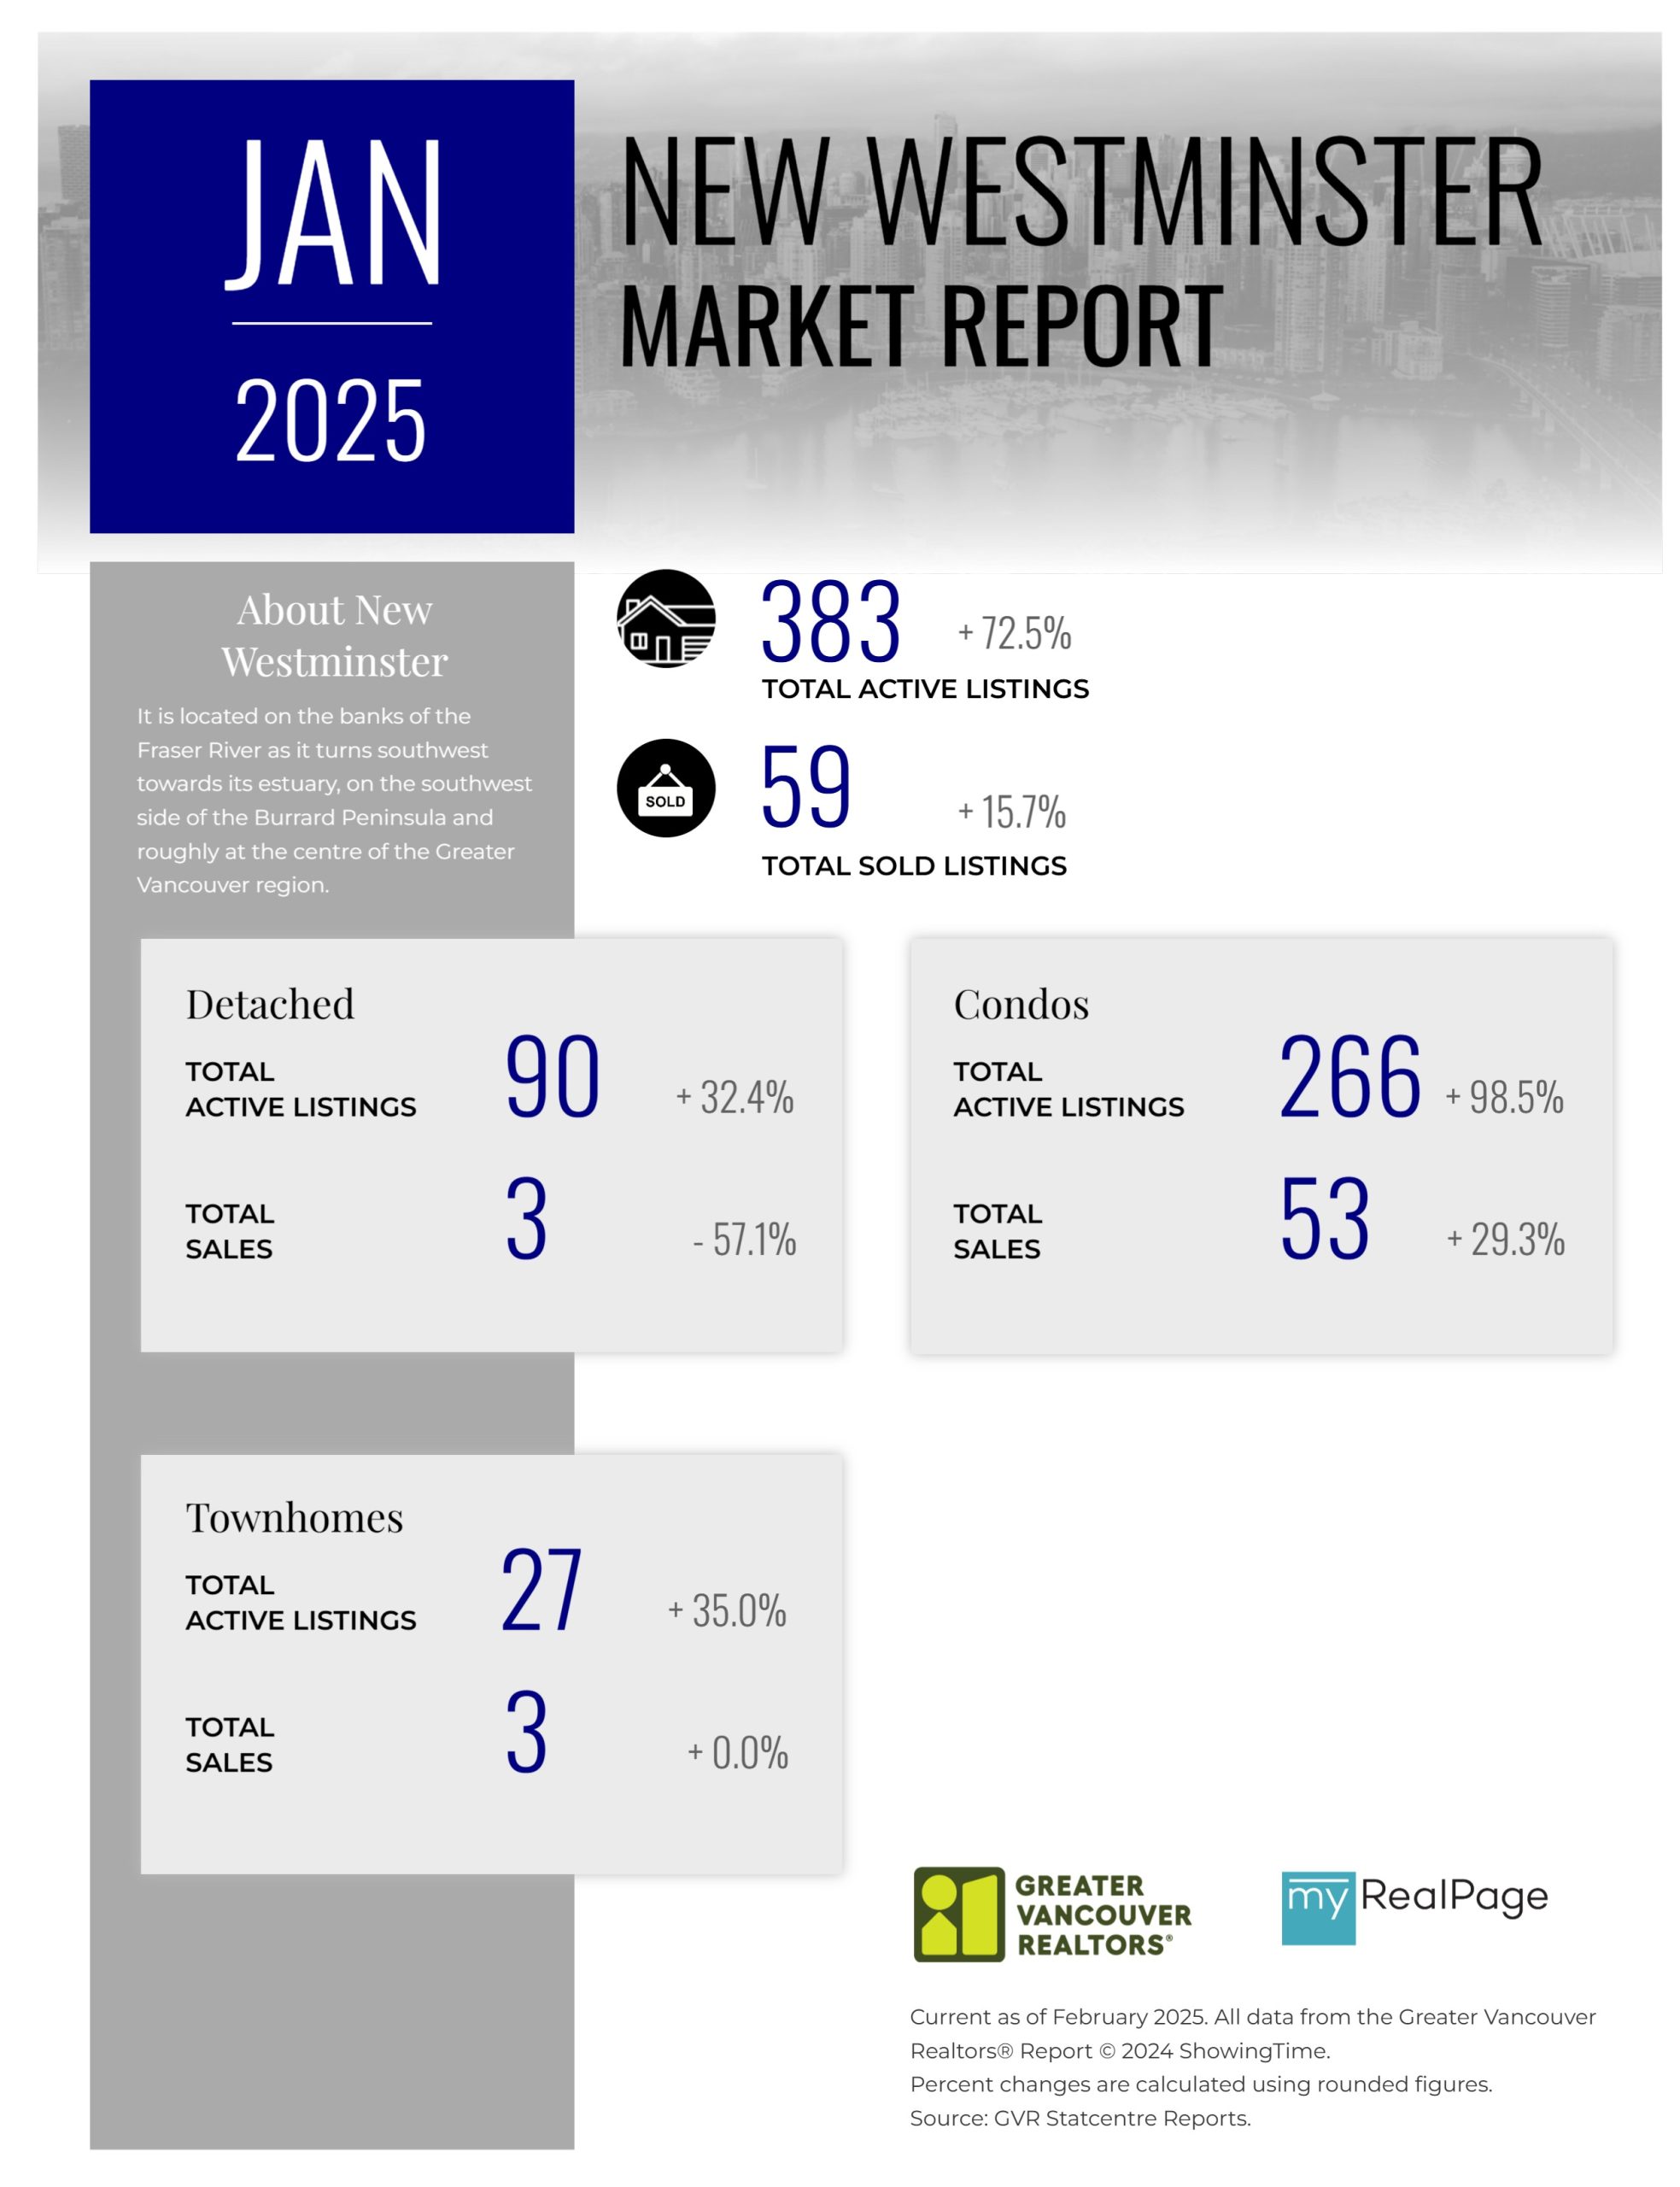
Printable Version – GVR January 2025 Data Infographics Report New Westminster
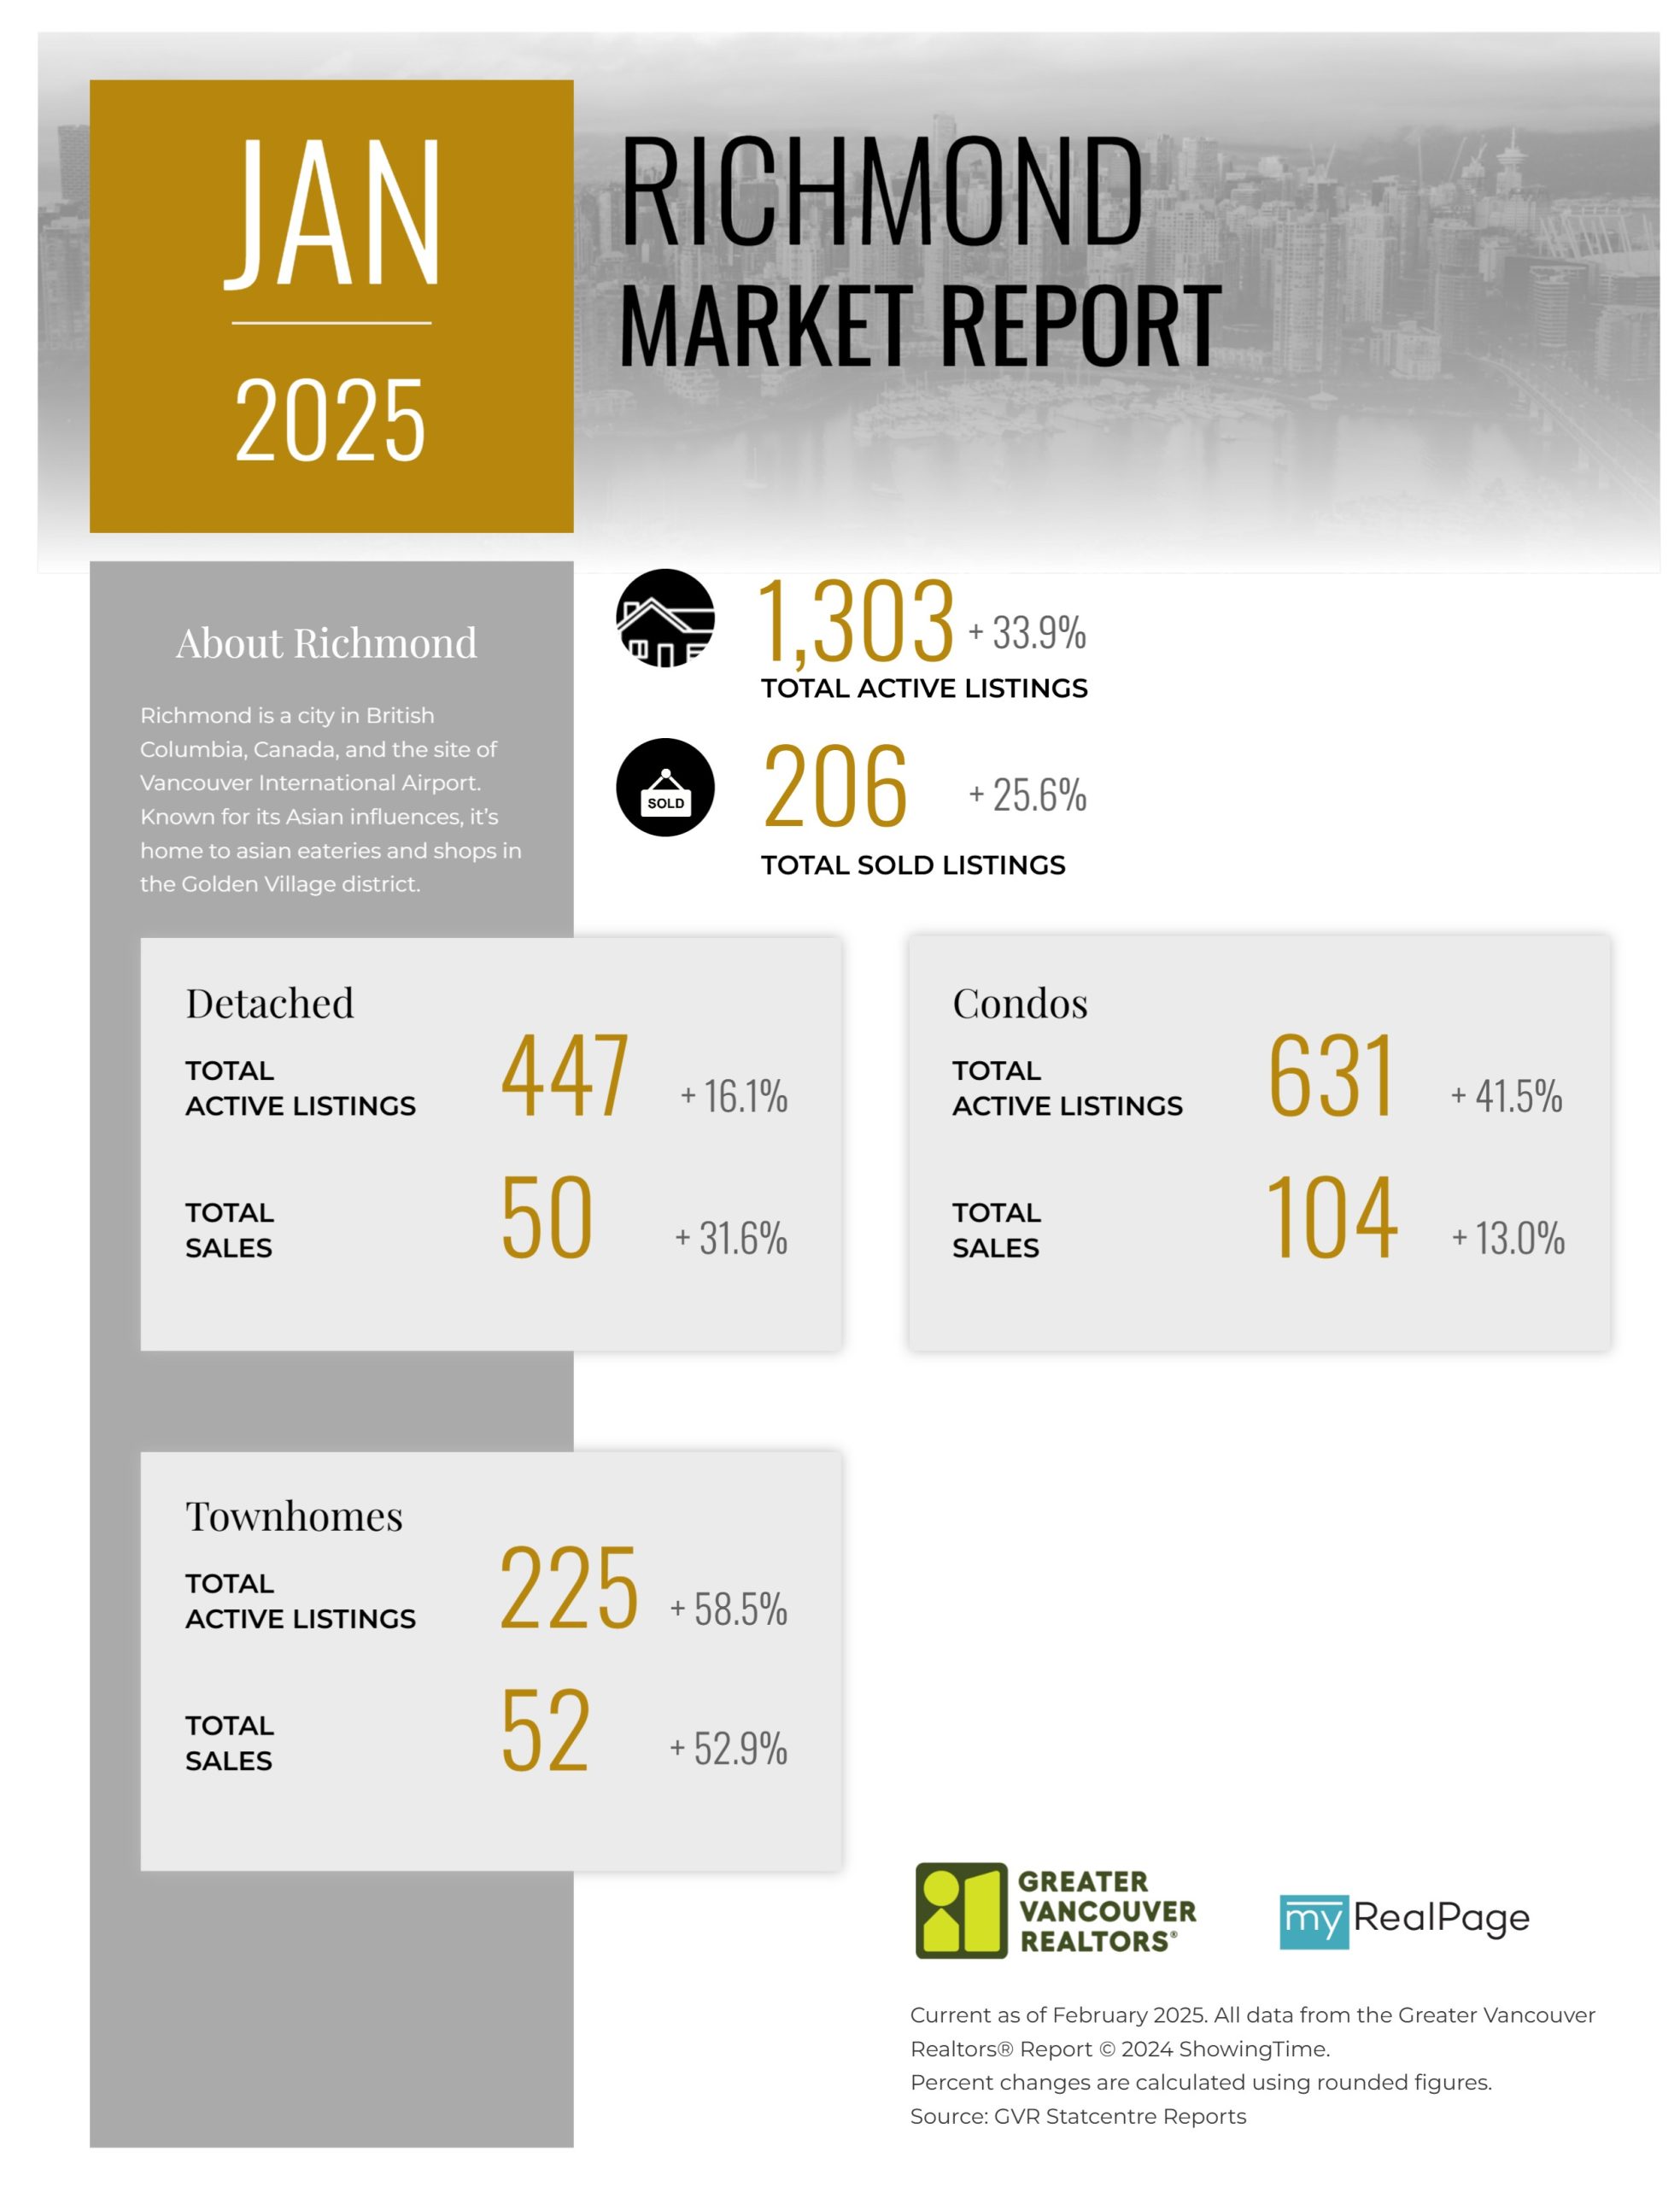
Printable Version – GVR January 2025 Data Infographics Report Richmond
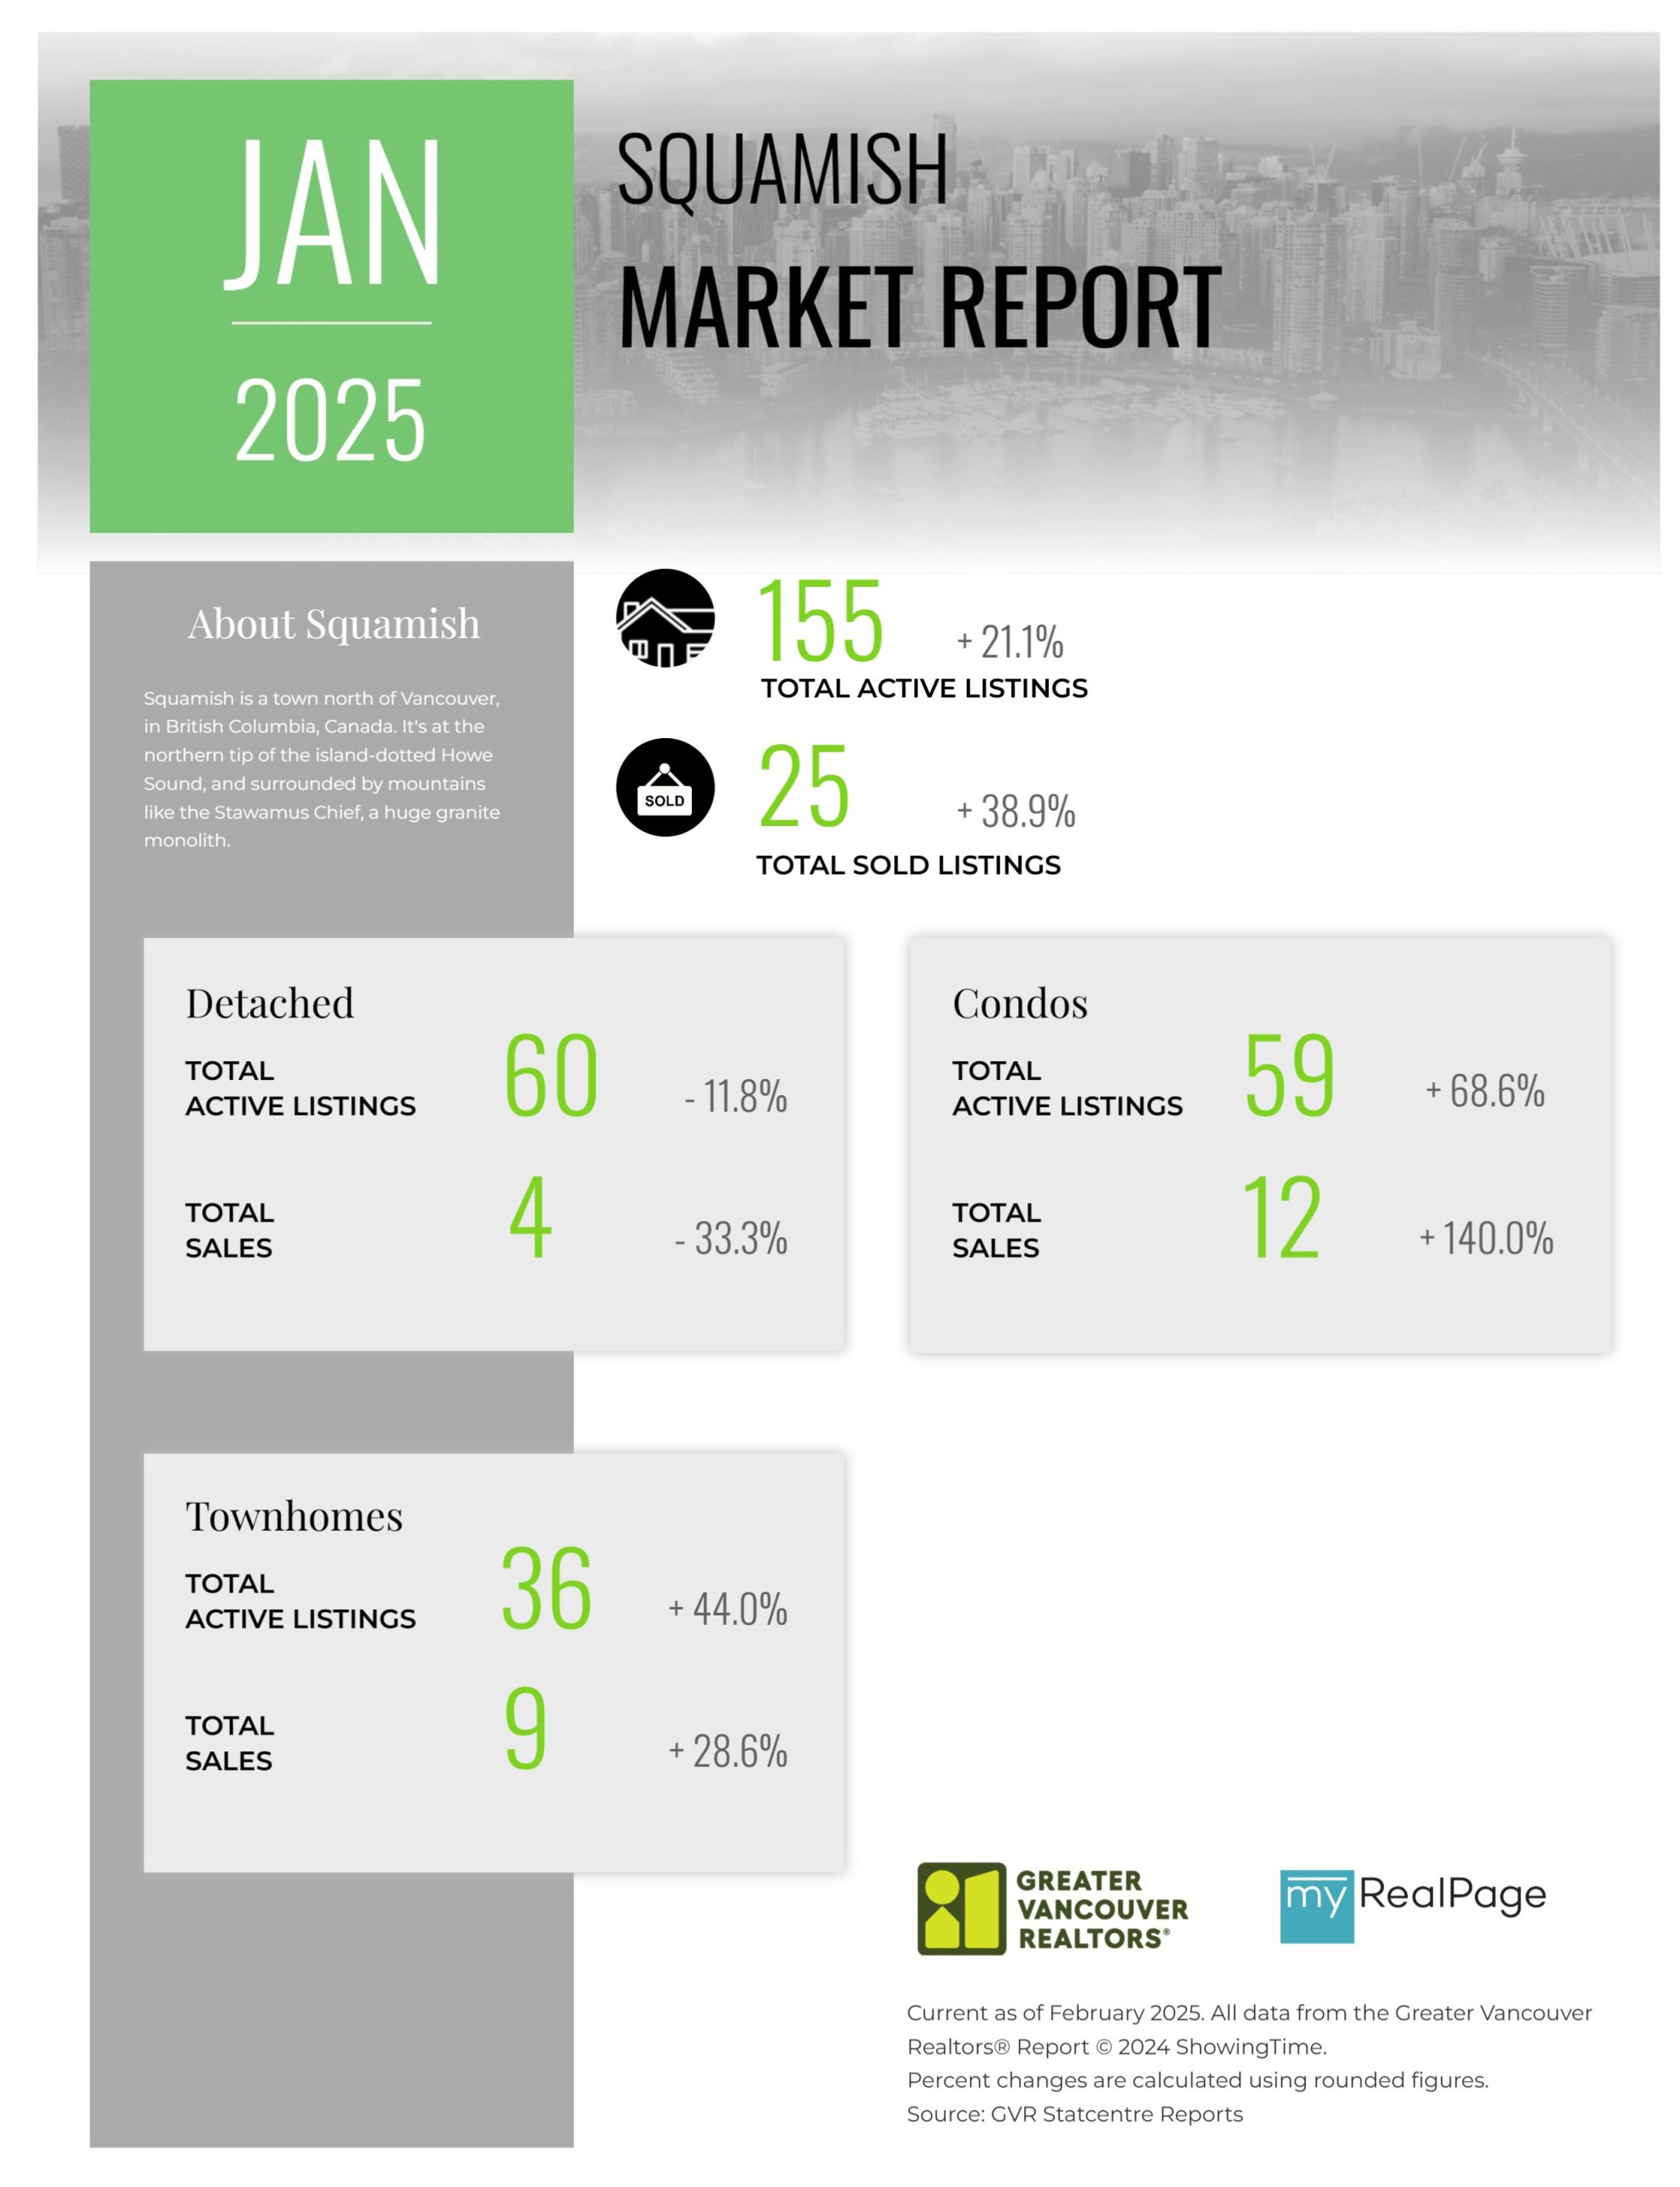
Printable Version – GVR January 2025 Data Infographics Report Squamish
Last Updated on February 27, 2026 by myRealPage
