INFOGRAPHICS: May 2025 GVR Greater Vancouver Market Reports

Buyers remain hesitant as inventory builds
Inventory levels across Metro Vancouver* reach another ten-year high, while home sales registered on the MLS® remained muted.
The Greater Vancouver REALTORS® (GVR) reports that residential sales in the region totalled 2,228 in May 2025, an 18.5 per cent decrease from the 2,733 sales recorded in May 2024. This was 30.5 per cent below the 10-year seasonal average (3,206).
“While there are emerging signs that sales activity might be turning a corner, sales in May were below the ten-year seasonal average, which suggests that many some buyers are still sitting on the sidelines or are being especially selective,” said Andrew Lis, GVR’s director of economics and data analytics. “On a year-to-date basis, sales in 2025 rank among the slowest to start the year in the past decade, closely mirroring the trends seen in 2019 and 2020. It’s worth noting that sales rebounded significantly in the latter half of 2020, but whether sales in 2025 might follow a similar pattern remains the million-dollar question.” said Andrew Lis, GVR director of economics and data analytics
Read the full report on the REBGV website!
The following data is a comparison between May 2025 and May 2024 numbers, and is current as of June of 2025. For last month’s update, you can check out our previous post!
Or follow this link for all our GVR Infographics!
These infographics cover current trends in several areas within the Greater Vancouver region. Click on the images for a larger view!
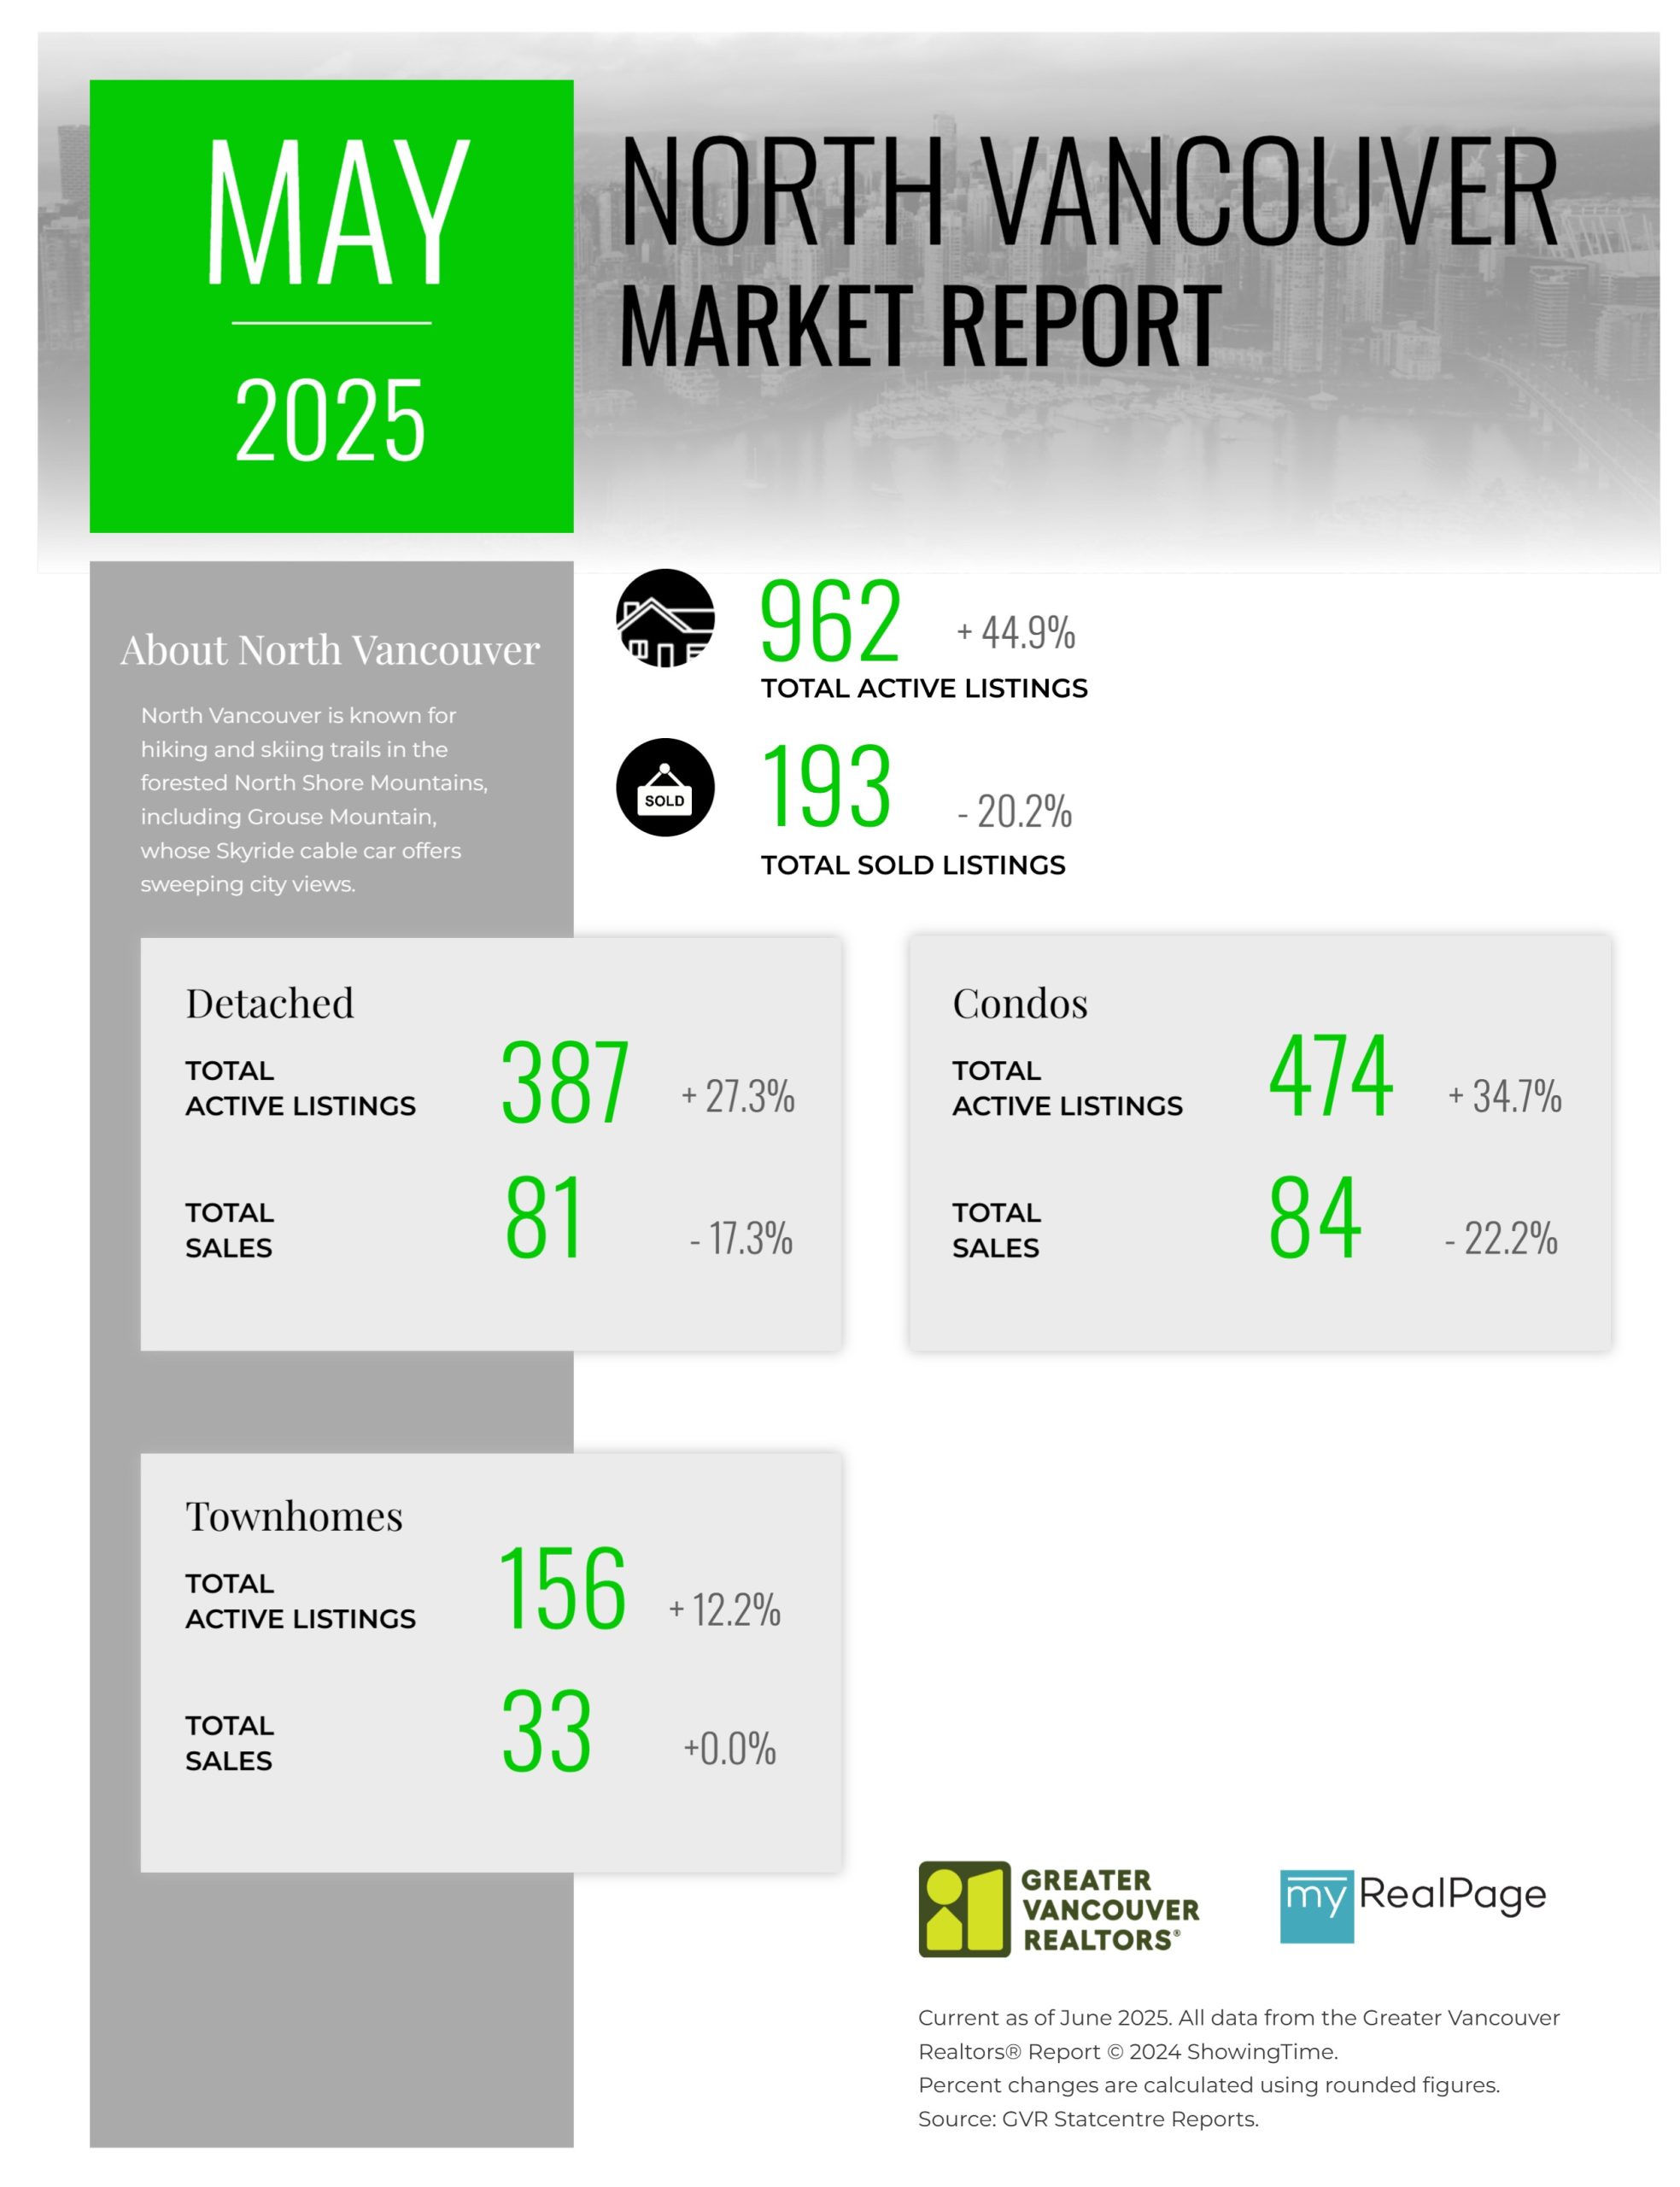
Printable Version – GVR May 2025 Data Infographic Report North Vancouver
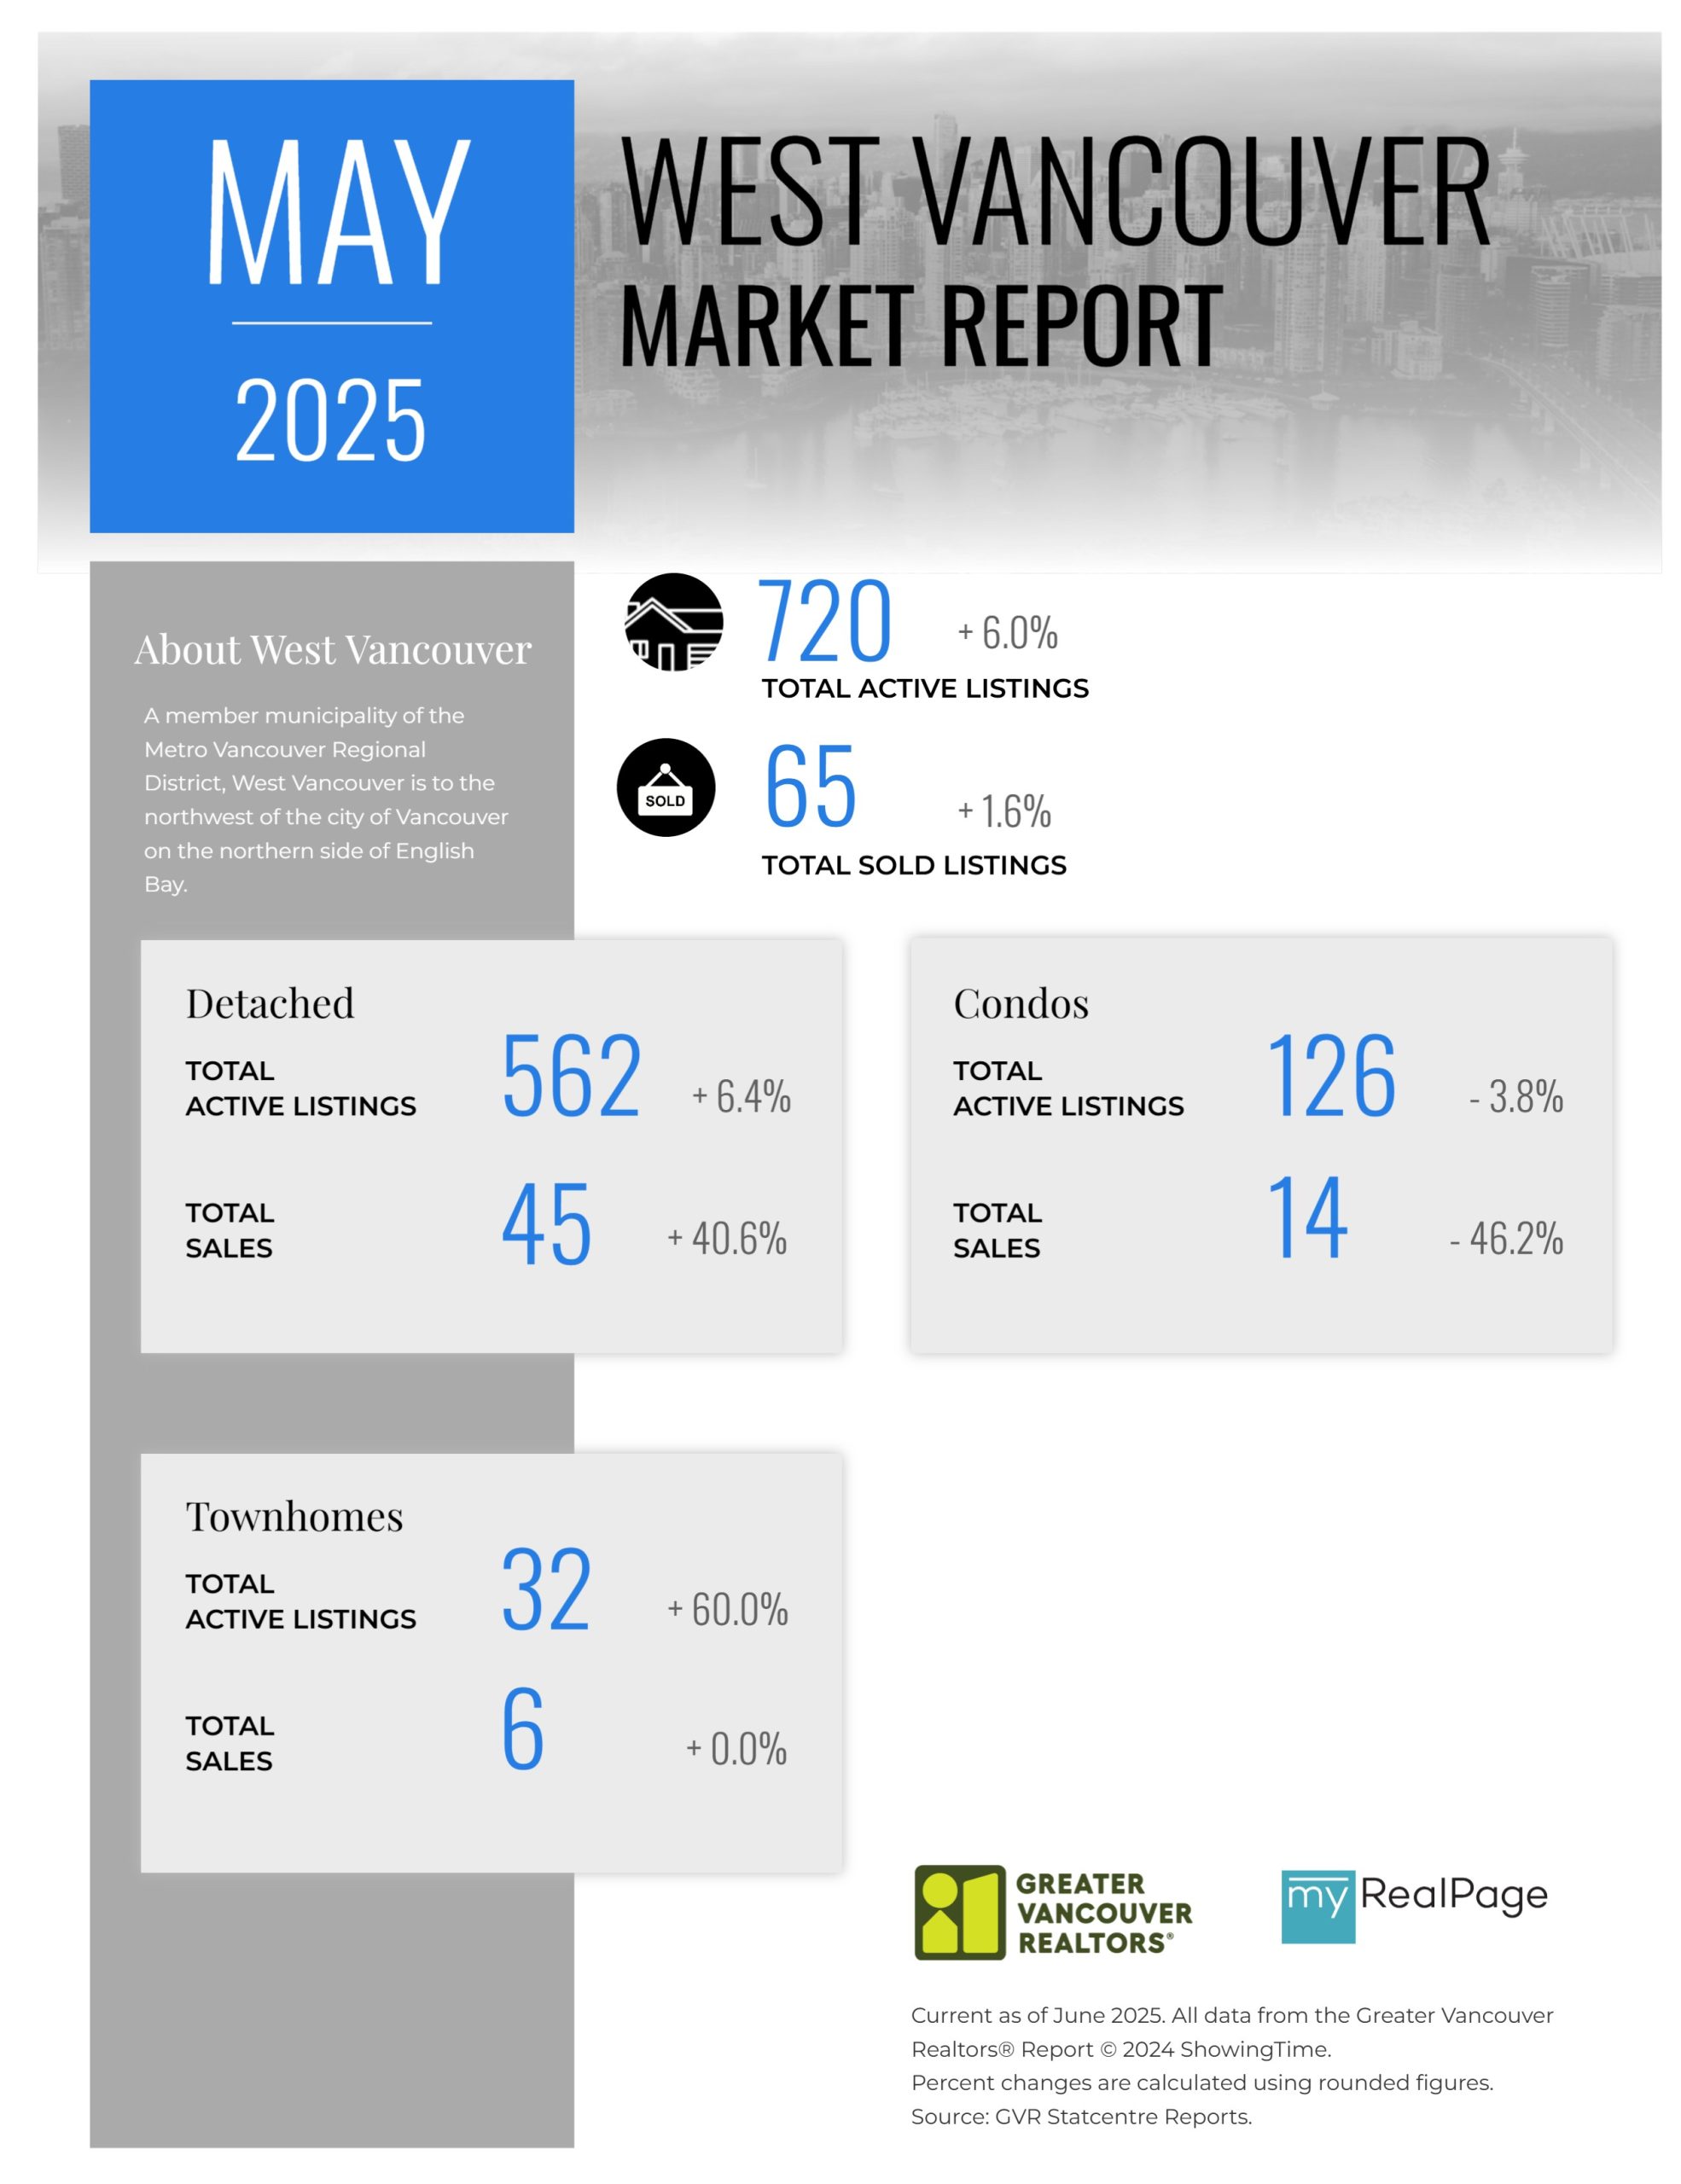
Printable Version – GVR May 2025 Data Infographics Report West Vancouver
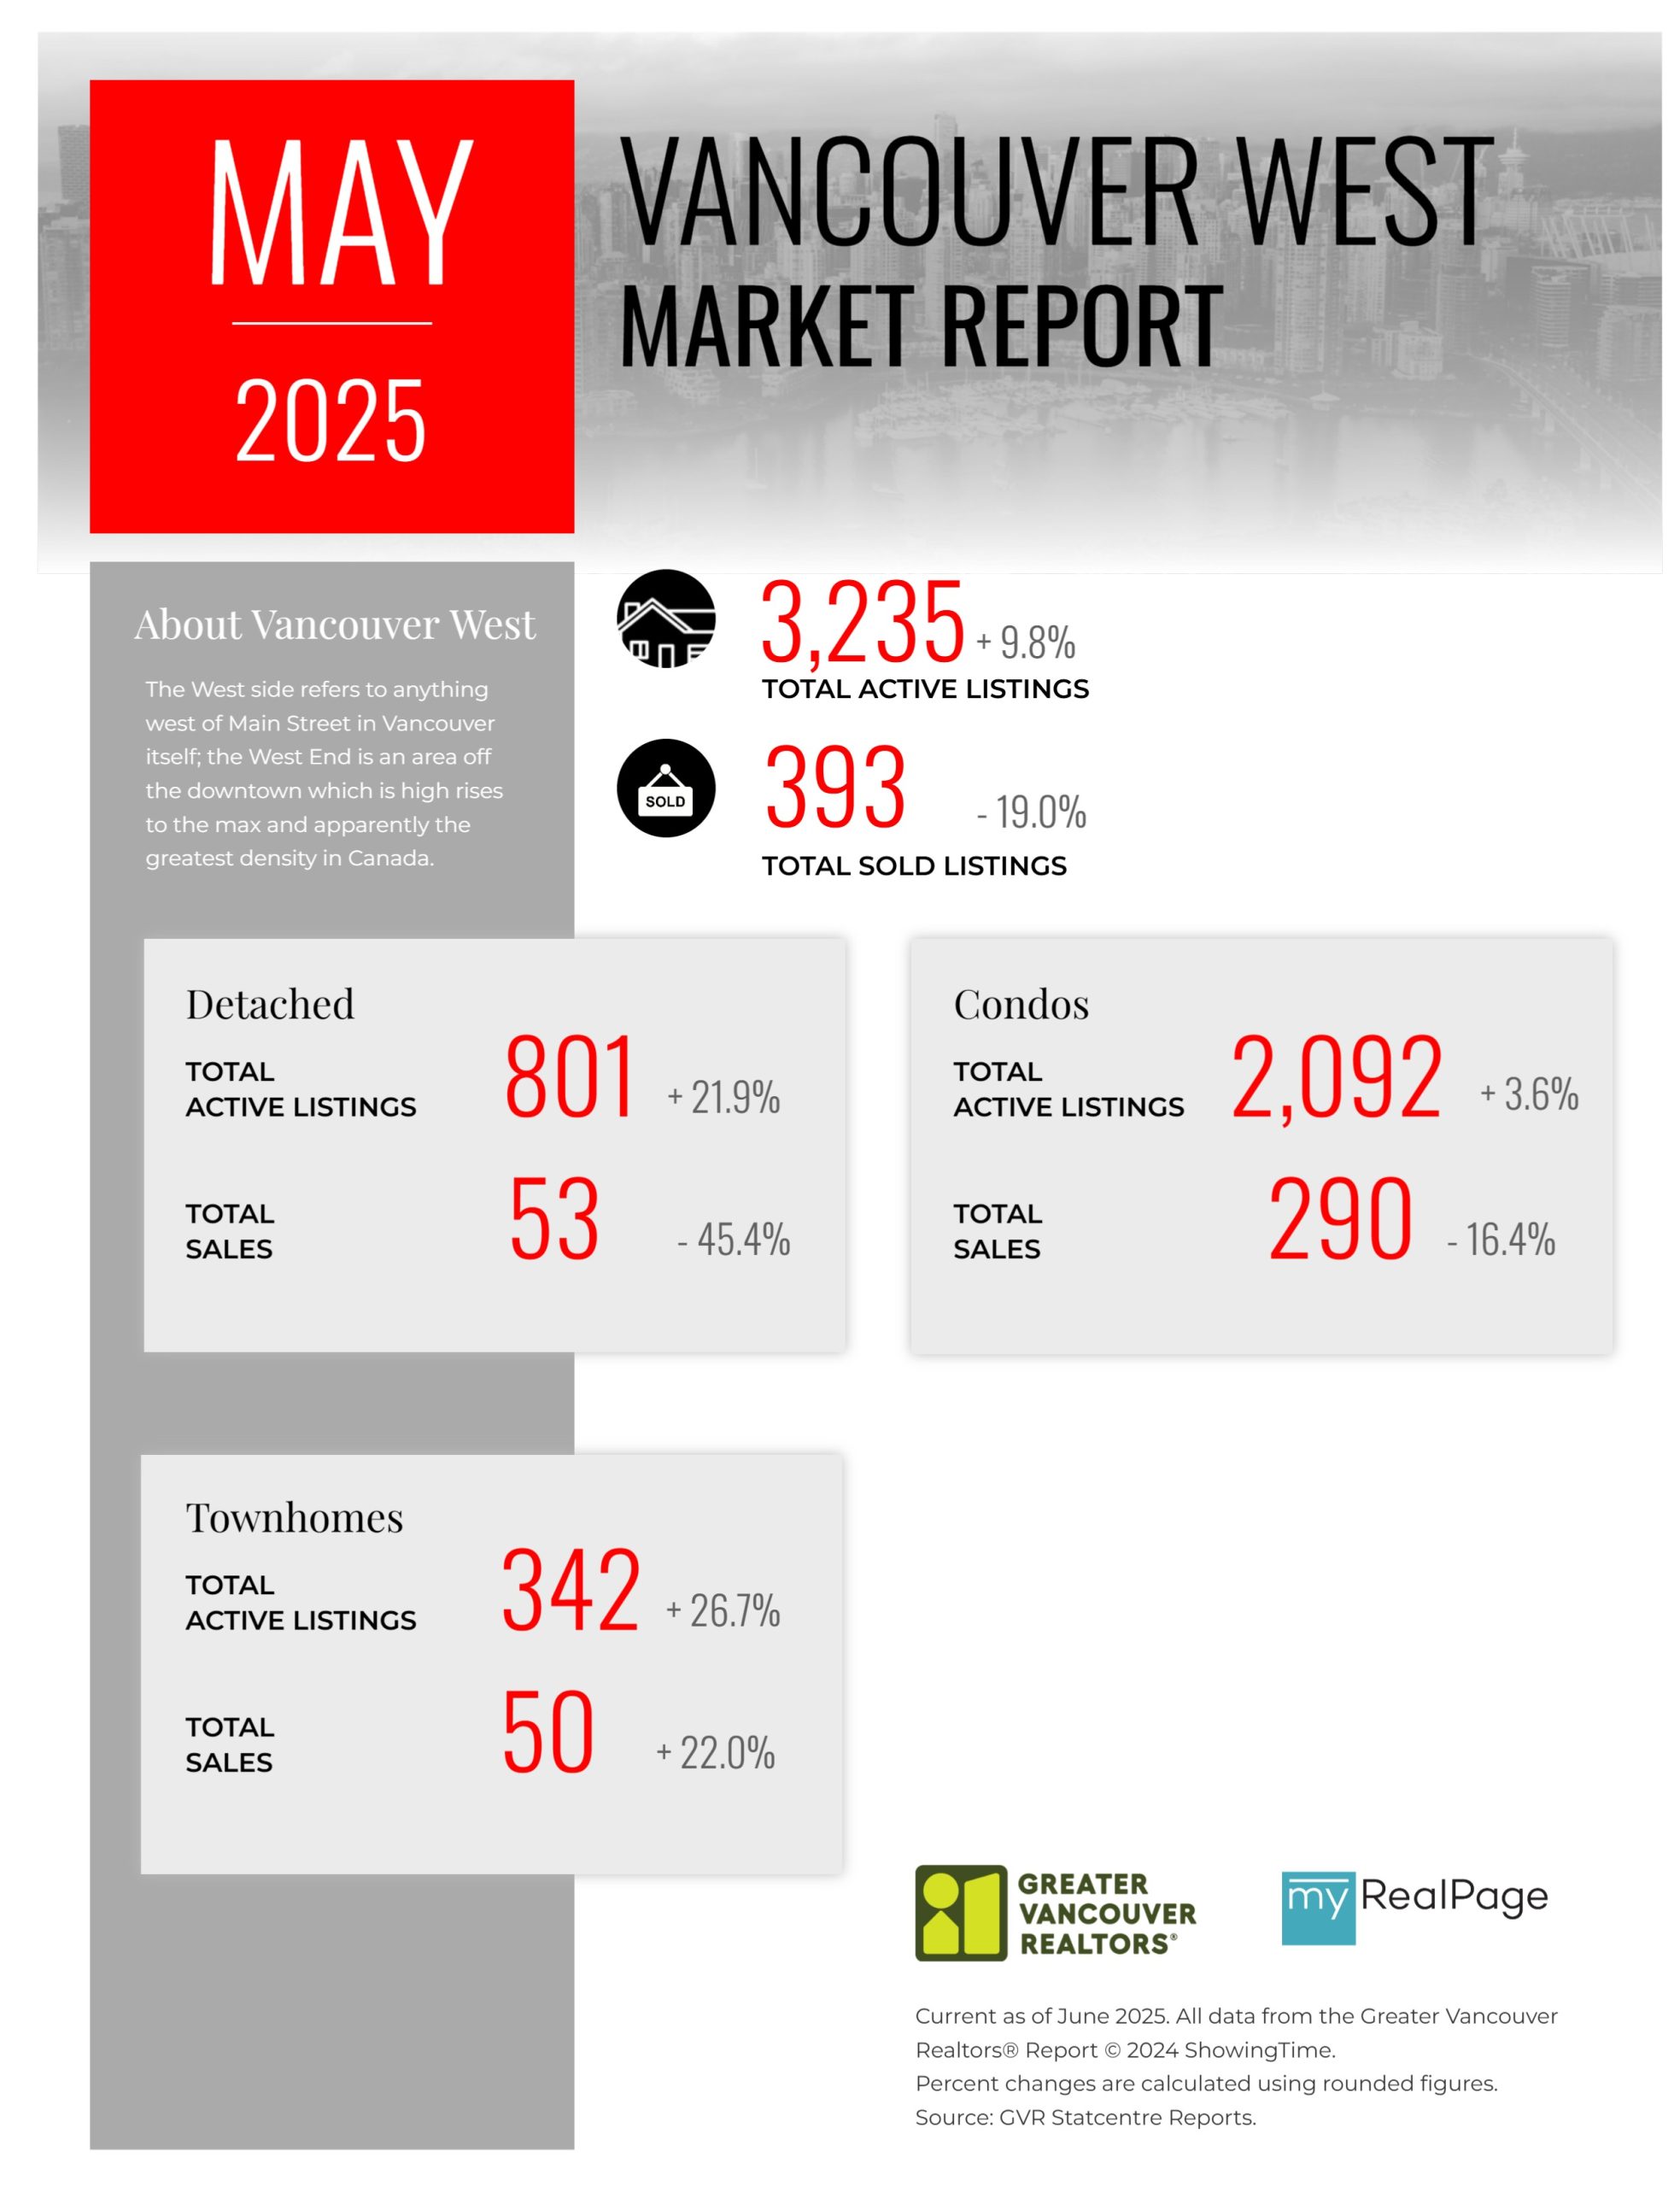
Printable Version – GVR May 2025 Data Infographics Report Vancouver West
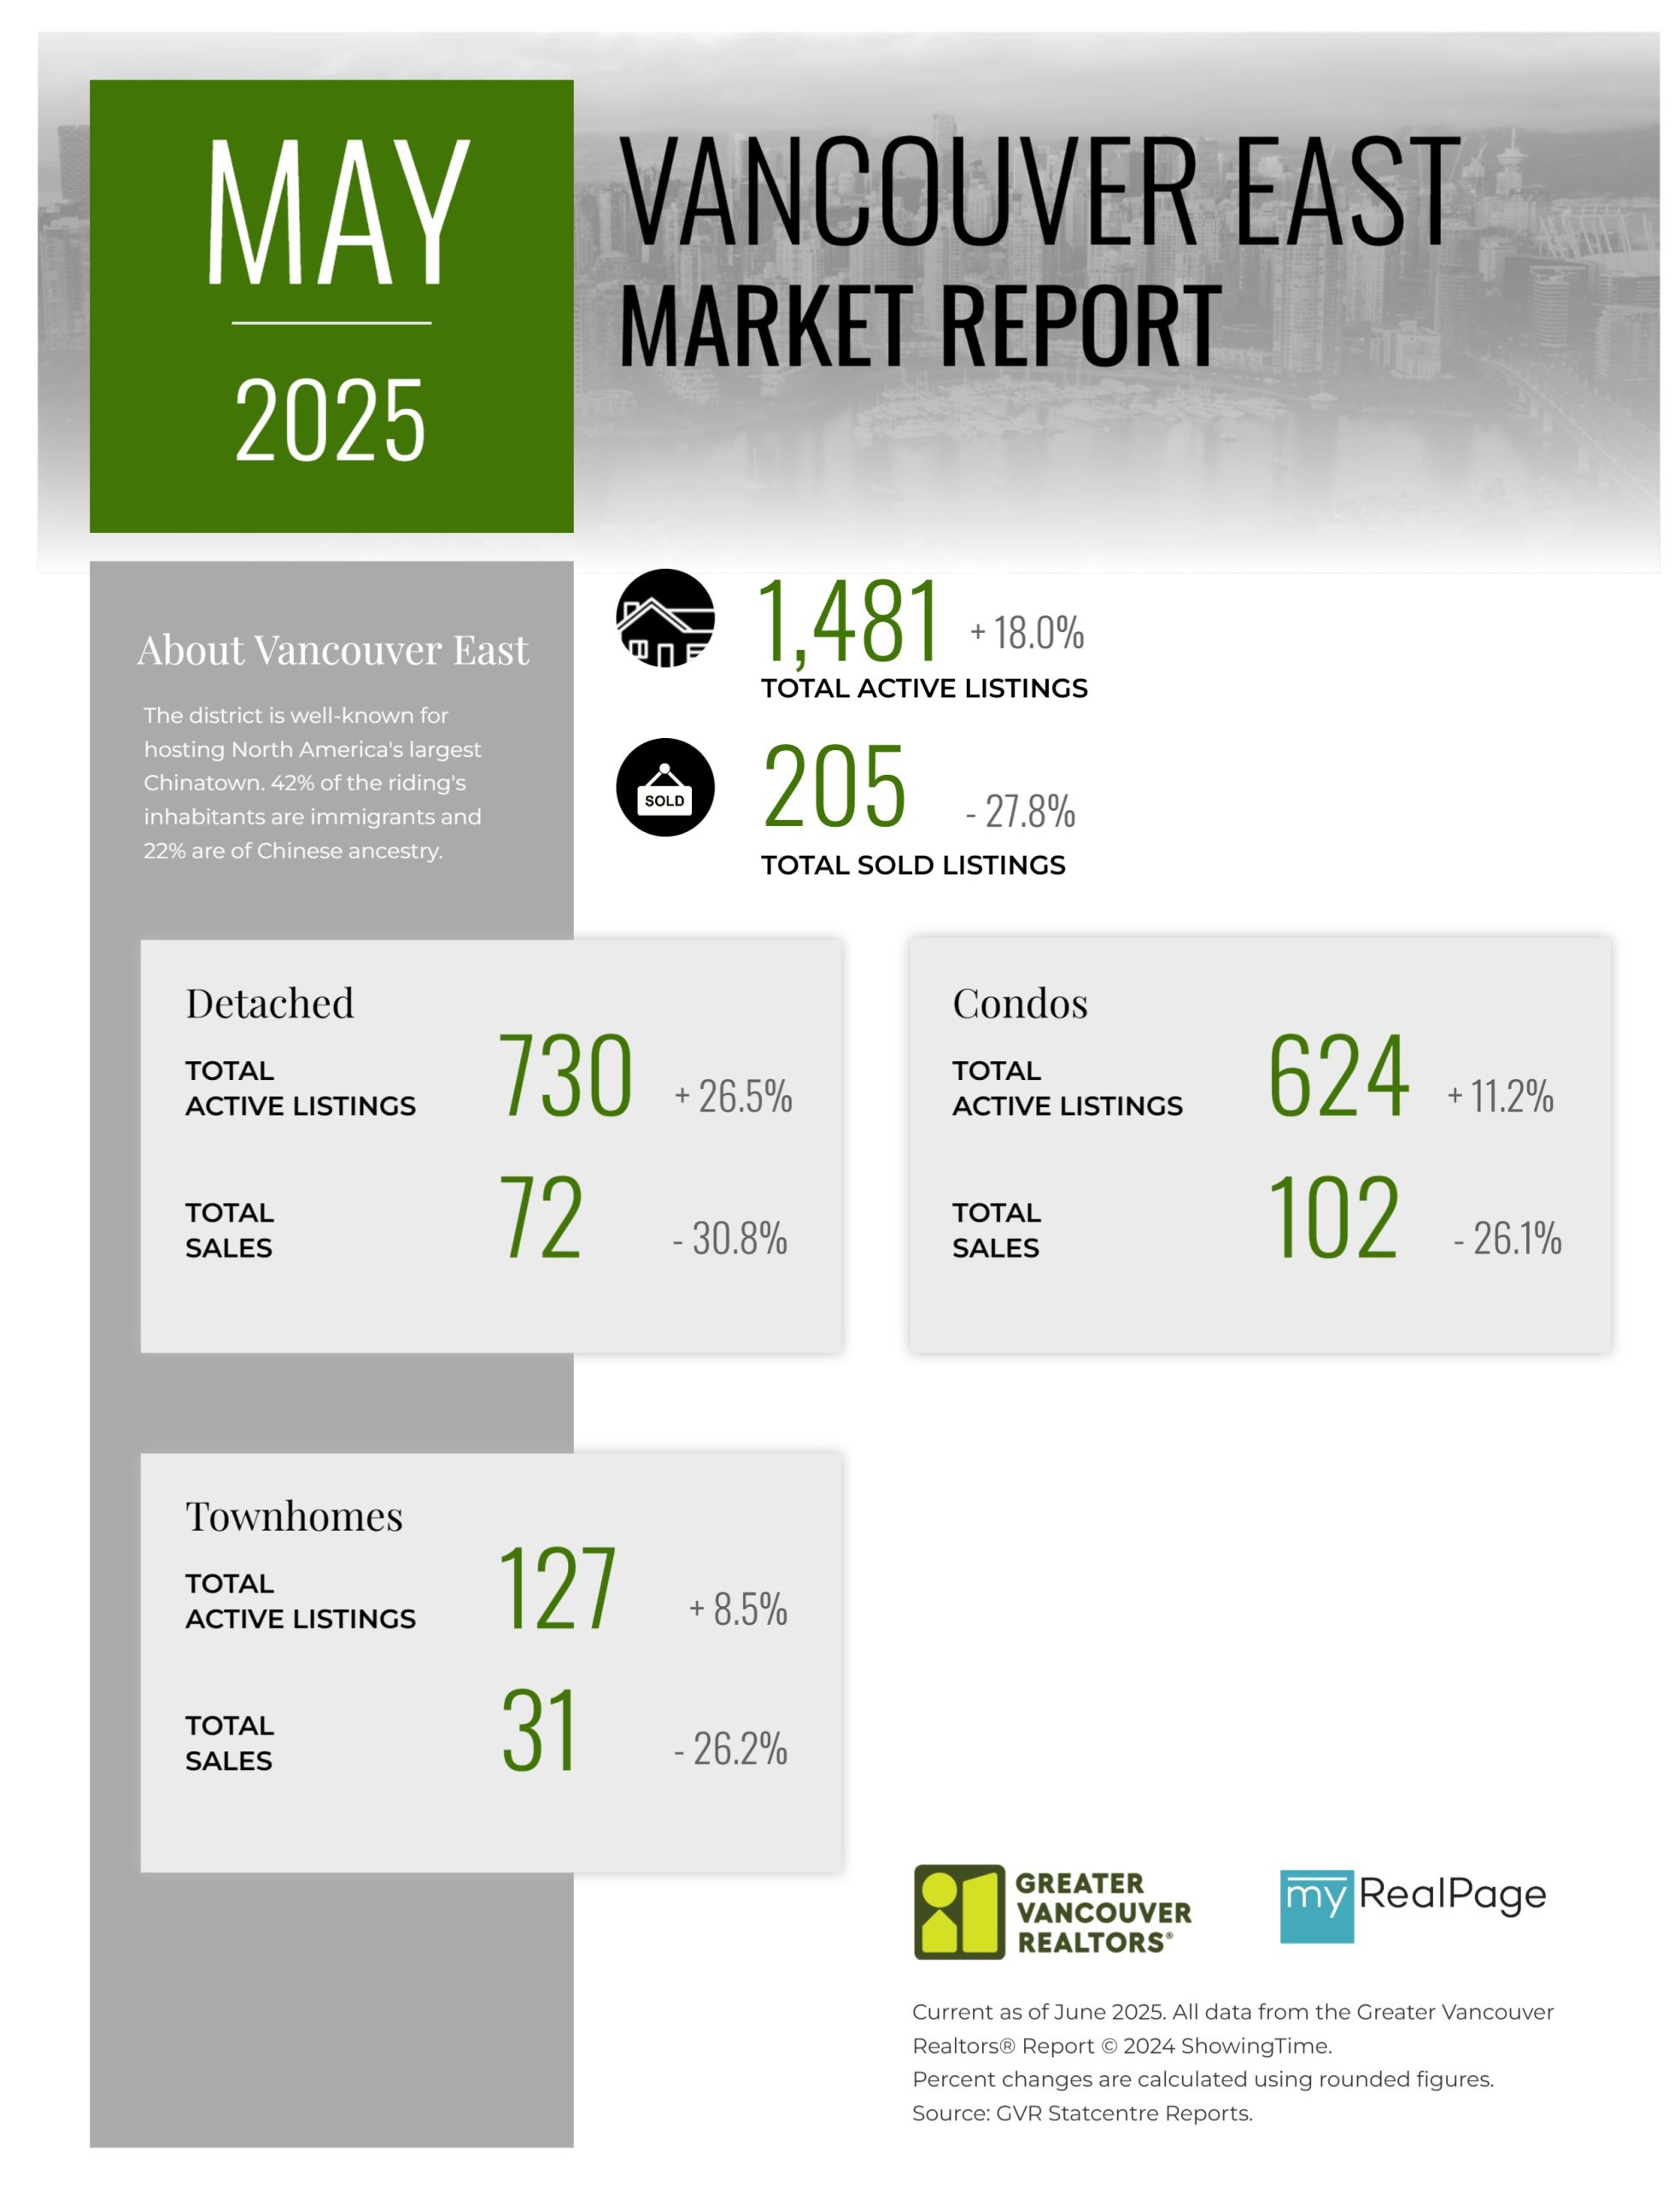
Printable Version – GVR May 2025 Data Infographics Report Vancouver East
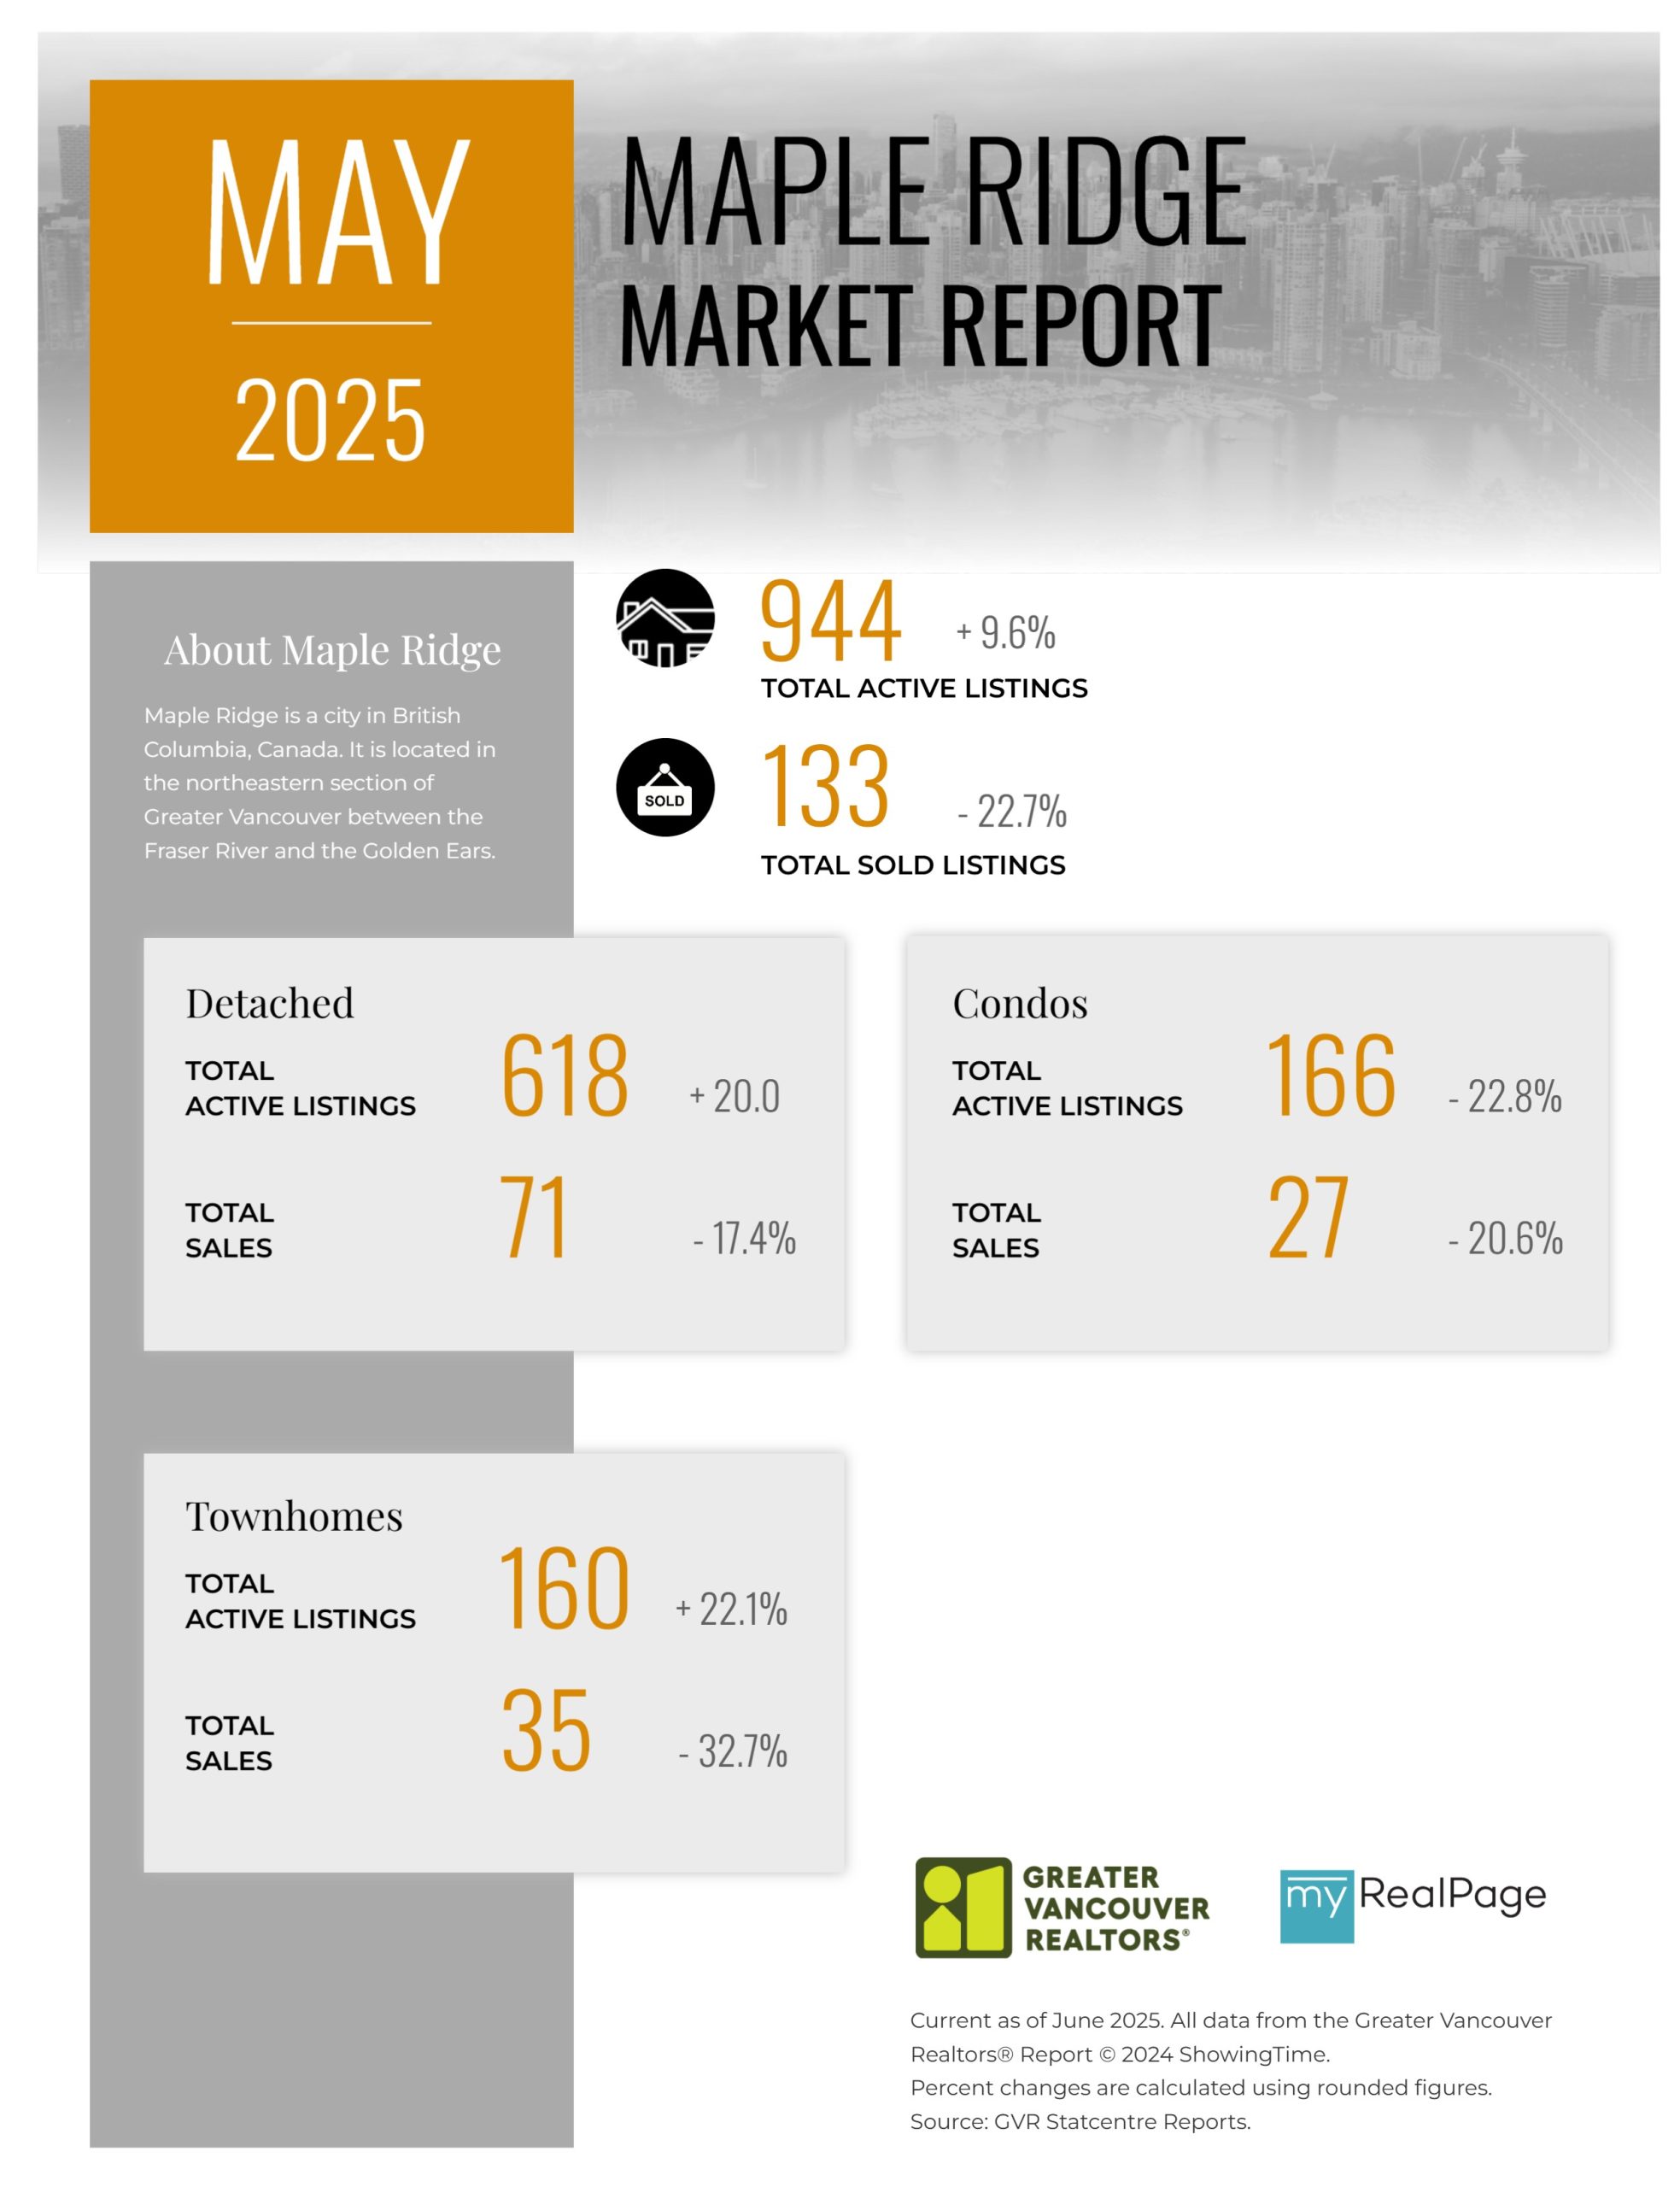
Printable Version – GVR May 2025 Data Infographic Report Maple Ridge
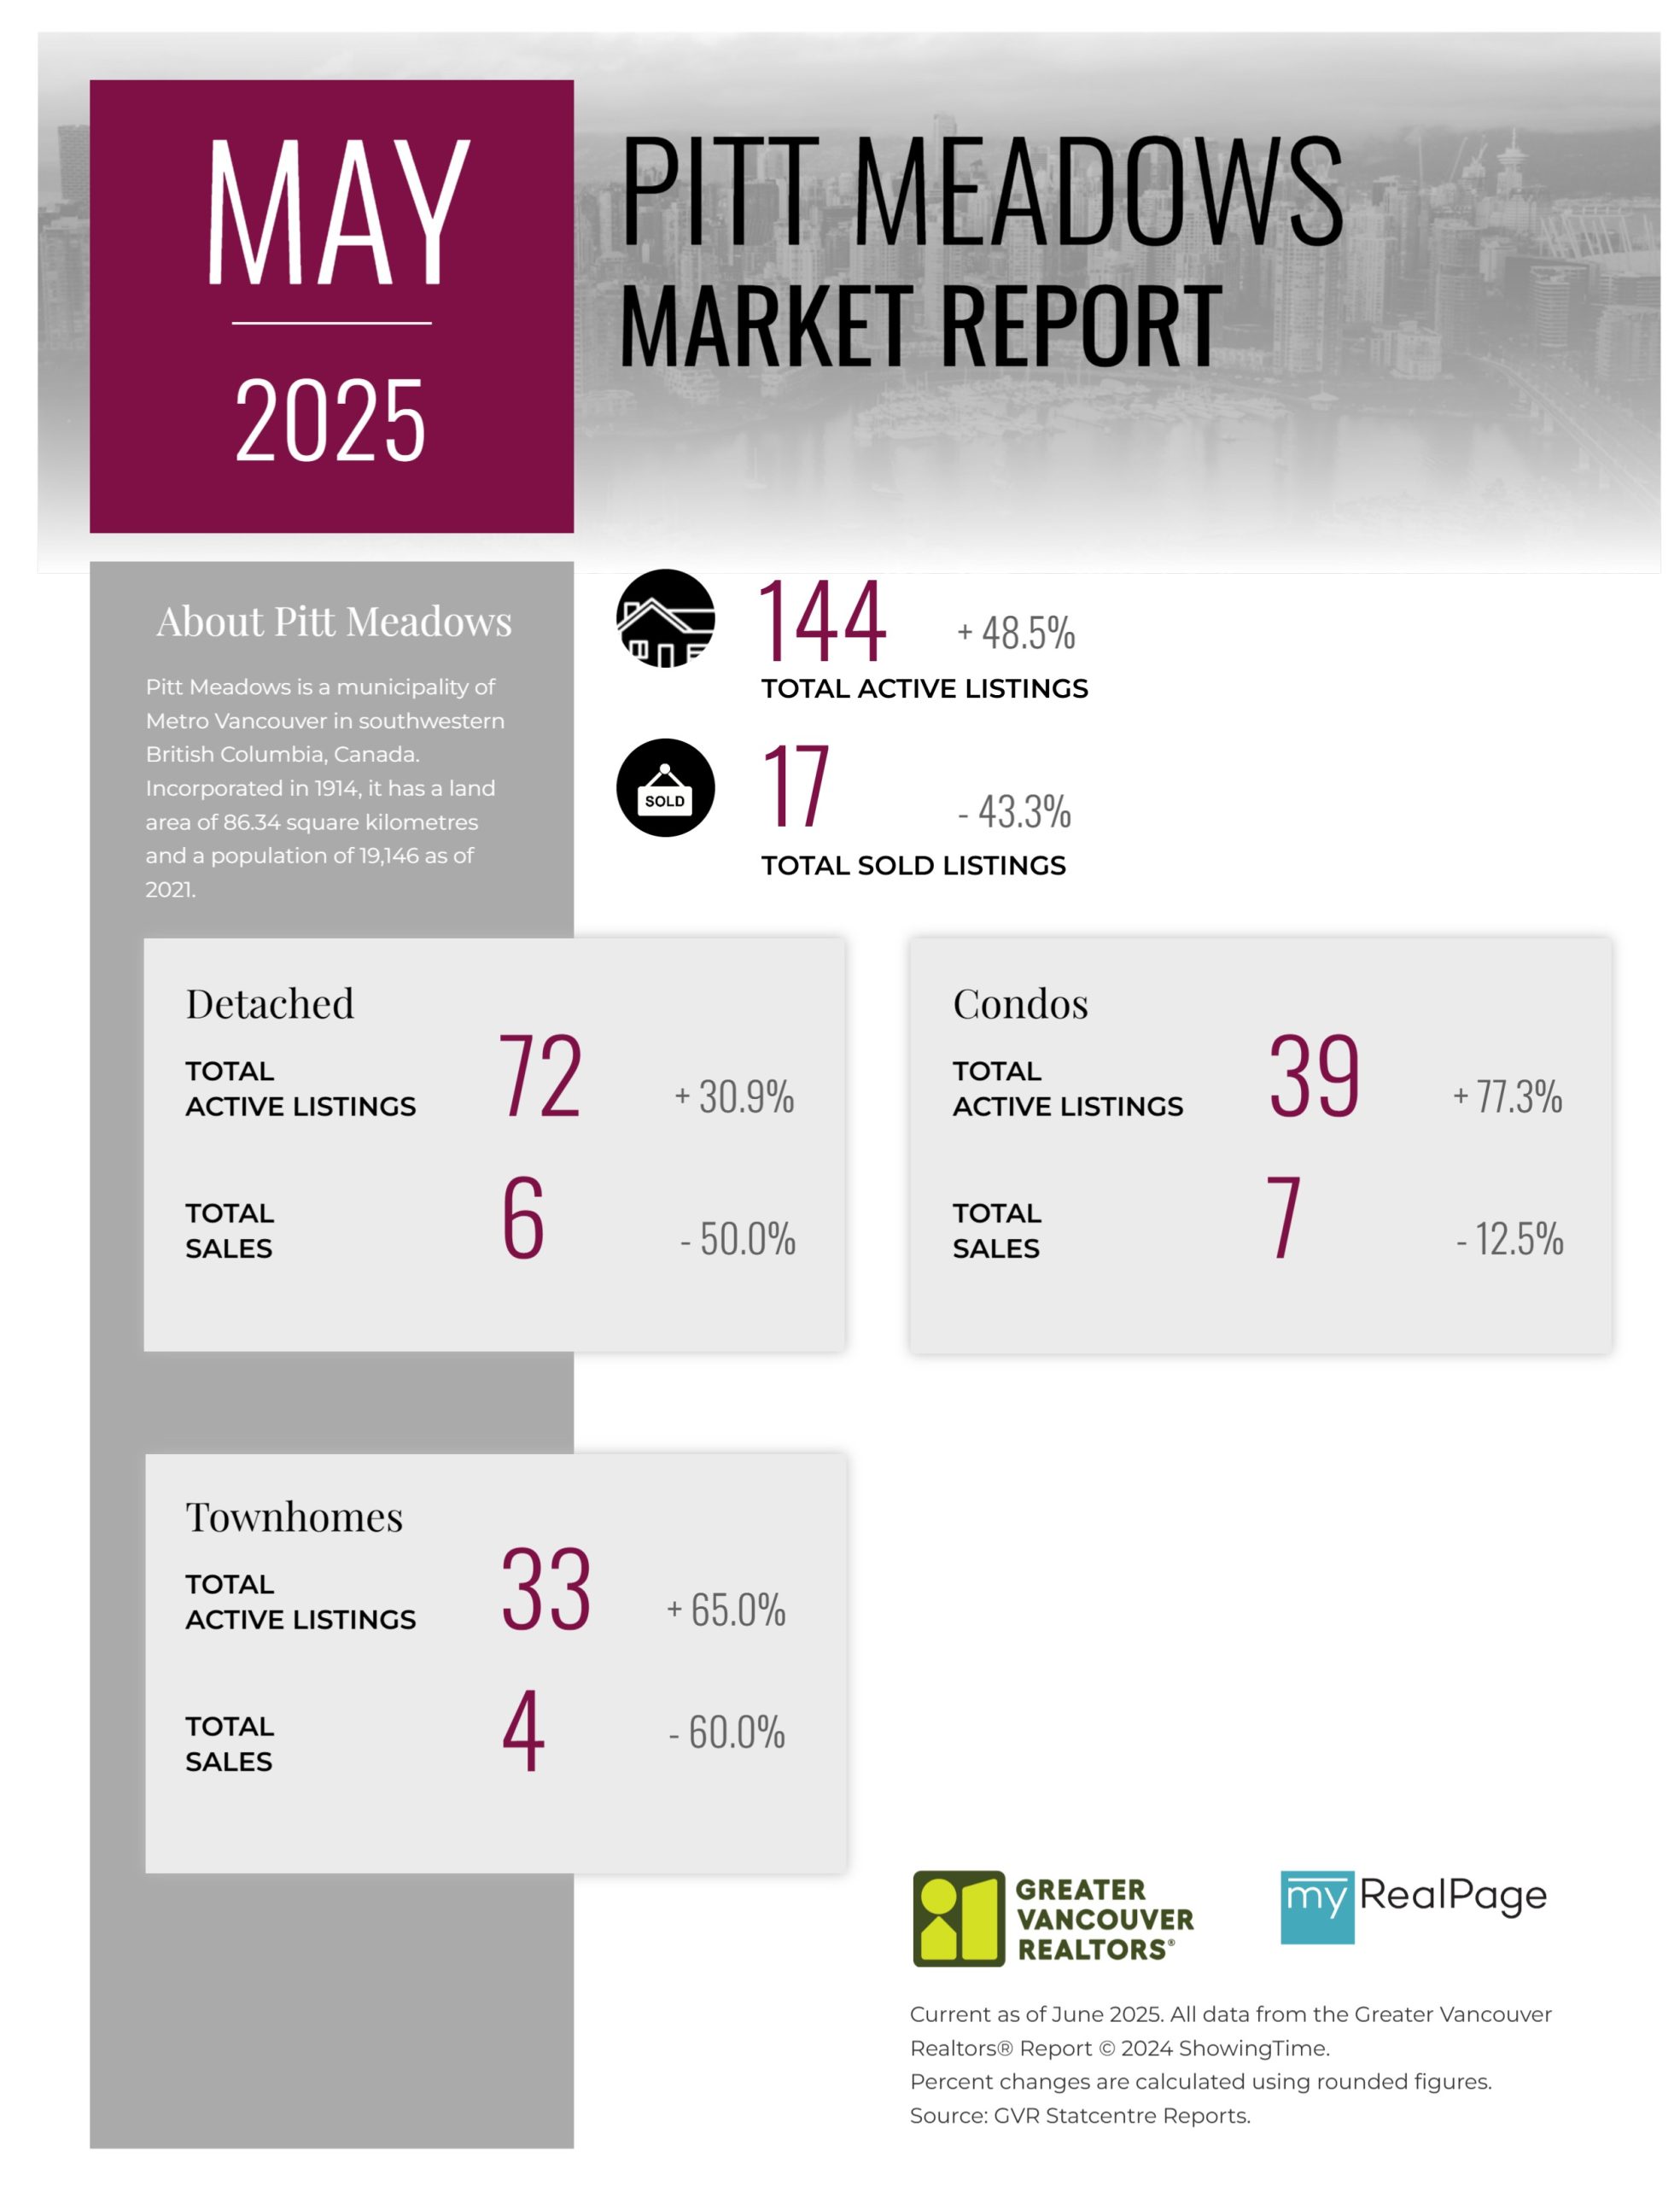
Printable Version – GVR May 2025 Data Infographics Report Pitt Meadows
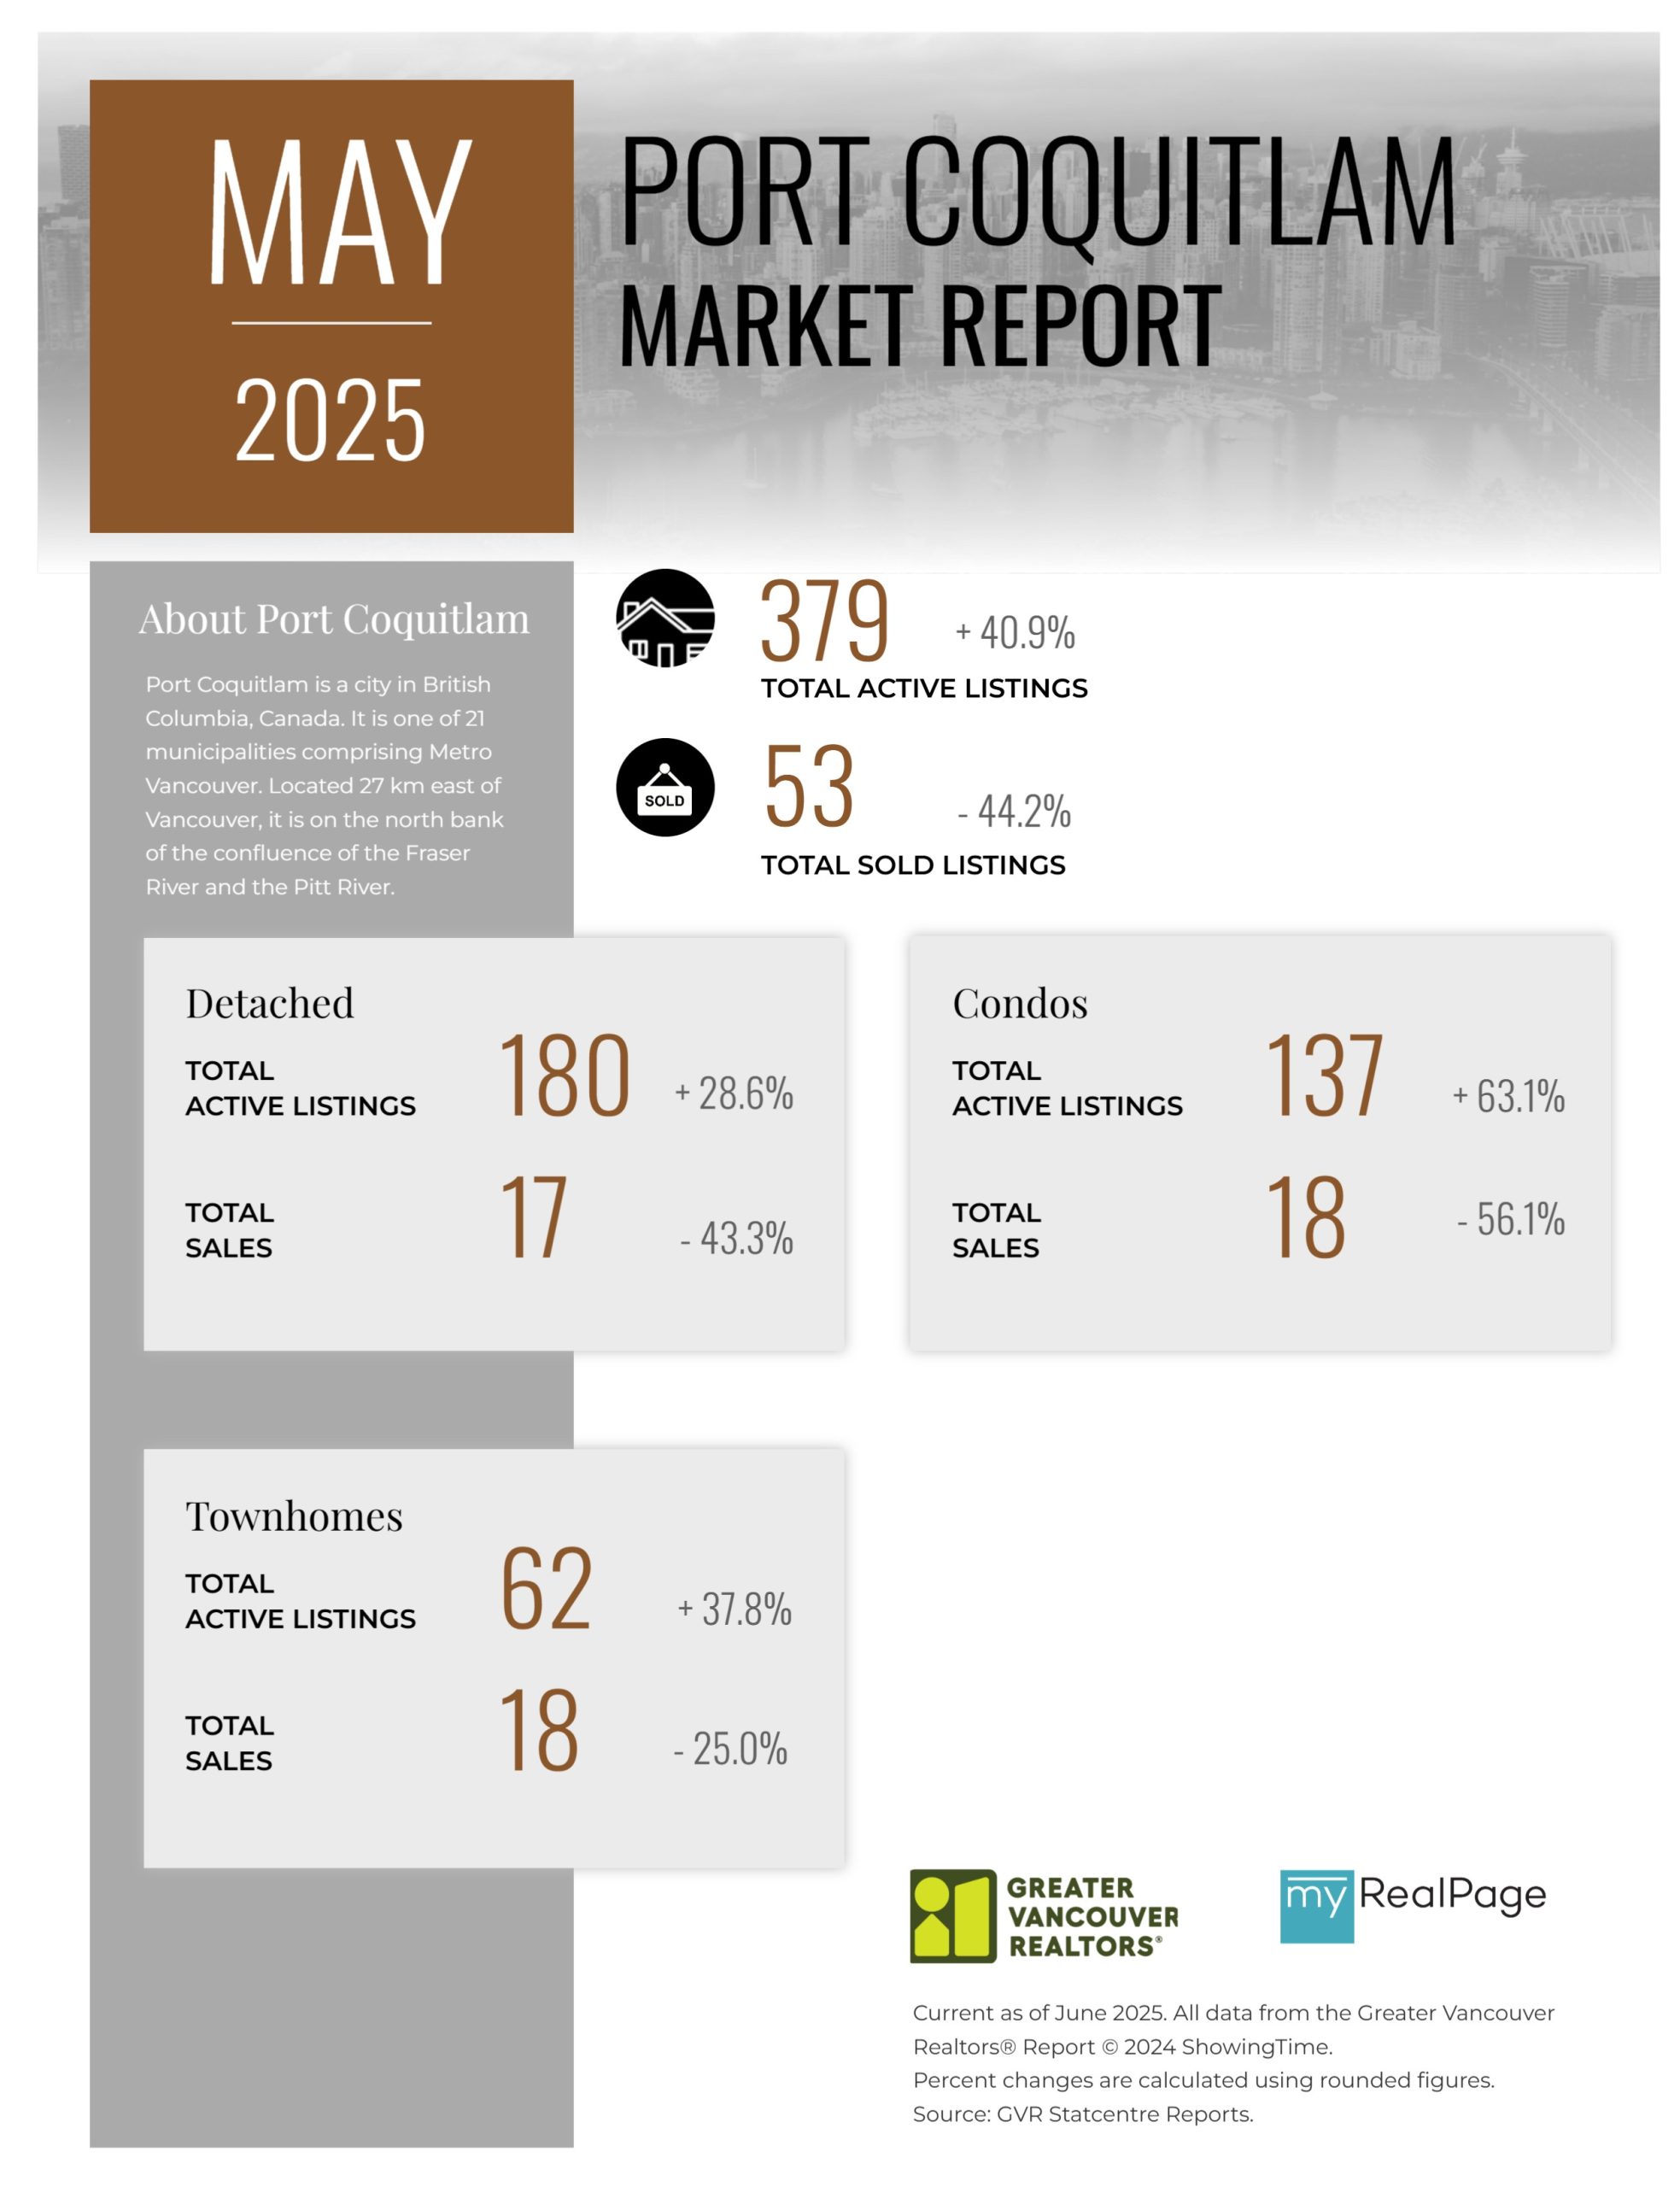
Printable Version – GVR May 2025 Data Infographics Report Port Coquitlam
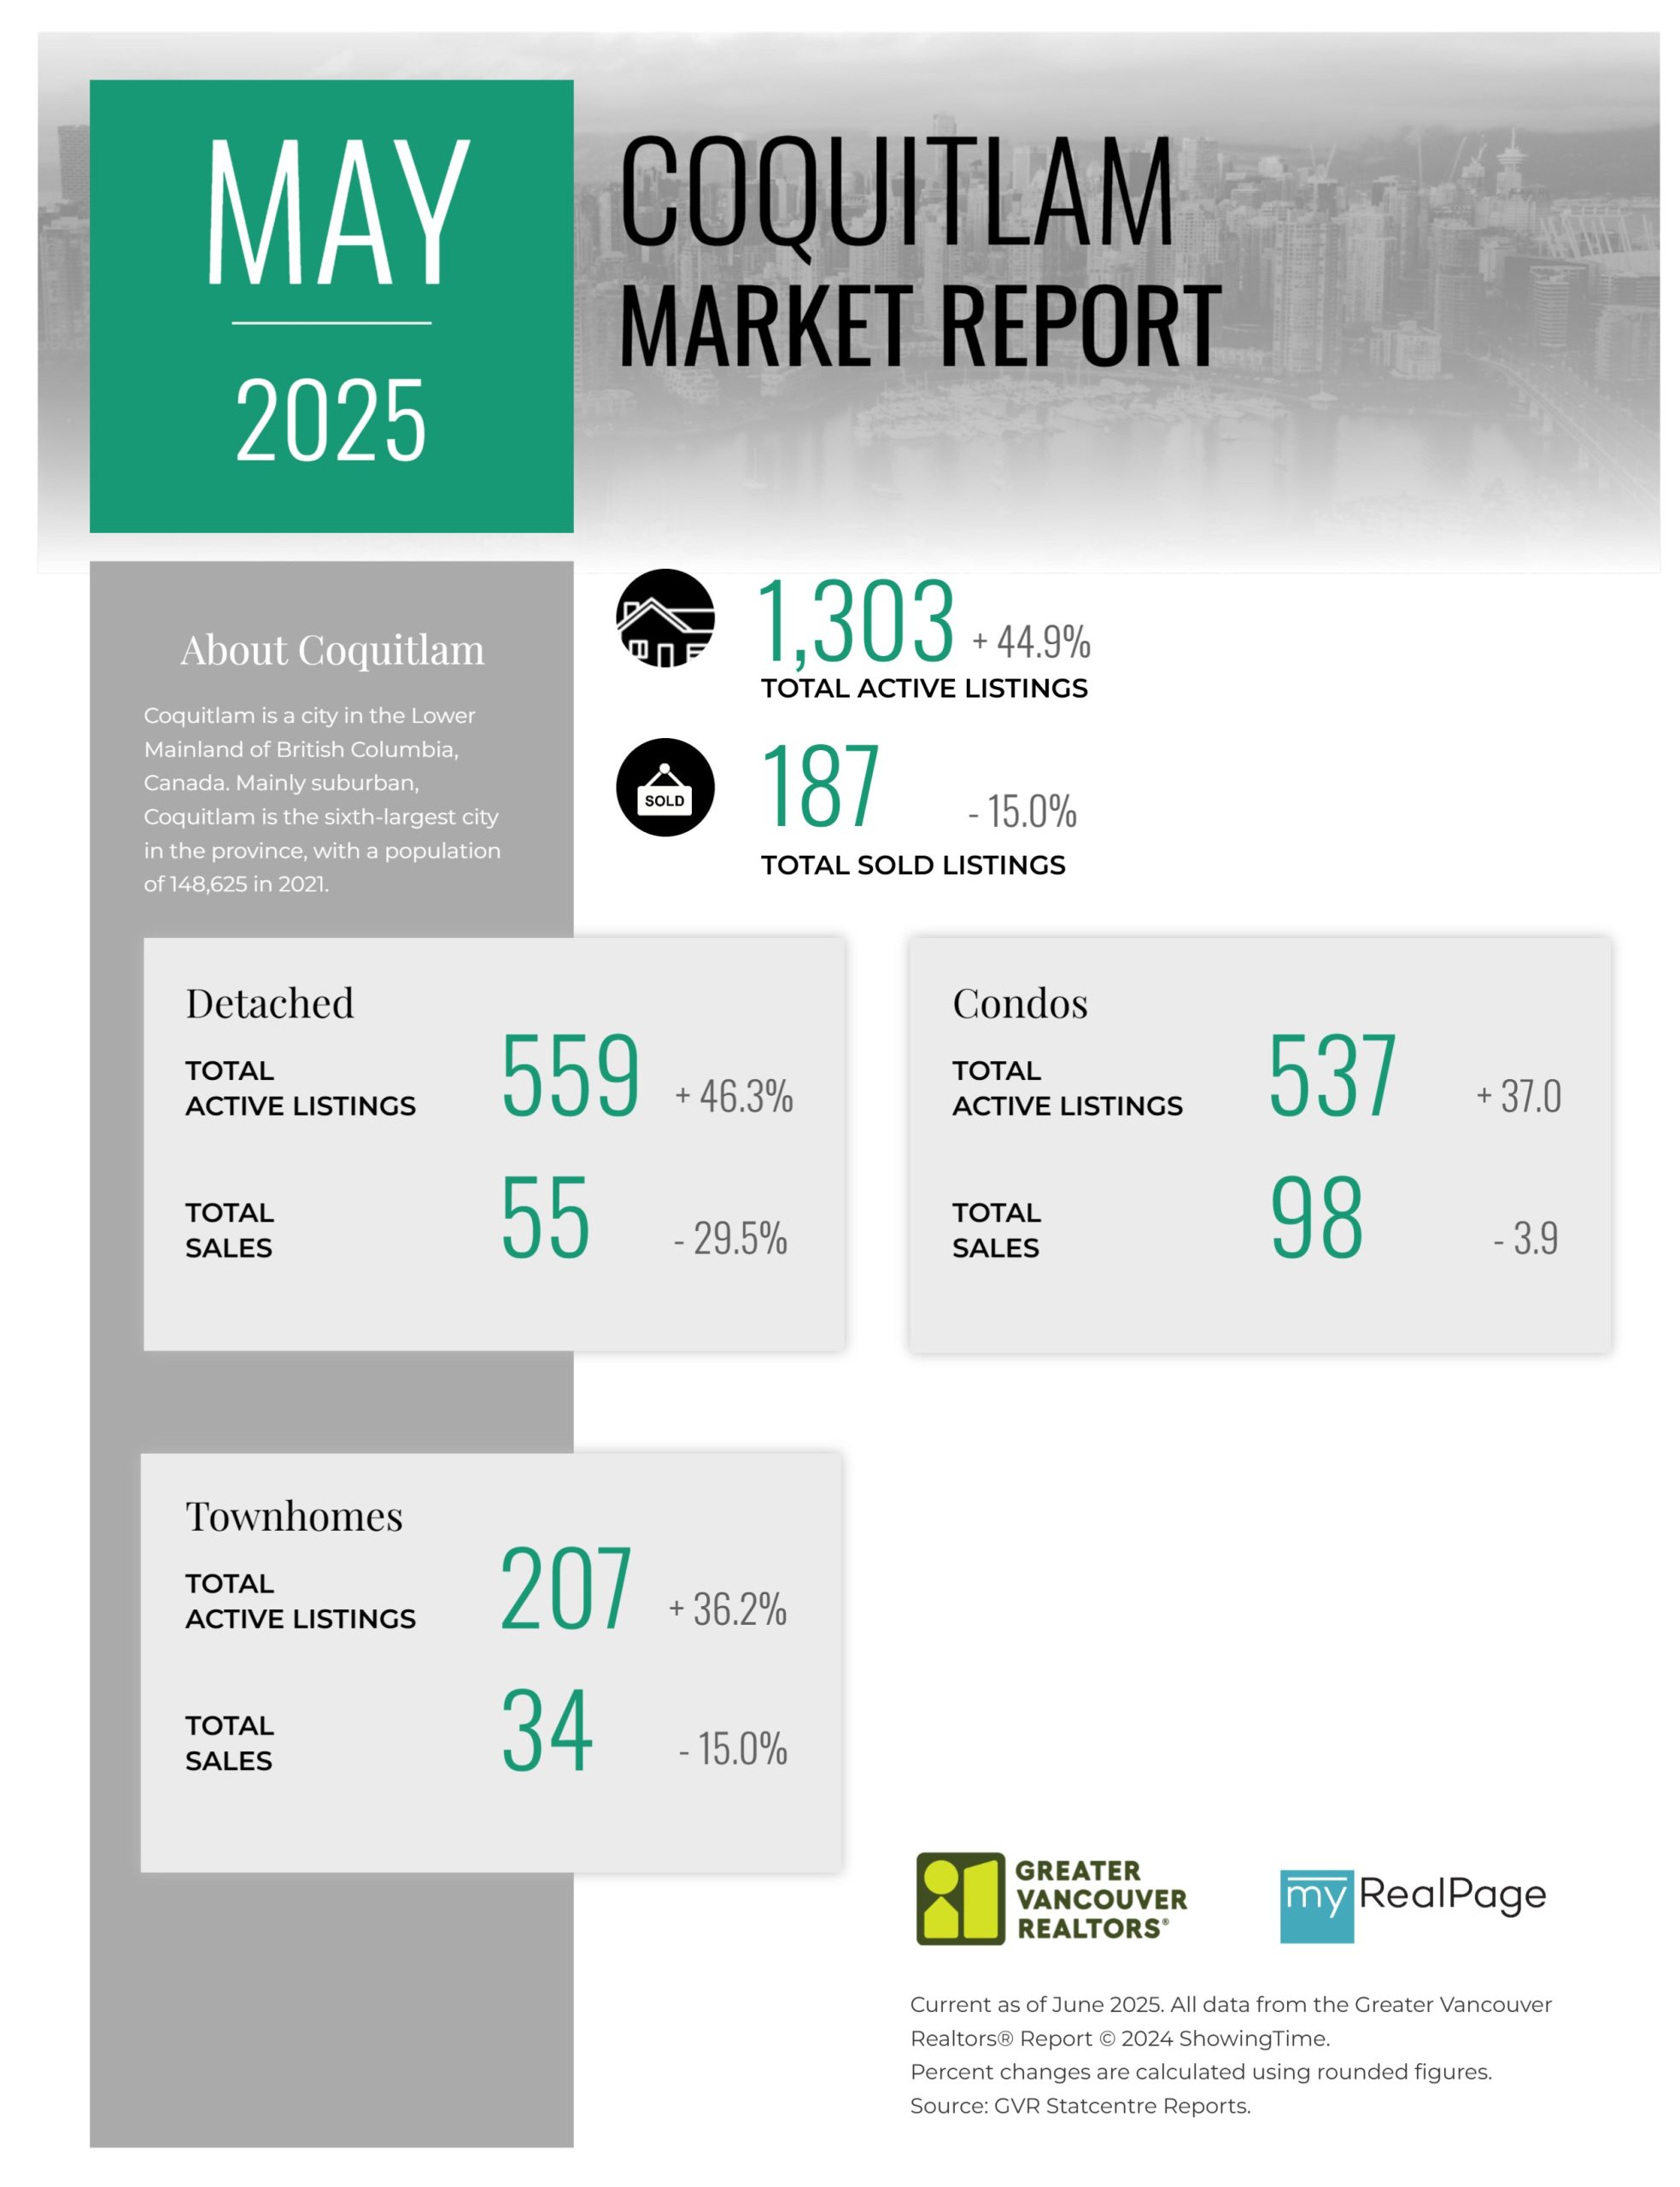
Printable Version – GVR May 2025 Data Infographics Report Coquitlam
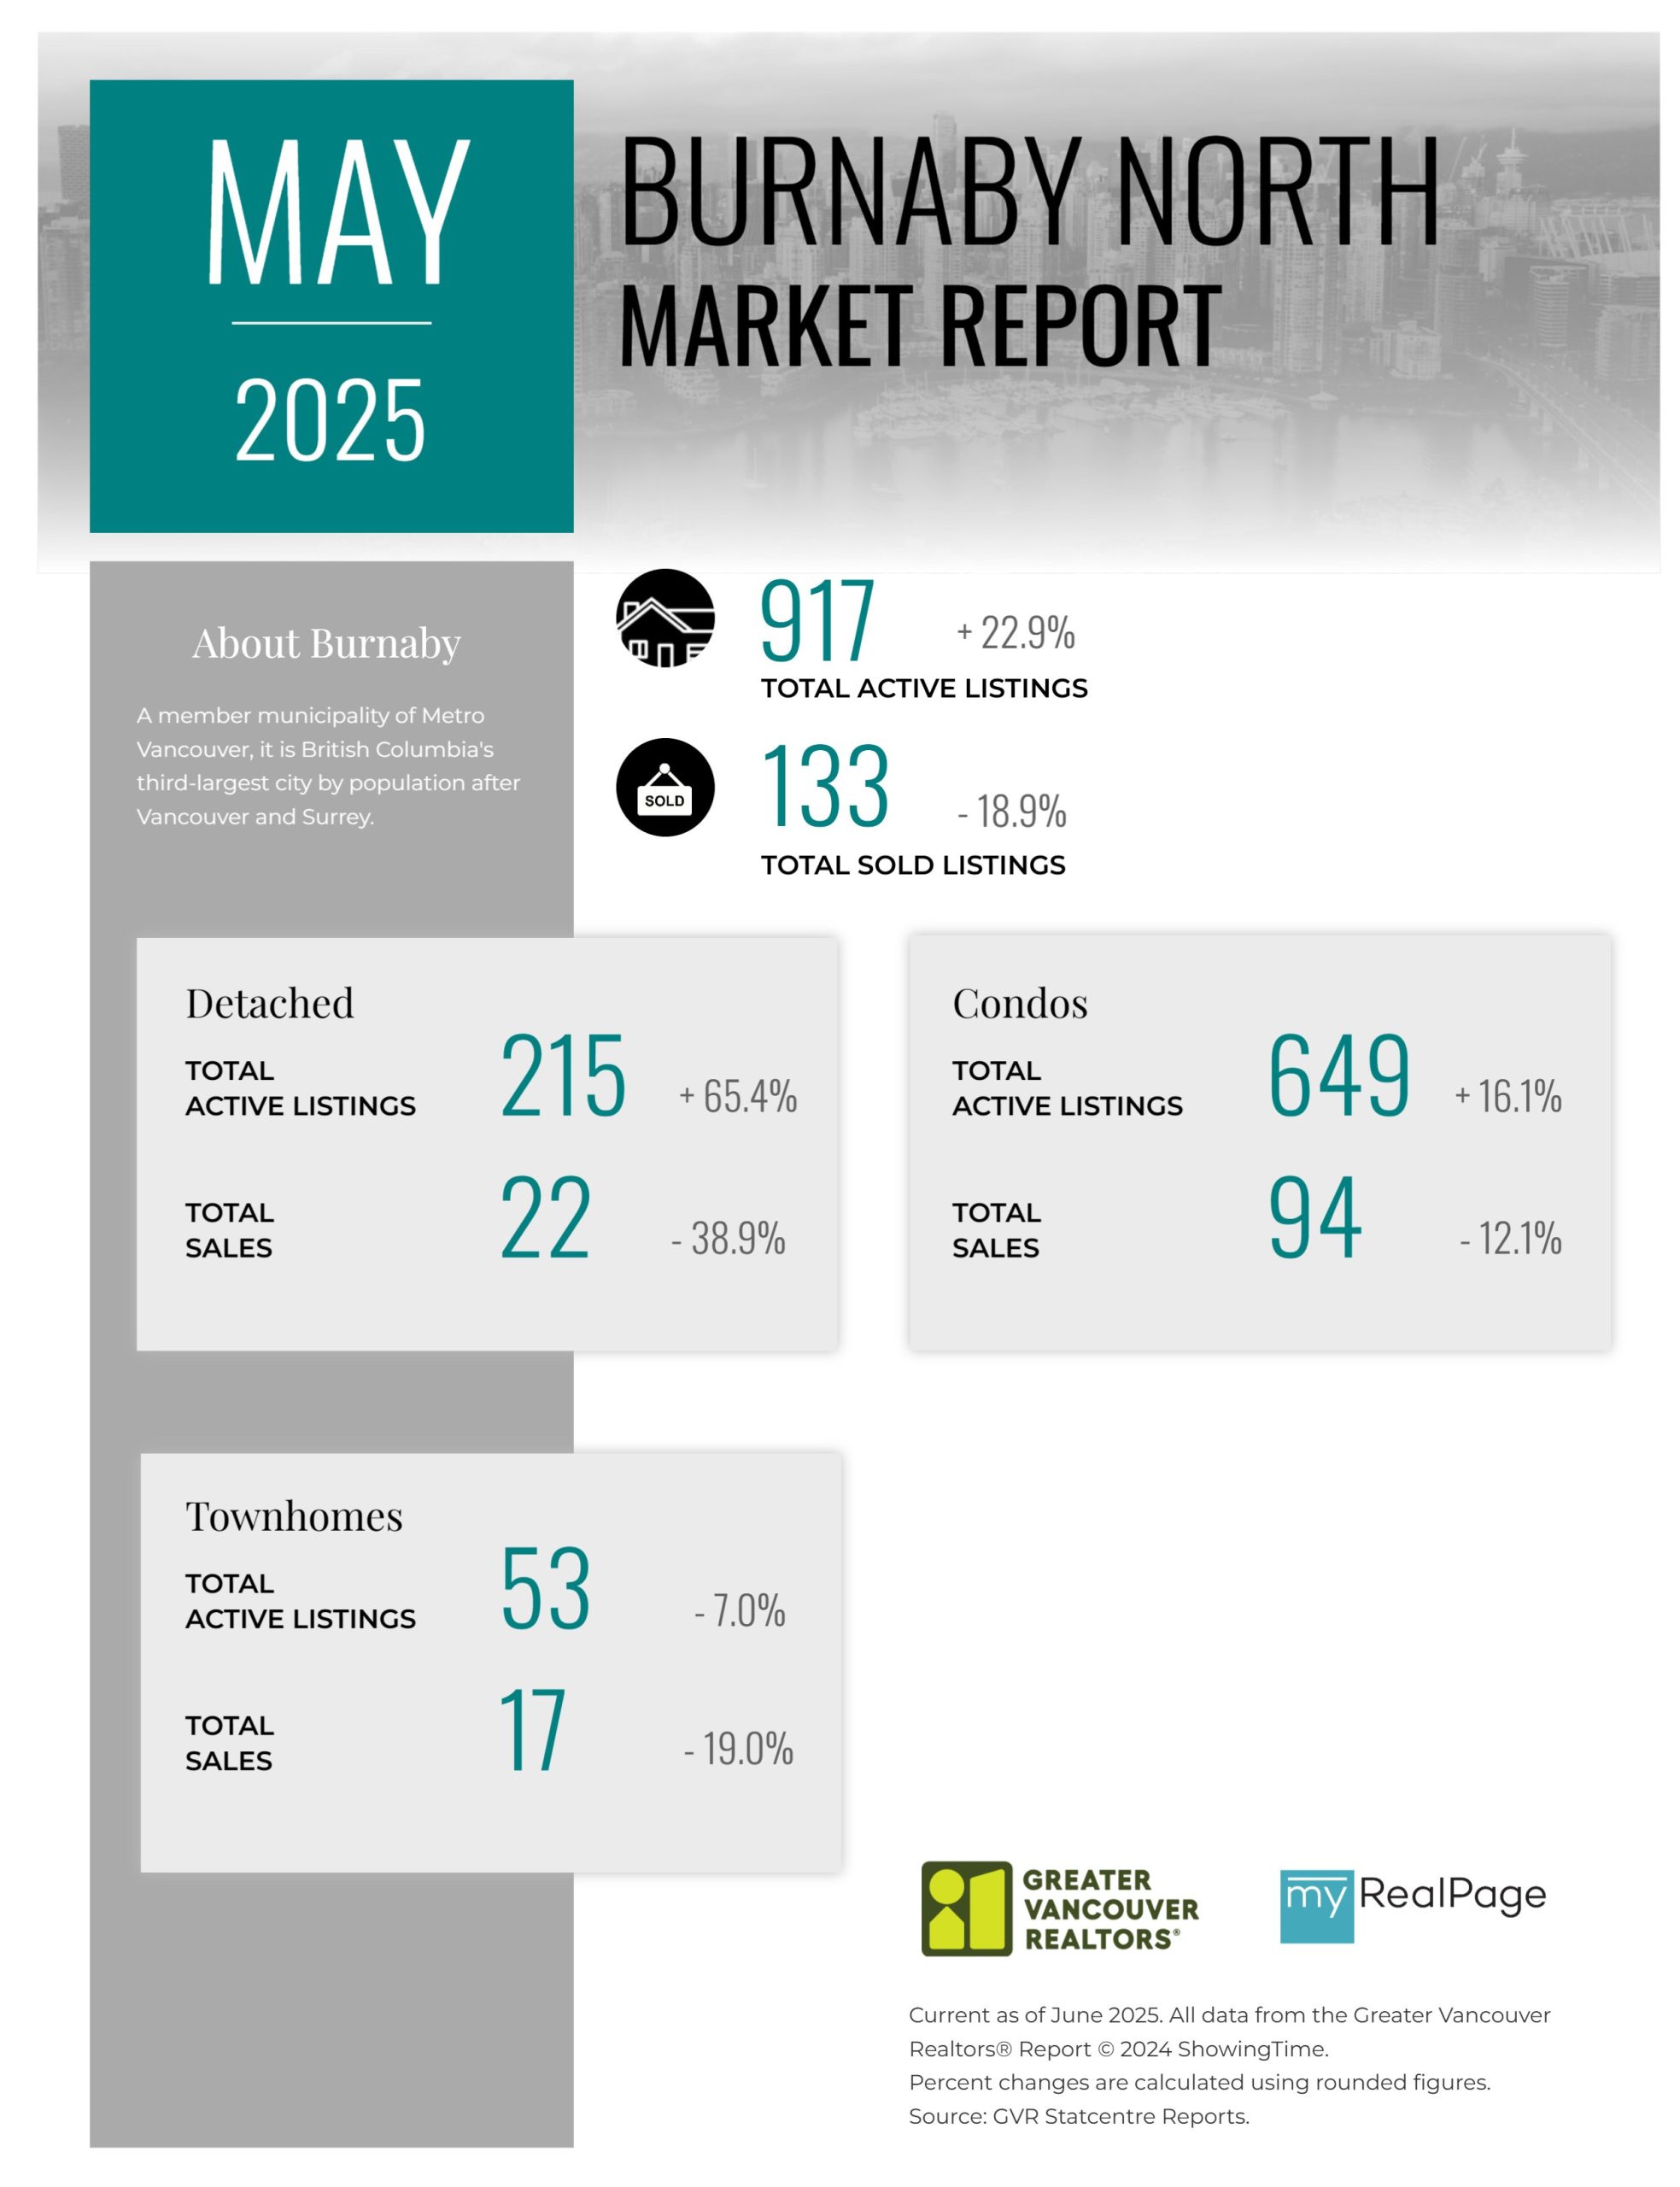
Printable Version – GVR May 2025 Data Infographic Report Burnaby North
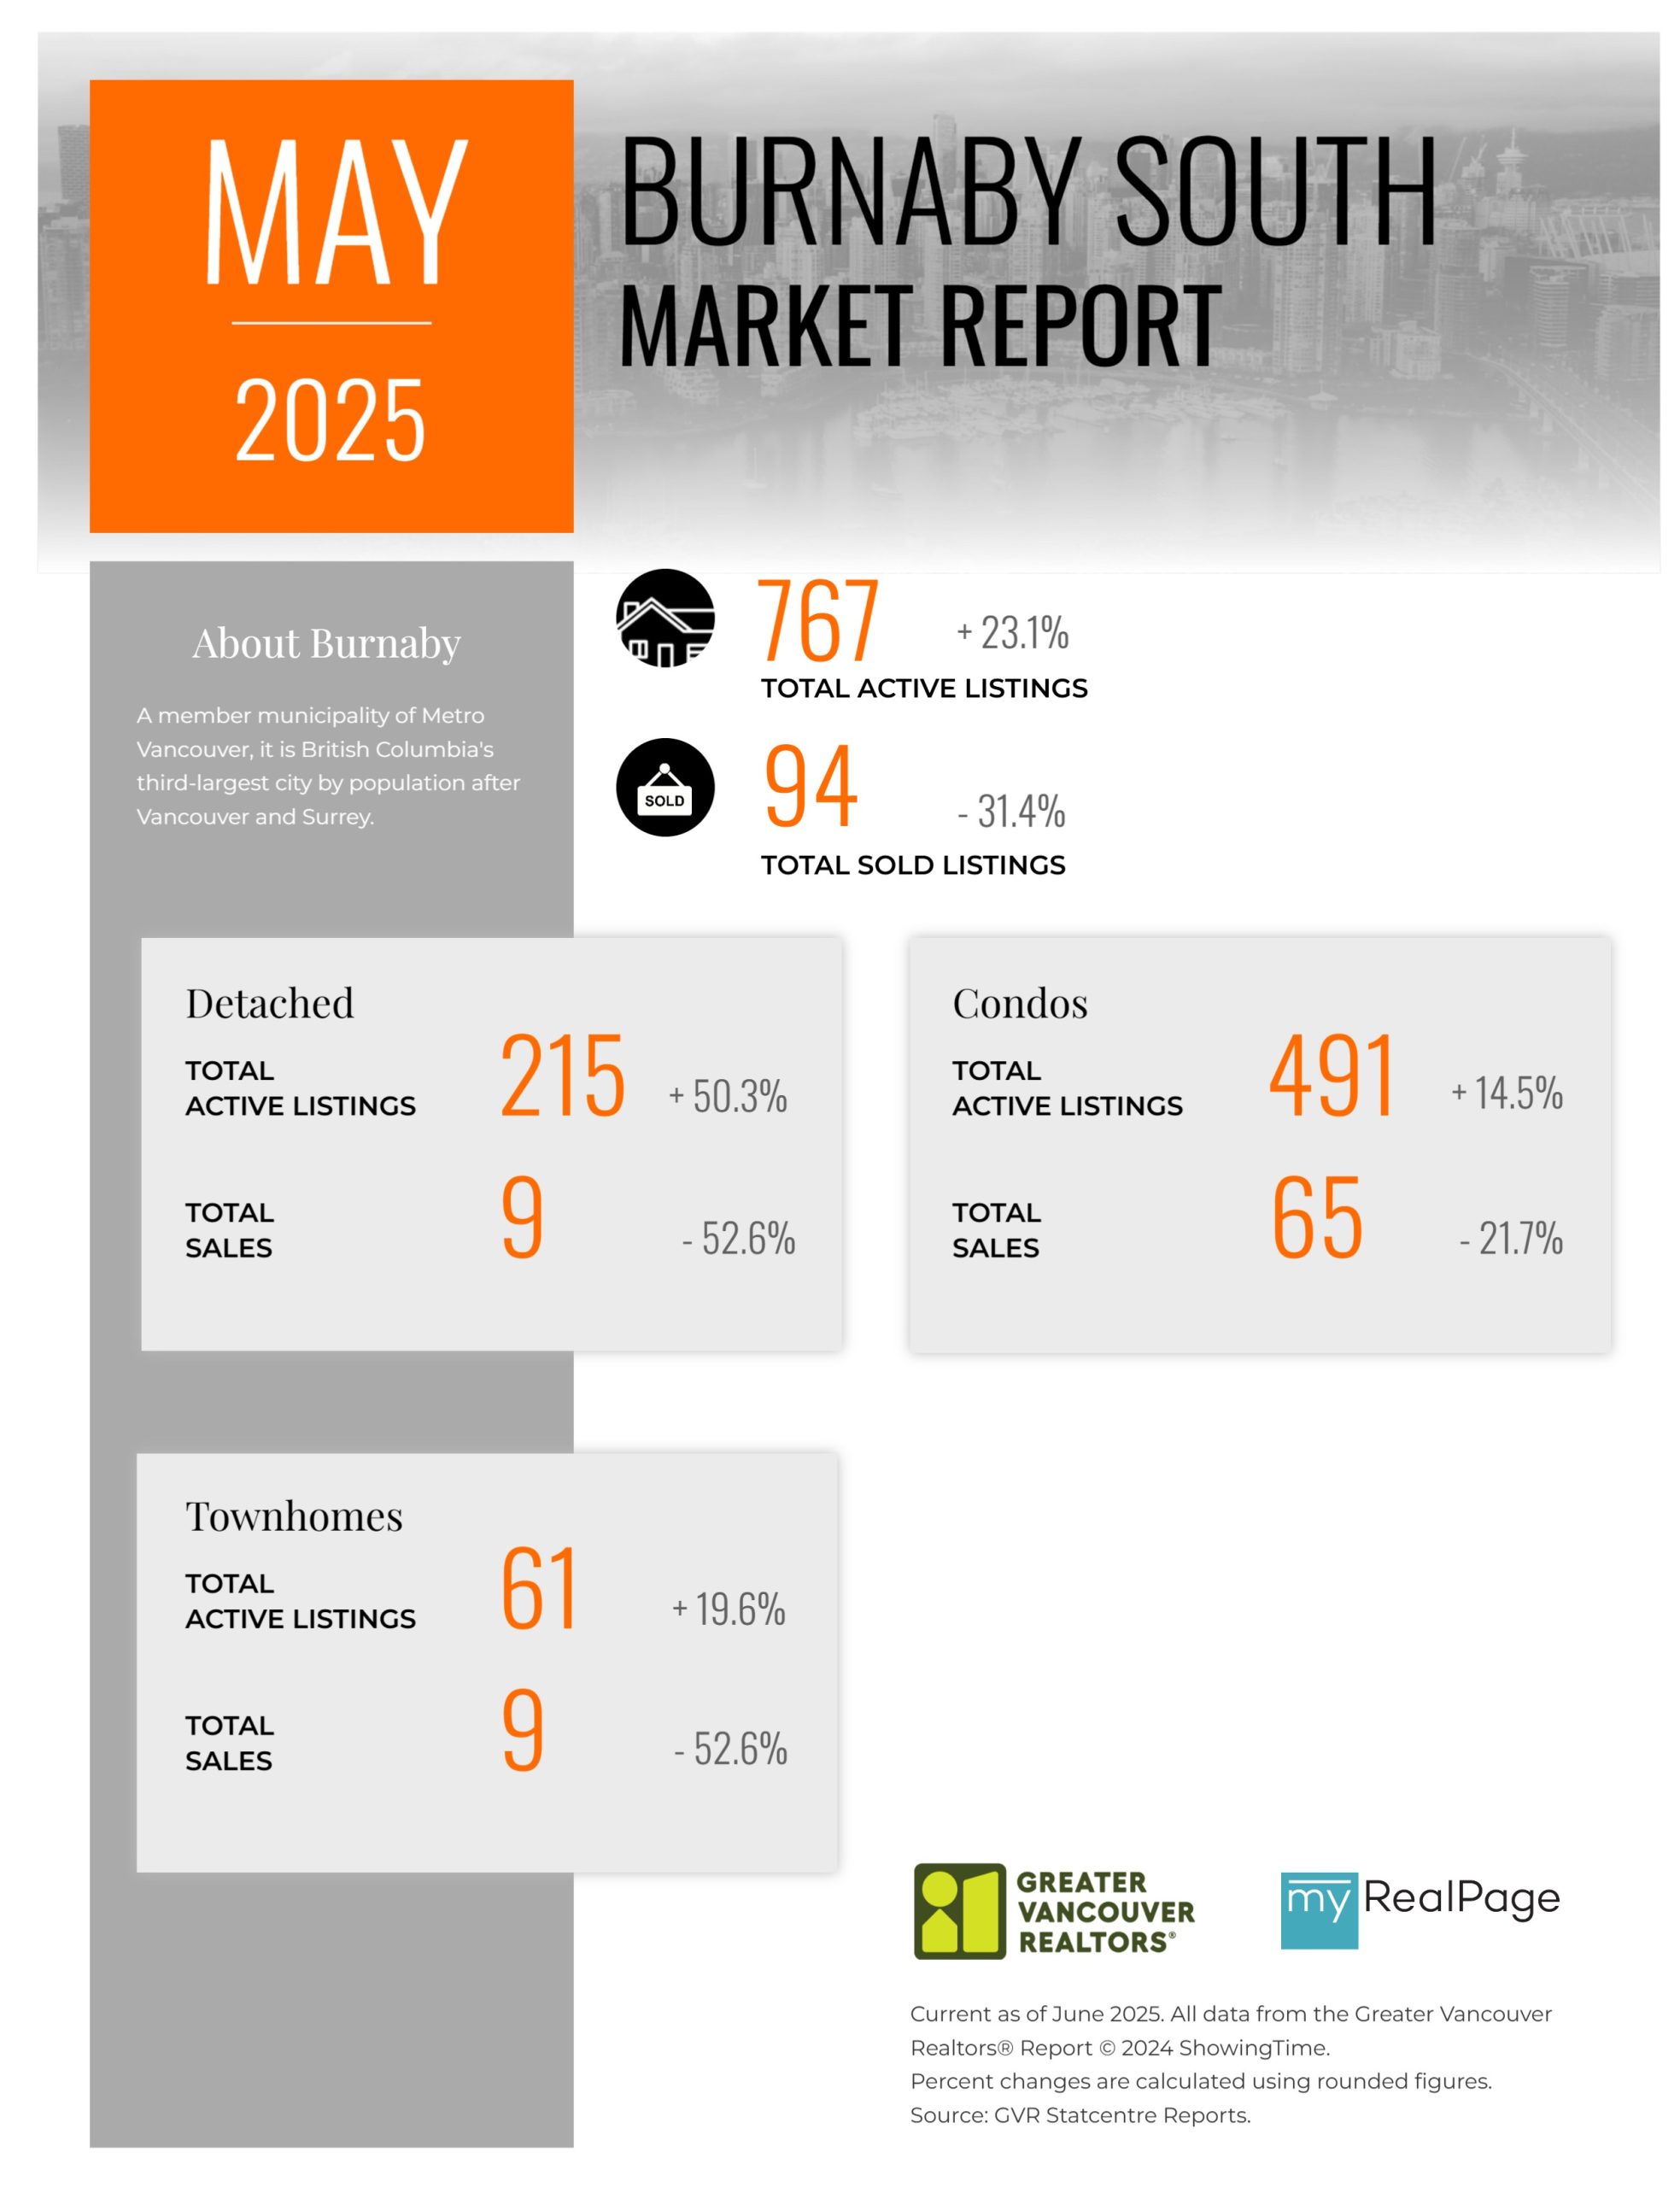
Printable Version – GVR May 2025 Data Infographics Report Burnaby South
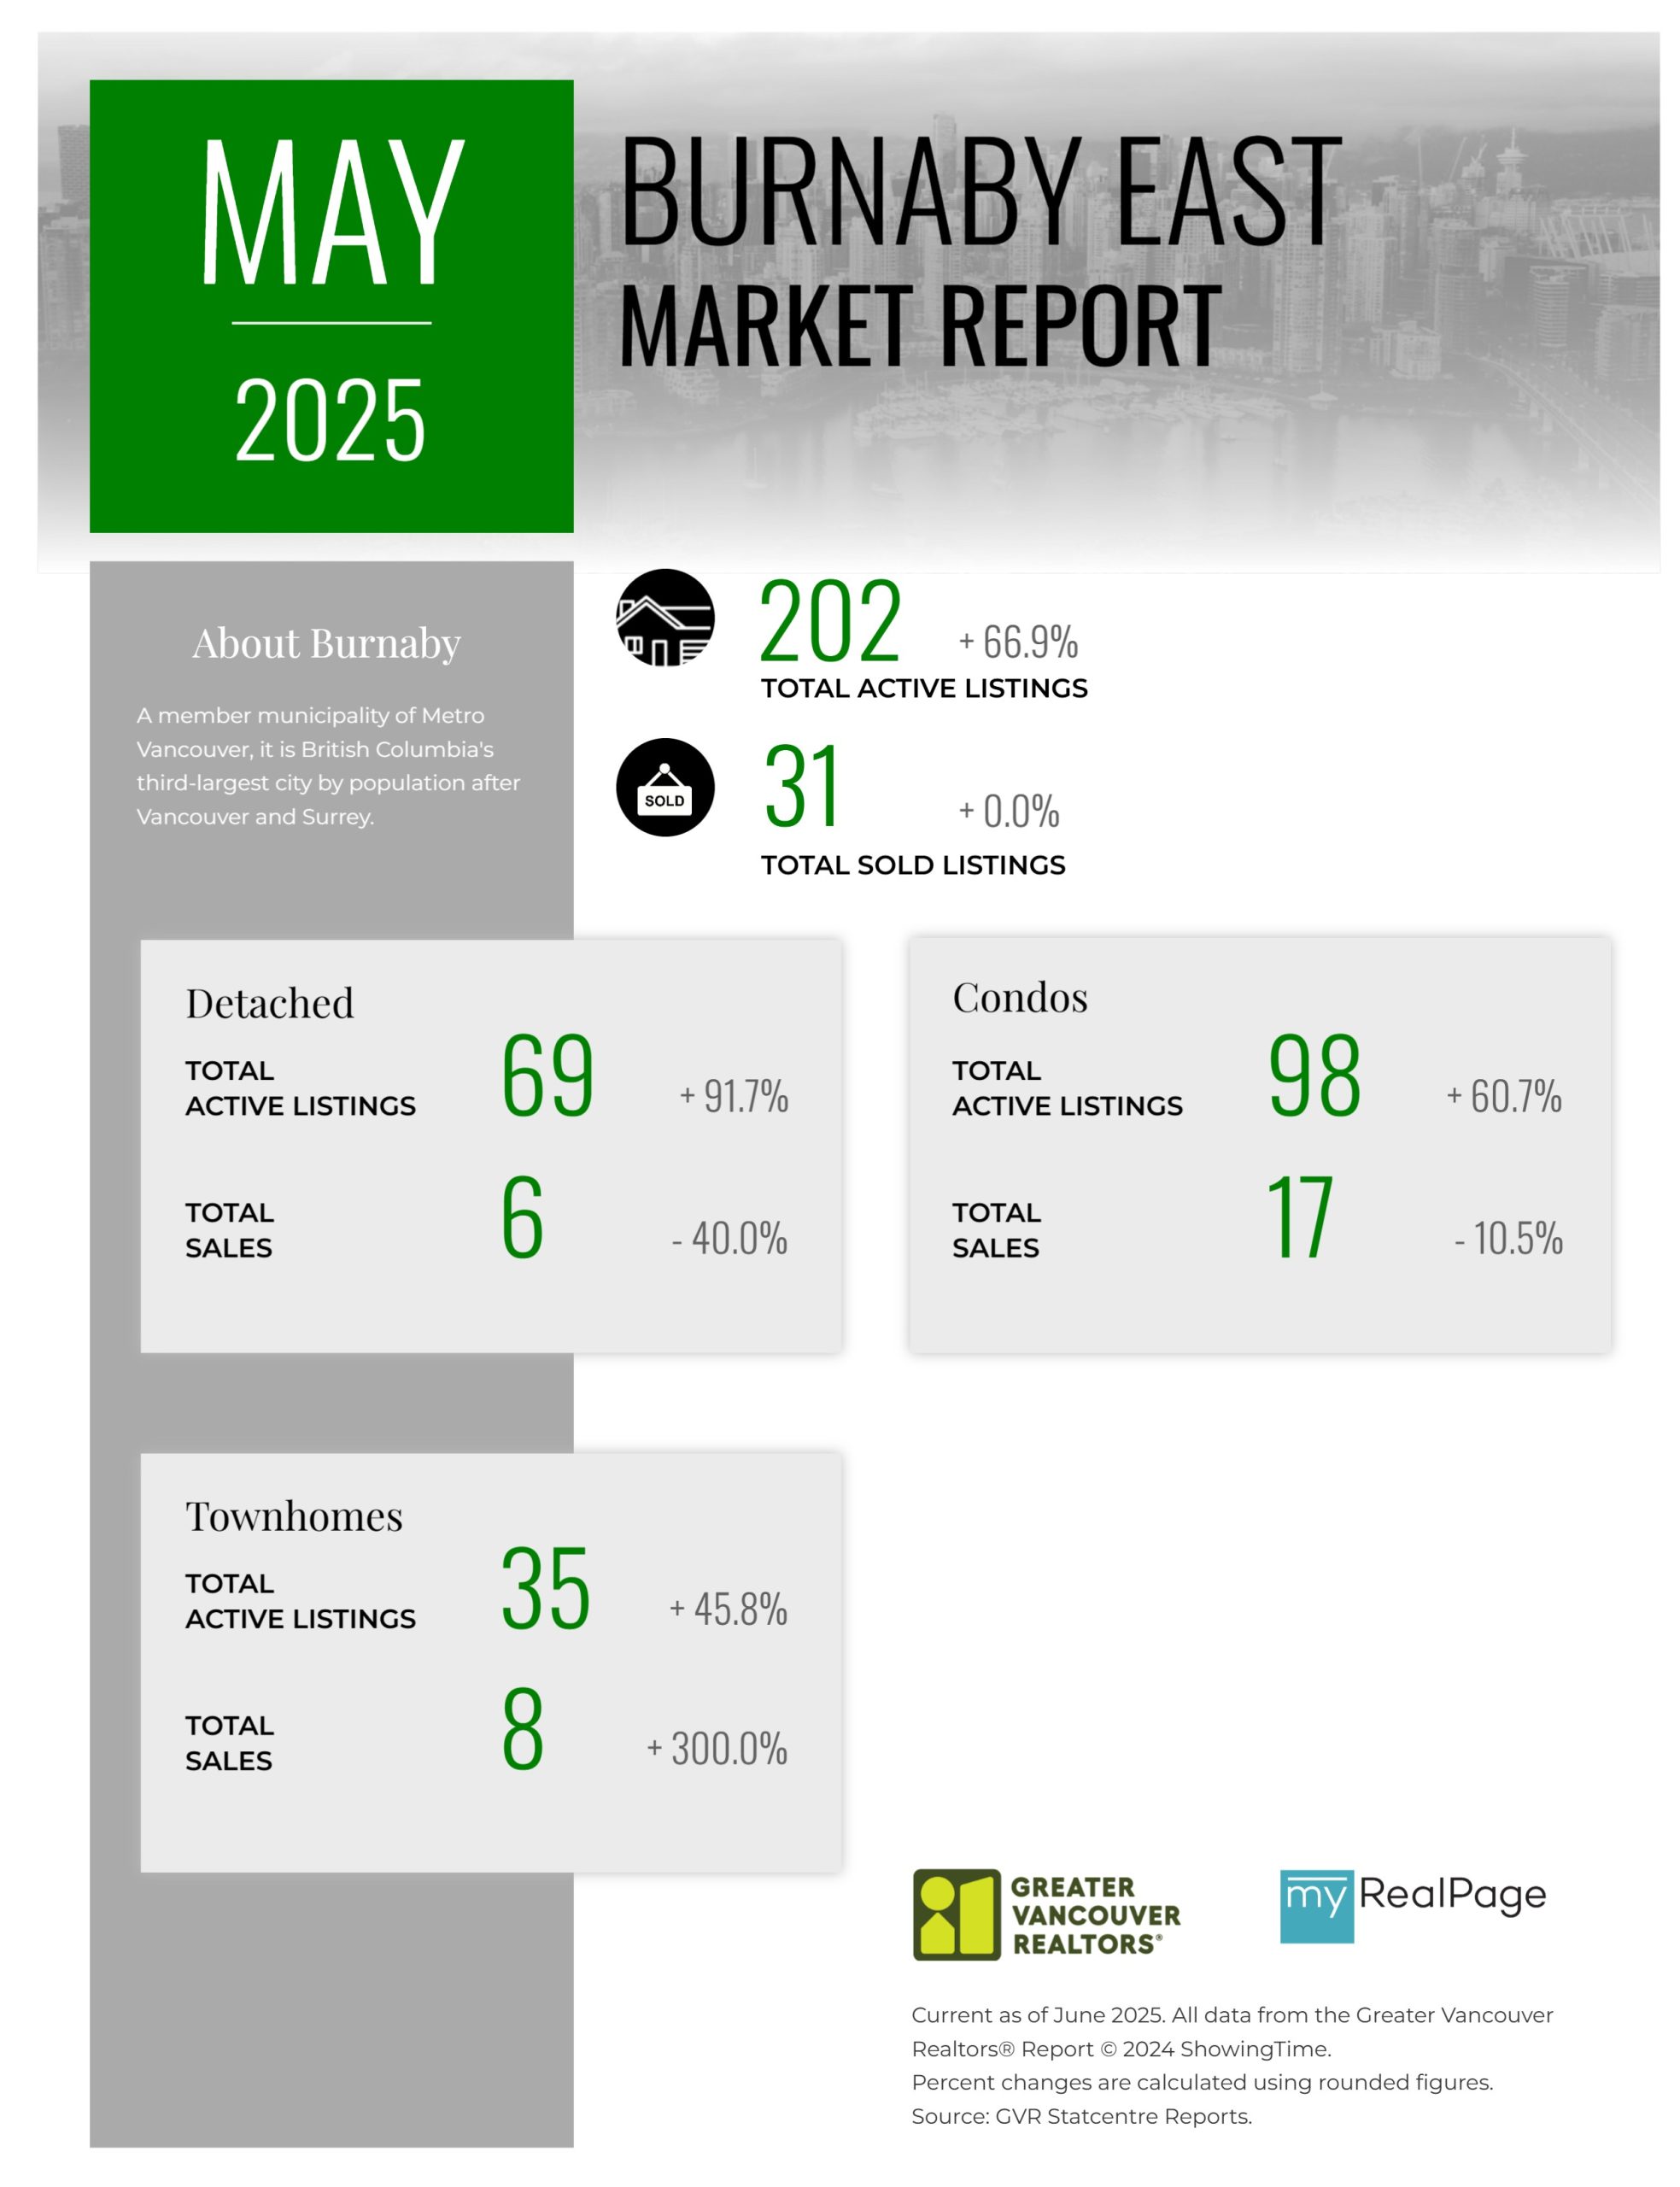
Printable Version – GVR May 2025 Data Infographics Report Burnaby East
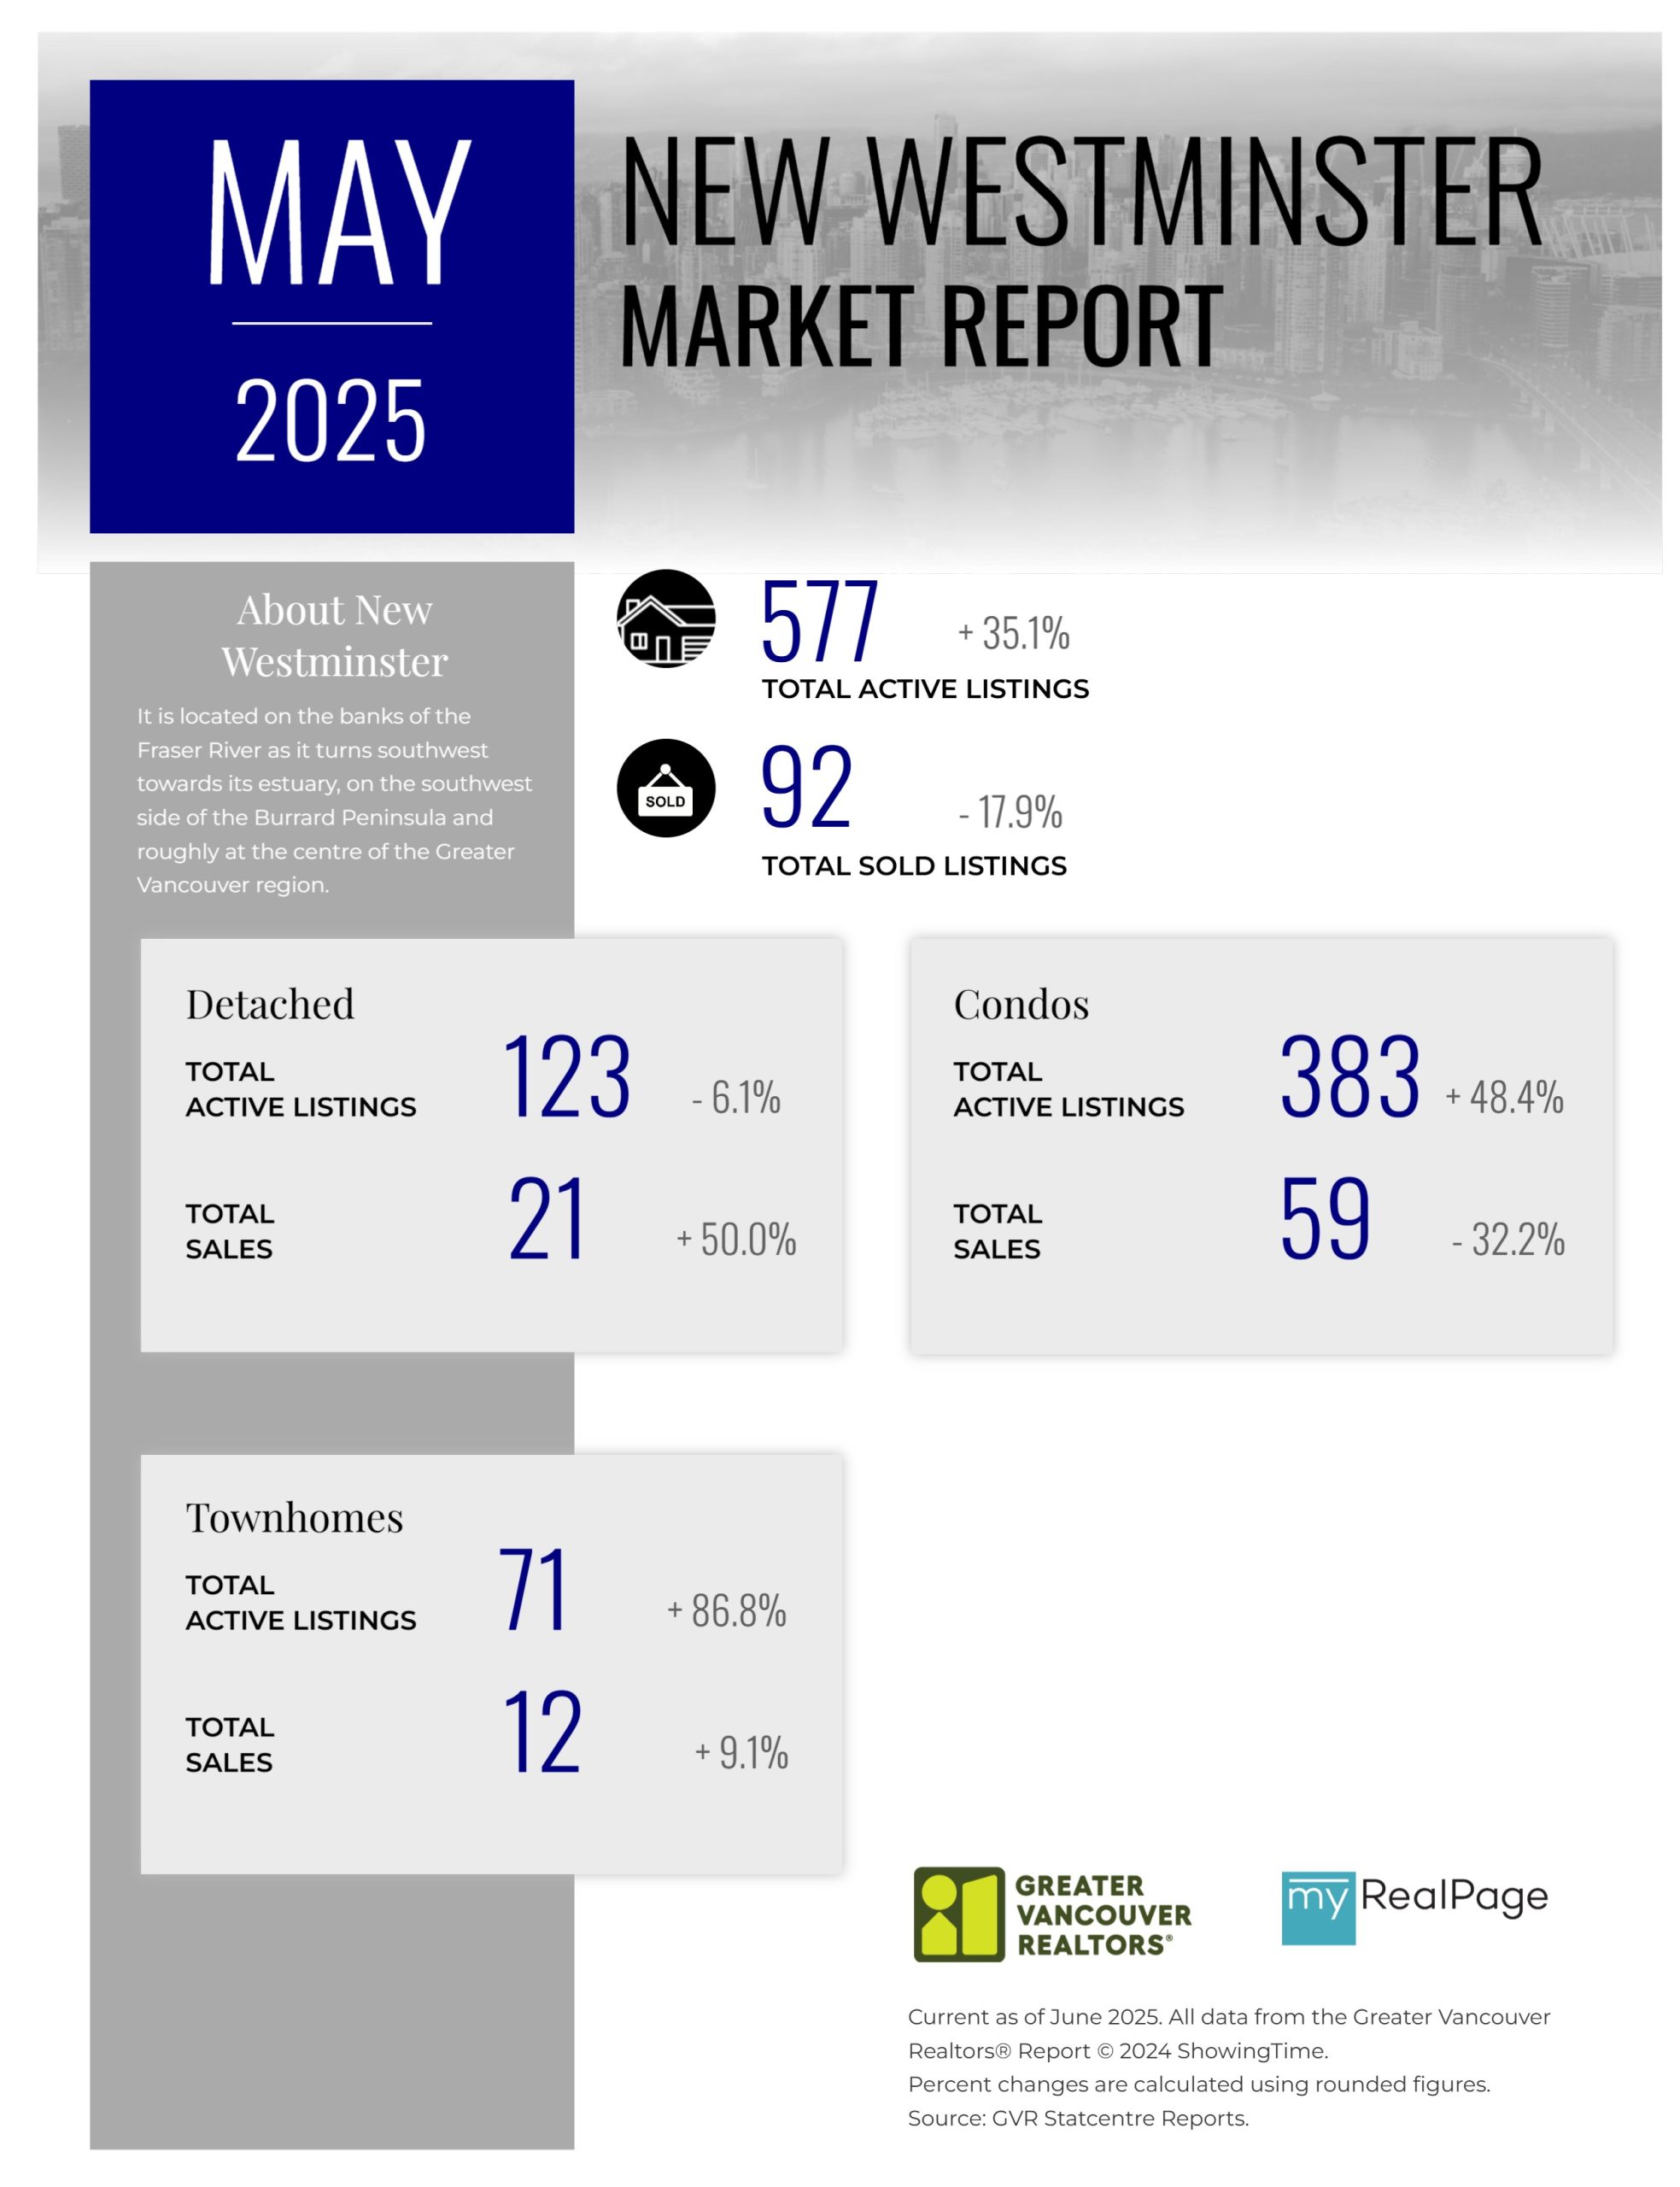
Printable Version – GVR May 2025 Data Infographics Report New Westminster
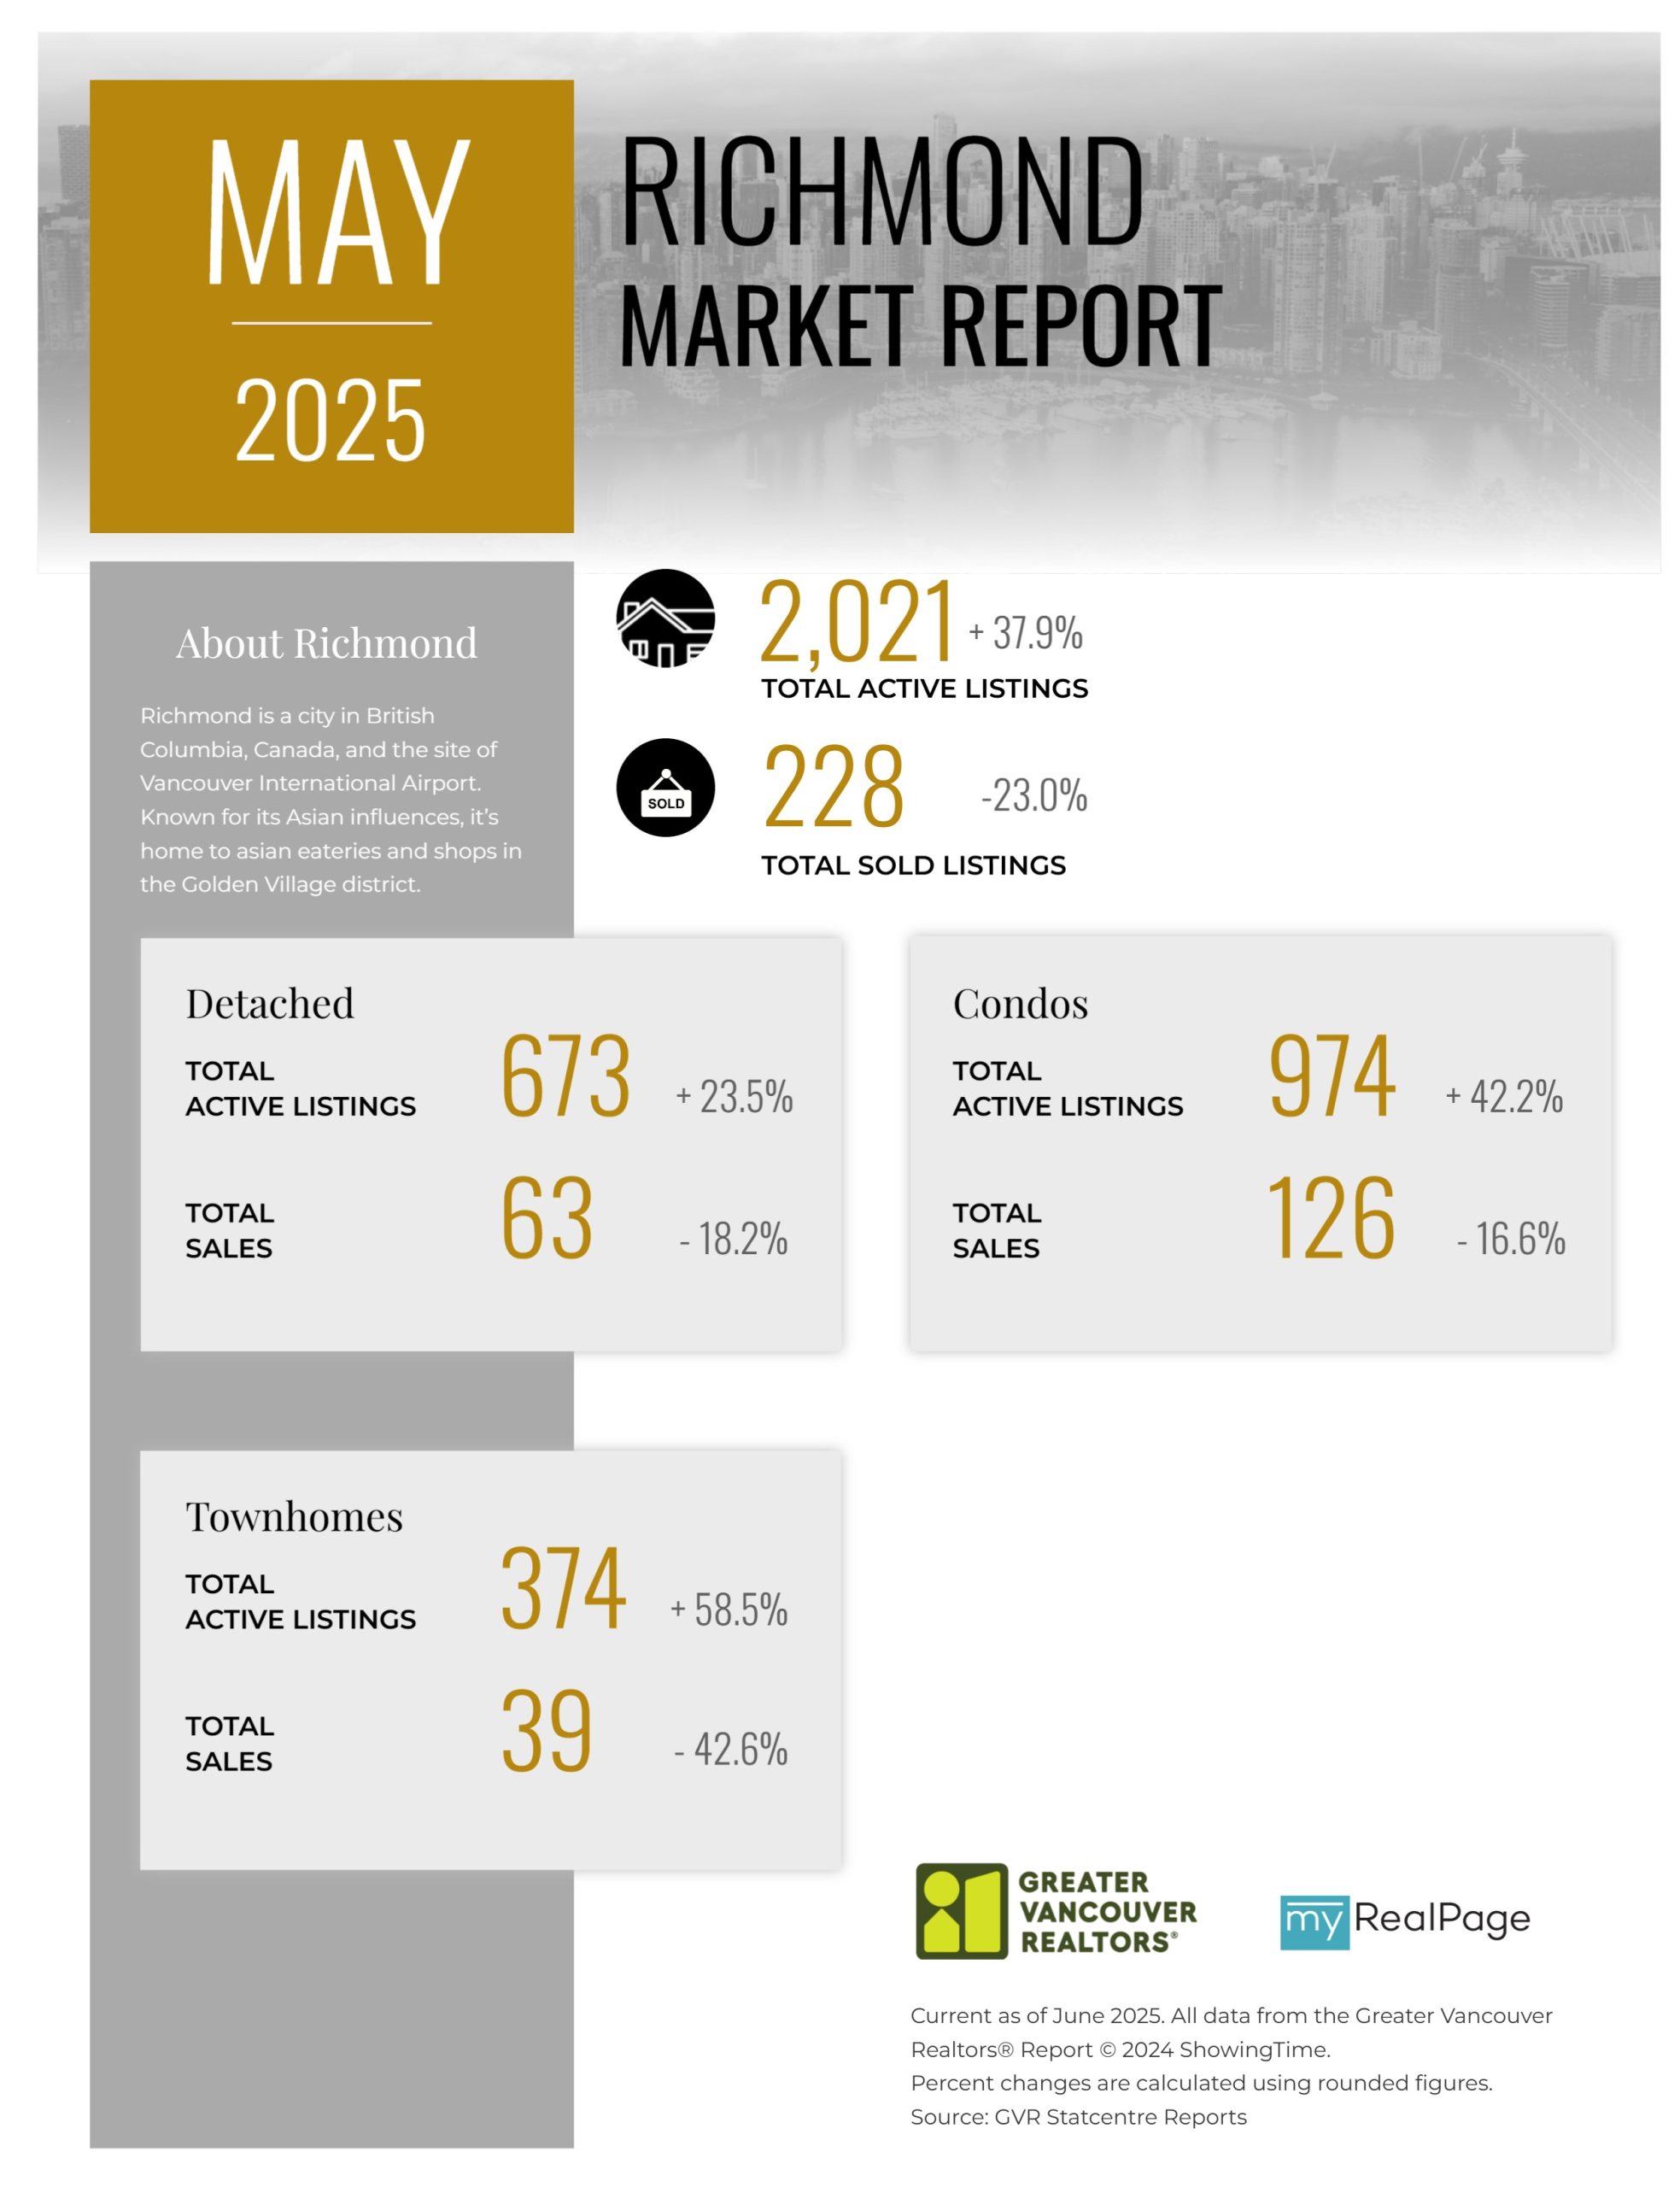
Printable Version – GVR May 2025 Data Infographics Report Richmond
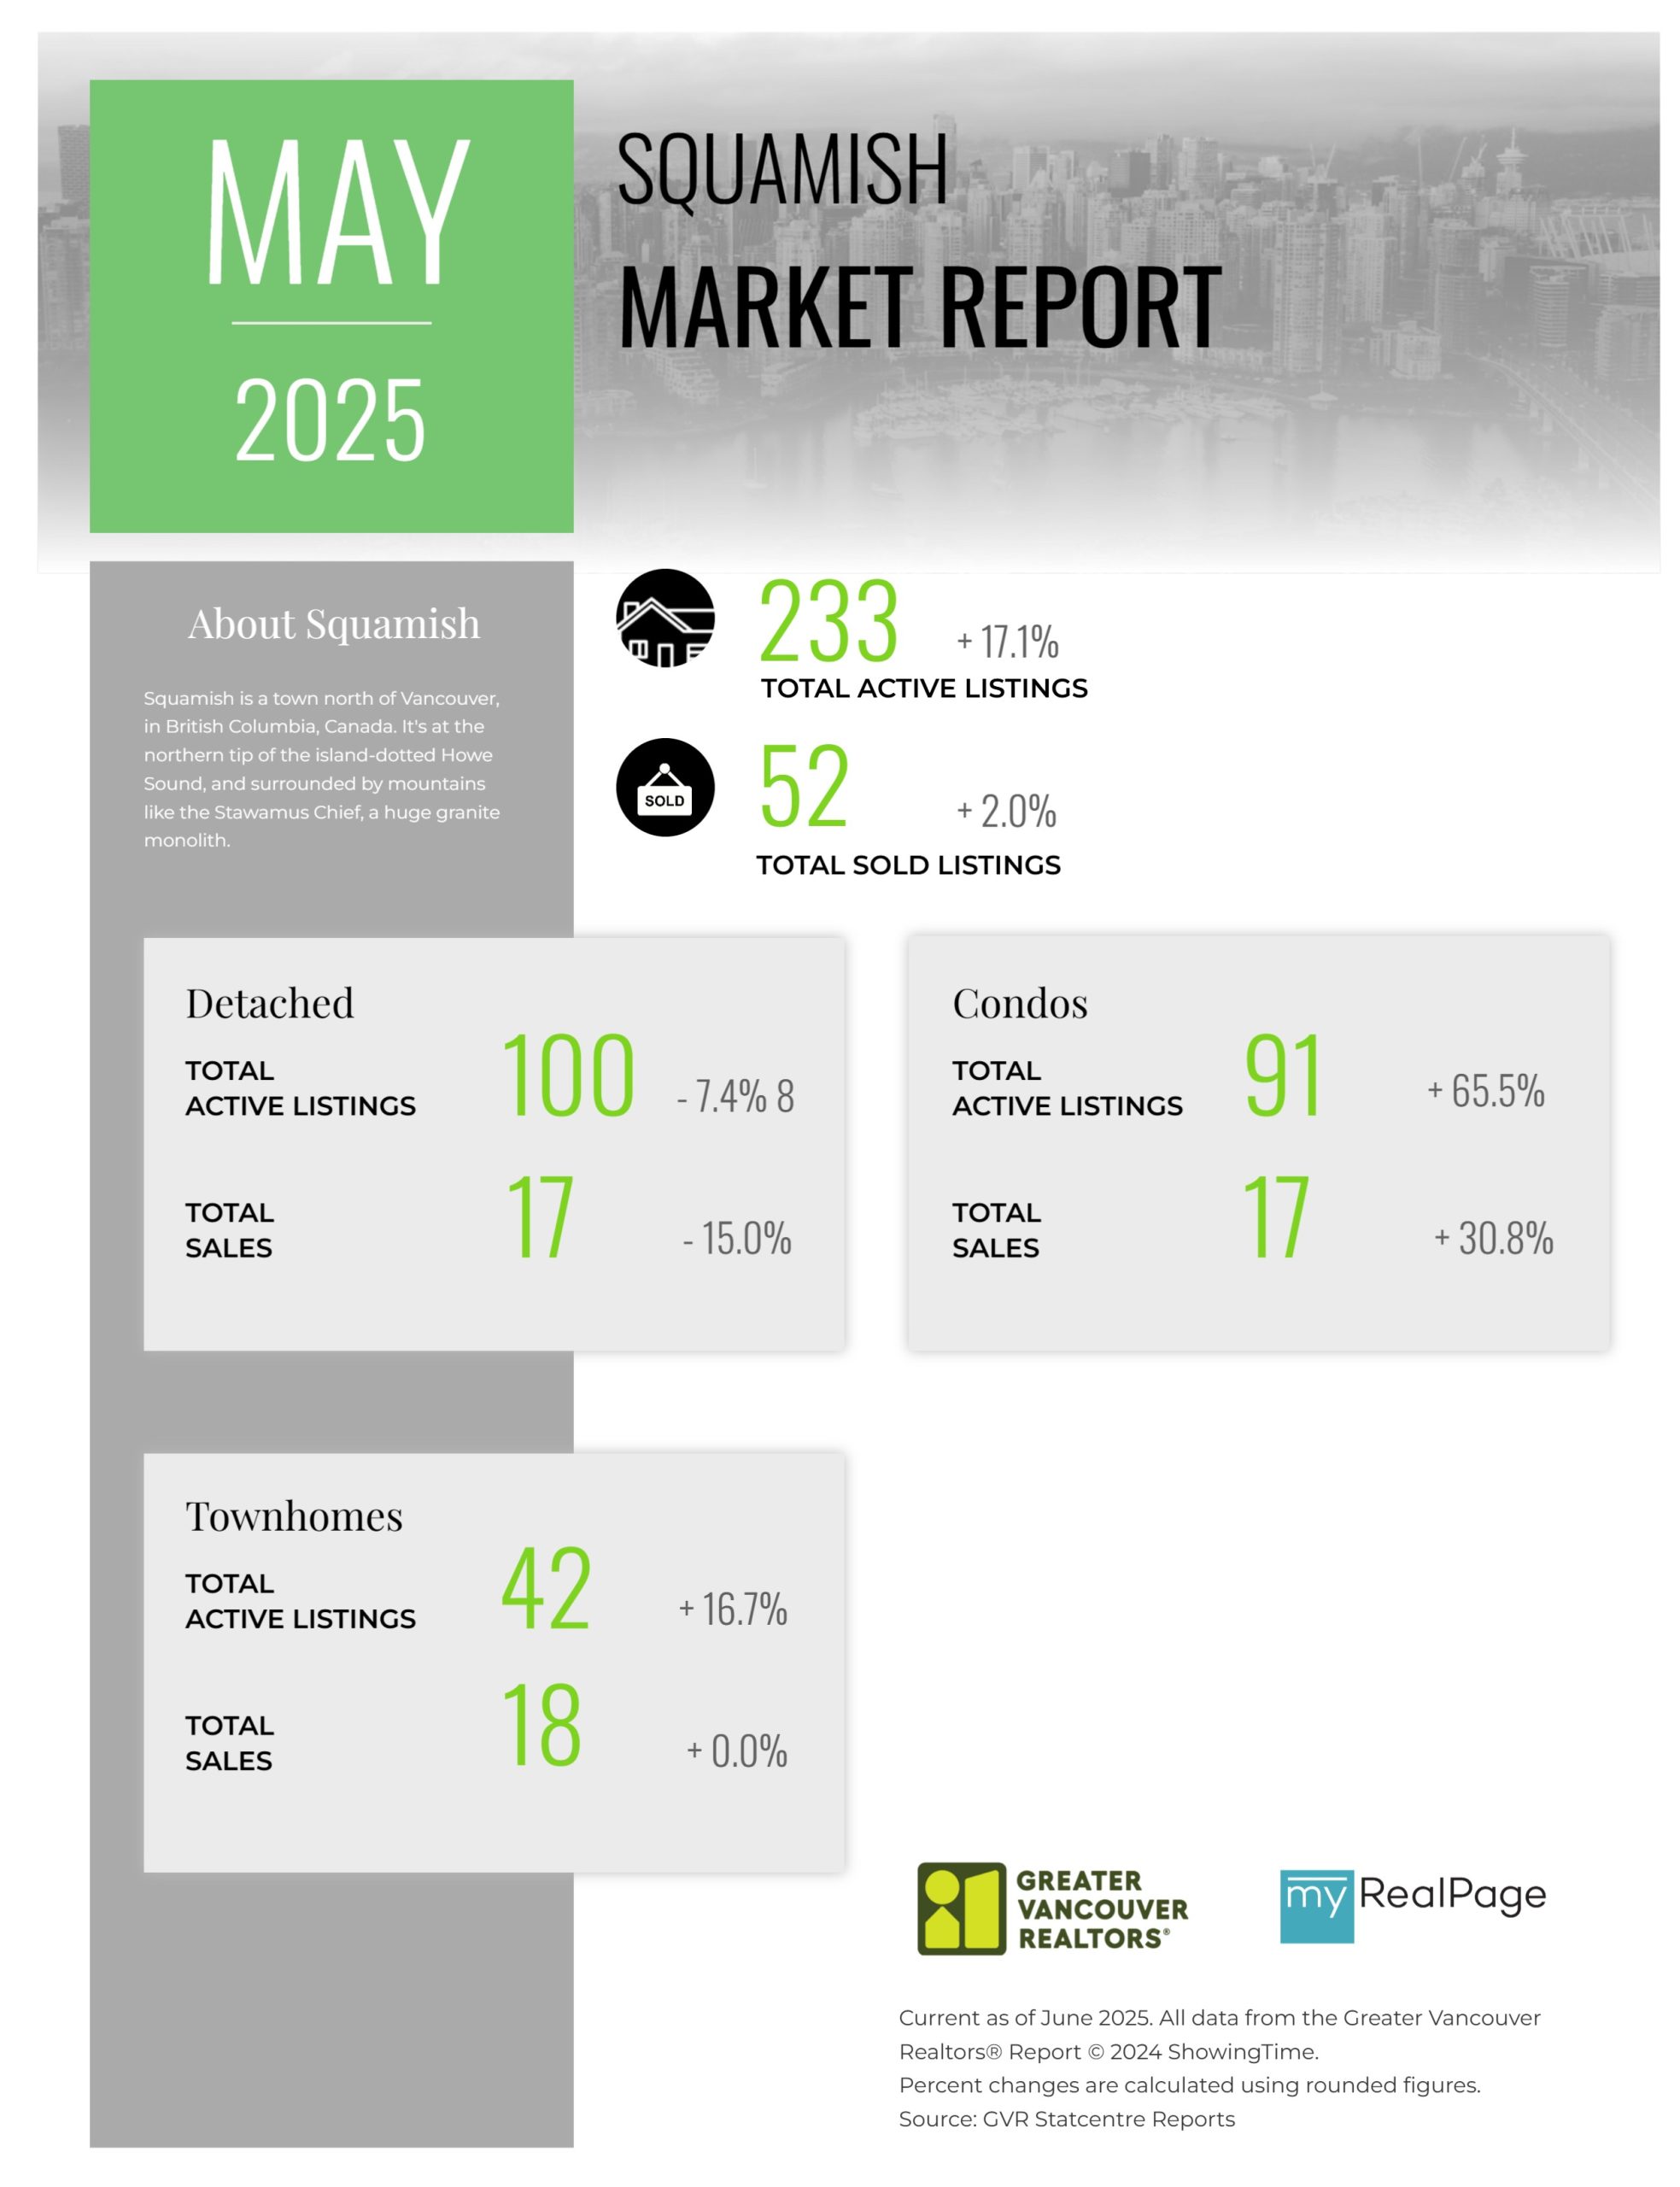
Printable Version – GVR May 2025 Data Infographics Report Squamish
Last Updated on June 12, 2025 by myRealPage
