INFOGRAPHICS: November 2025 GVR Greater Vancouver Market Reports

Housing market sees little change as year-end nears
Metro Vancouver home-sale trends observed in October continued in November, as sales registered on the MLS® remained lower than this time last year.
The Greater Vancouver REALTORS® (GVR) reports that residential sales in the region totalled 1,846 in November 2025, a 15.4 per cent decrease from the 2,181 sales recorded in November 2024. This was 20.6 per cent below the 10-year seasonal average (2,324).
“As the year draws to a close, the data continues telling a story of a market with many buyers patiently waiting and sellers adjusting to market conditions not seen in years. Inventory remains healthy, providing buyers ample choice, which, by contrast, is pushing sellers to accept that pricing must reflect this new reality. Buyers and sellers are striking deals when their expectations are aligned and reflective of the current market – not the market of years ago.” said Andrew Lis, GVR director of economics and data analytics
Read the full report on the REBGV website!
The following data is a comparison between November 2025 and November 2024 numbers, and is current as of December of 2025. For last month’s update, you can check out our previous post!
Or follow this link for all our GVR Infographics!
These infographics cover current trends in several areas within the Greater Vancouver region. Click on the images for a larger view!
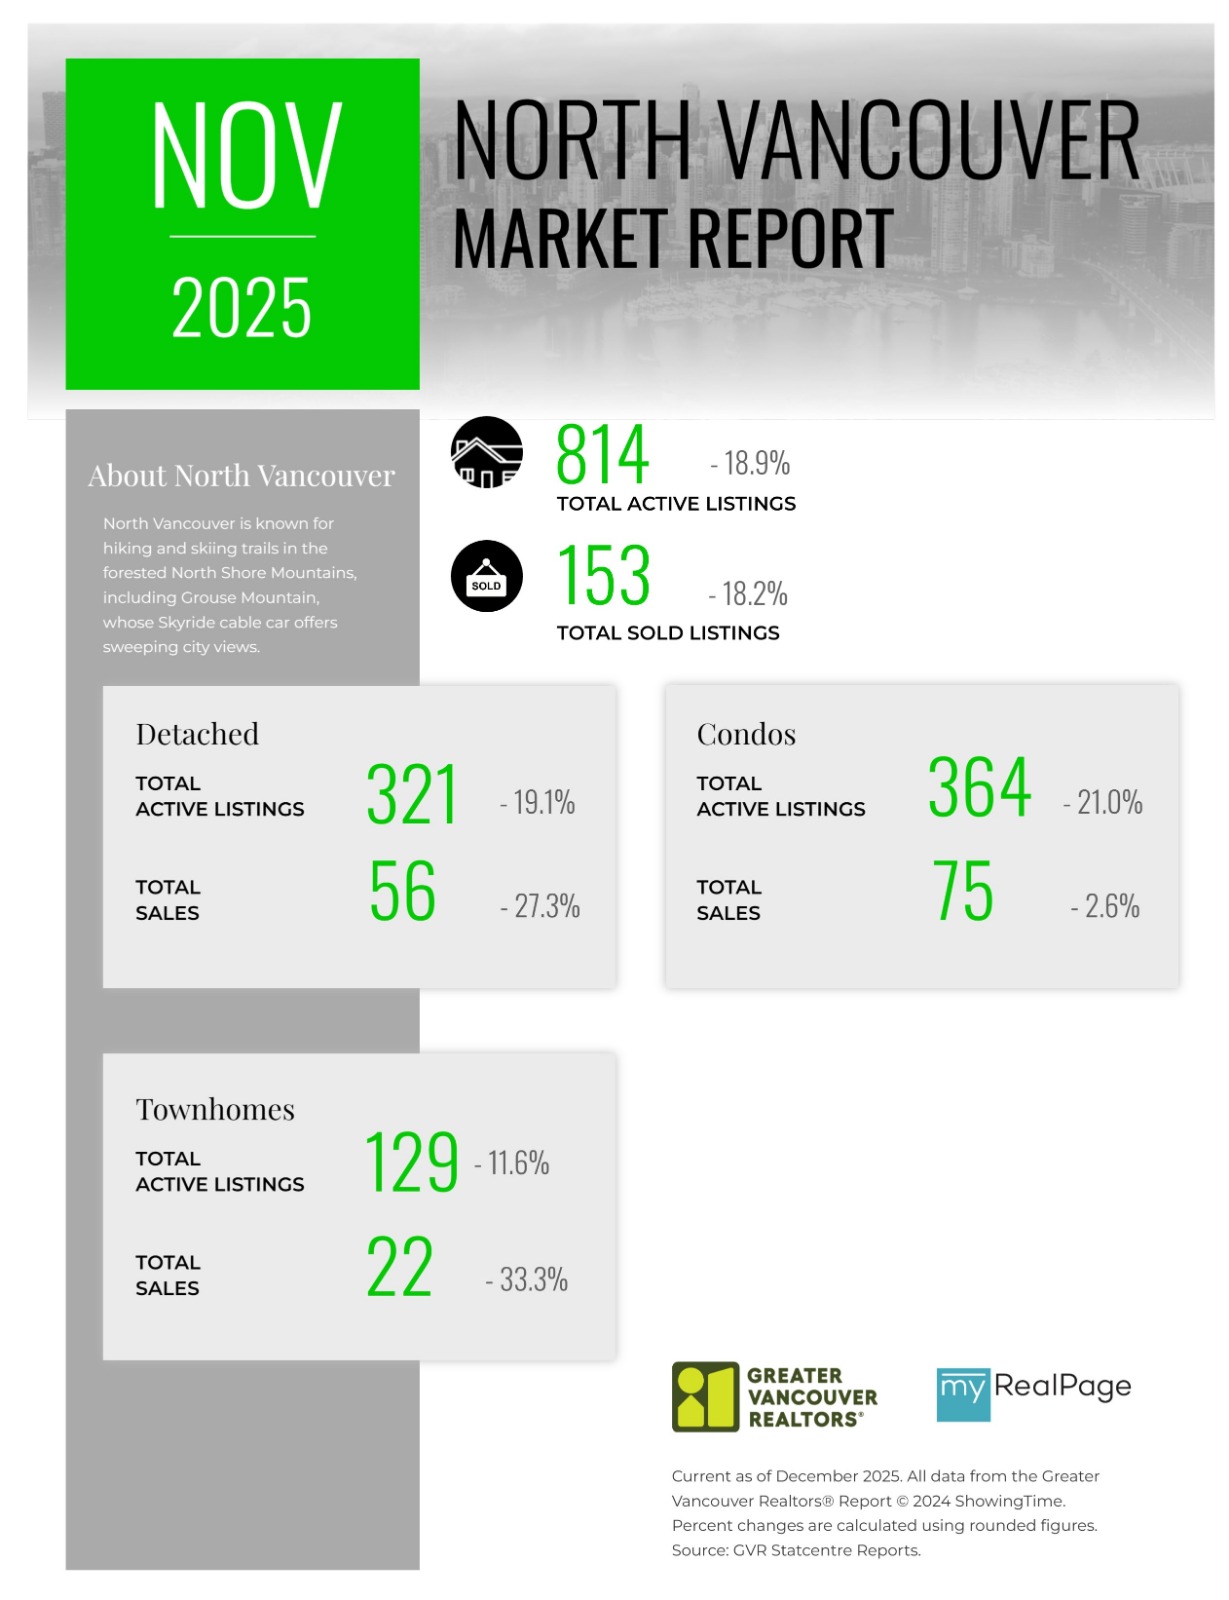
Printable Version – GVR November 2025 Data Infographic Report North Vancouver
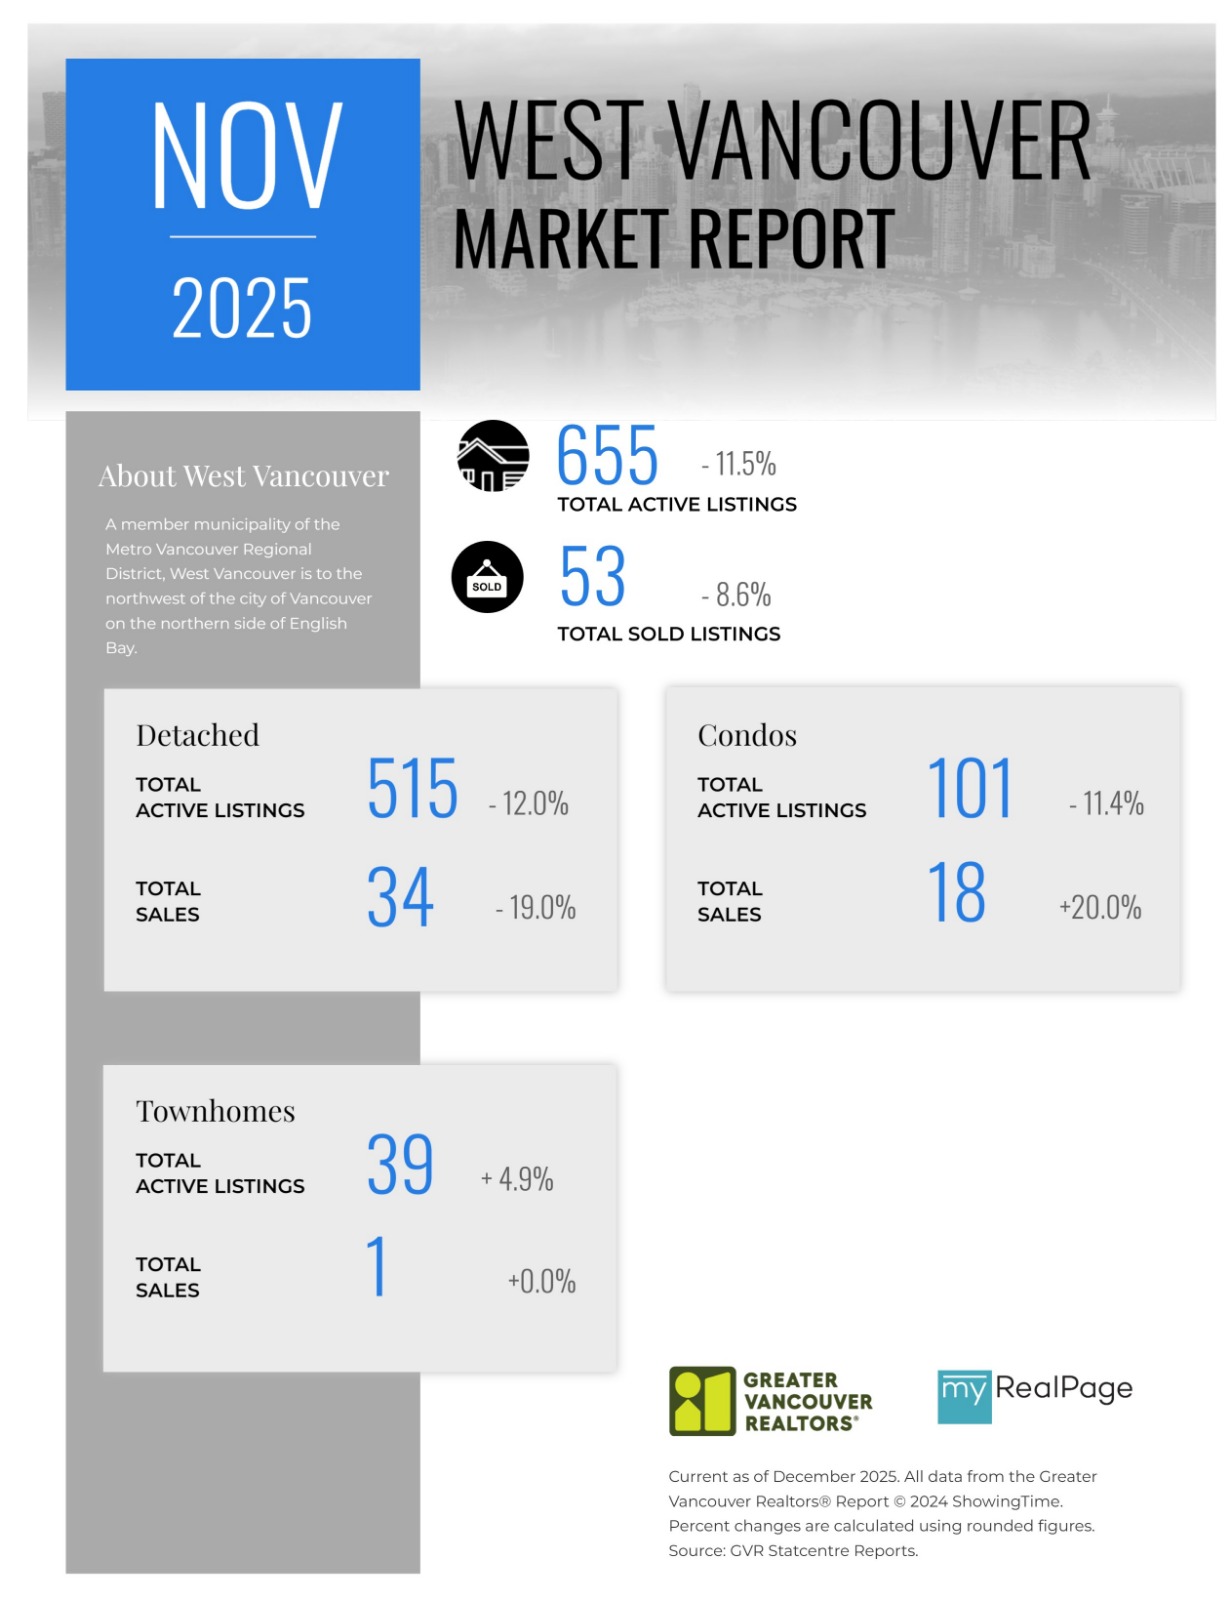
Printable Version – GVR November 2025 Data Infographics Report West Vancouver
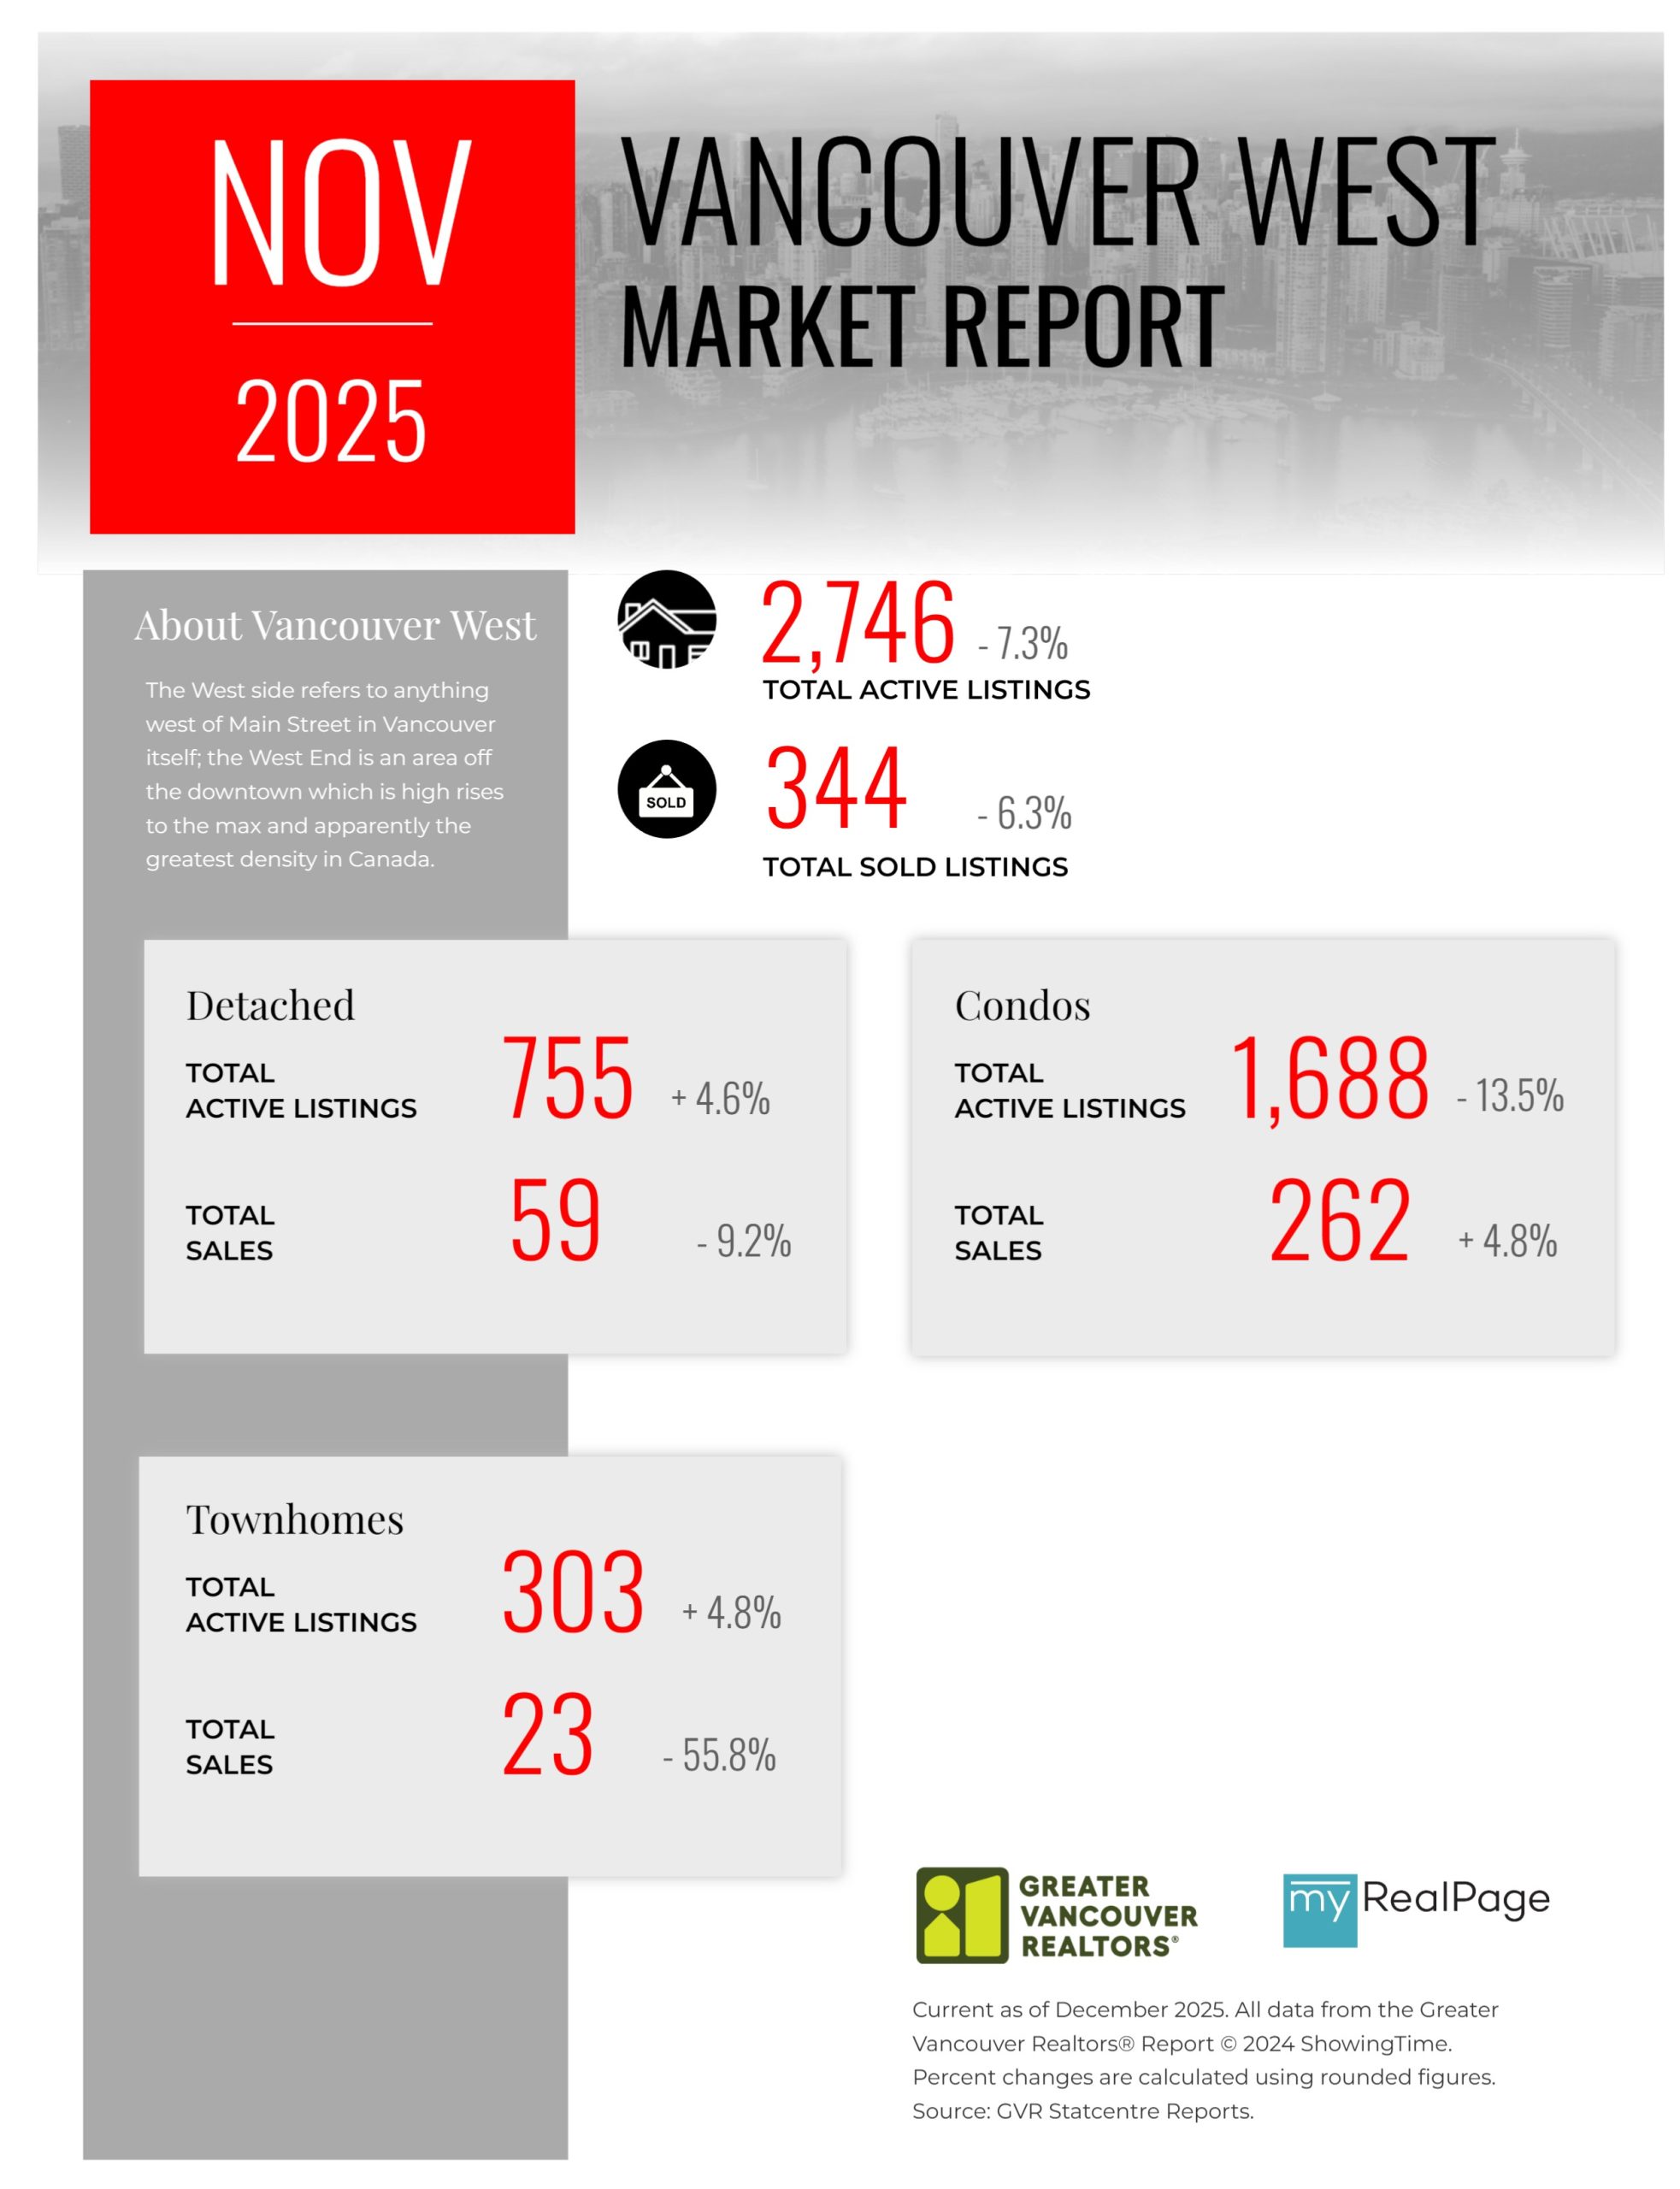
Printable Version – GVR November 2025 Data Infographics Report Vancouver West
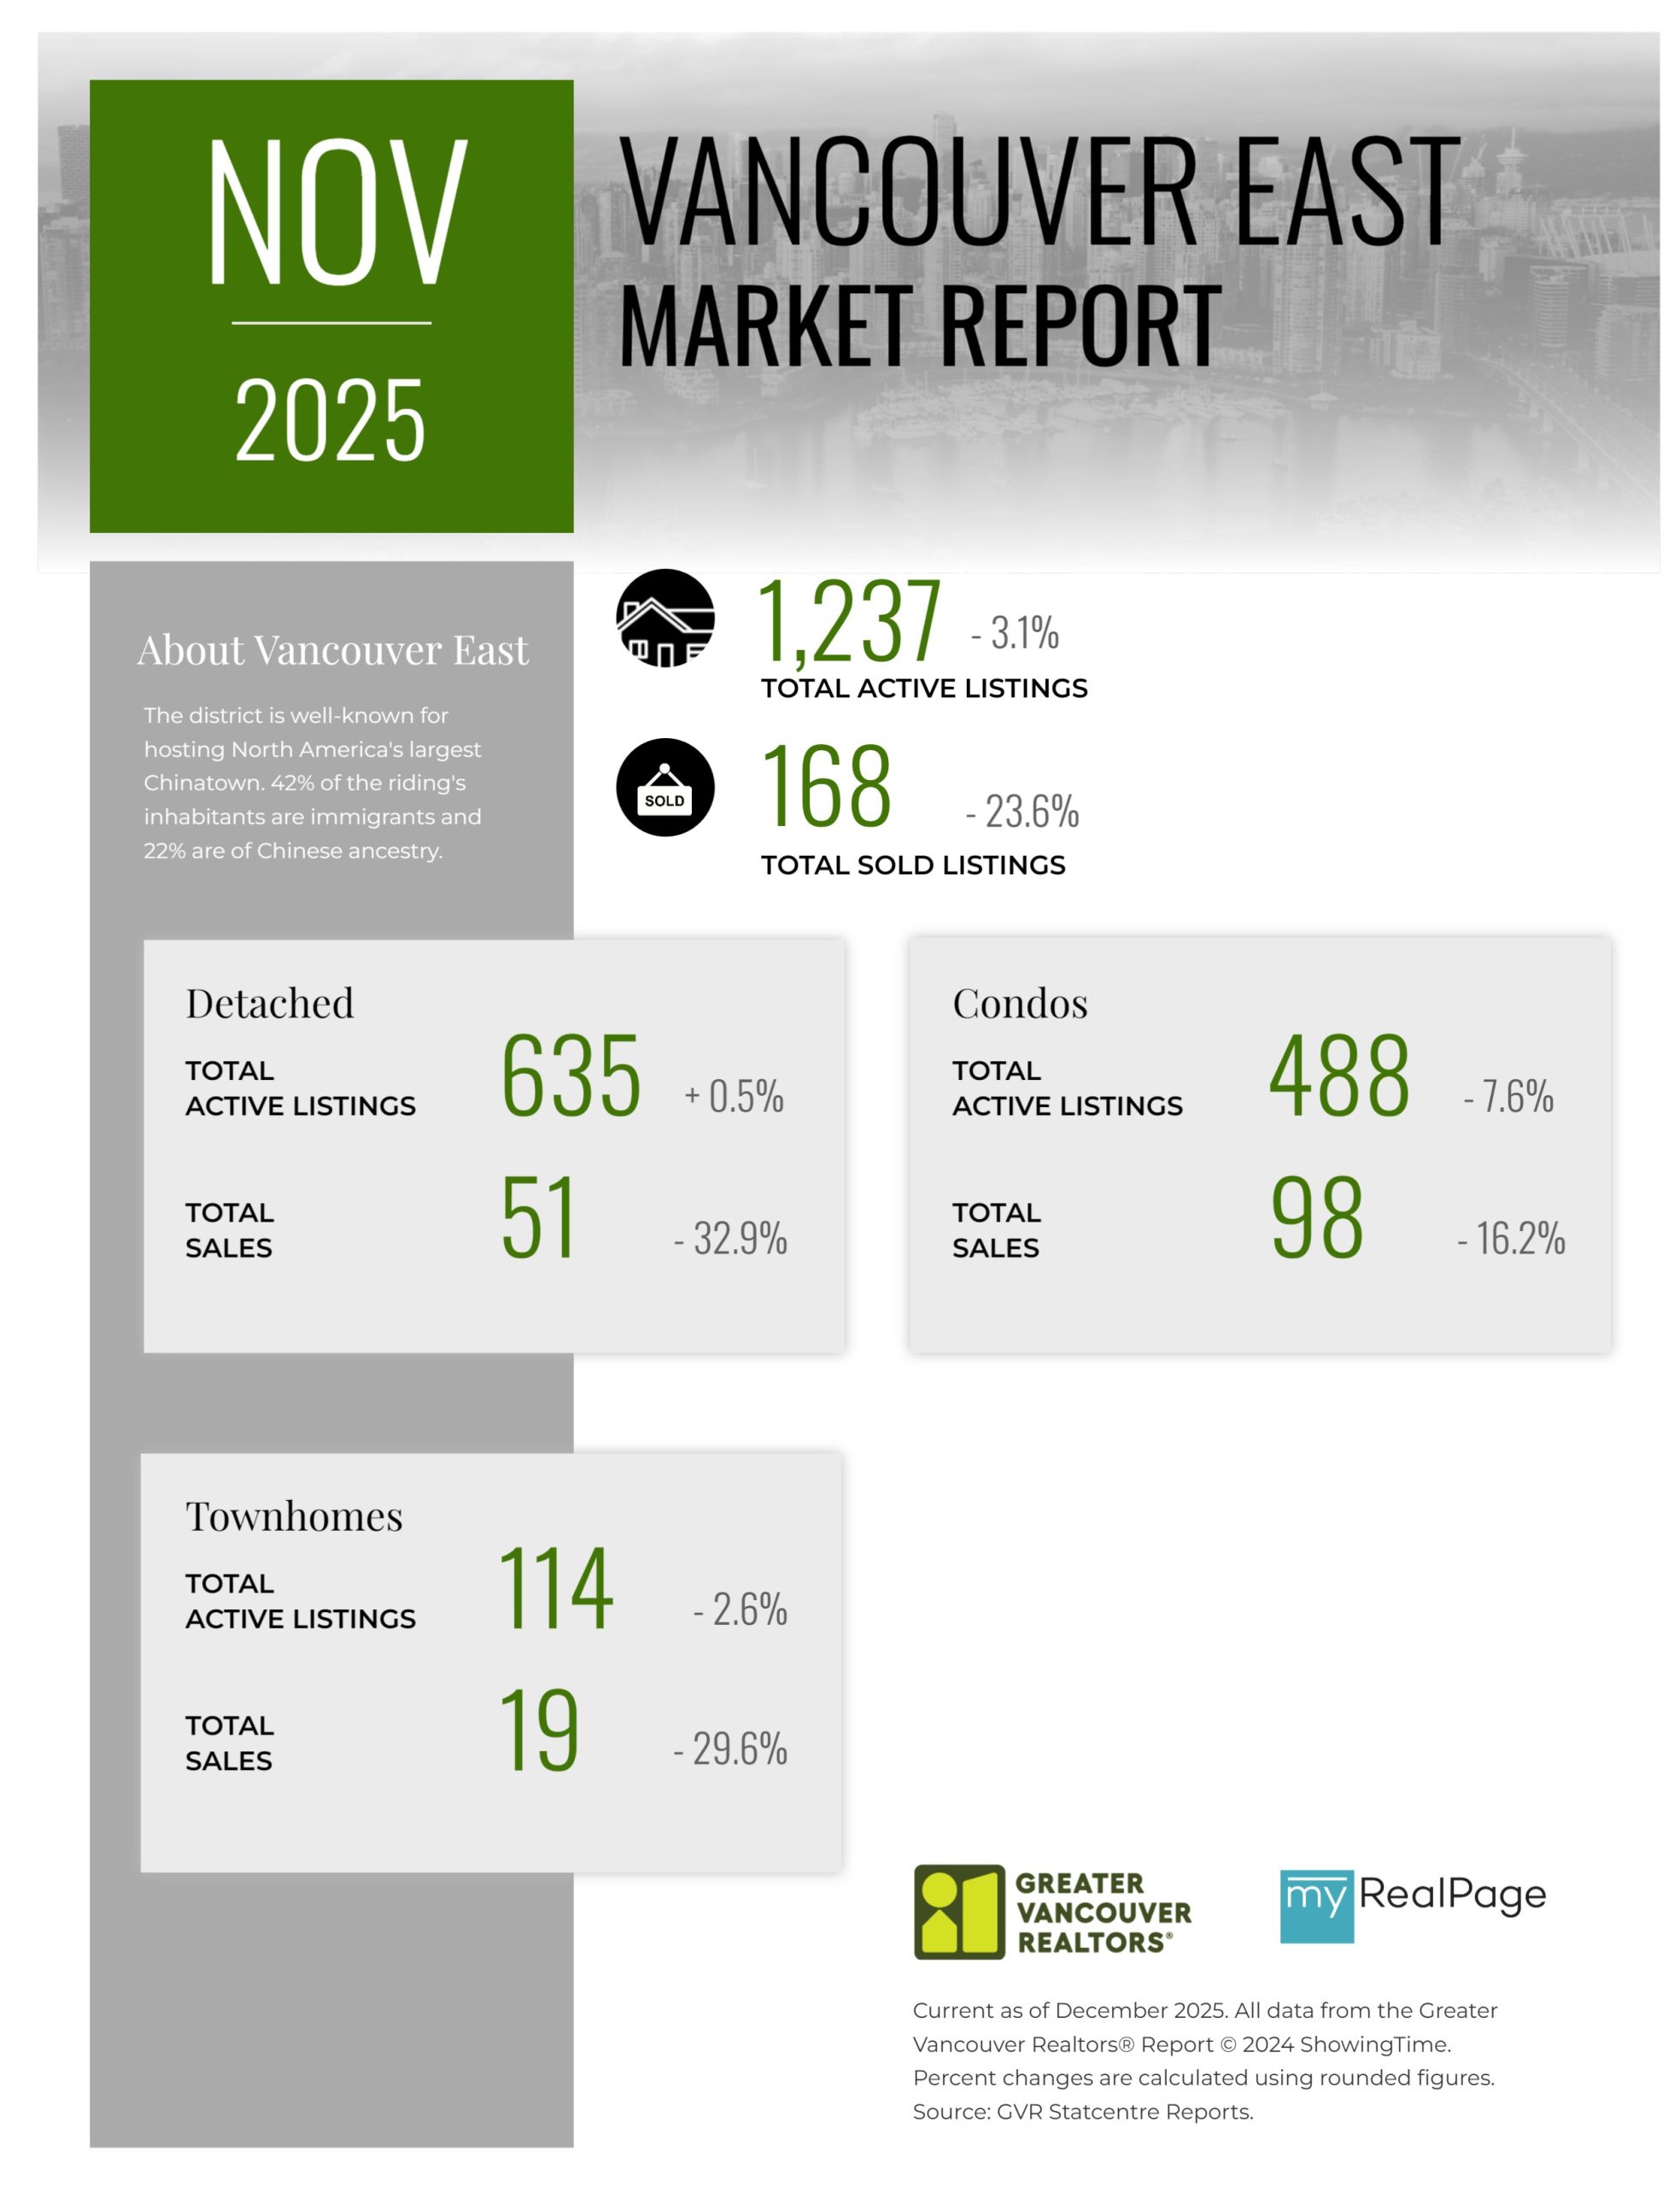
Printable Version – GVR November 2025 Data Infographics Report Vancouver East
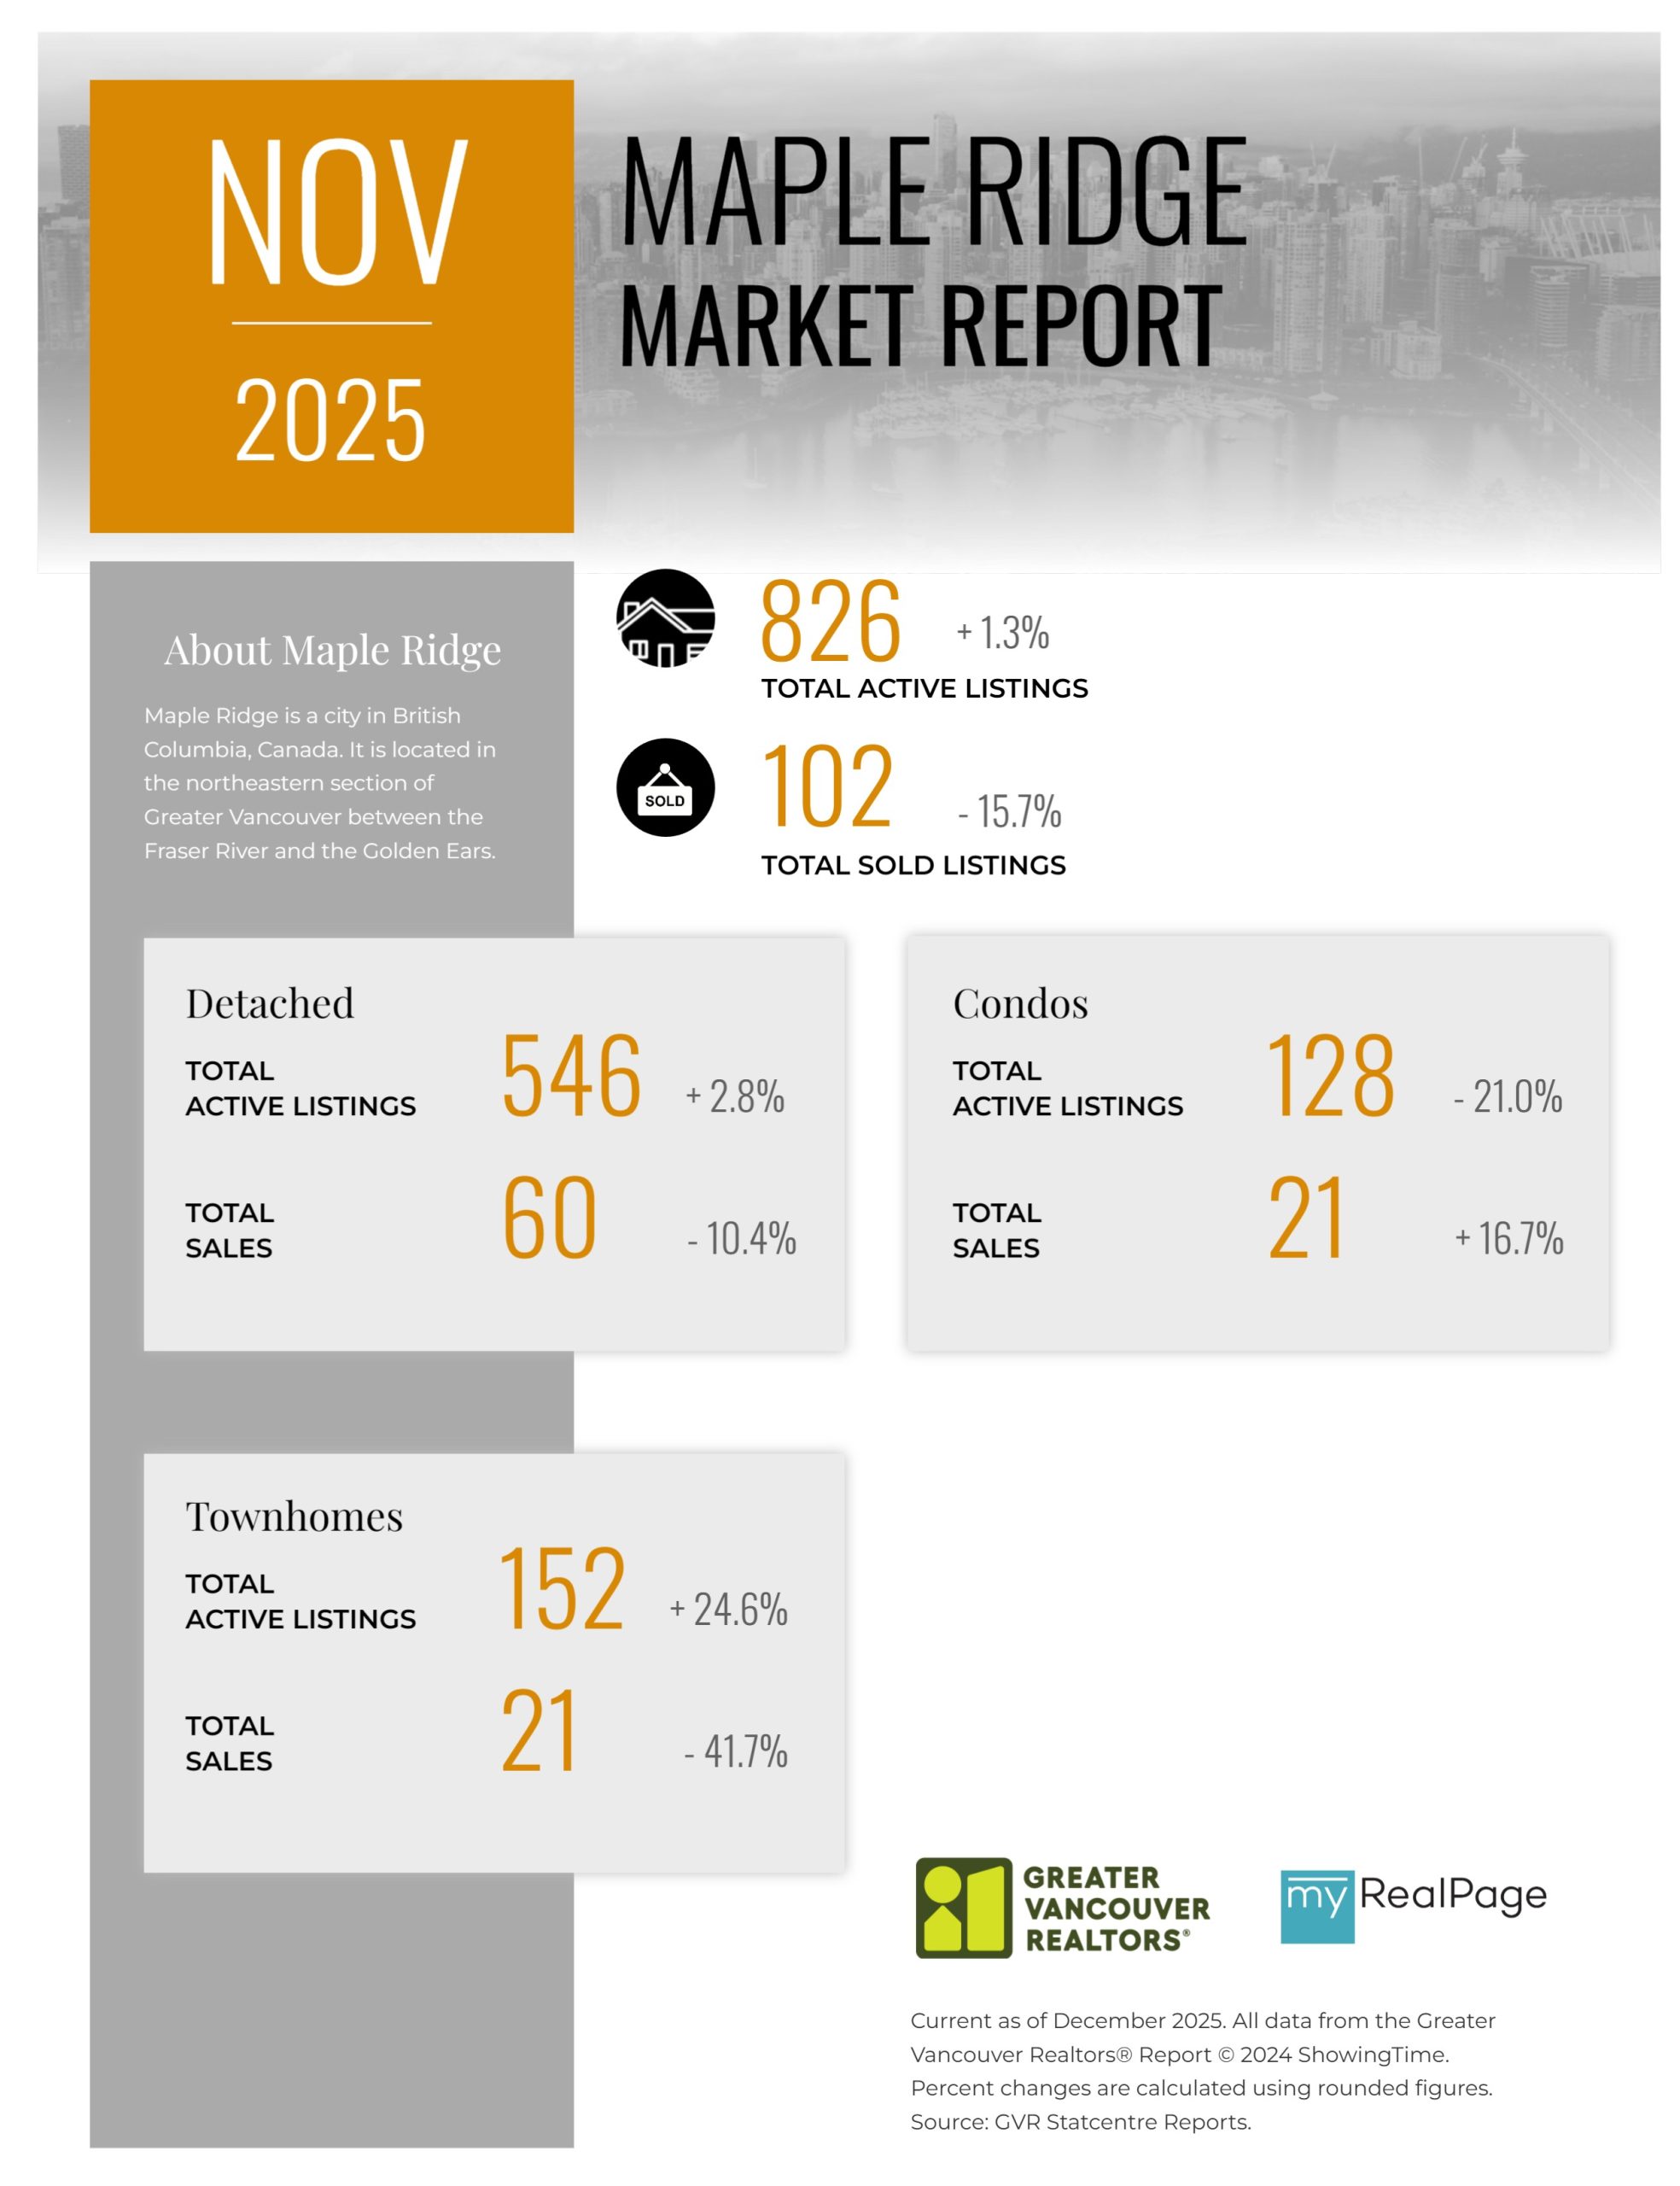
Printable Version – GVR November 2025 Data Infographic Report Maple Ridge
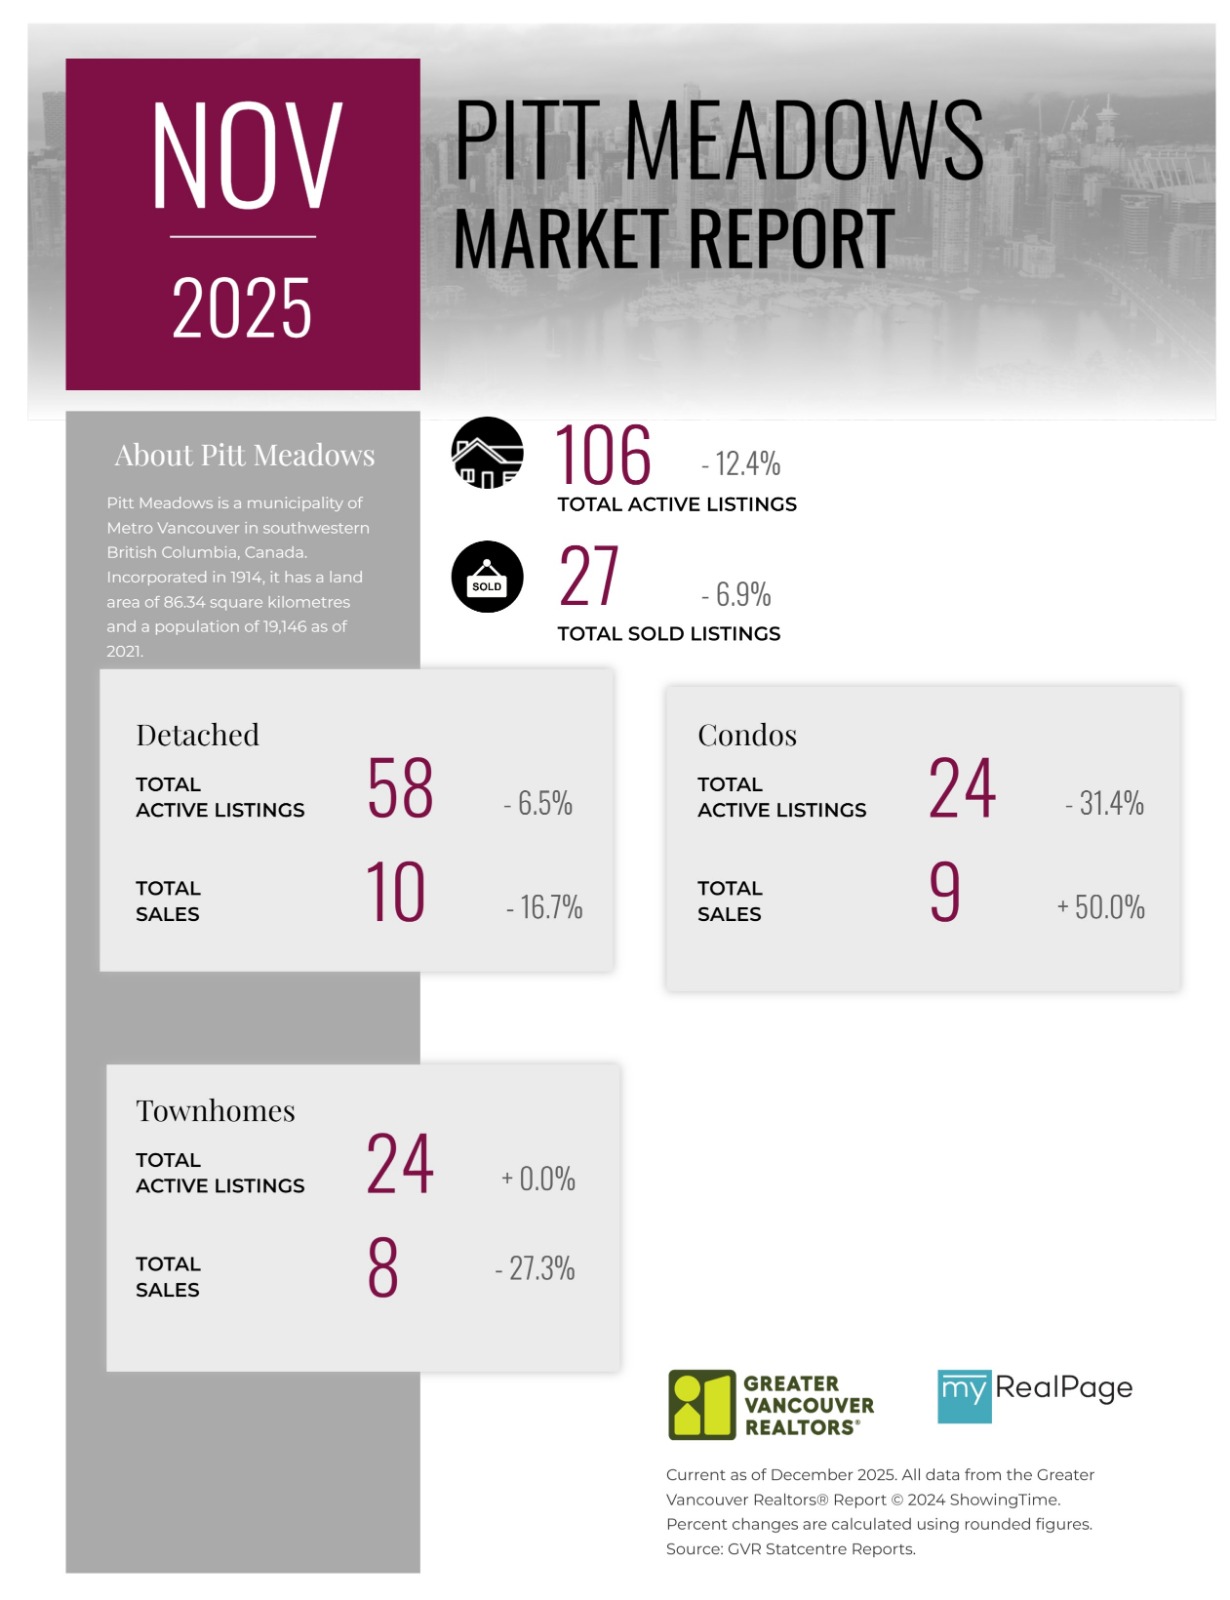
Printable Version – GVR November 2025 Data Infographics Report Pitt Meadows
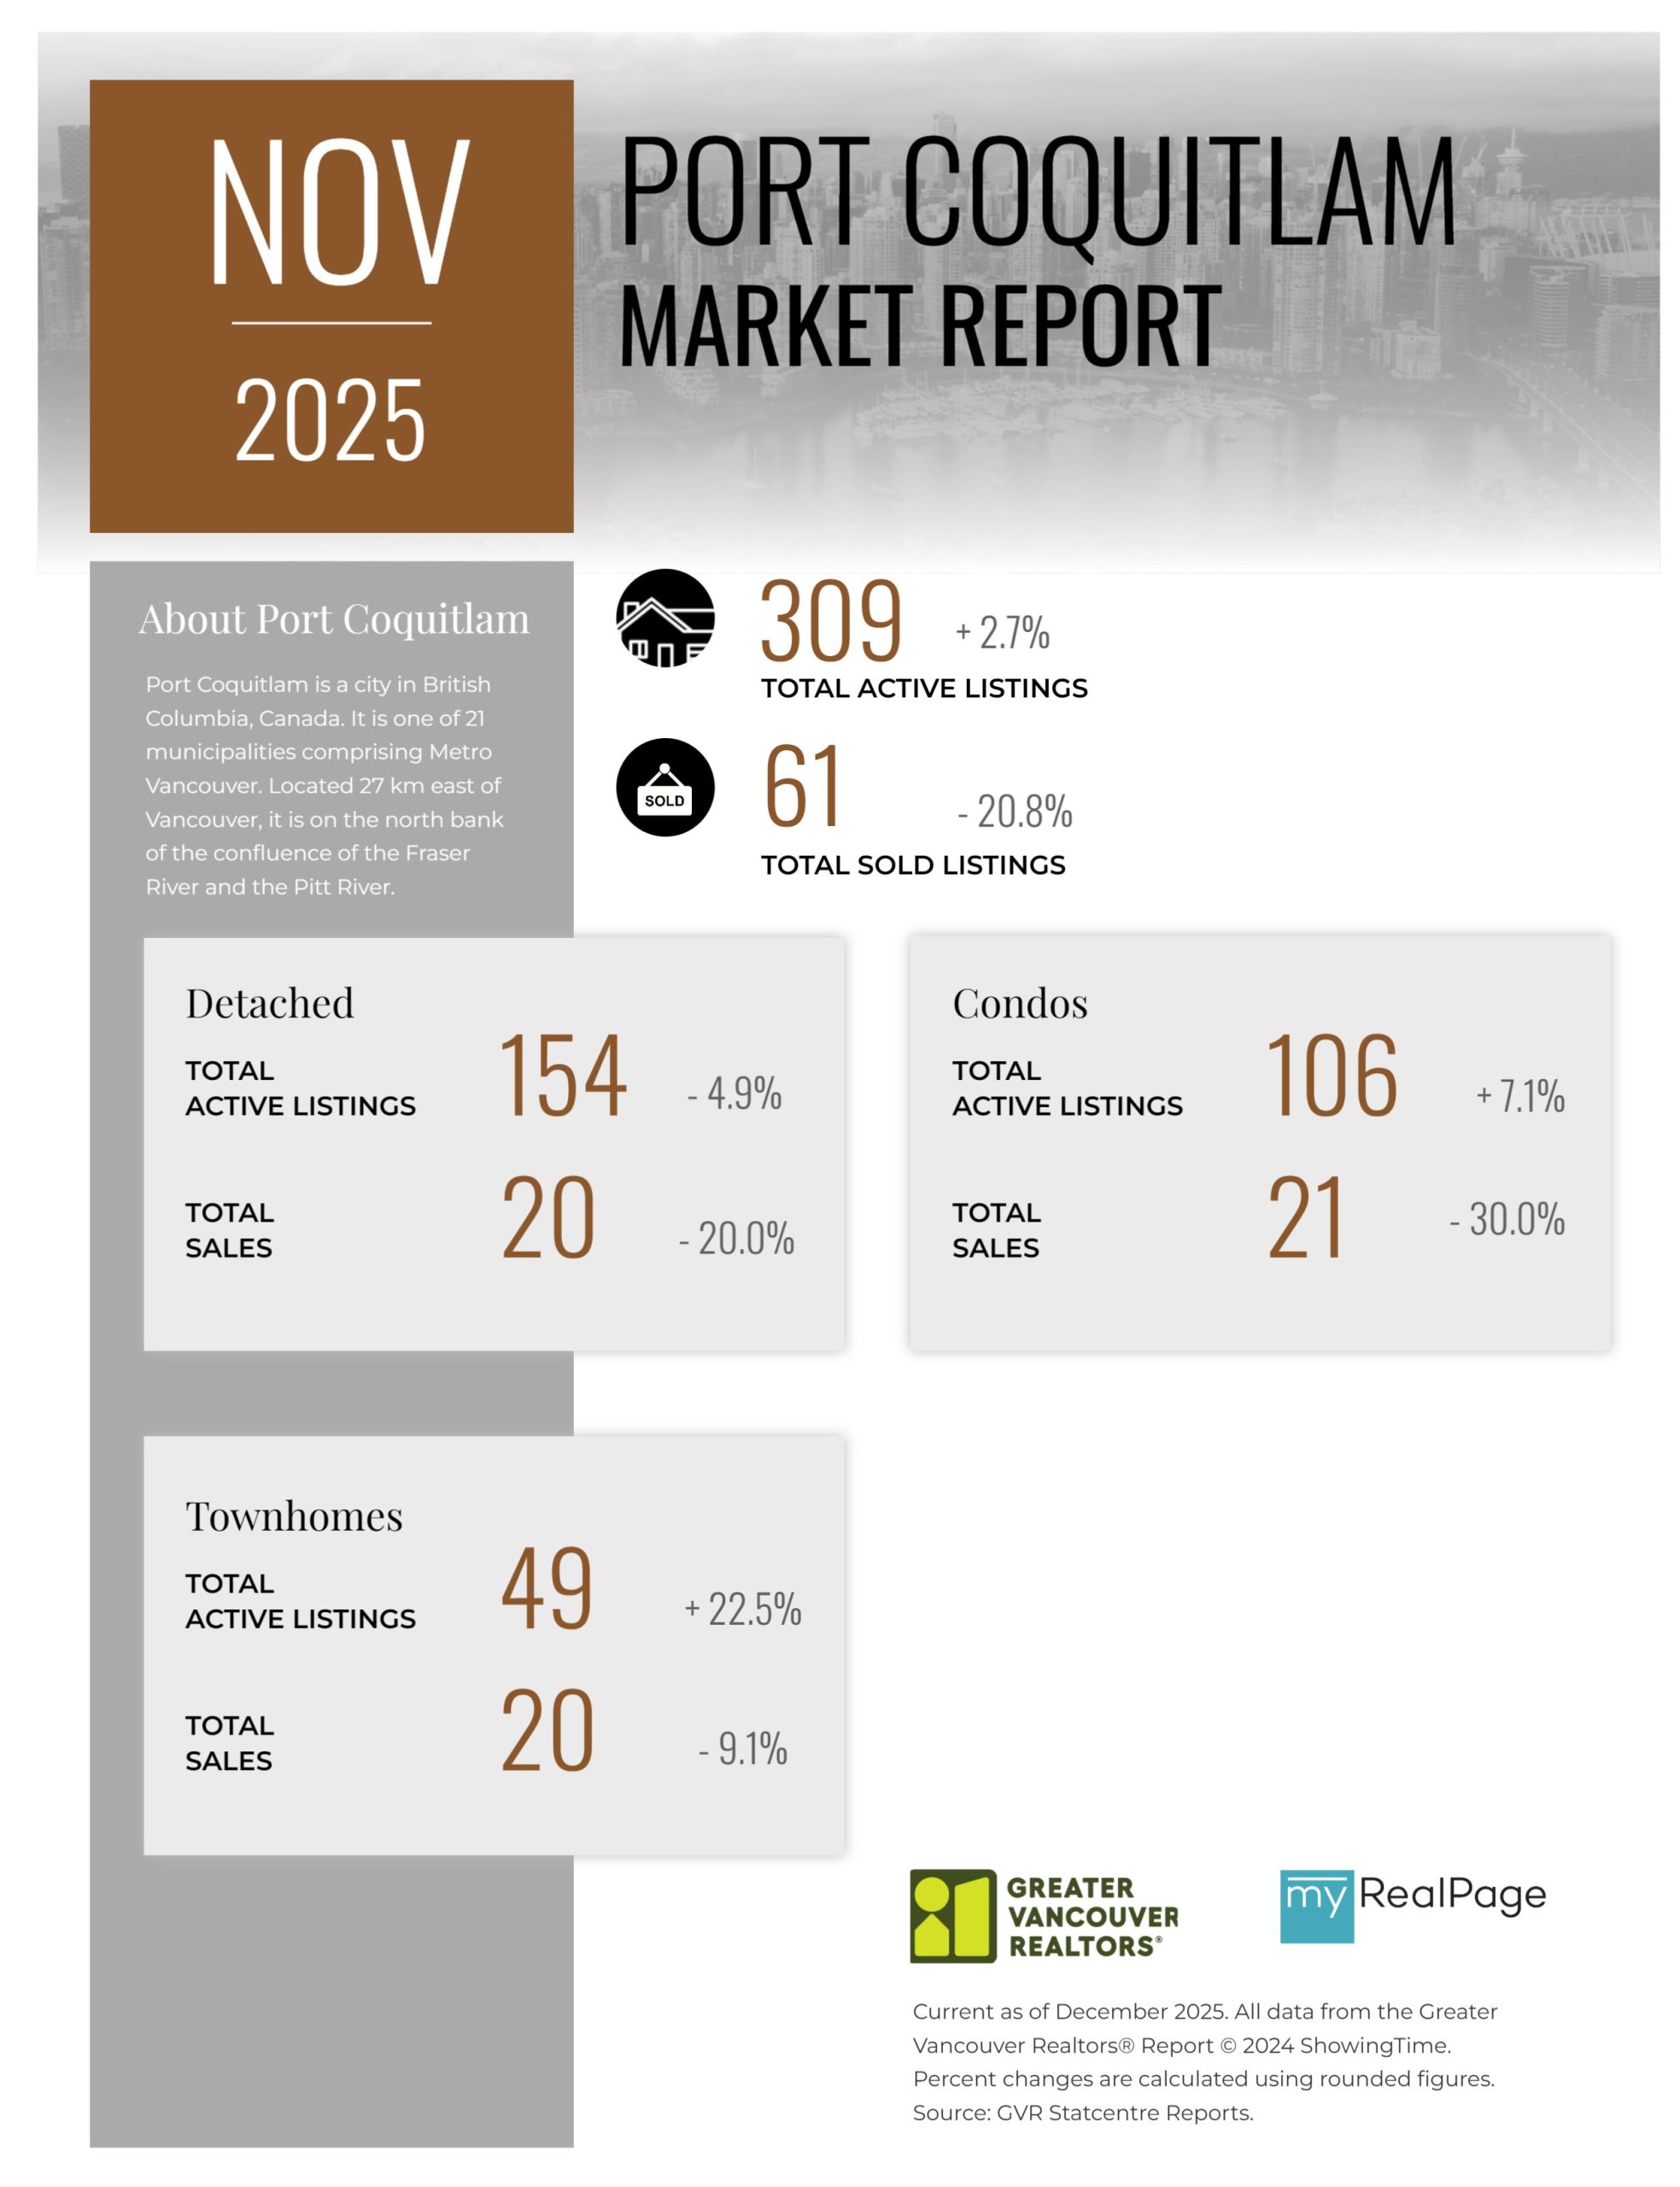
Printable Version – GVR November 2025 Data Infographics Report Port Coquitlam
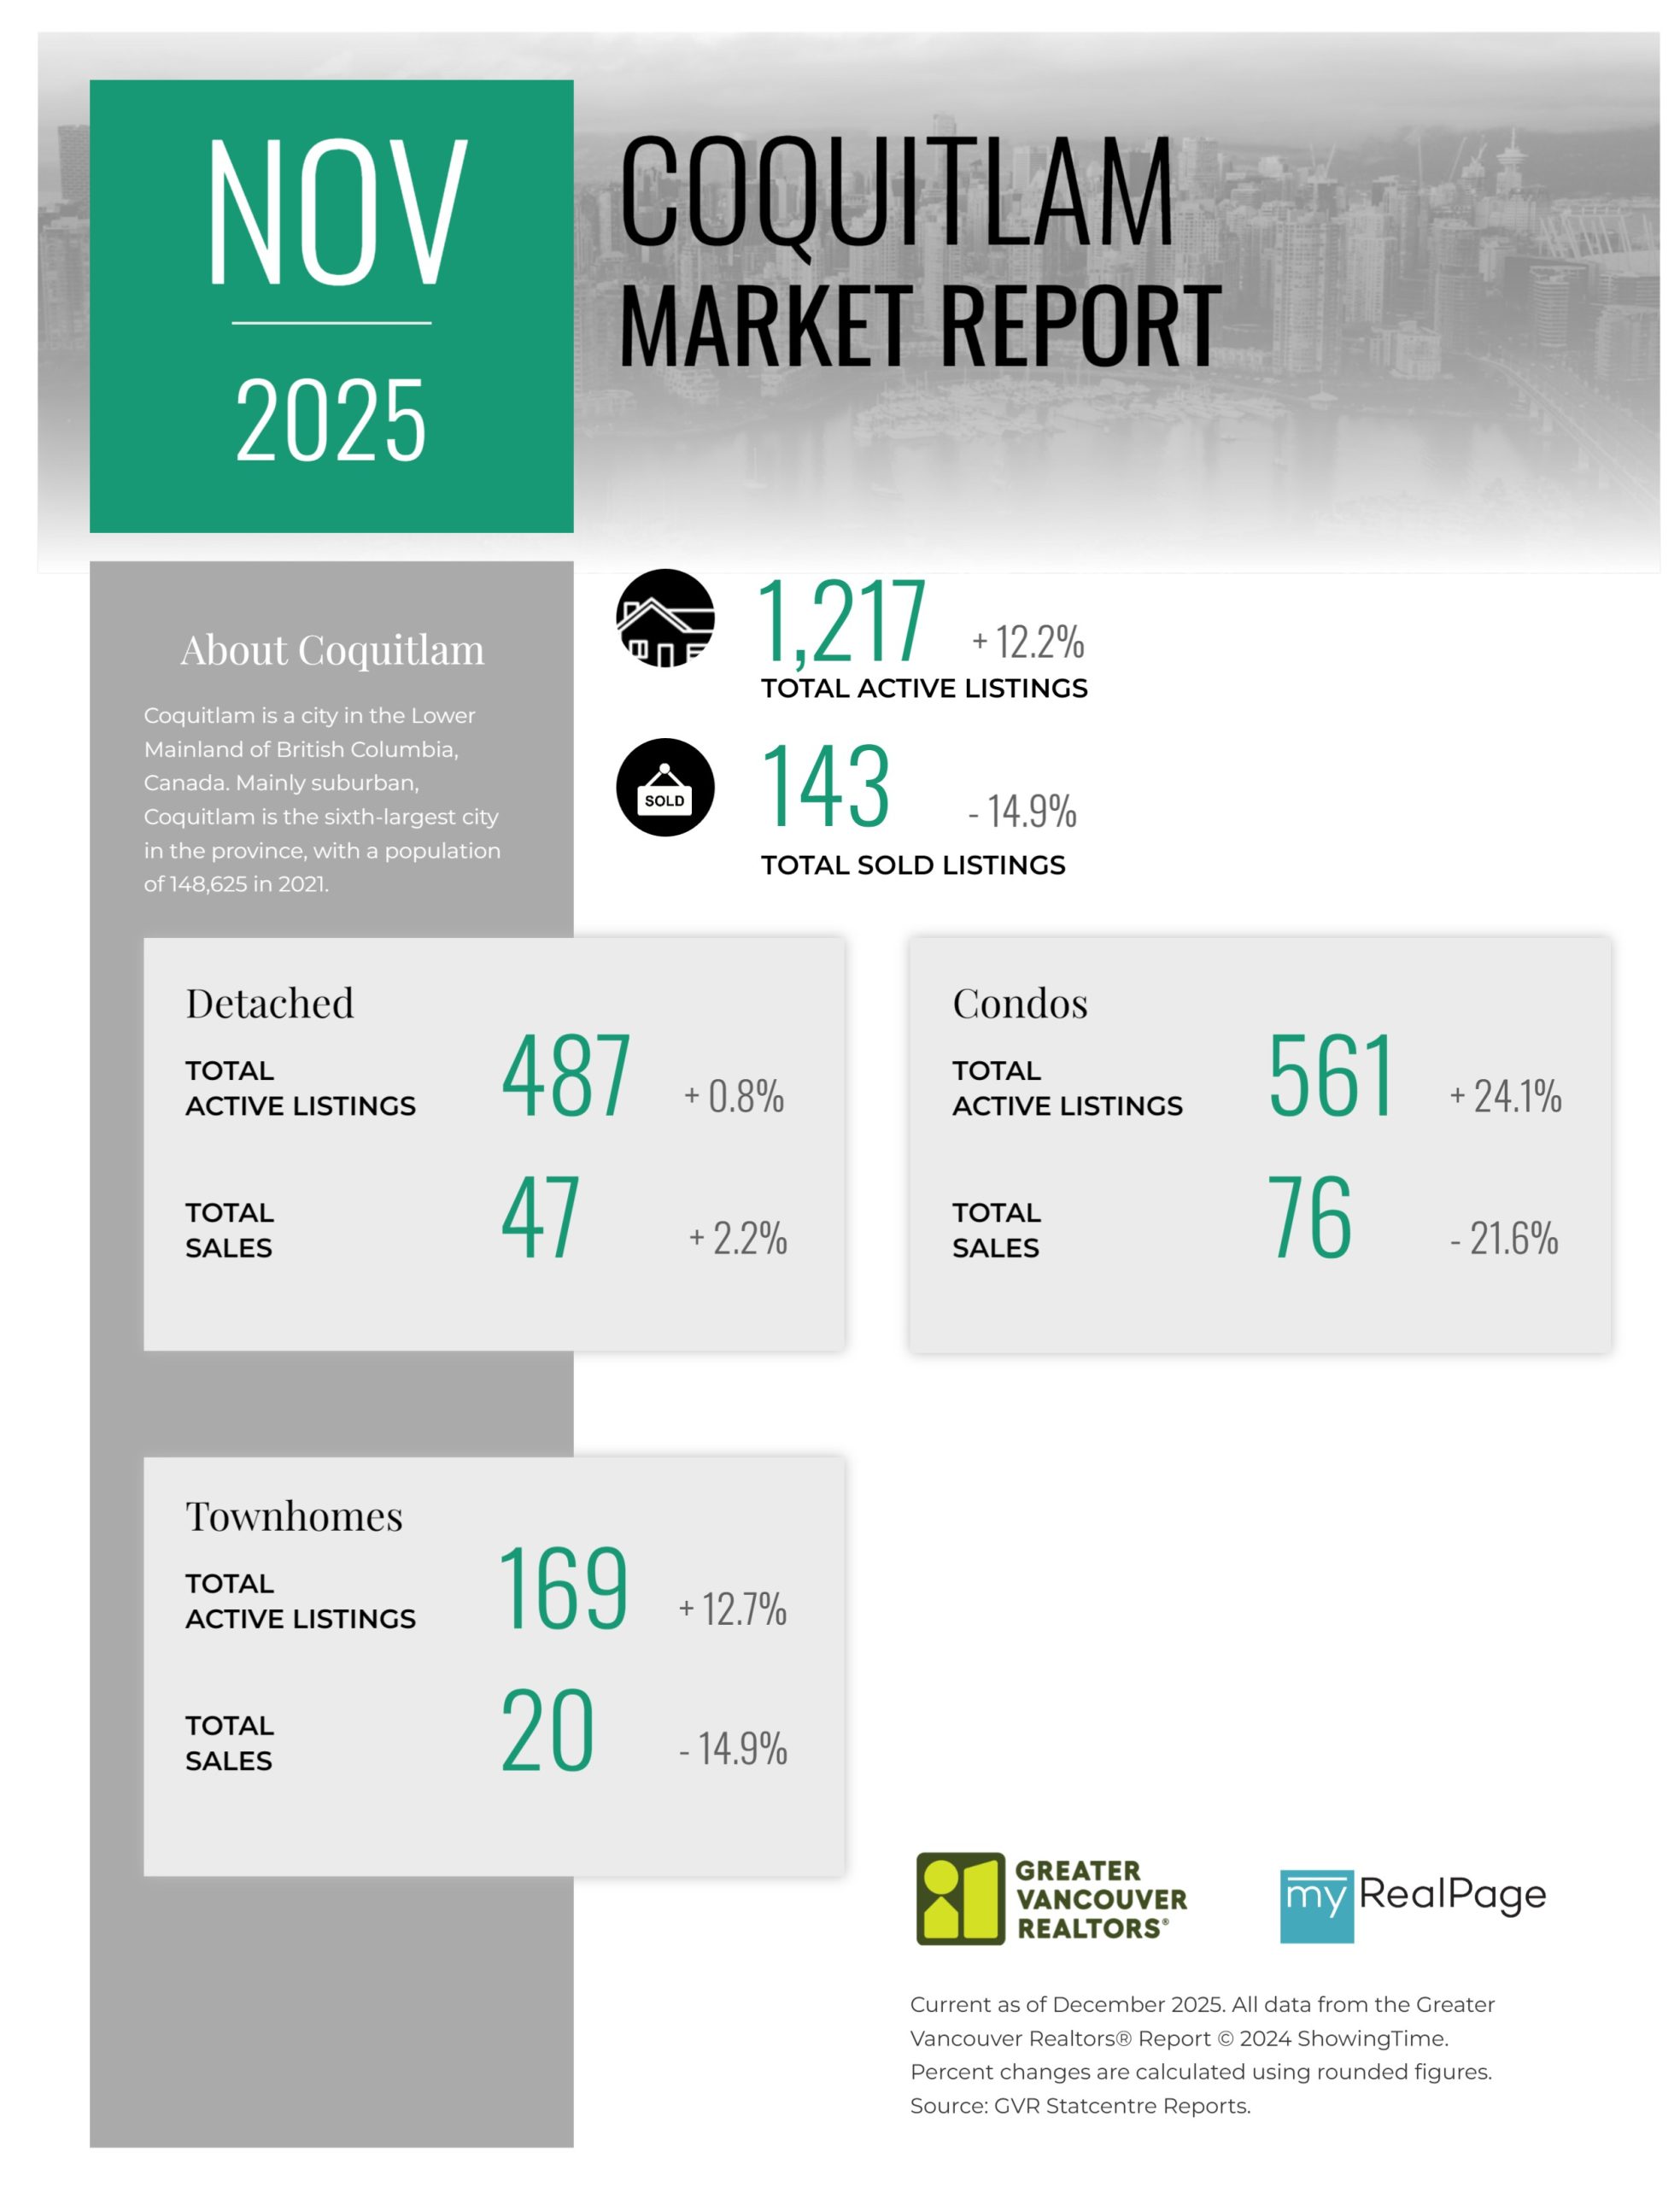
Printable Version – GVR November 2025 Data Infographics Report Coquitlam
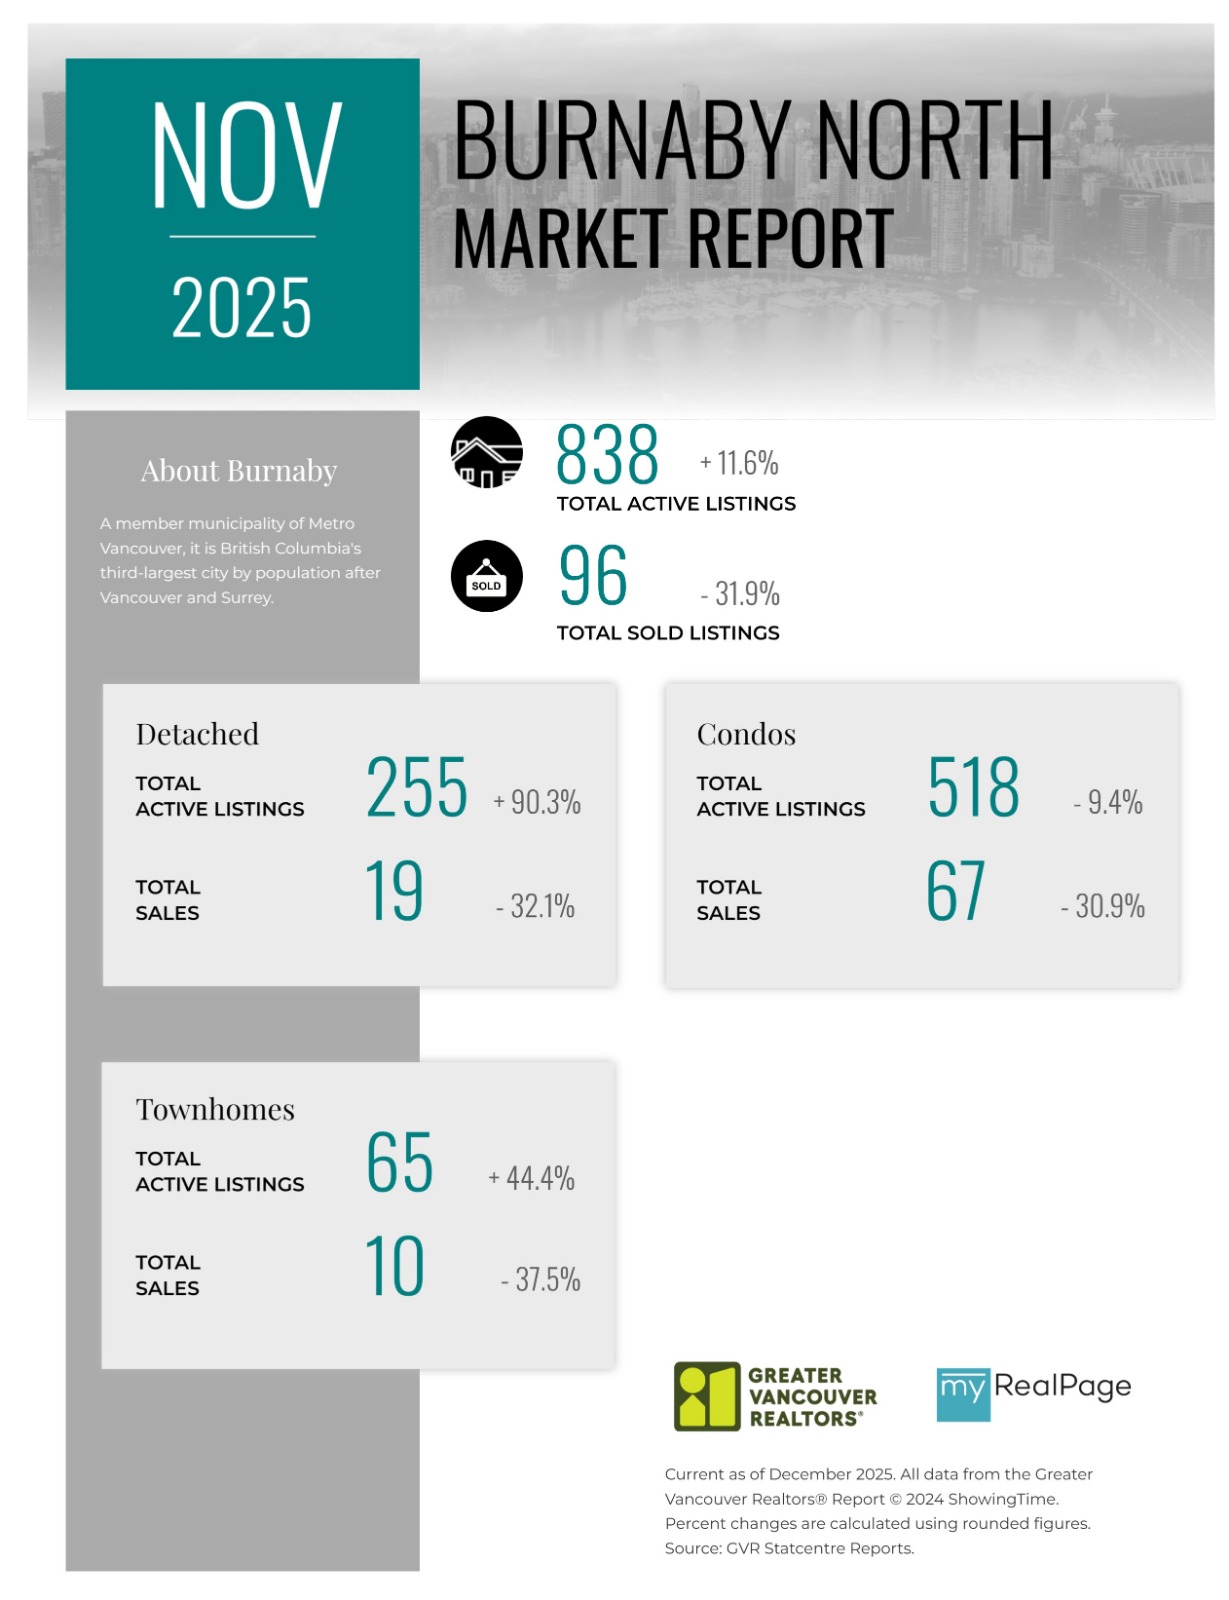
Printable Version – GVR November 2025 Data Infographic Report Burnaby North
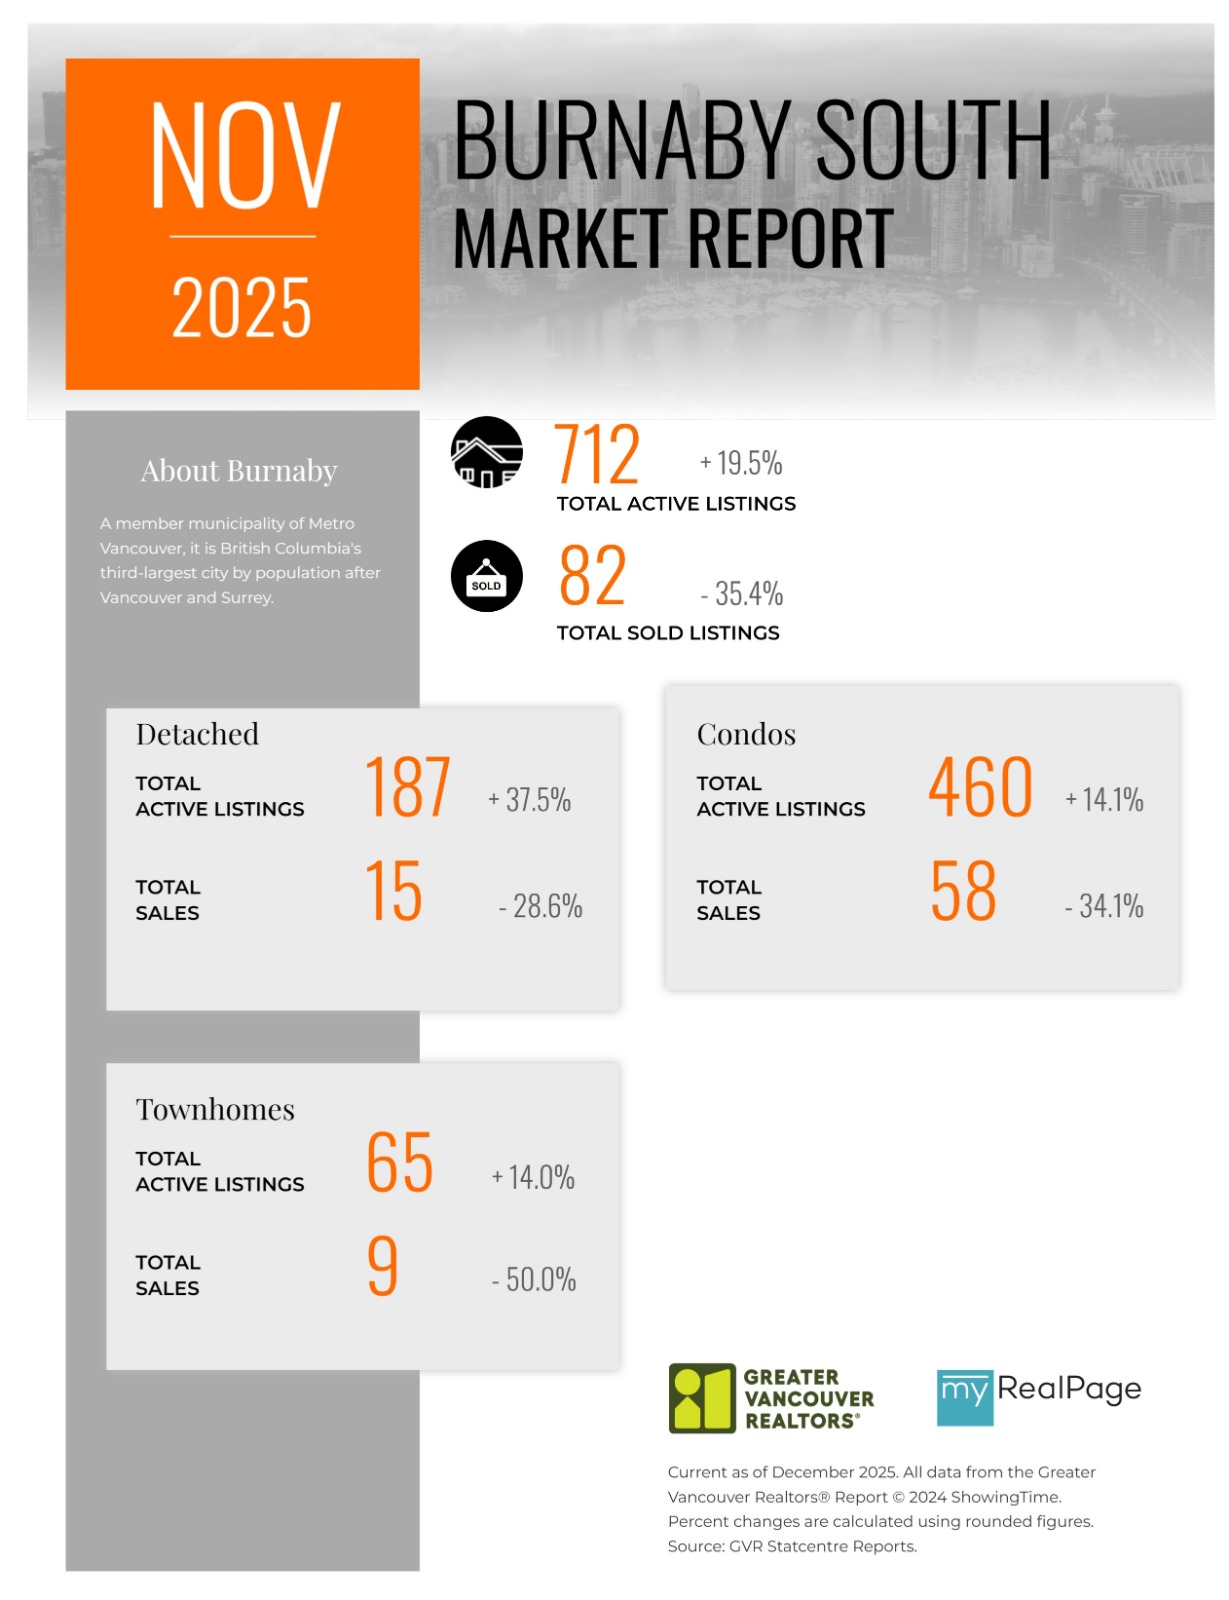
Printable Version – GVR November 2025 Data Infographics Report Burnaby South
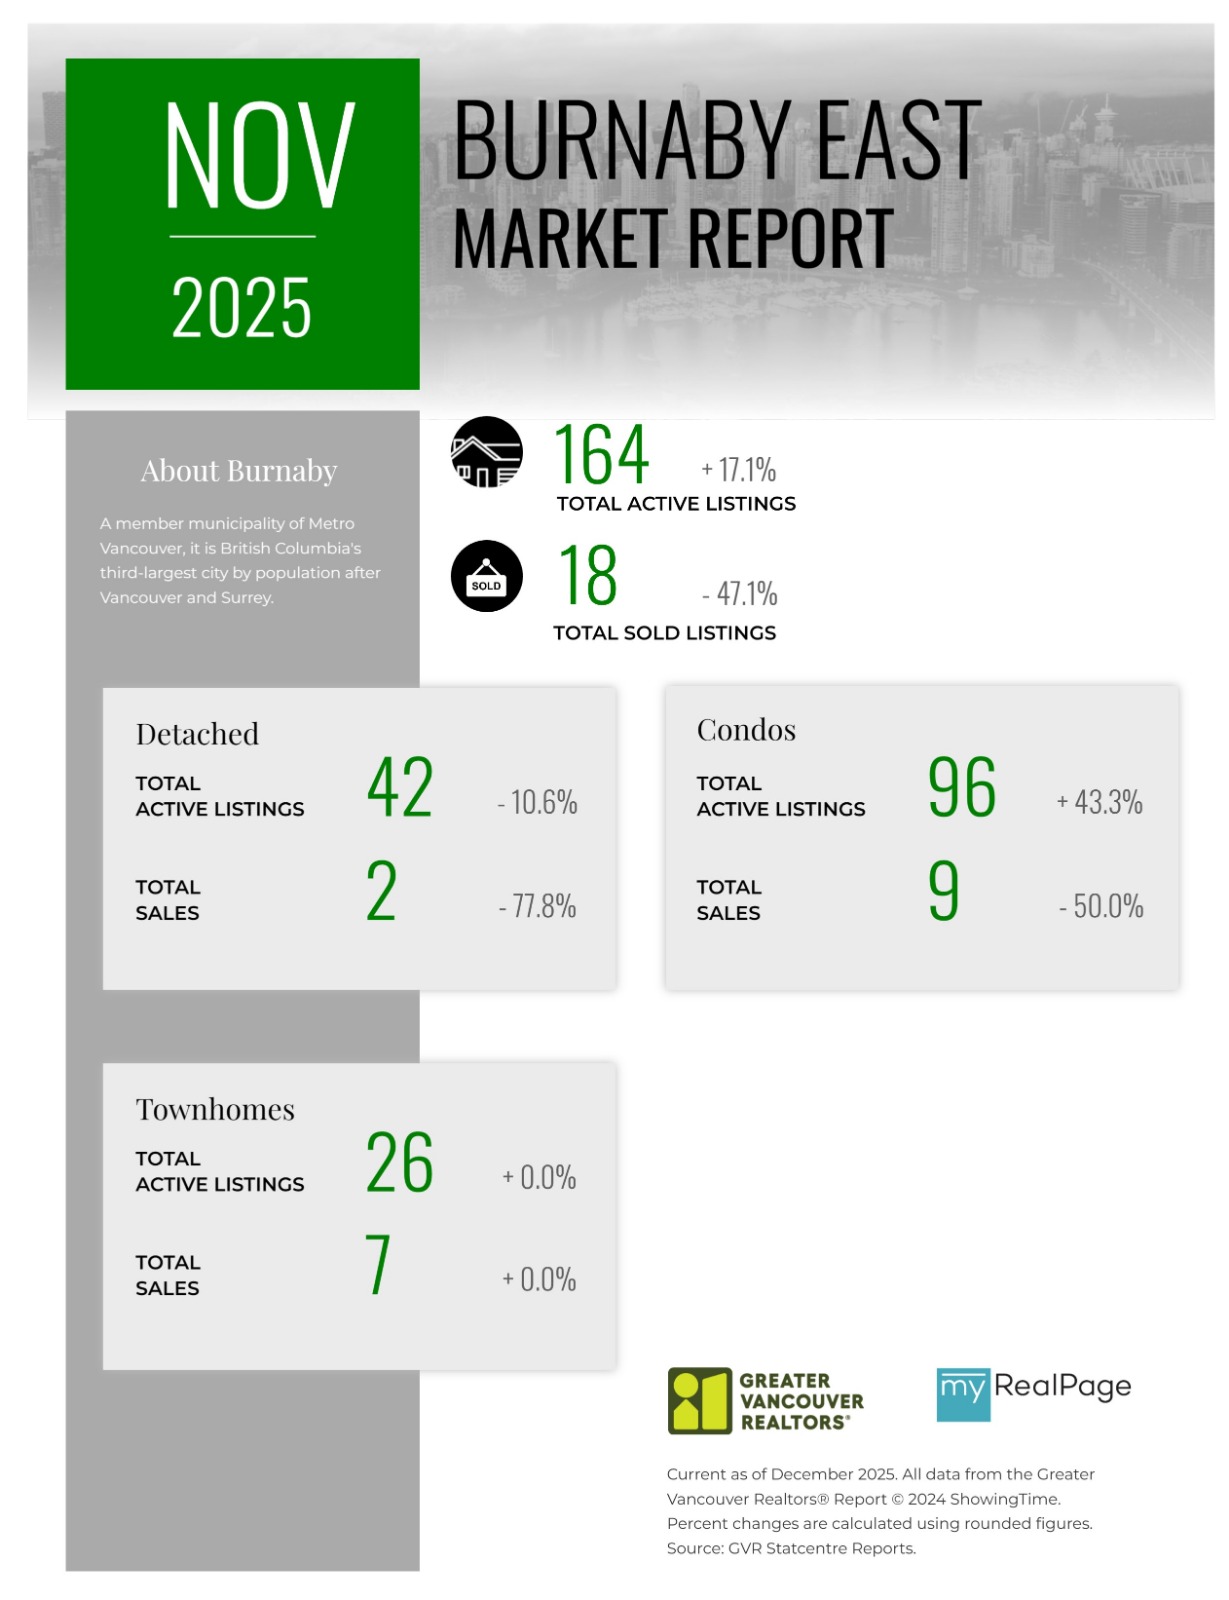
Printable Version – GVR November 2025 Data Infographics Report Burnaby East
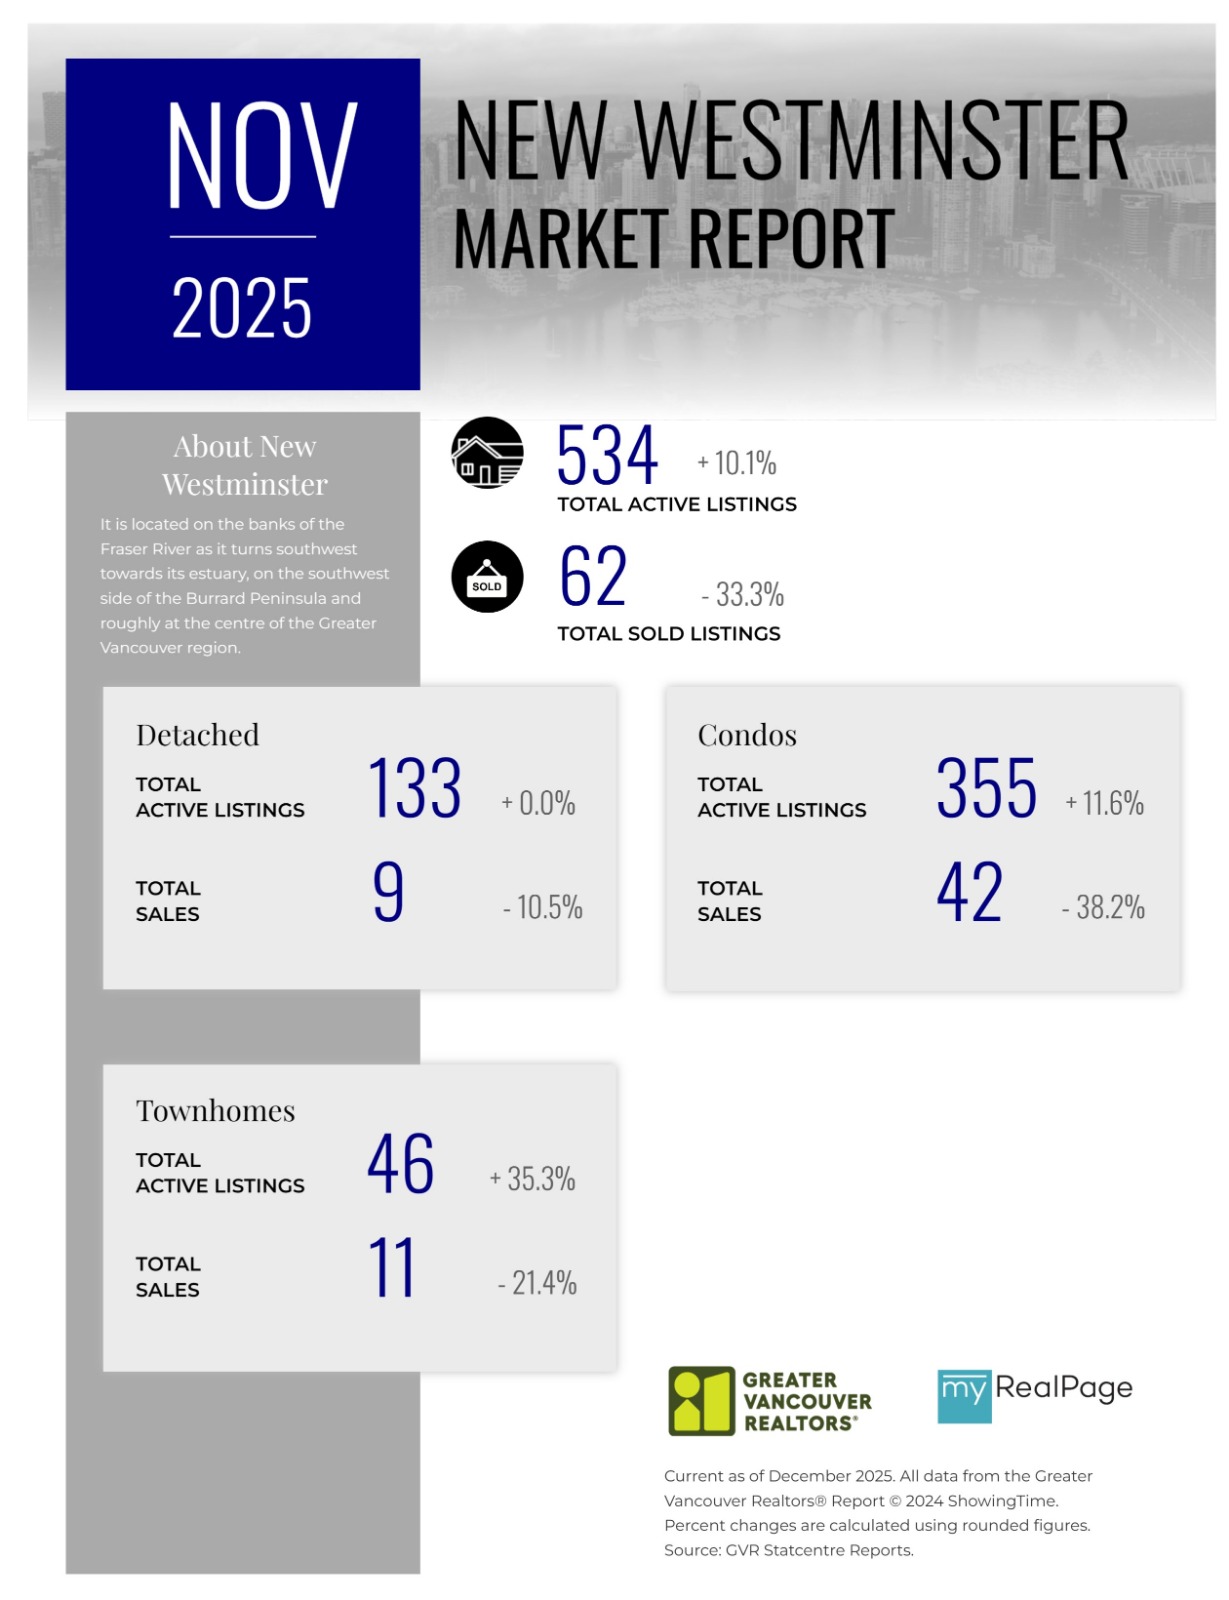
Printable Version – GVR November 2025 Data Infographics Report New Westminster
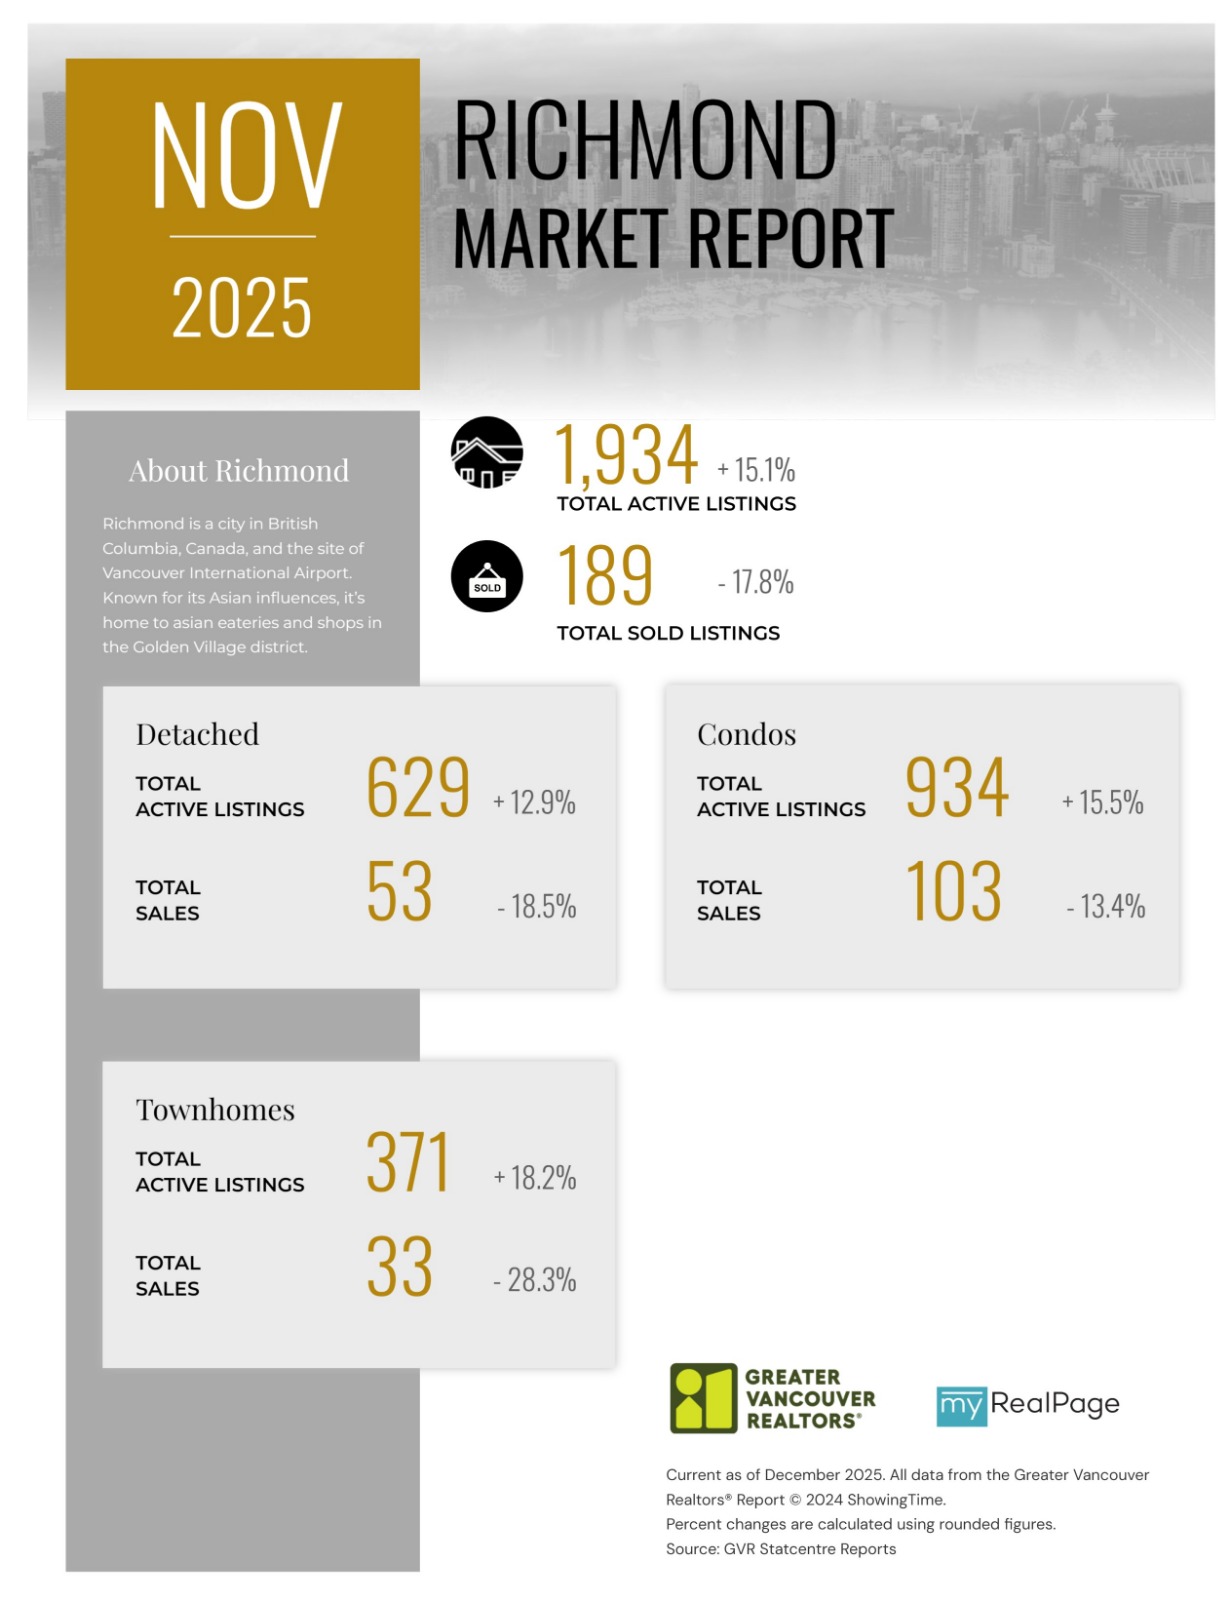
Printable Version – GVR November 2025 Data Infographics Report Richmond
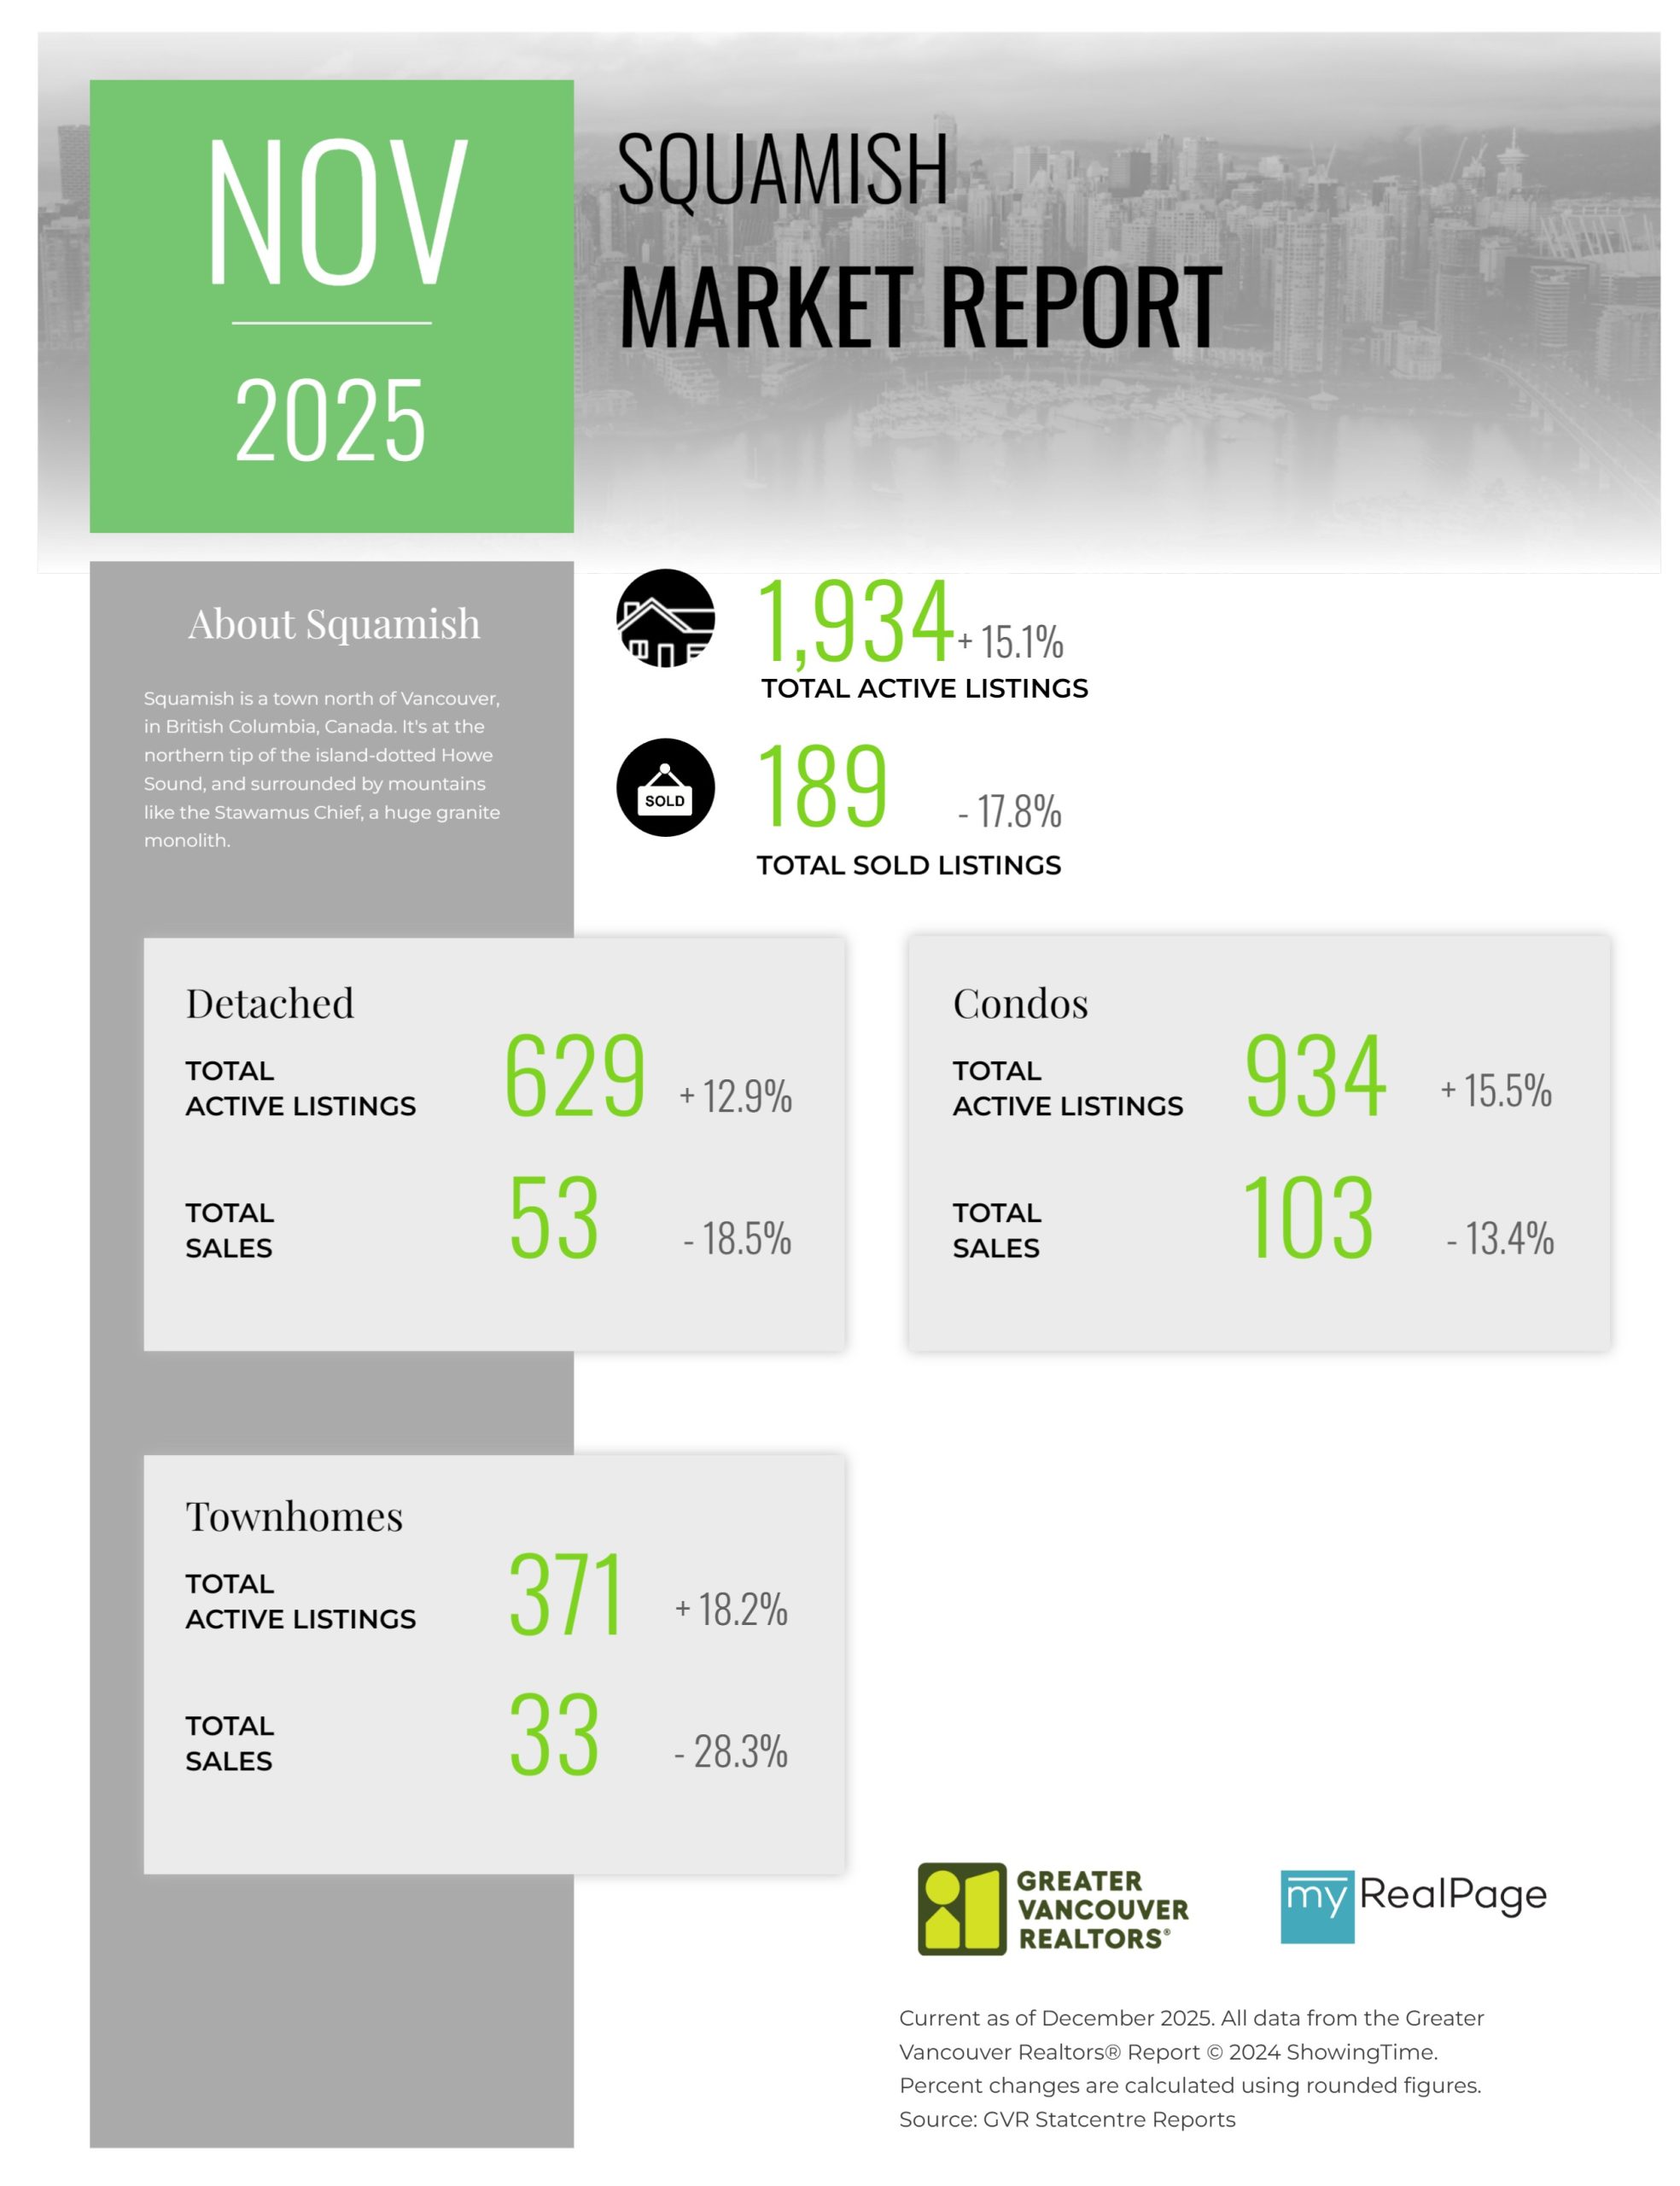
Printable Version – GVR November 2025 Data Infographics Report Squamish
Last Updated on December 10, 2025 by myRealPage
