INFOGRAPHICS: January 2026 GVR Greater Vancouver Market Reports

New year, same housing market in Metro Vancouver
Last year’s market trends continued in January as home sales registered on the MLS® in Metro Vancouver* were 28.5 per cent lower than last year, setting the year off to a quieter start.
The Greater Vancouver REALTORS® (GVR) reports that residential sales in the region totalled 1,107 in January 2026, a 28.7 per cent decrease from the 1,552 sales recorded in January 2025. This was 30.9 per cent below the 10-year seasonal average (1,602).
“On their own, the January sales appear alarming, but it’s important to put these figures in the context of the past few years. Last year ended with one of the lowest sales totals in over two decades, and so it’s not surprising that the January sales figures were fourth slowest in over two decades as well. Market momentum is a slowly evolving force, and in many ways, the January figures represent a market that continues slowly evolving to what may be a new normal.” Andrew Lis, GVR chief economist and vice-president data analytics
Read the full report on the REBGV website!
The following data is a comparison between January 2026 and January 2025 numbers, and is current as of February of 2026. For last month’s update, you can check out our previous post!
Or follow this link for all our GVR Infographics!
These infographics cover current trends in several areas within the Greater Vancouver region. Click on the images for a larger view!
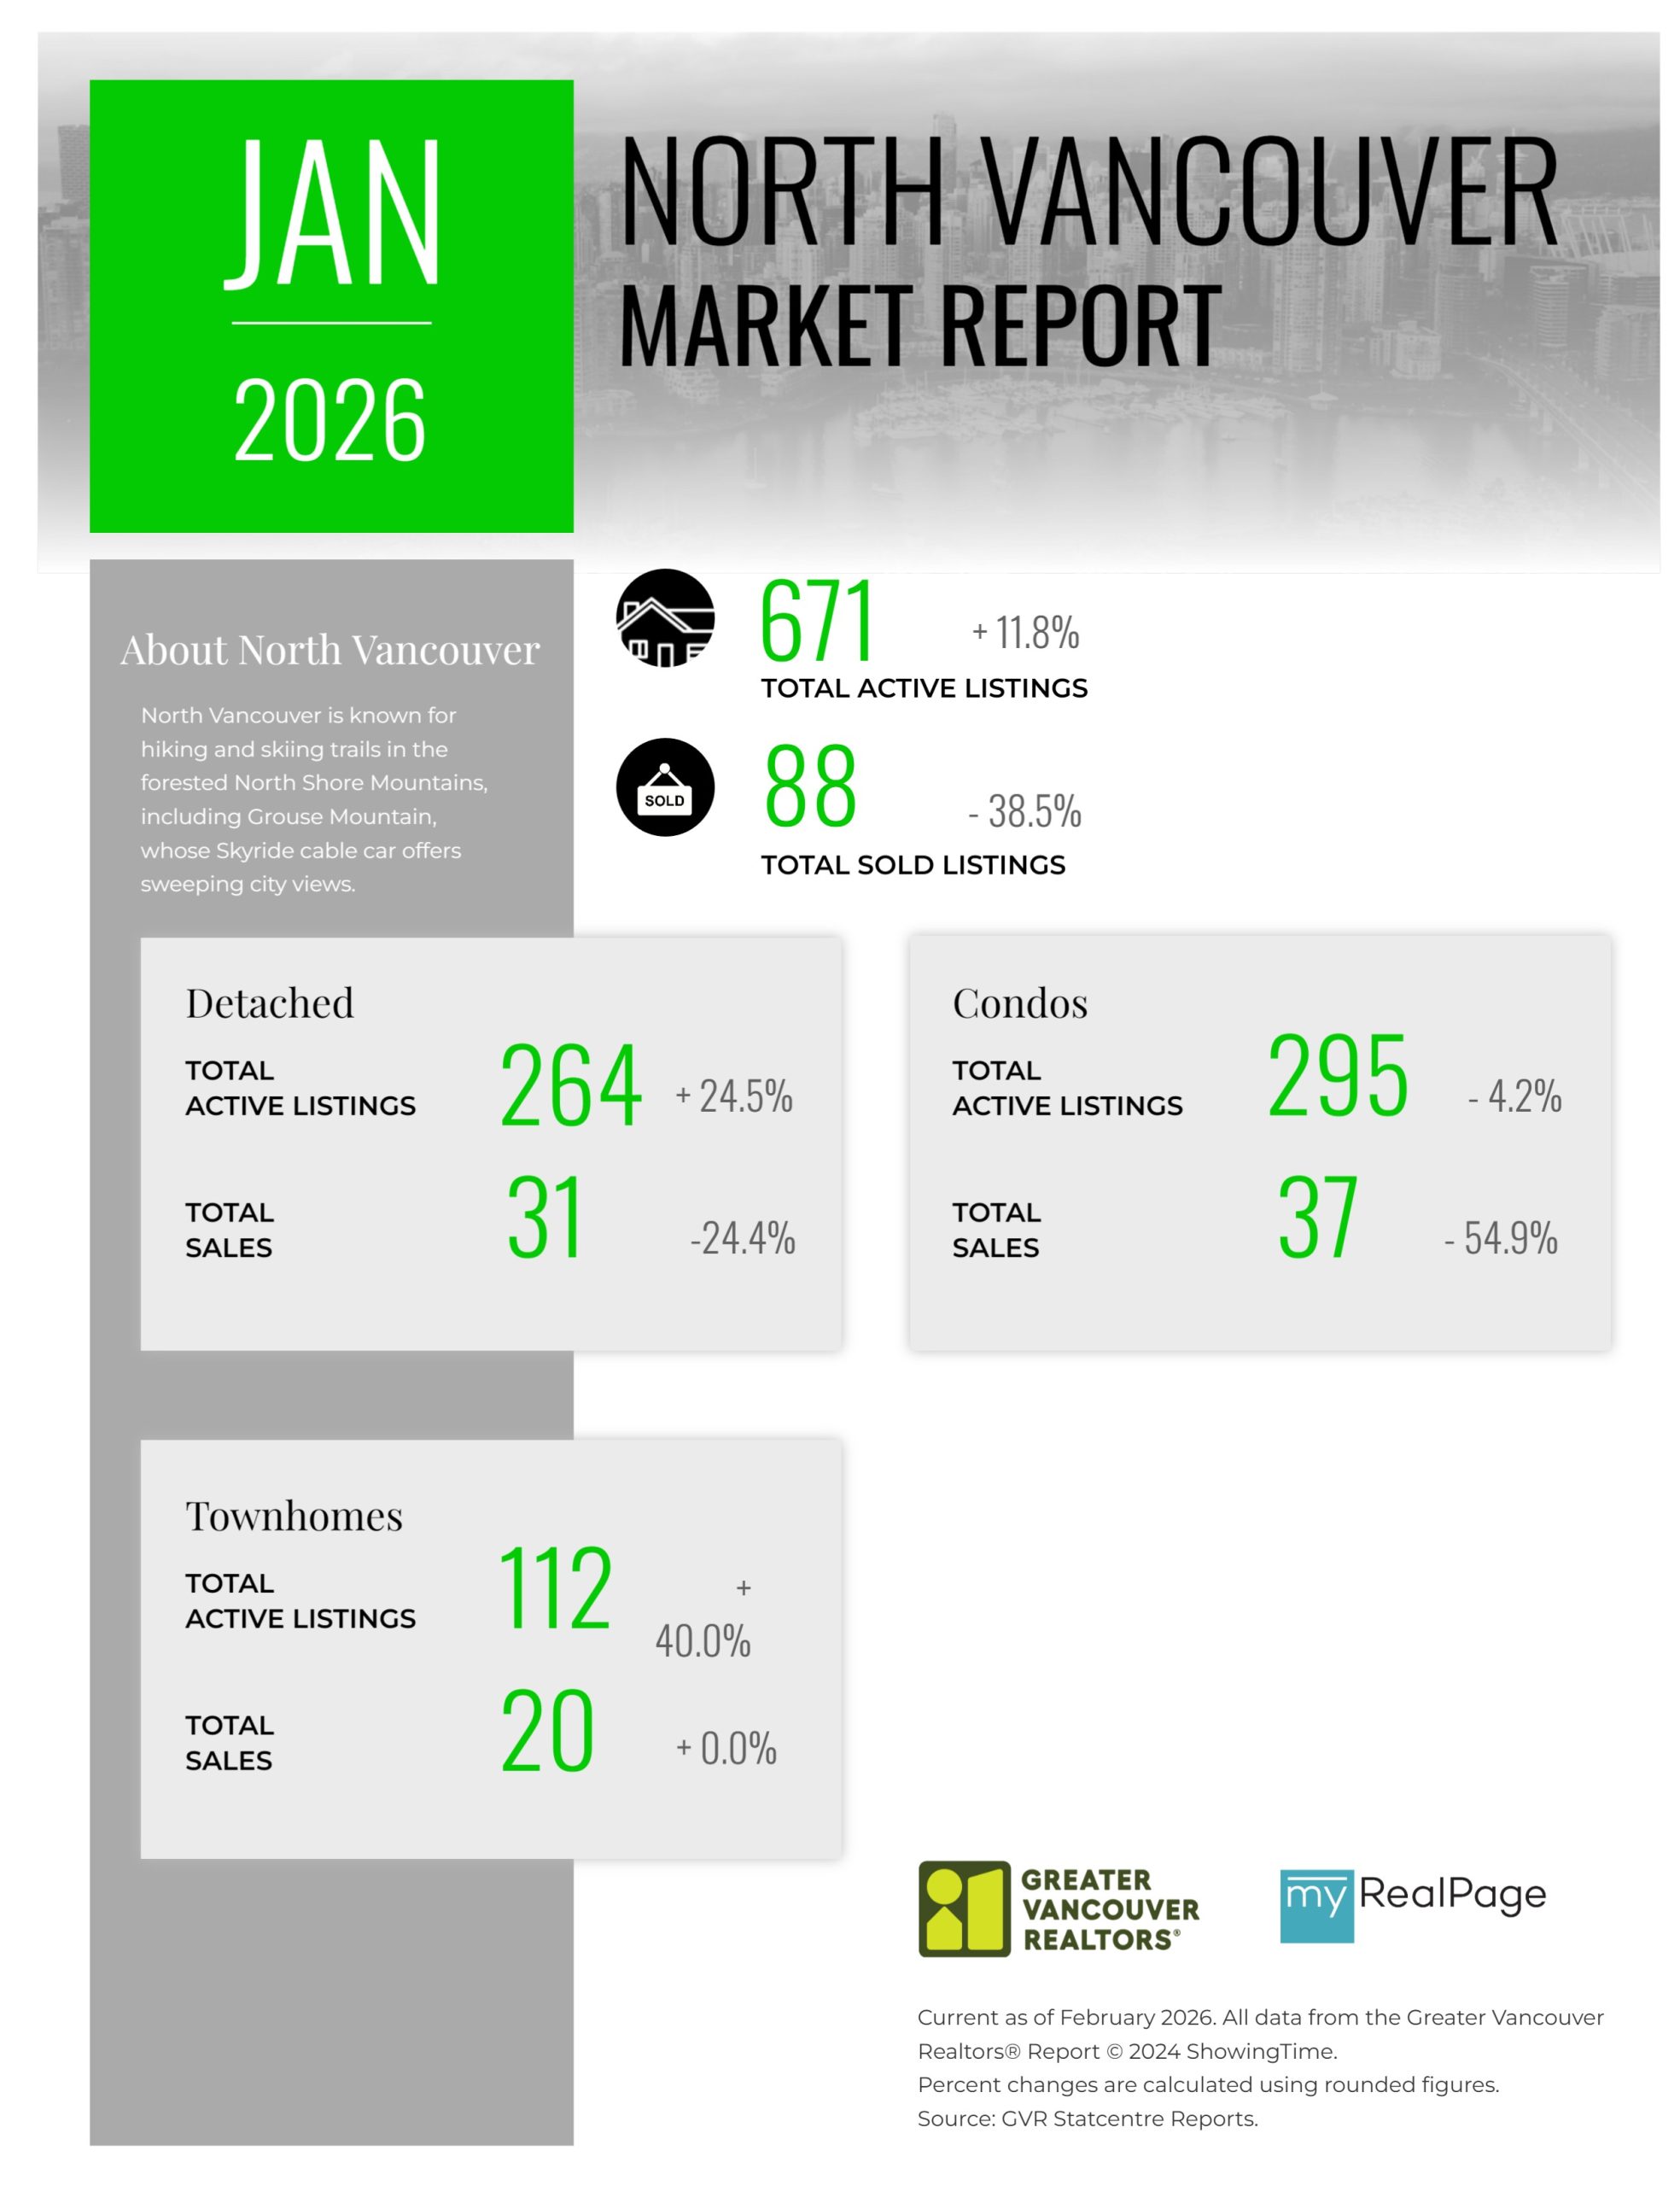
Printable Version – GVR January 2026 Data Infographic Report North Vancouver
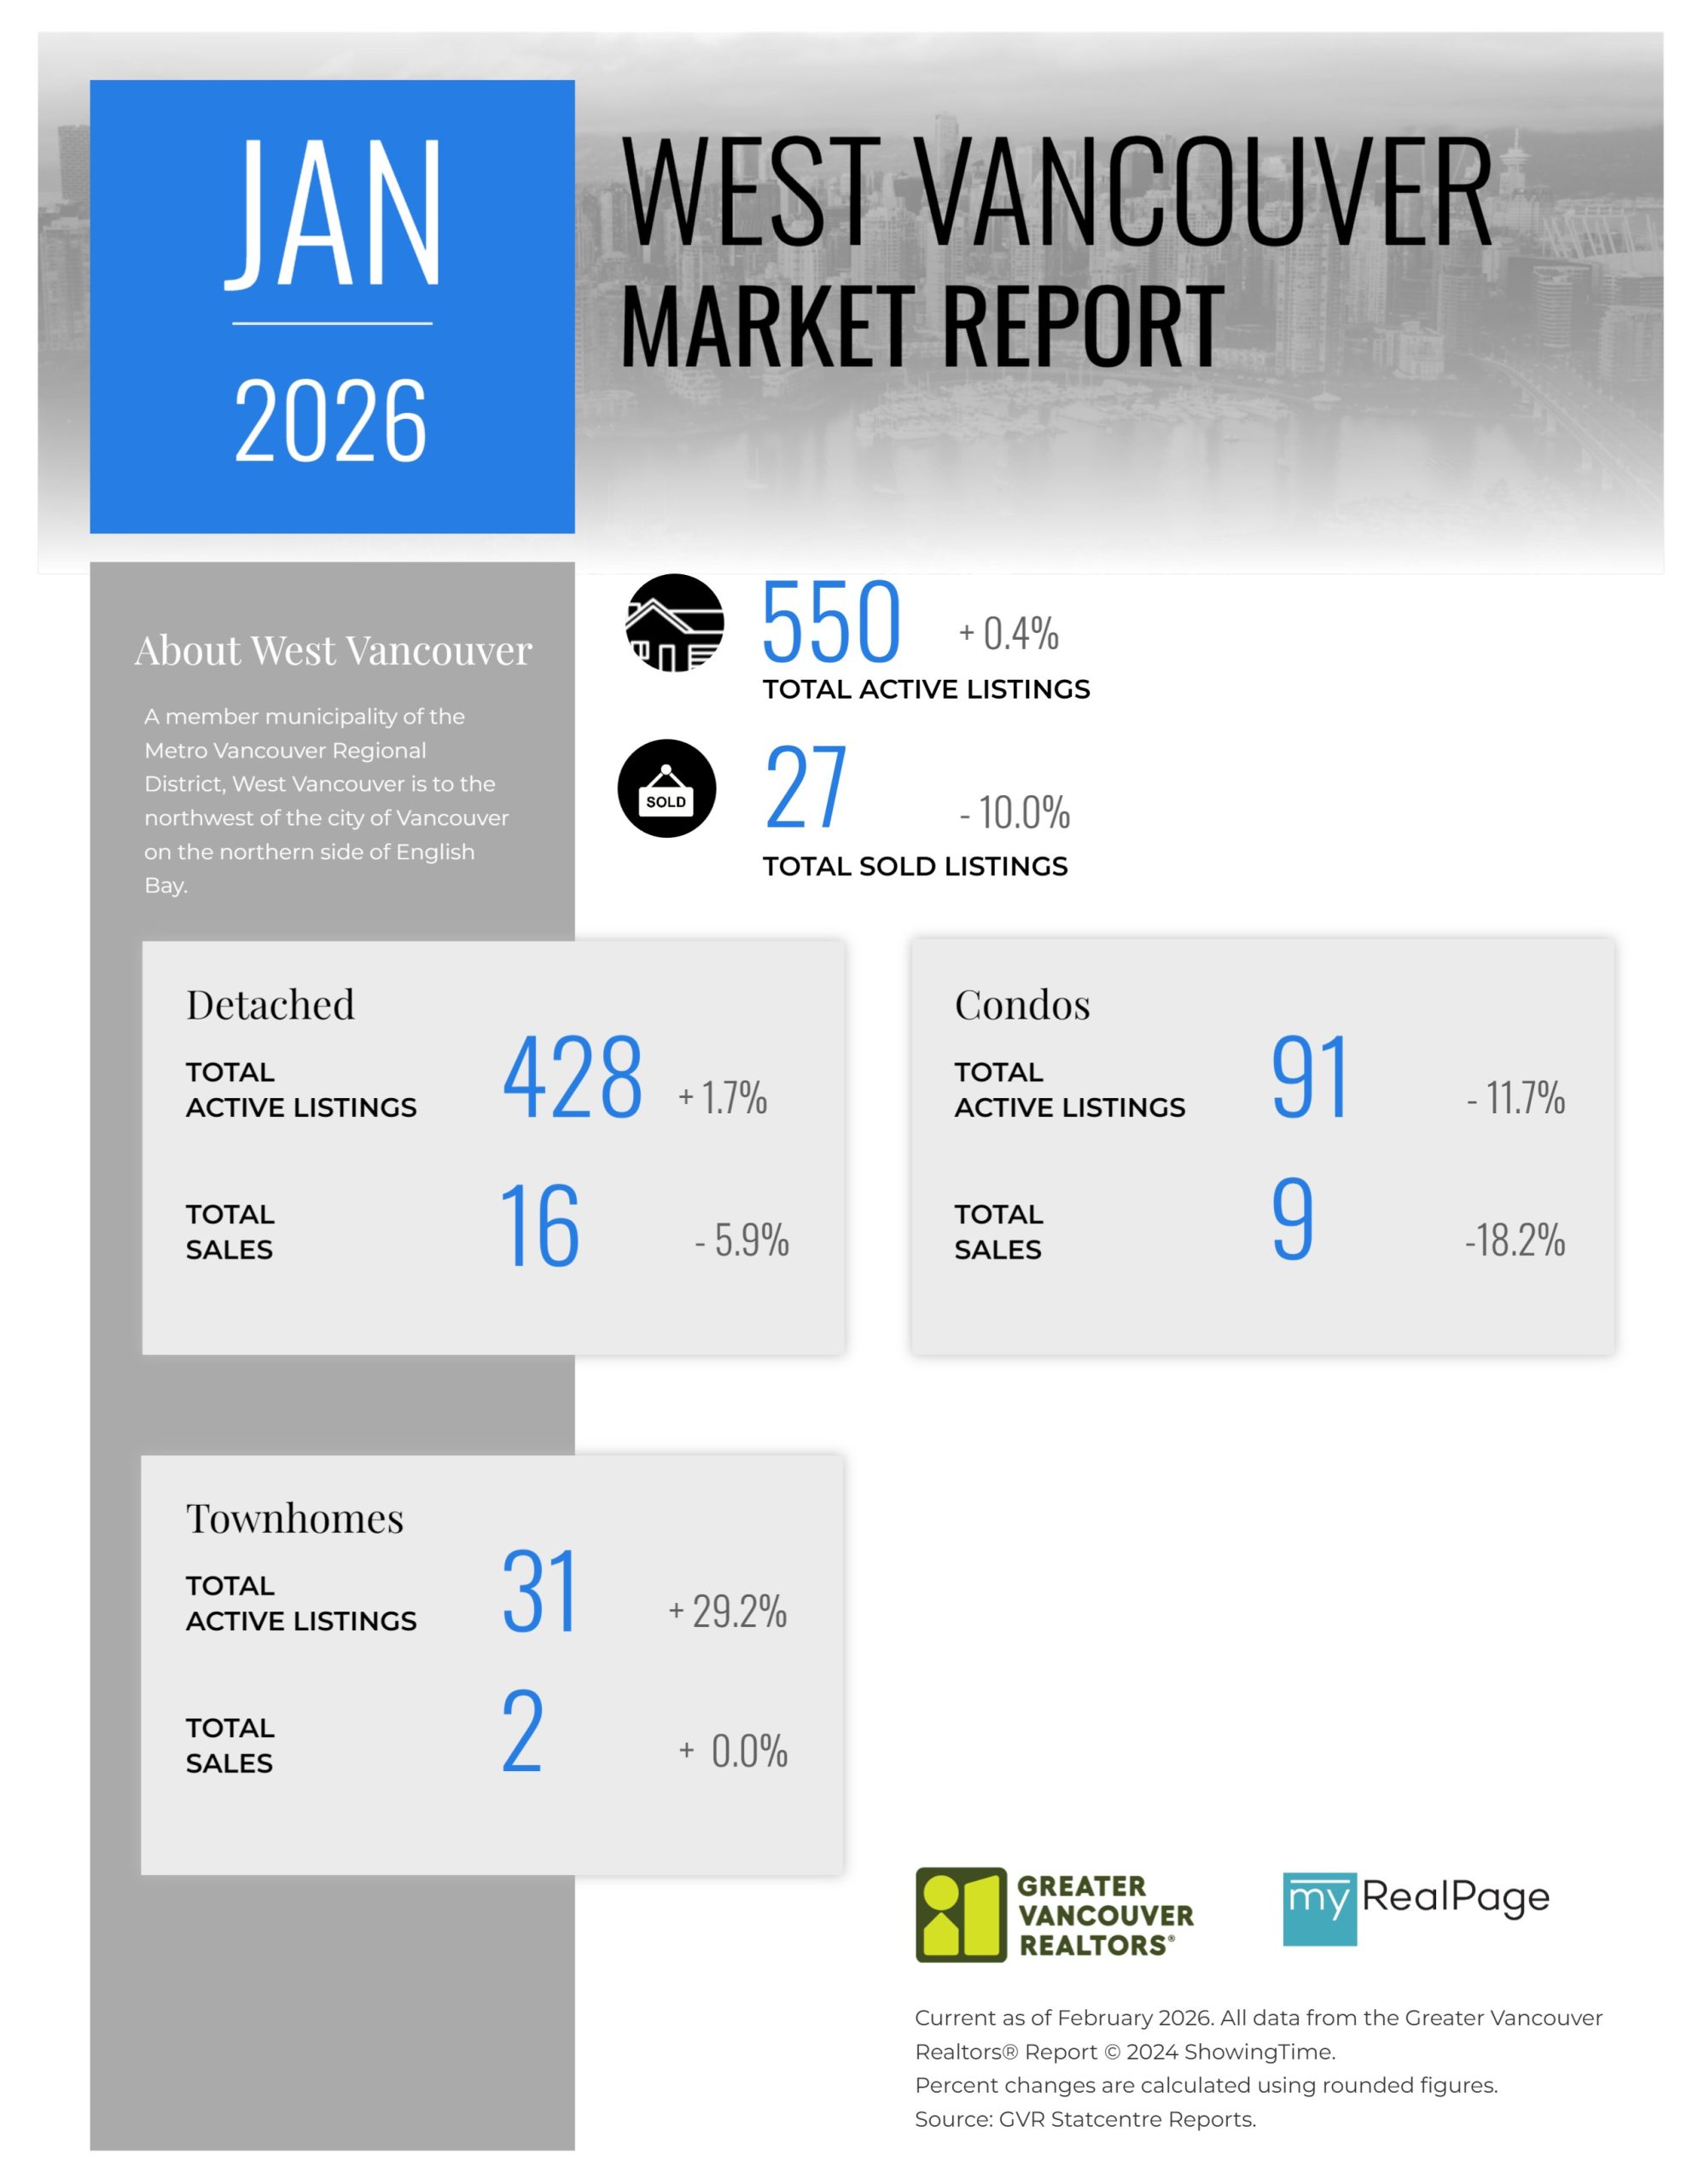
Printable Version – GVR January 2026 Data Infographics Report West Vancouver
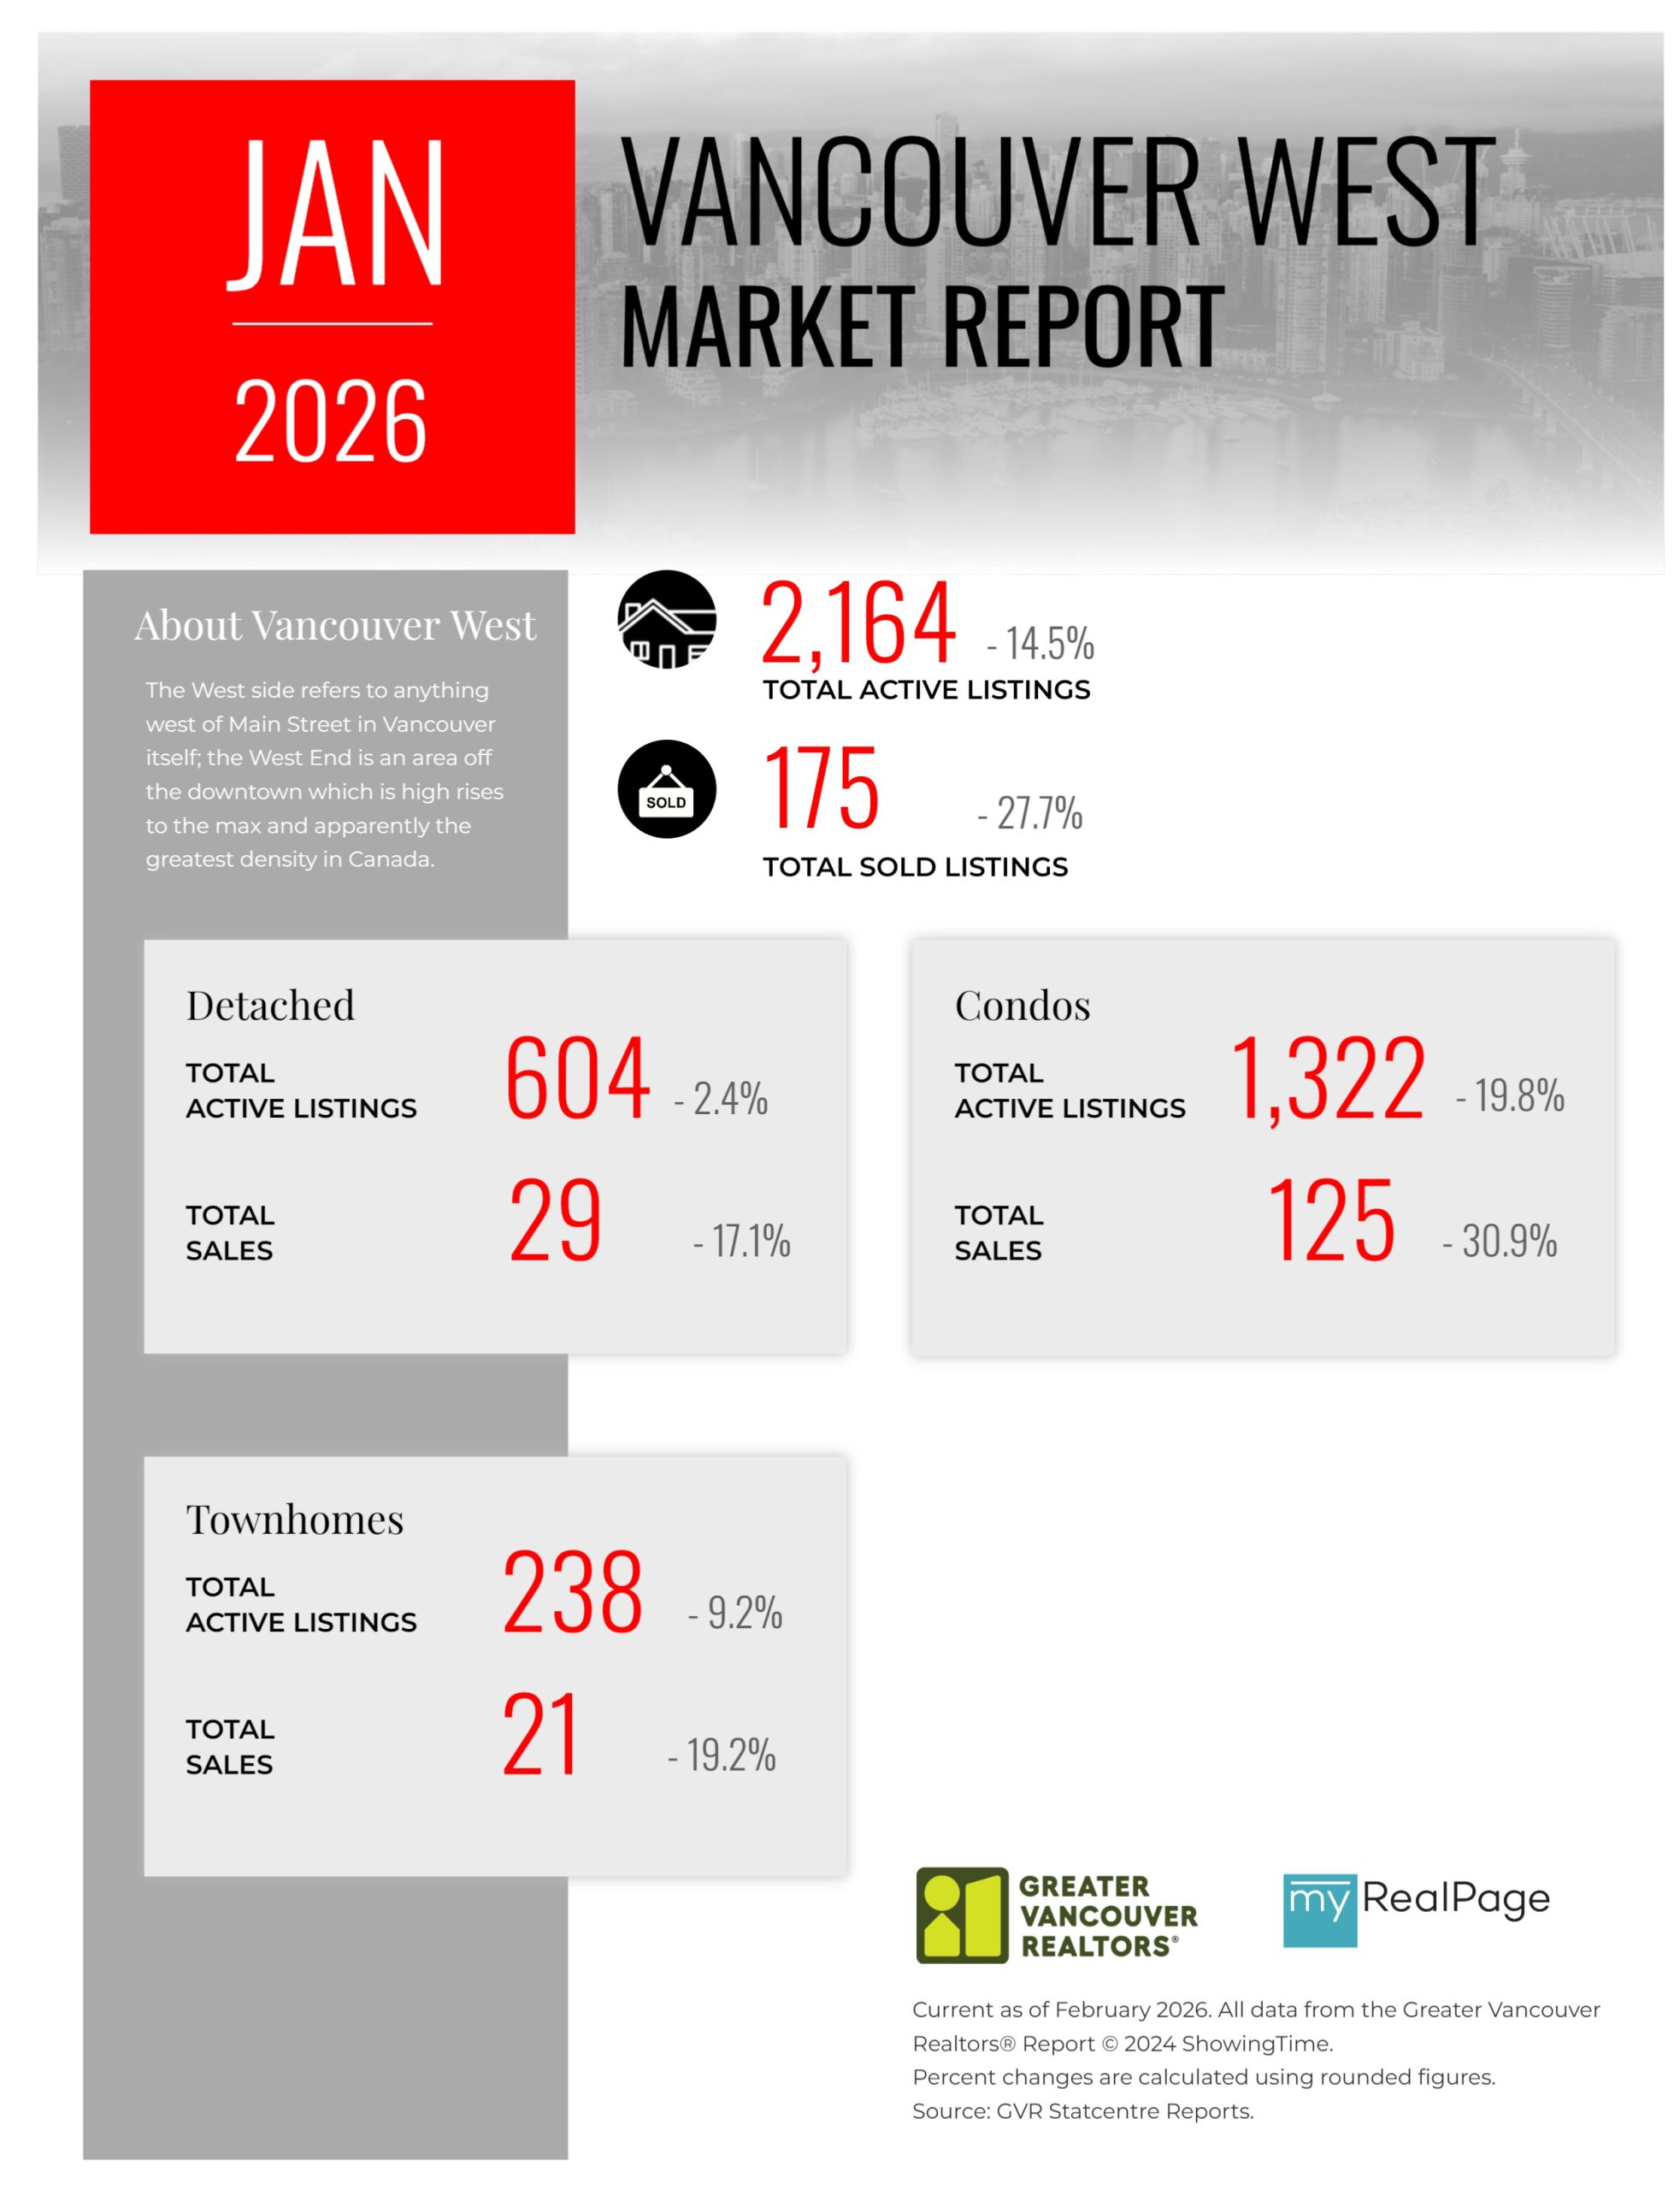
Printable Version – GVR January 2026 Data Infographics Report Vancouver West
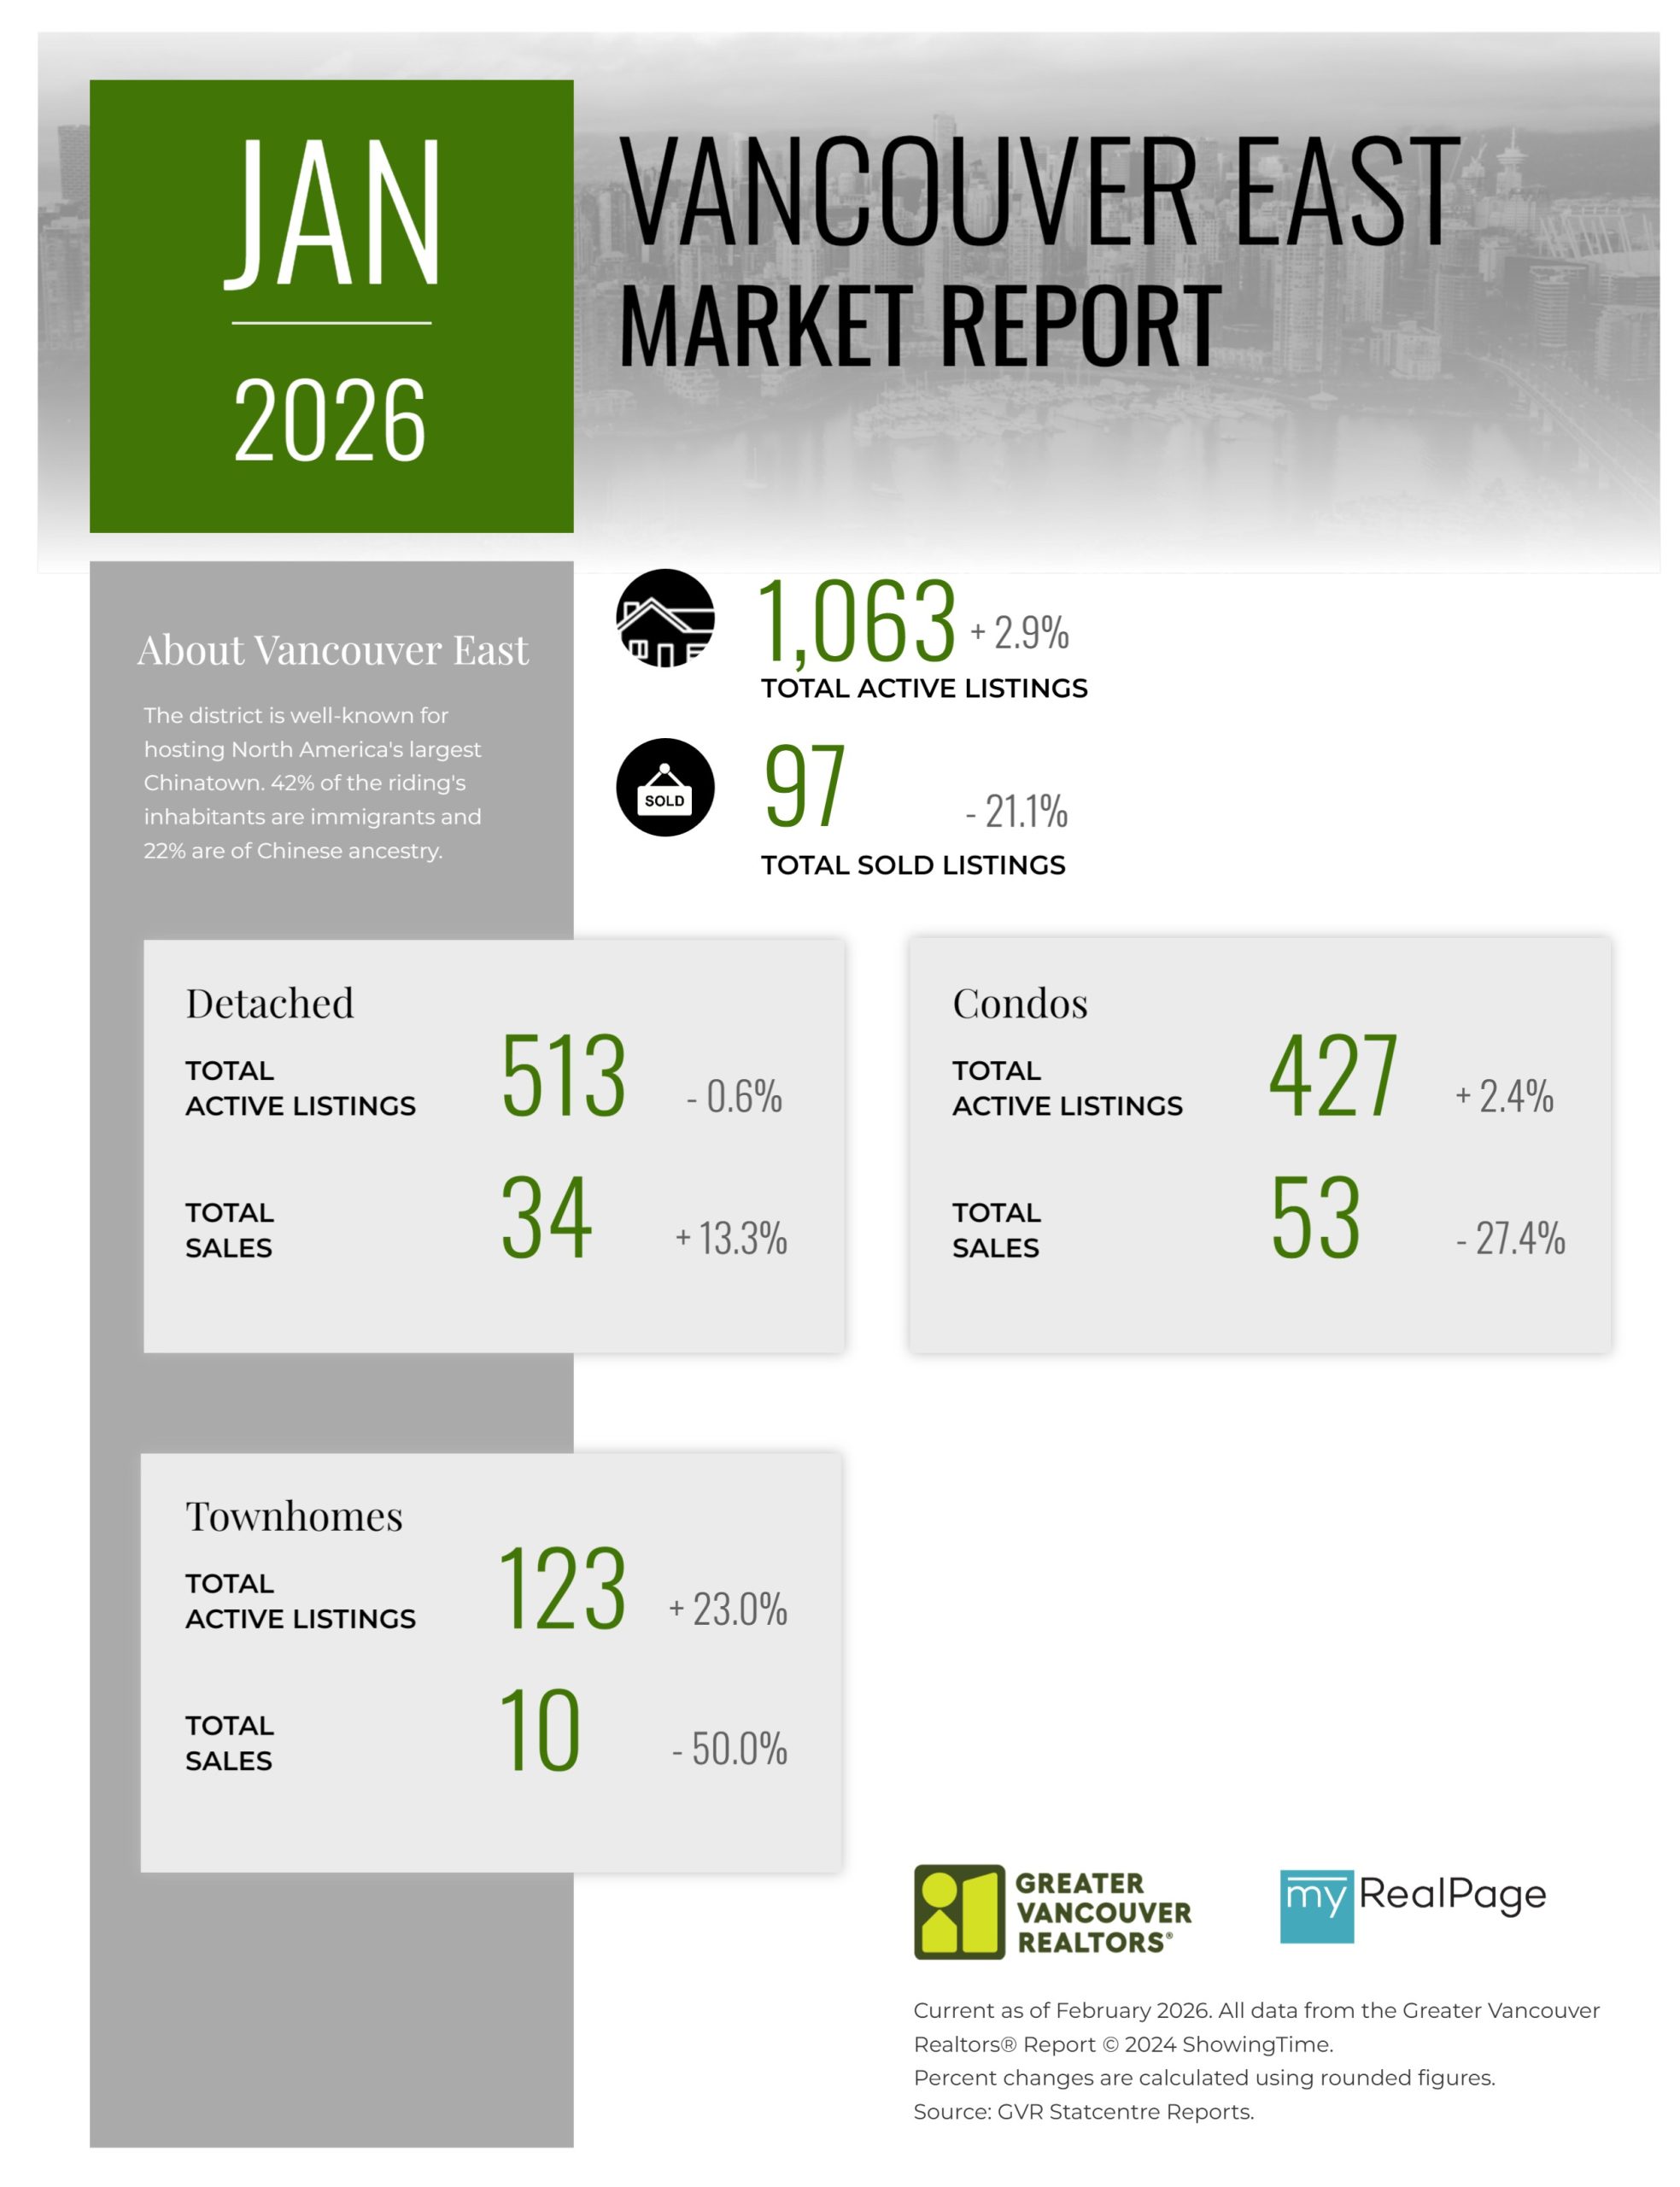
Printable Version – GVR January 2026 Data Infographics Report Vancouver East
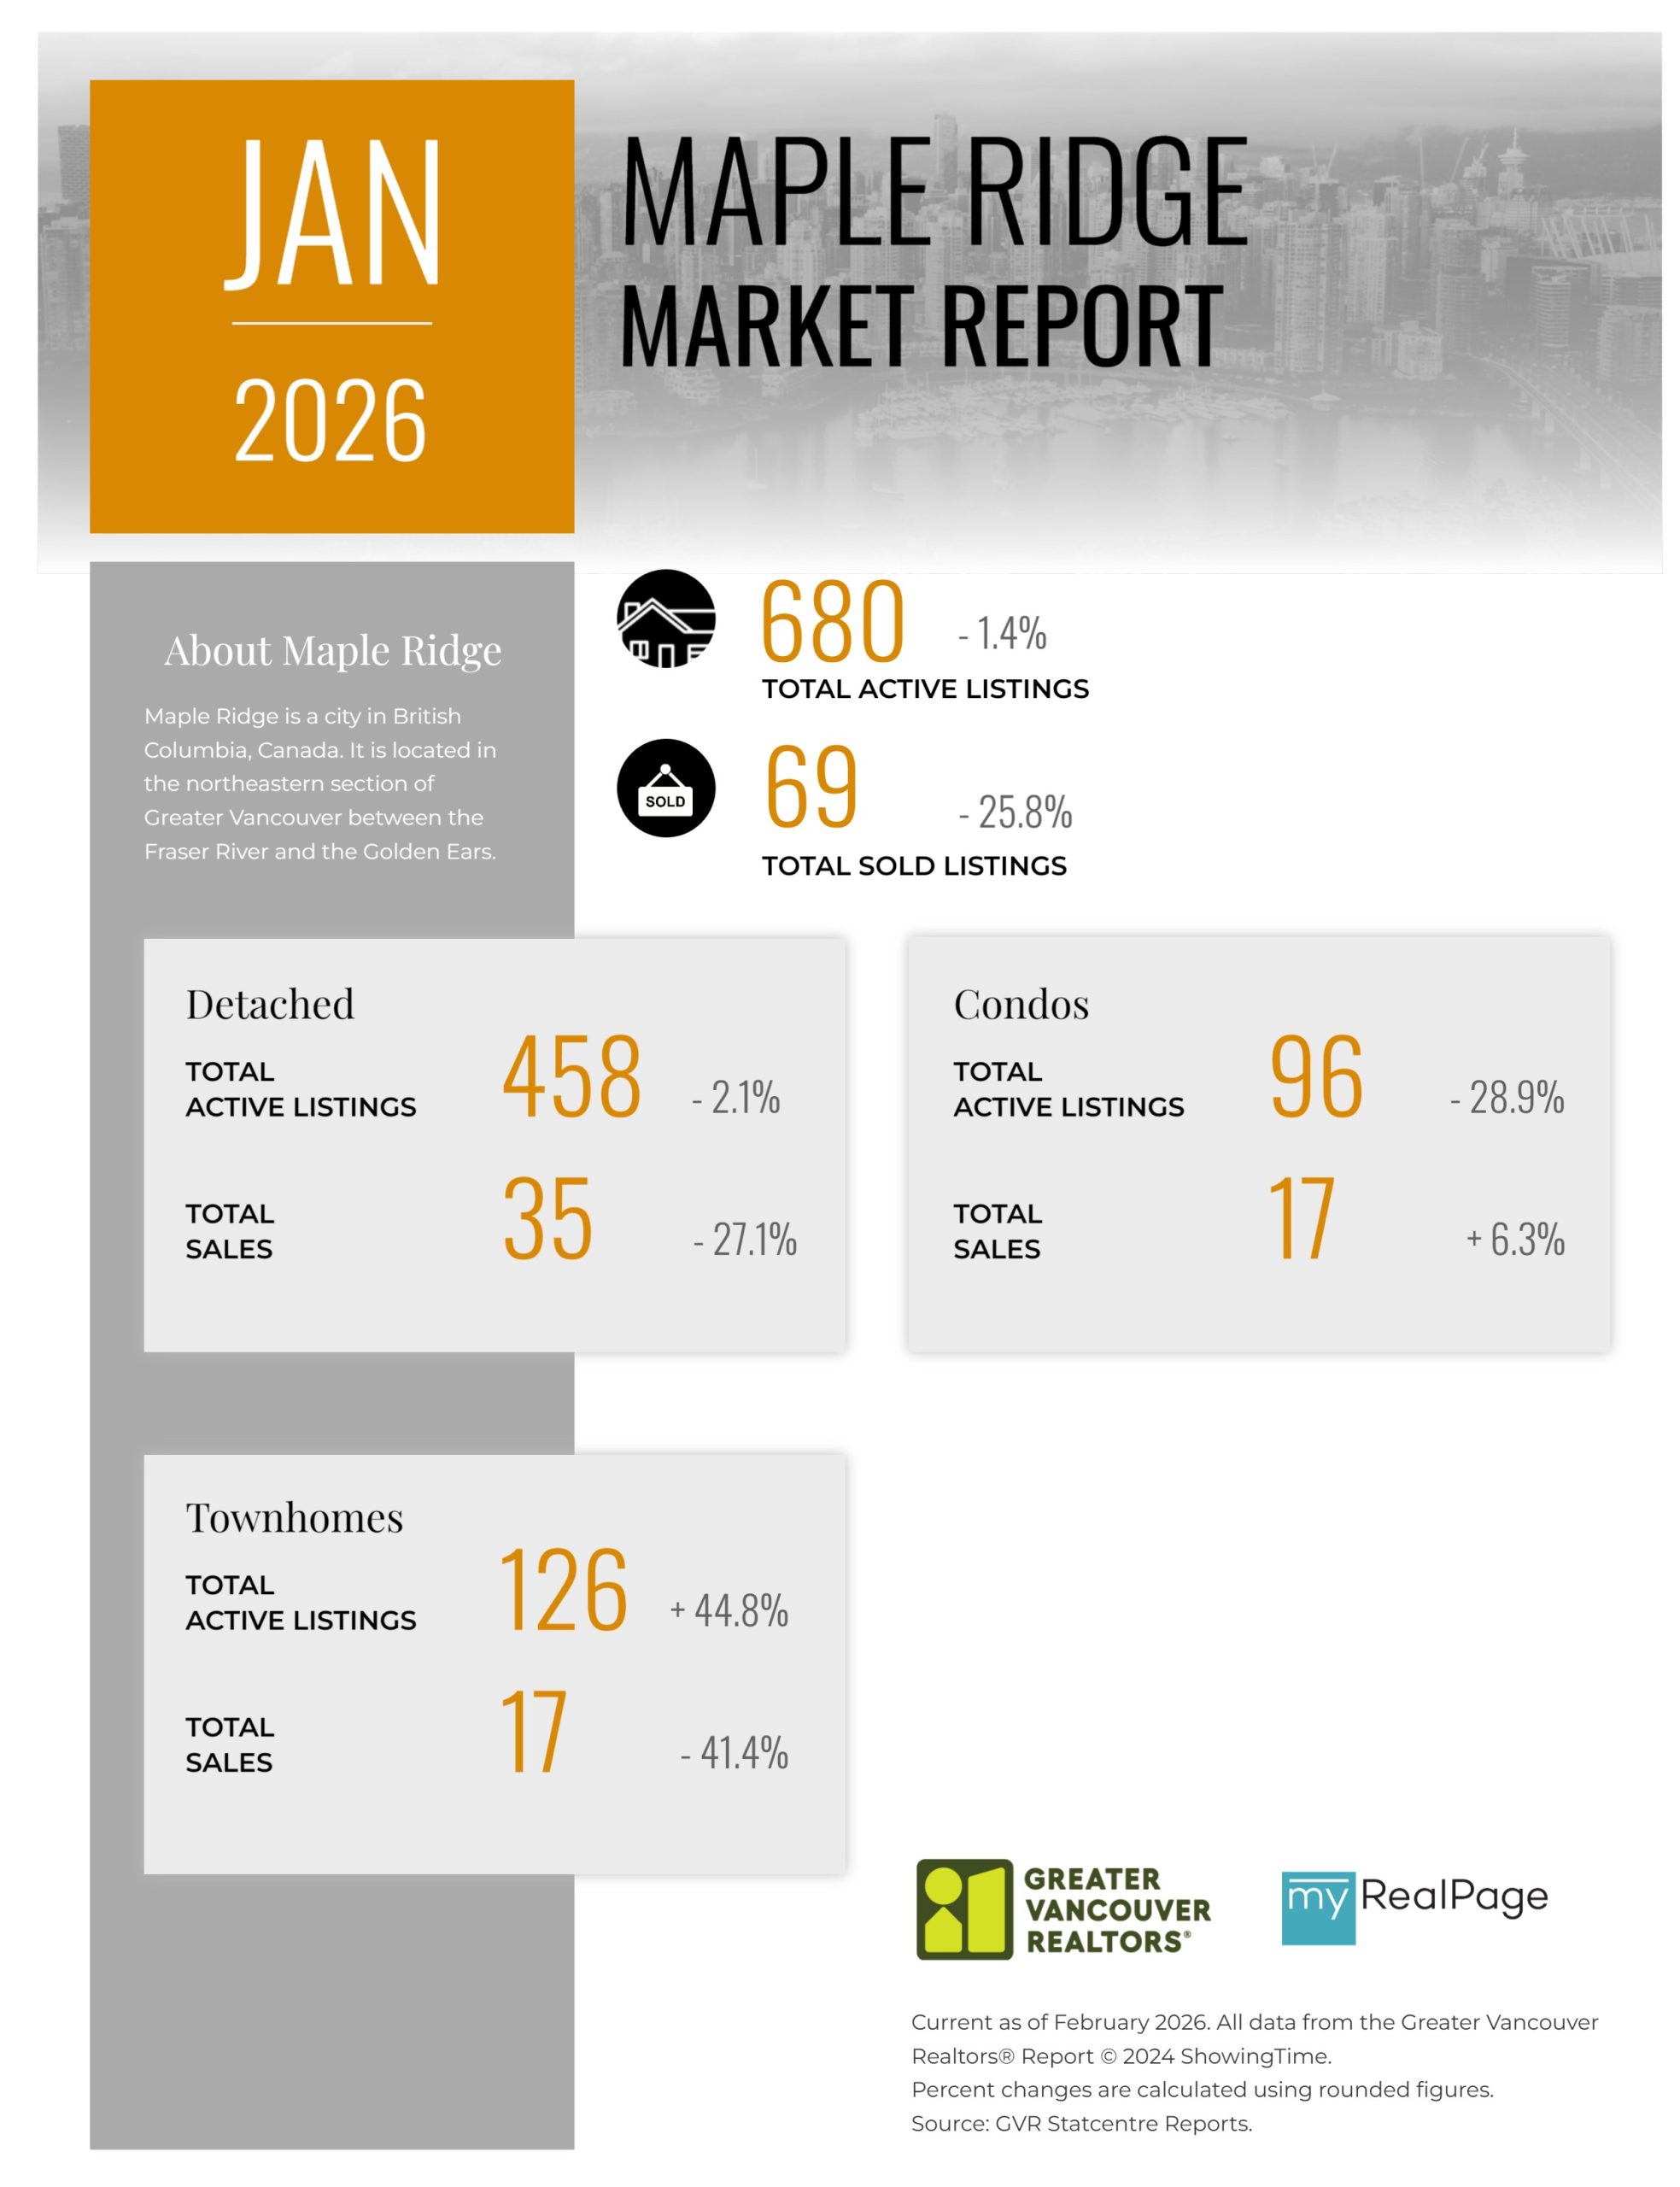
Printable Version – GVR January 2026 Data Infographic Report Maple Ridge
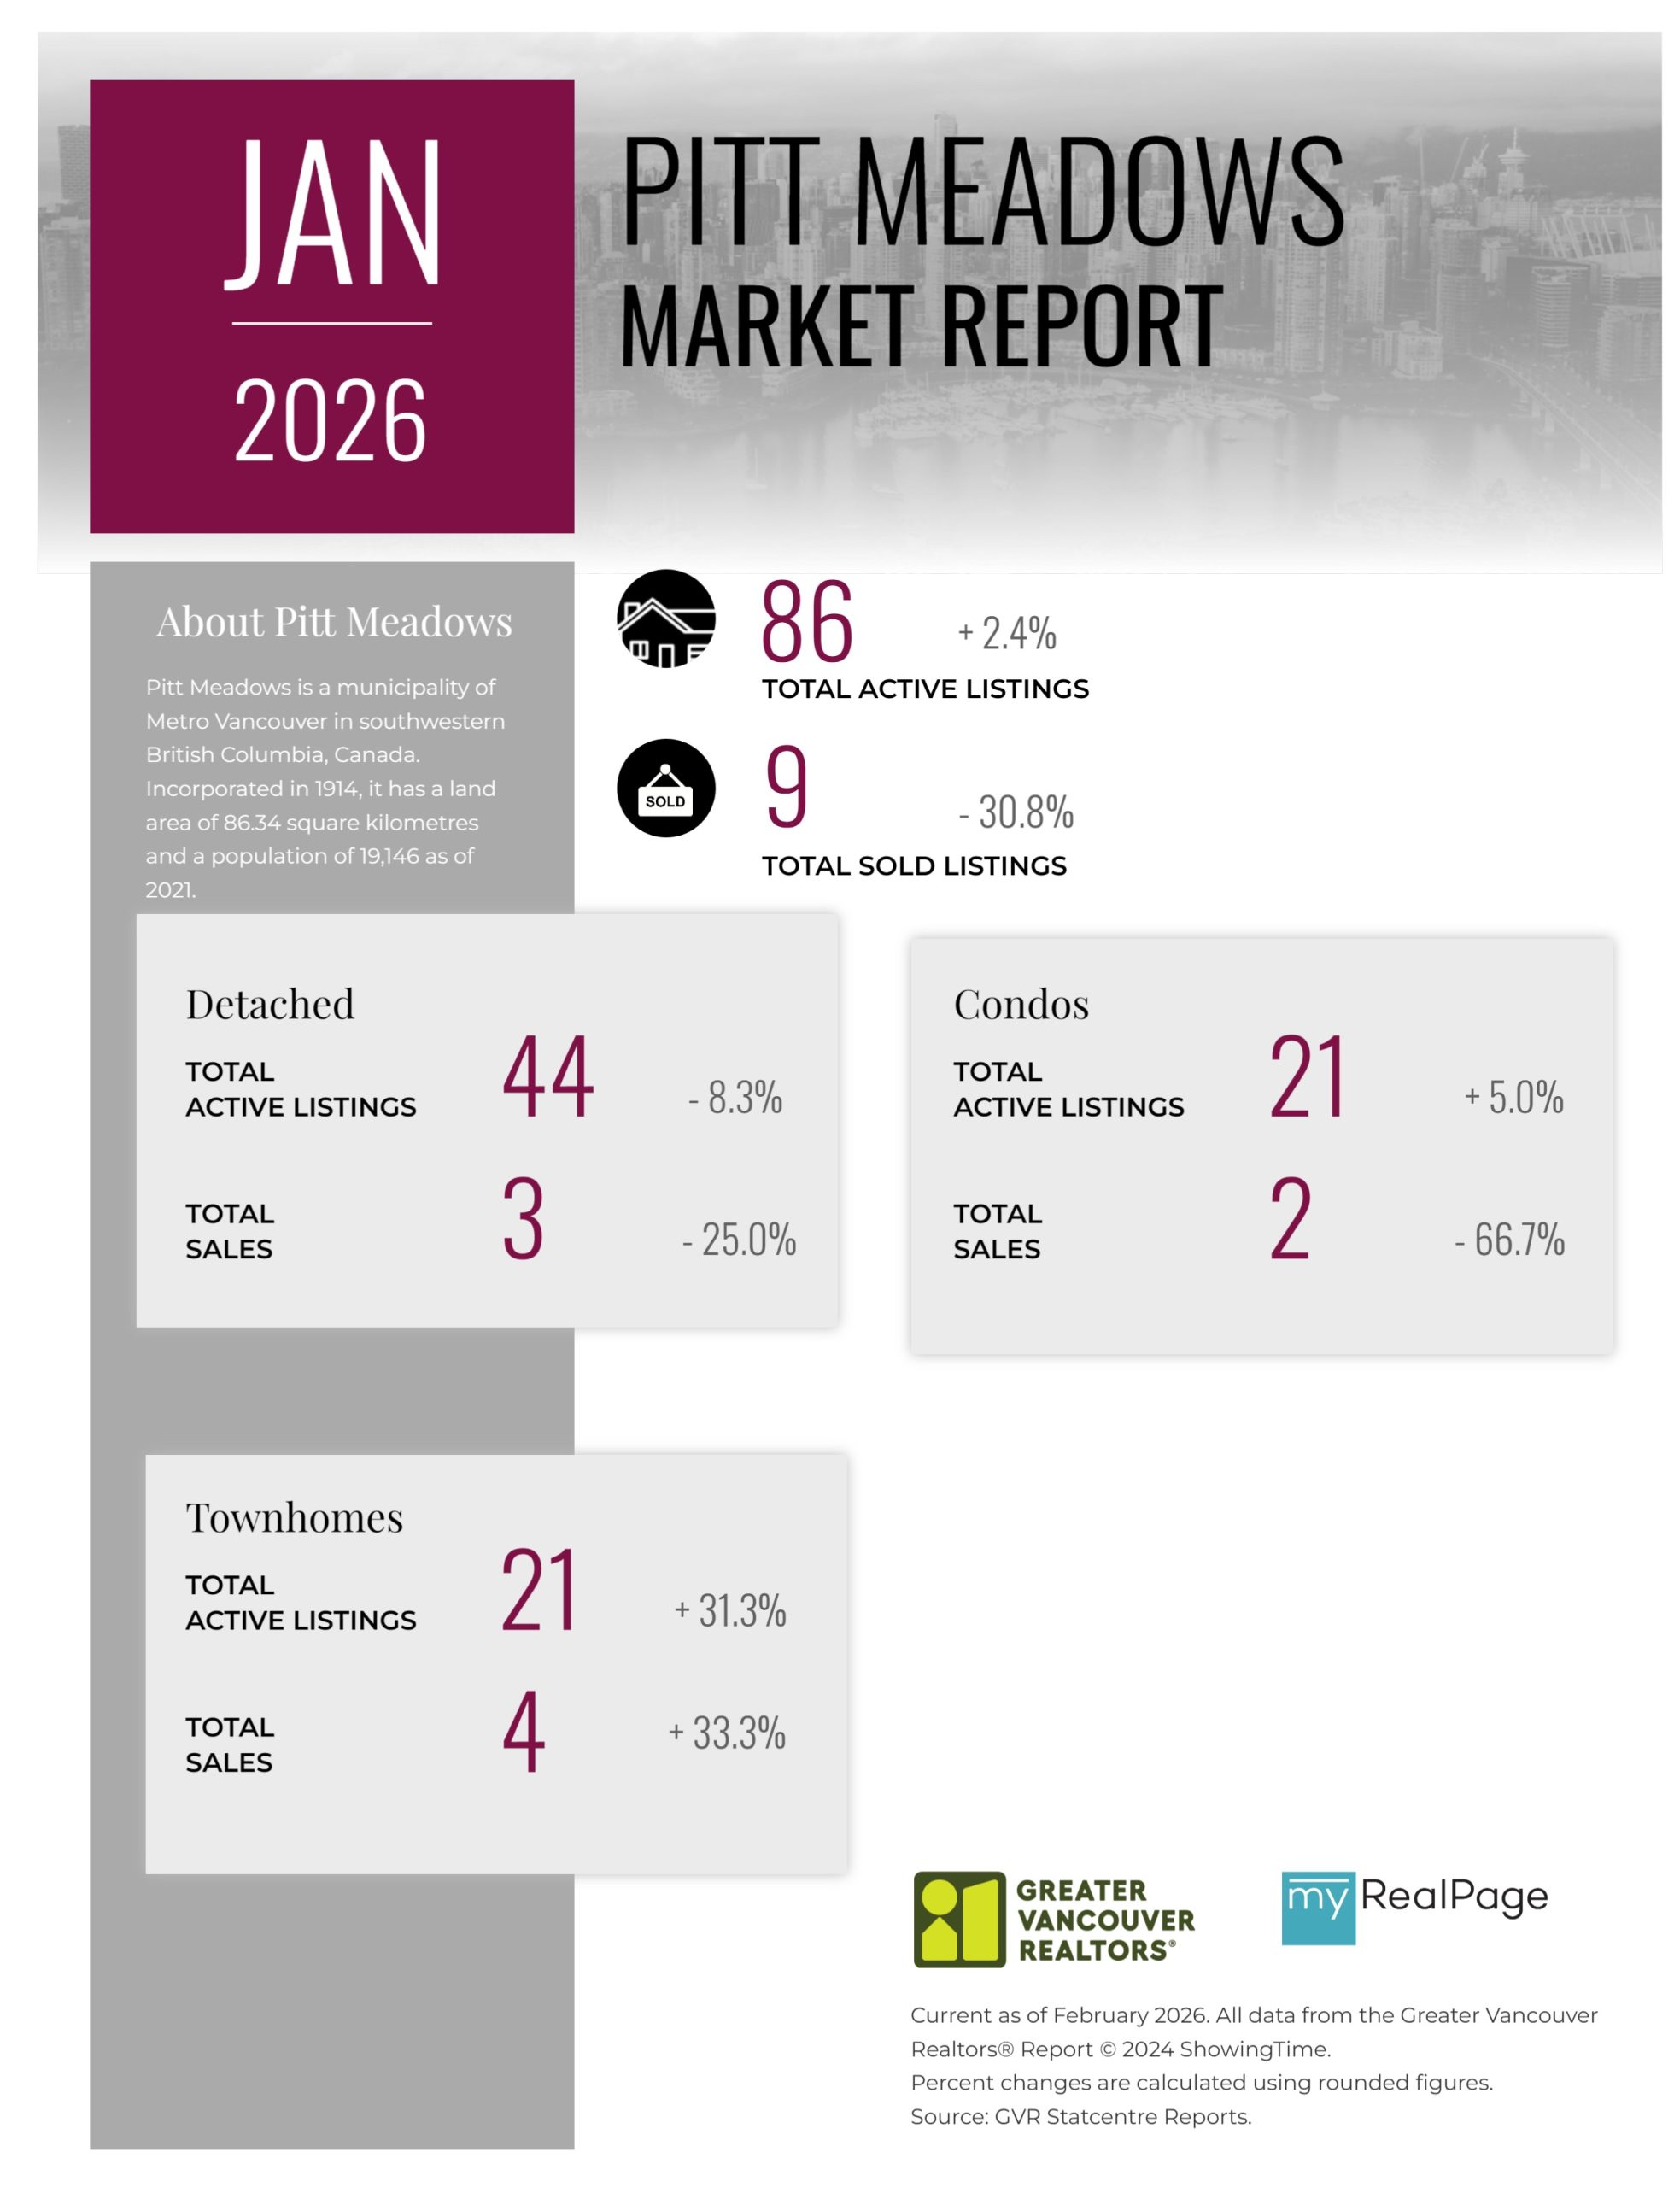
Printable Version – GVR January 2026 Data Infographics Report Pitt Meadows
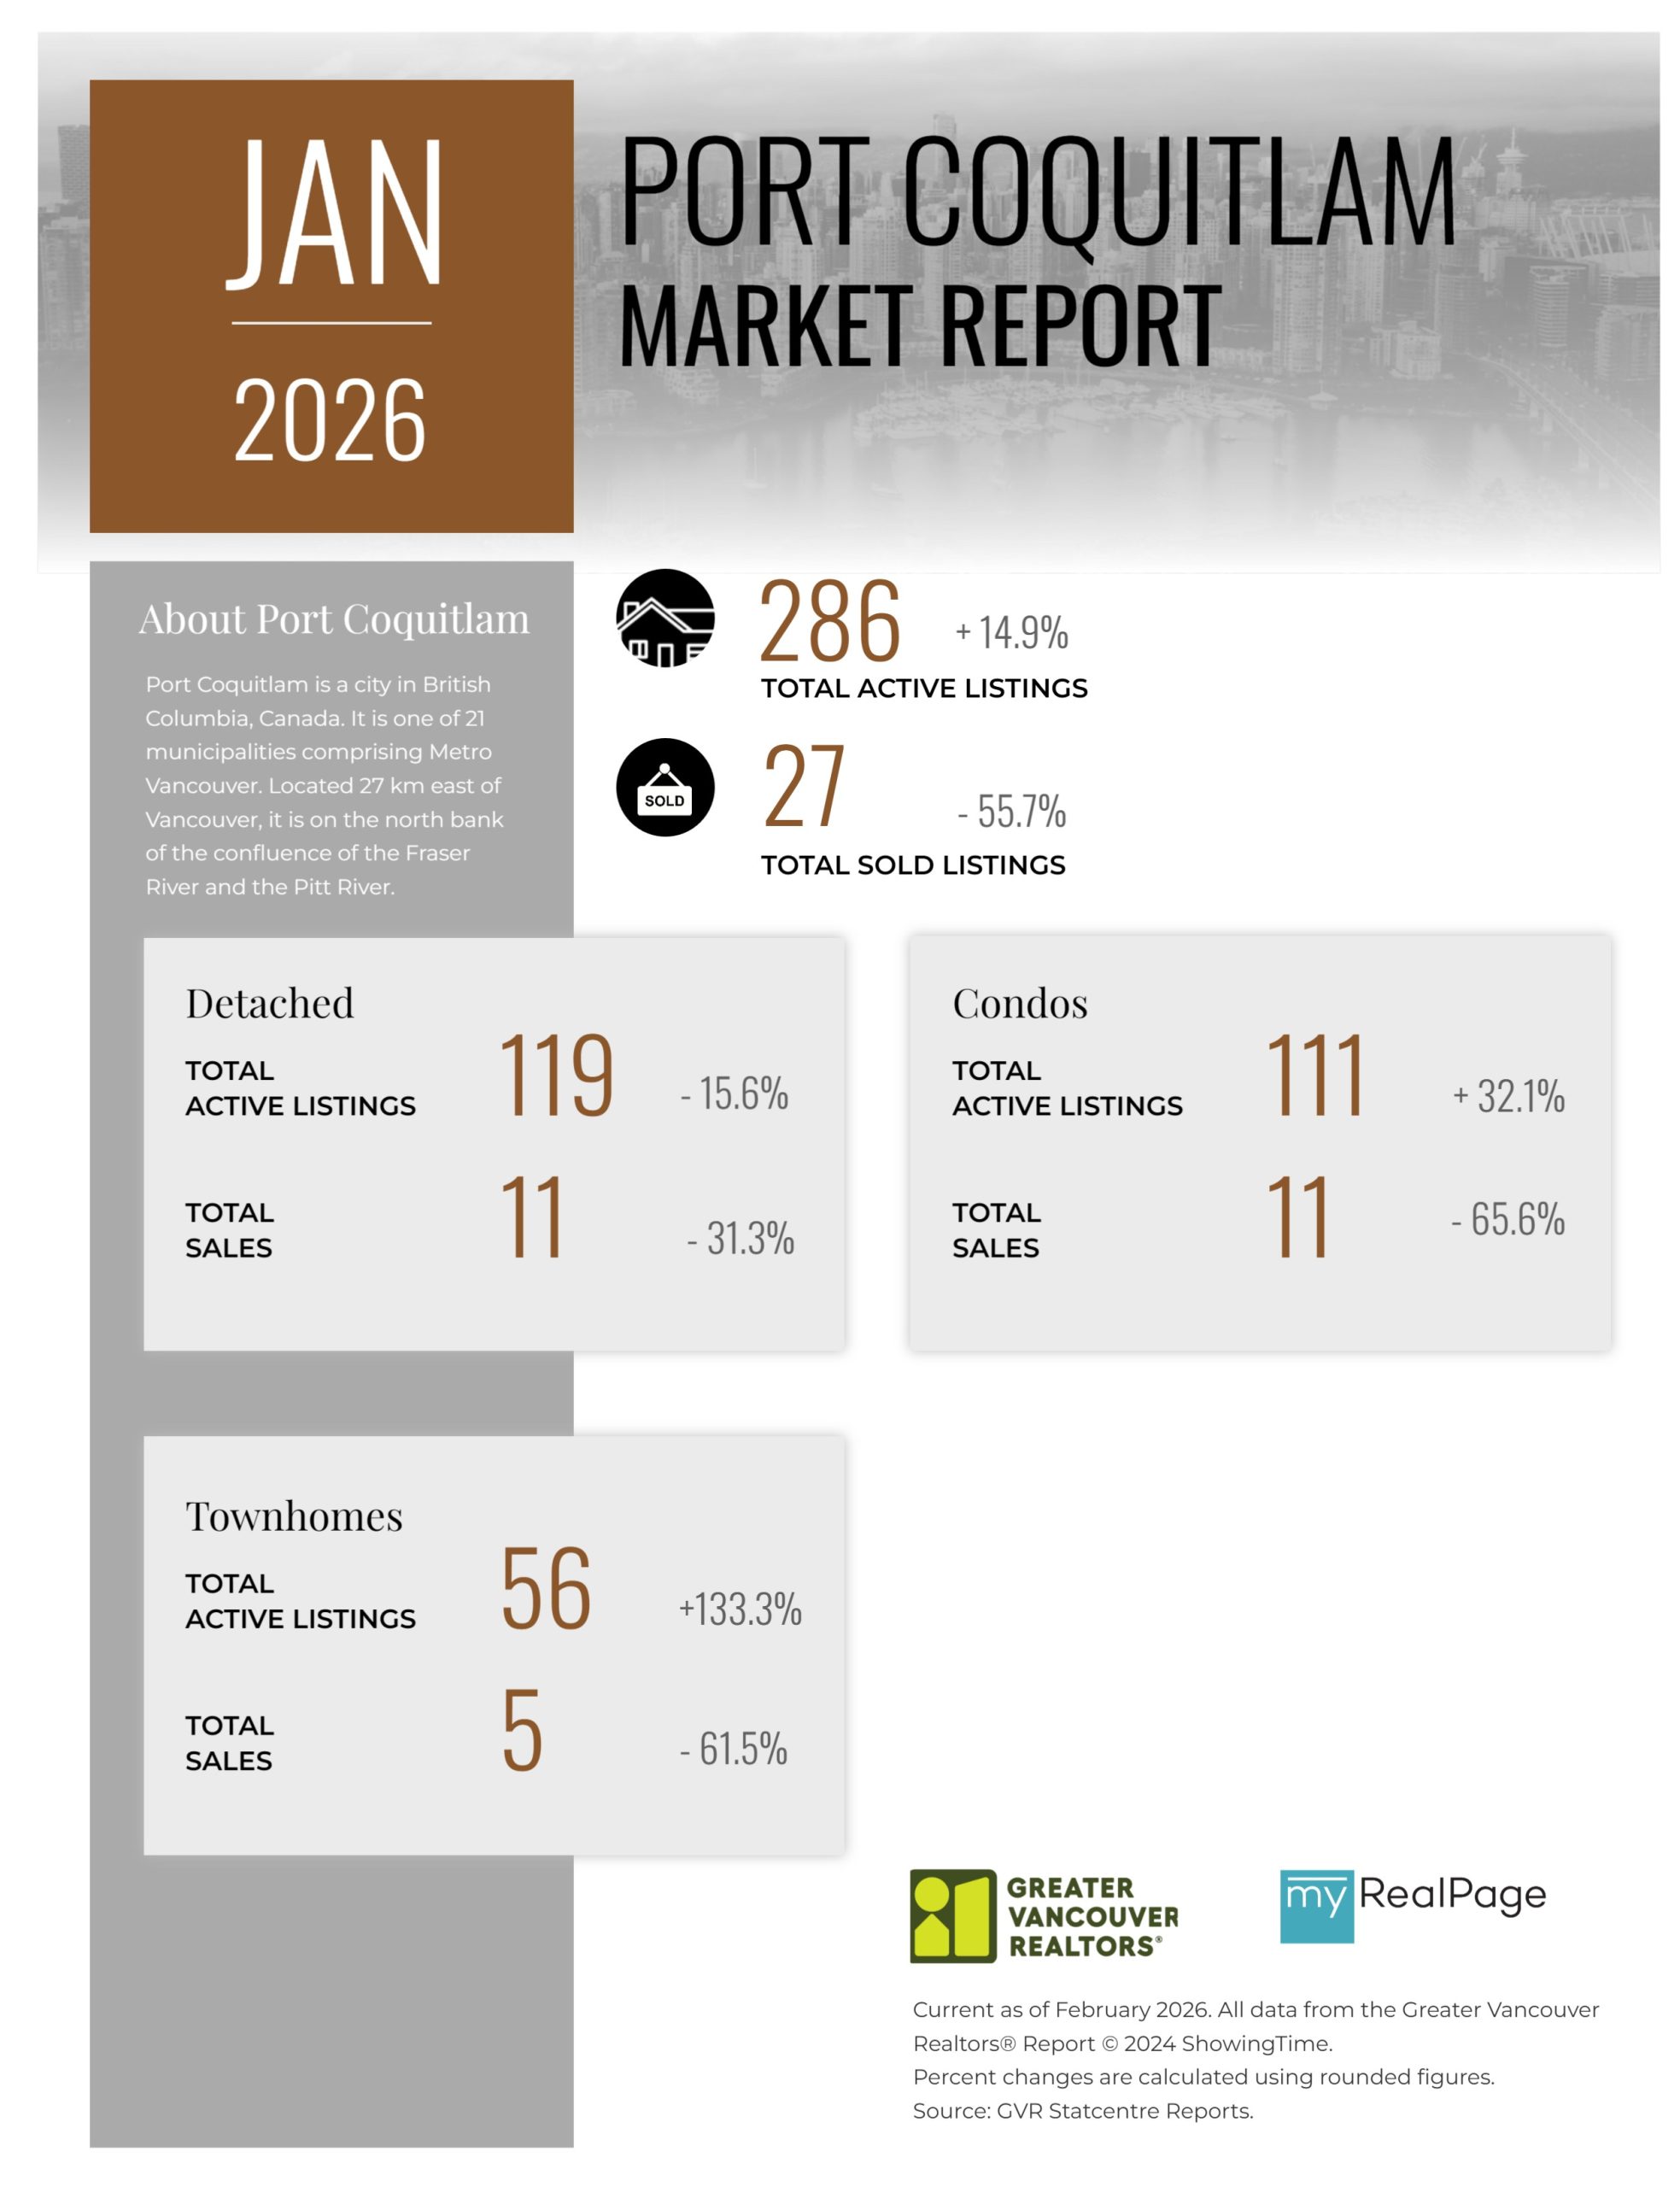
Printable Version – GVR January 2026 Data Infographics Report Port Coquitlam
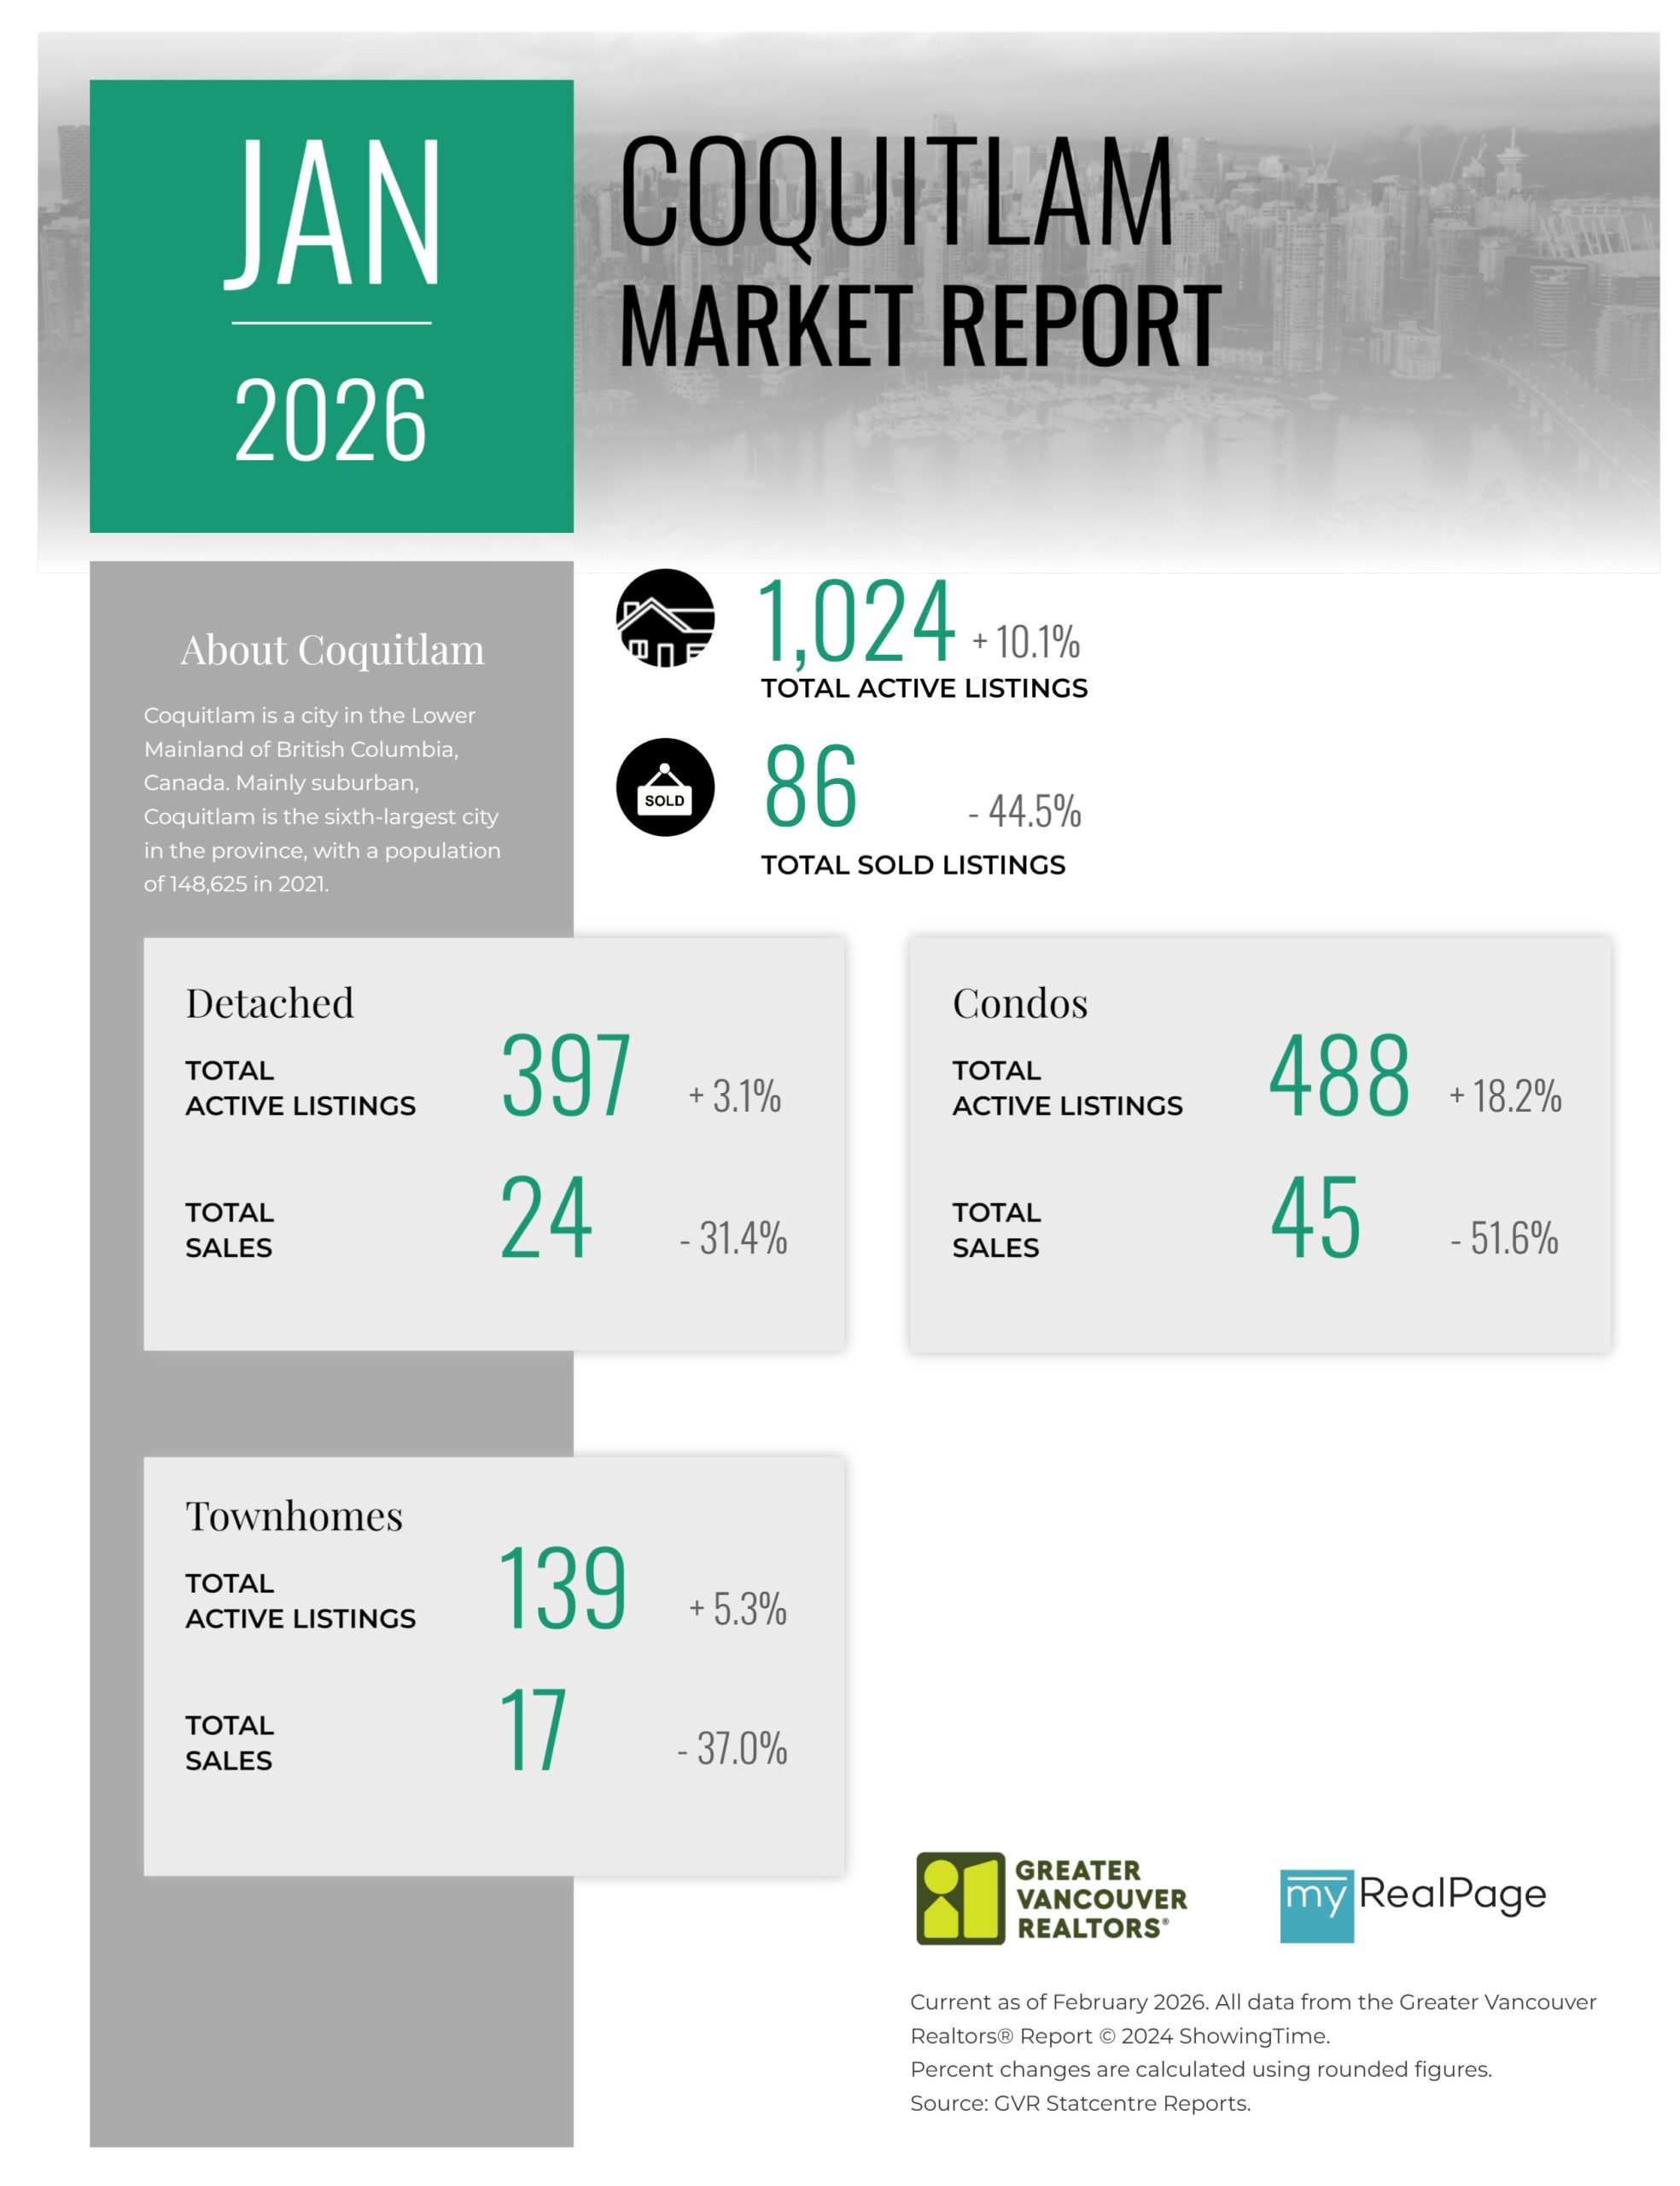
Printable Version – GVR January 2026 Data Infographics Report Coquitlam
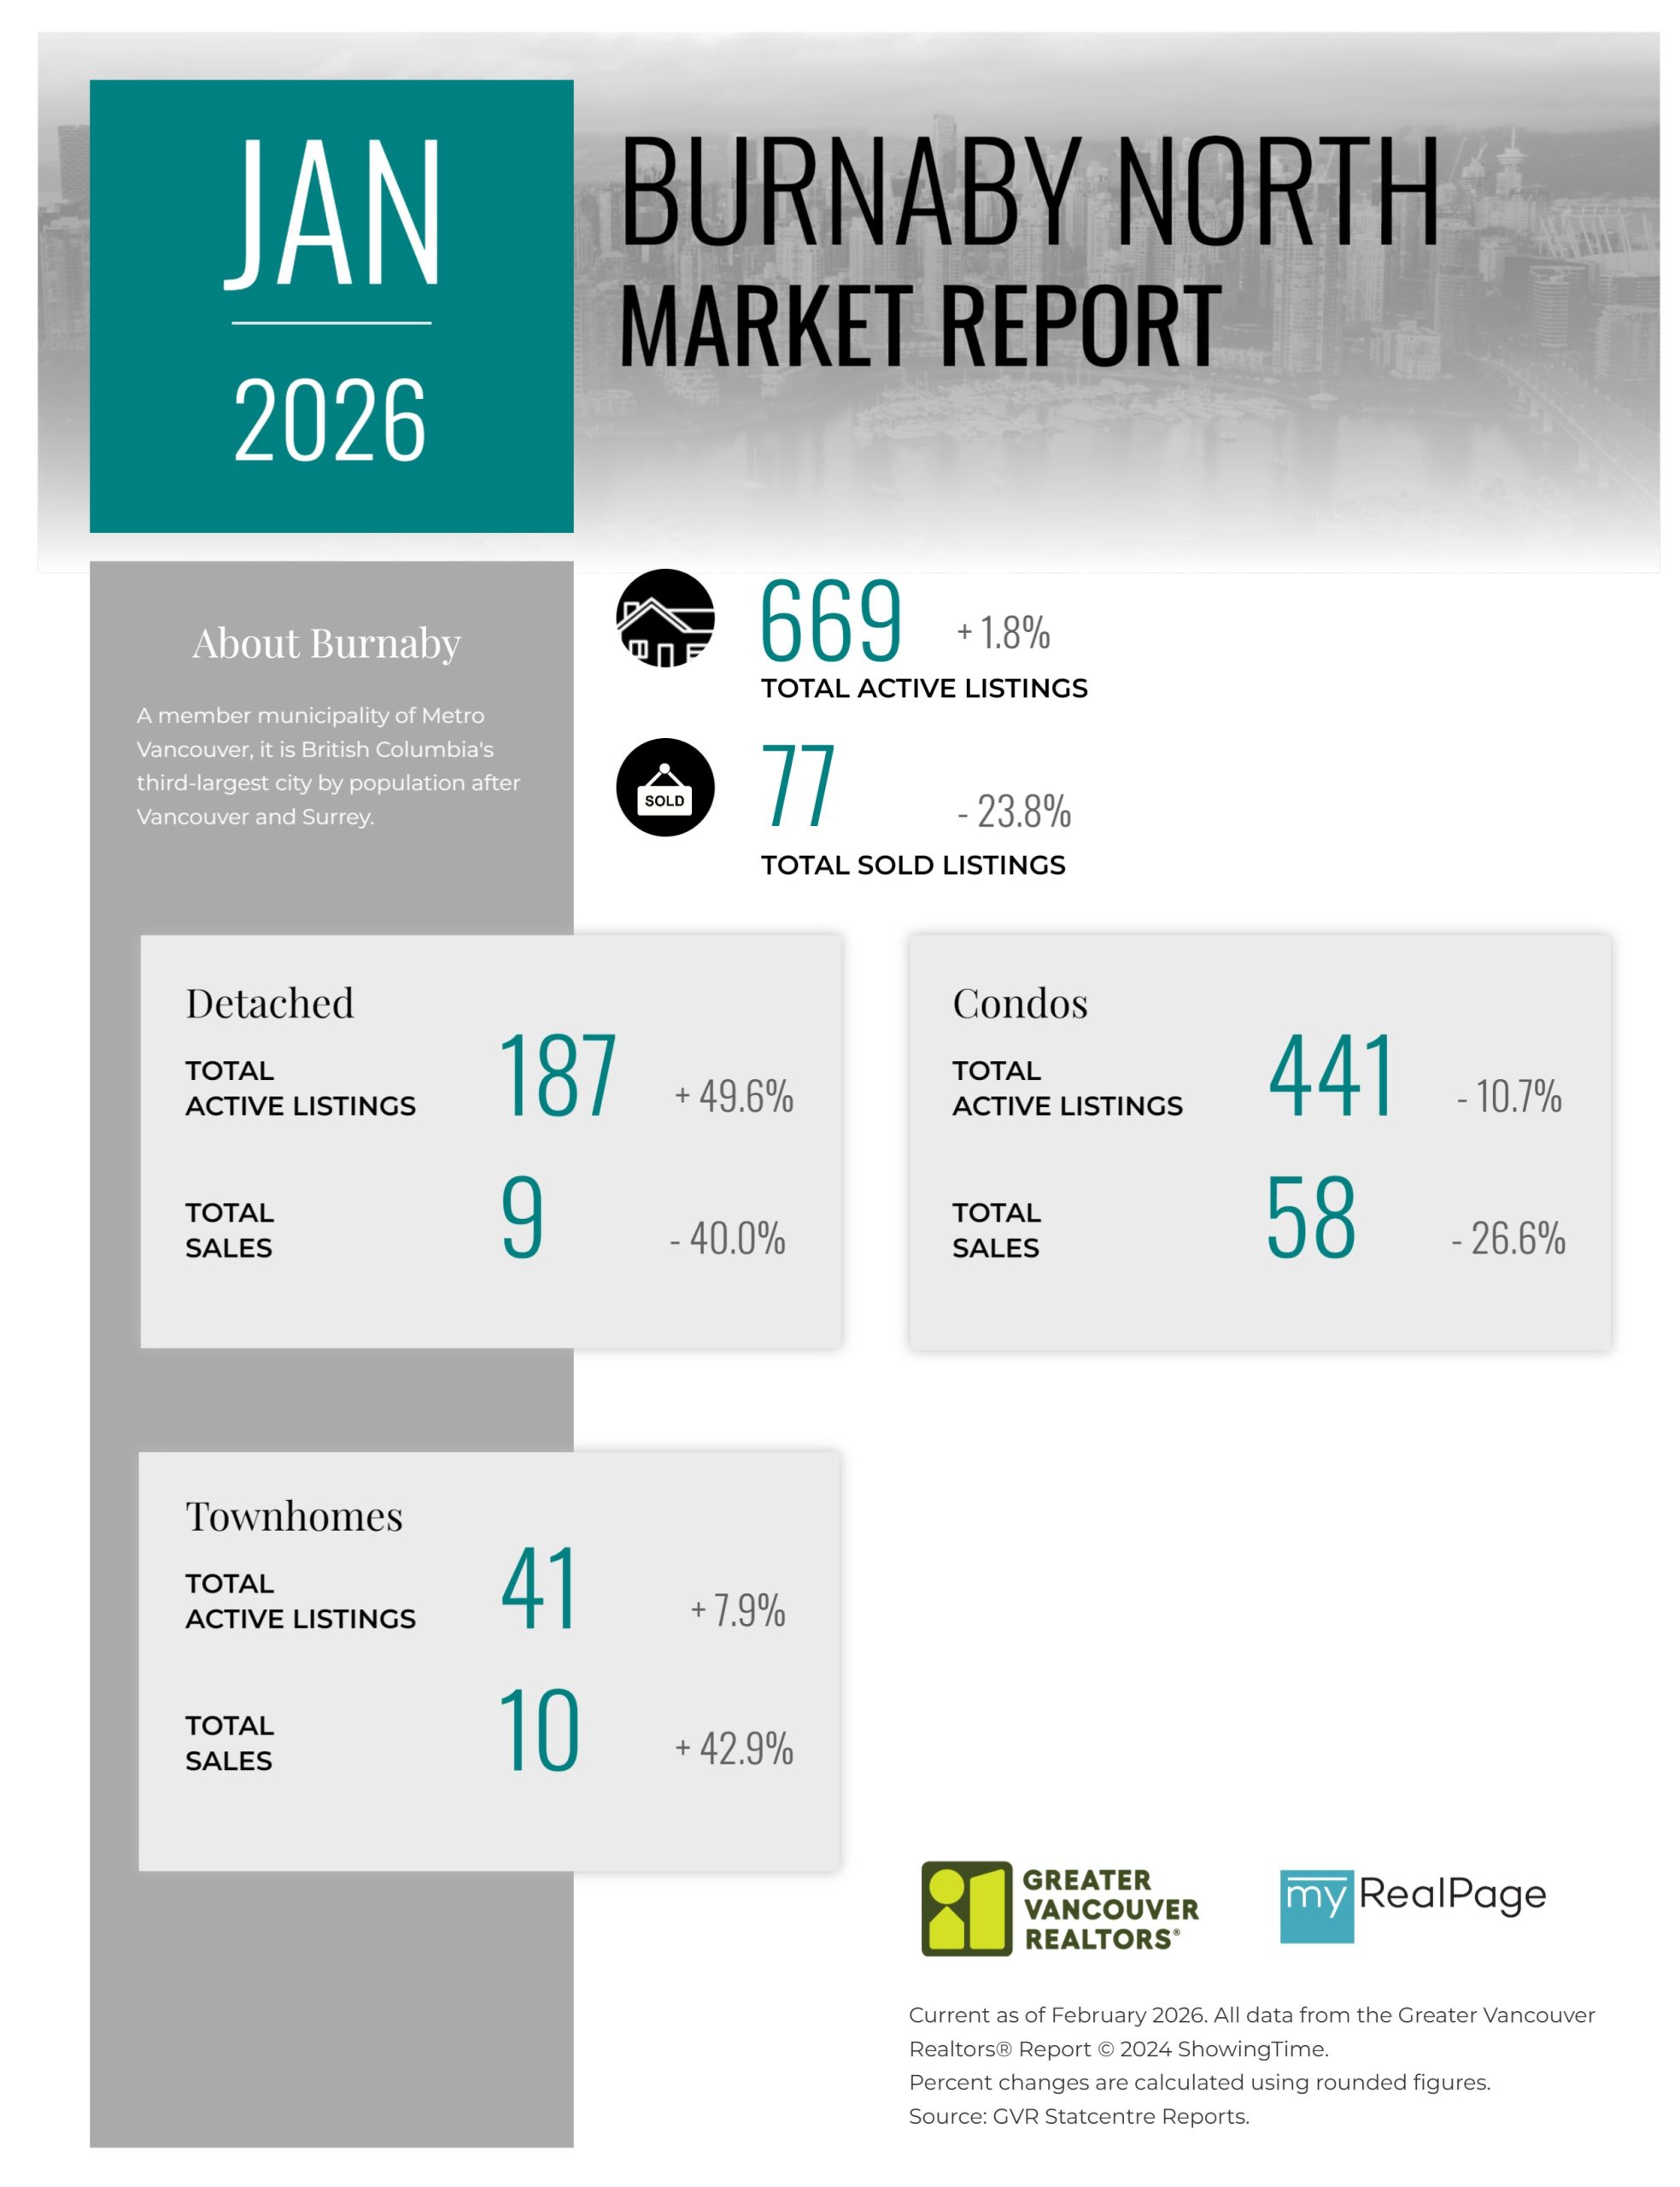
Printable Version – GVR January 2026 Data Infographic Report Burnaby North
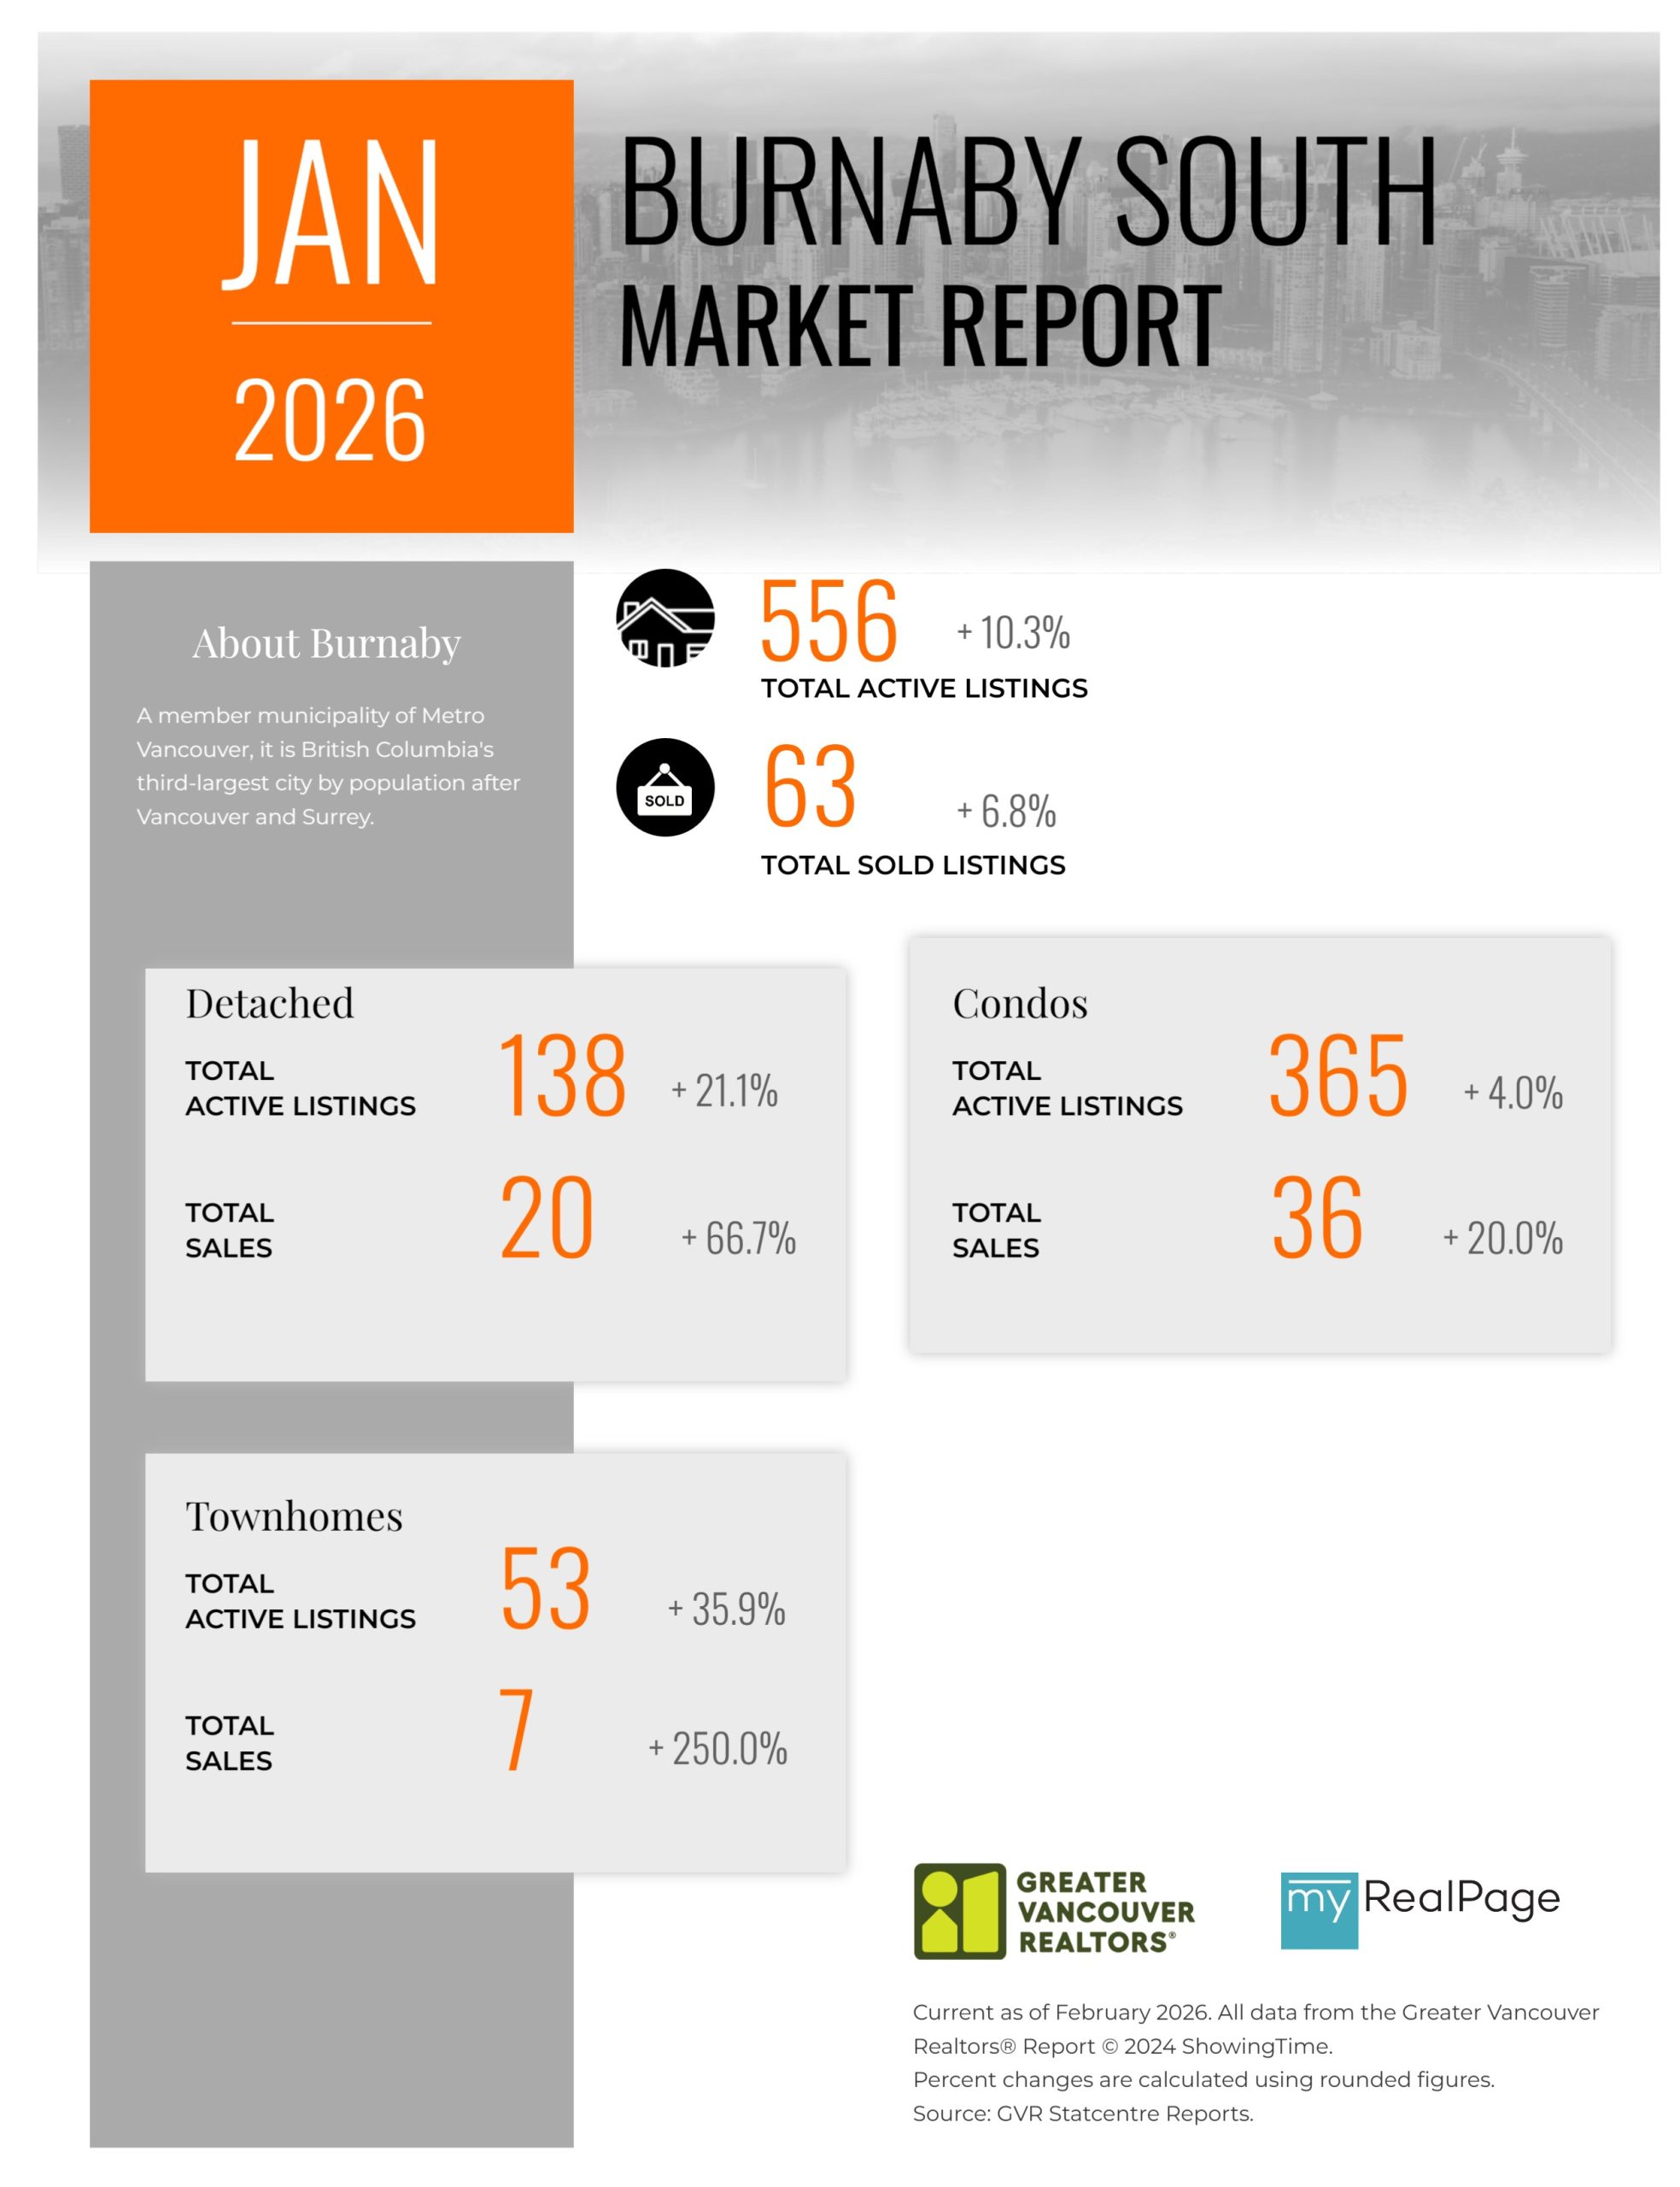
Printable Version – GVR January 2026 Data Infographics Report Burnaby South
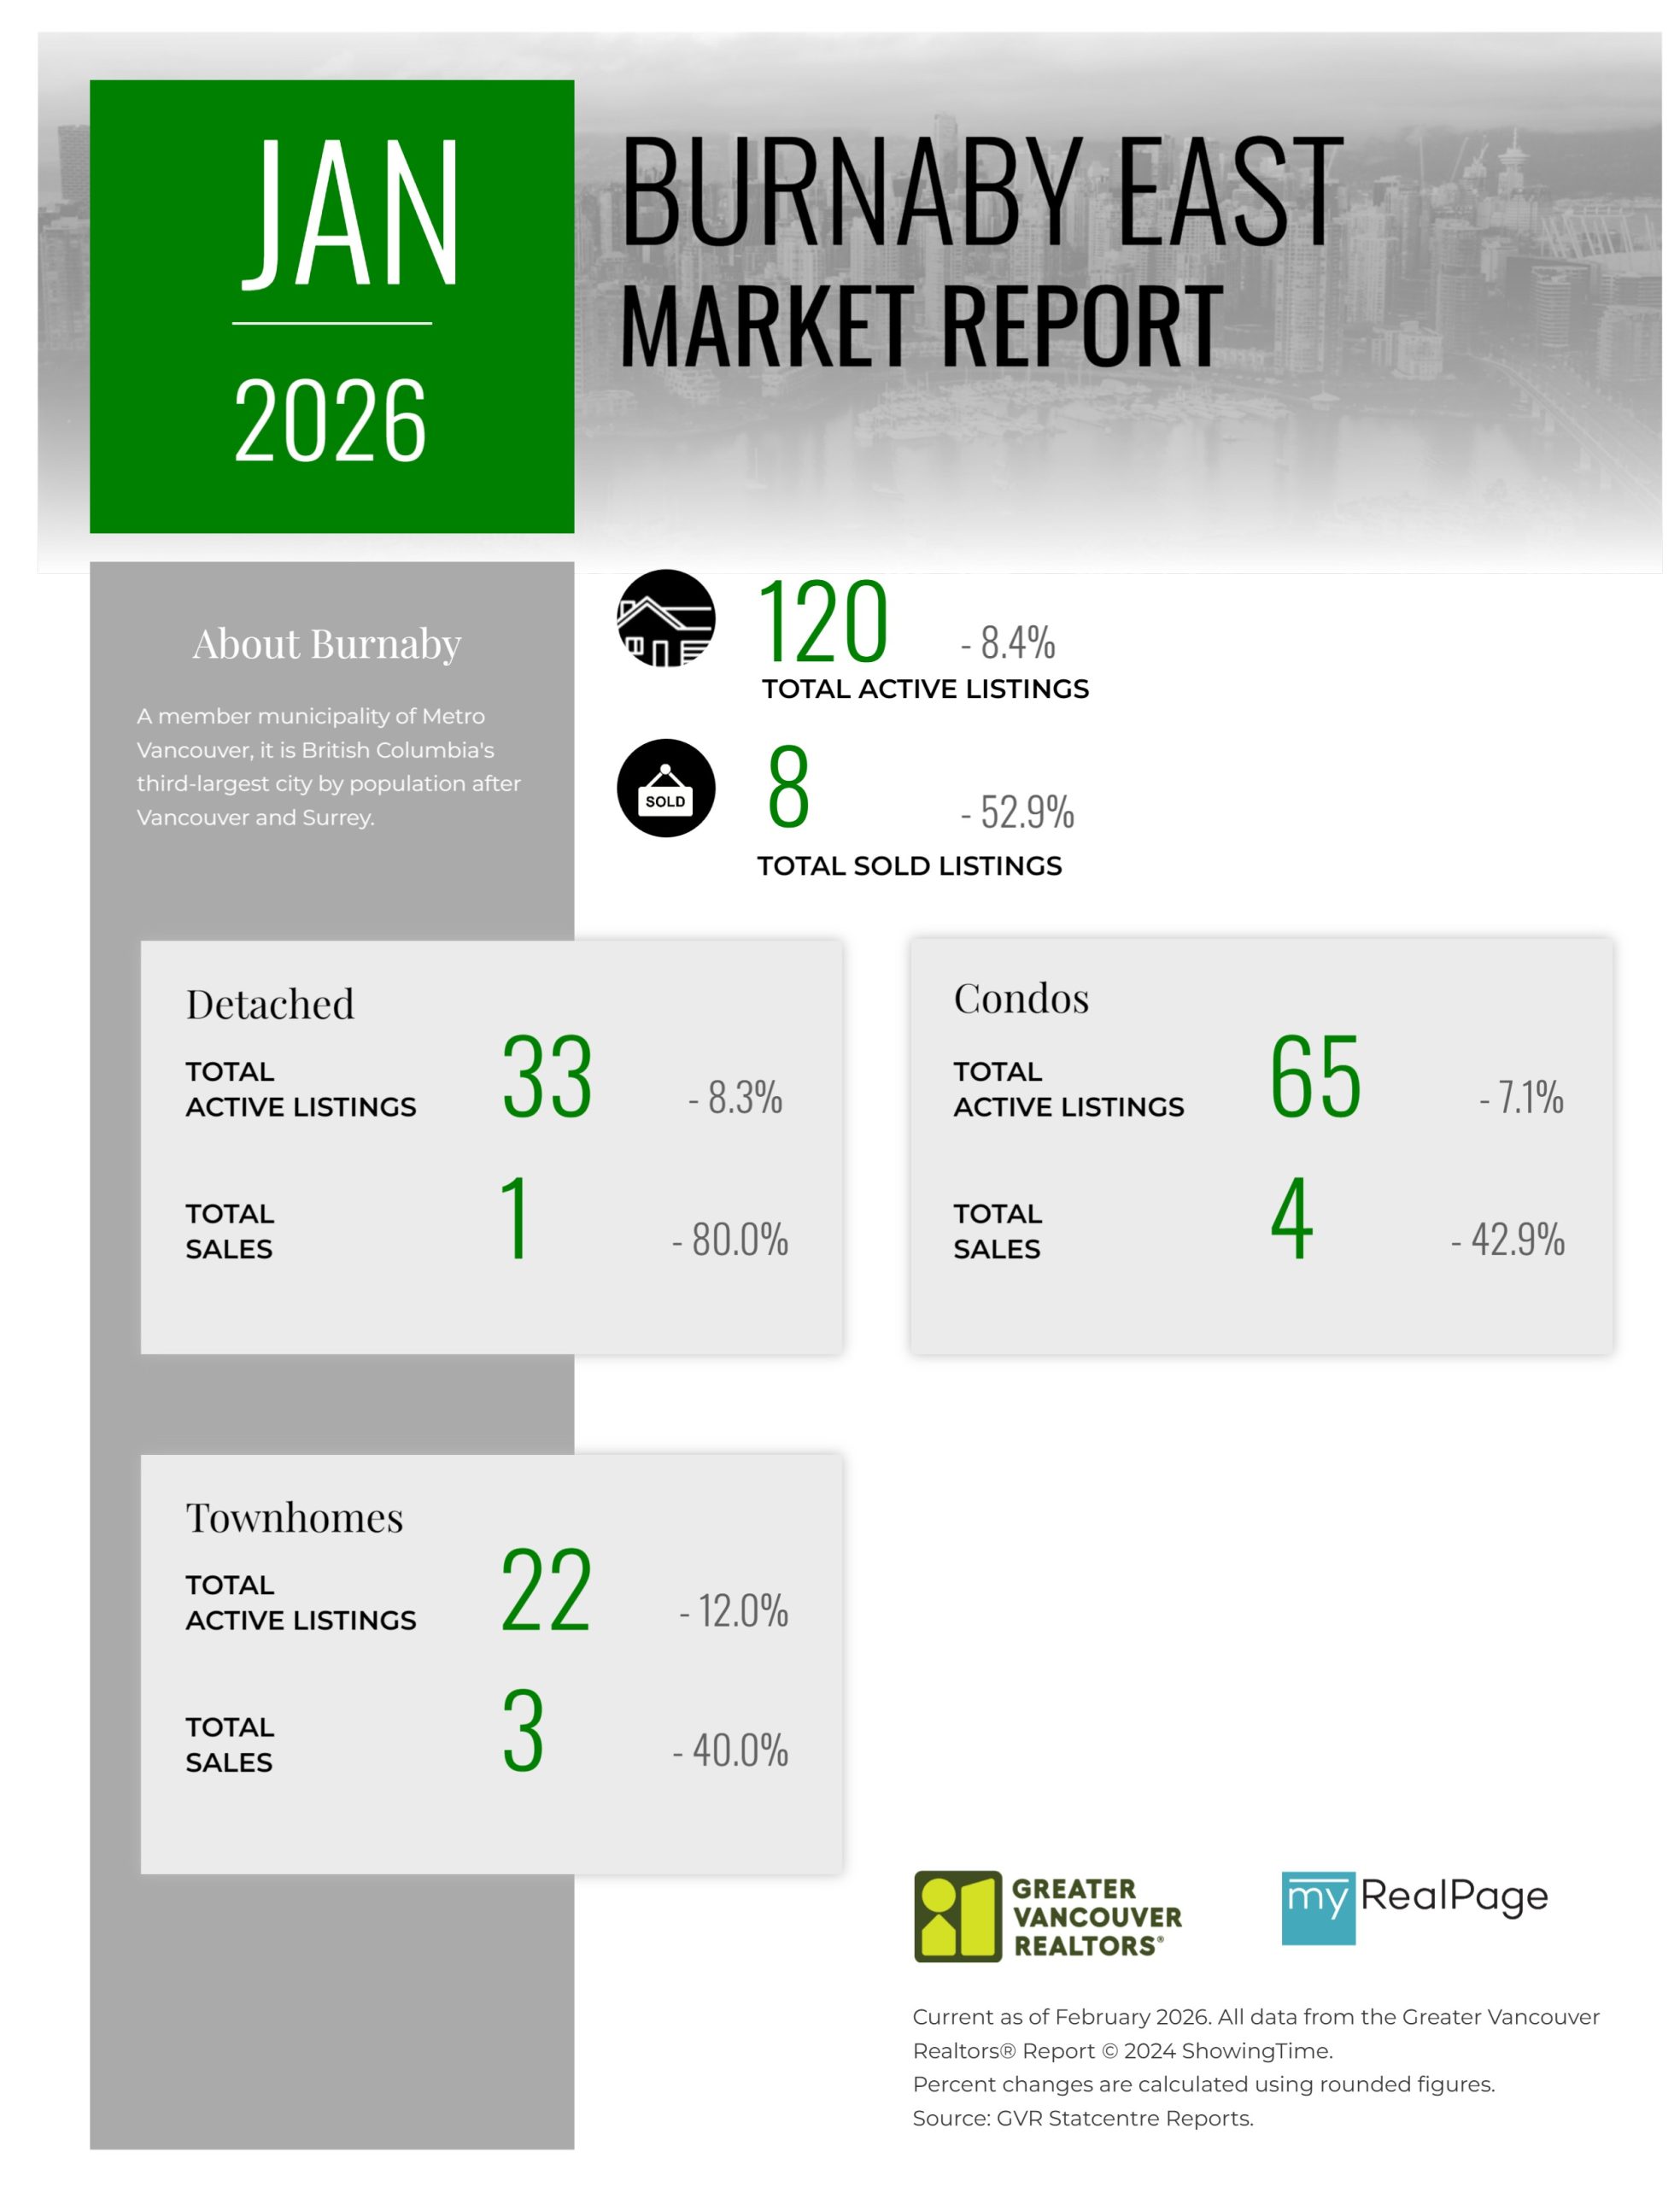
Printable Version – GVR January 2026 Data Infographics Report Burnaby East
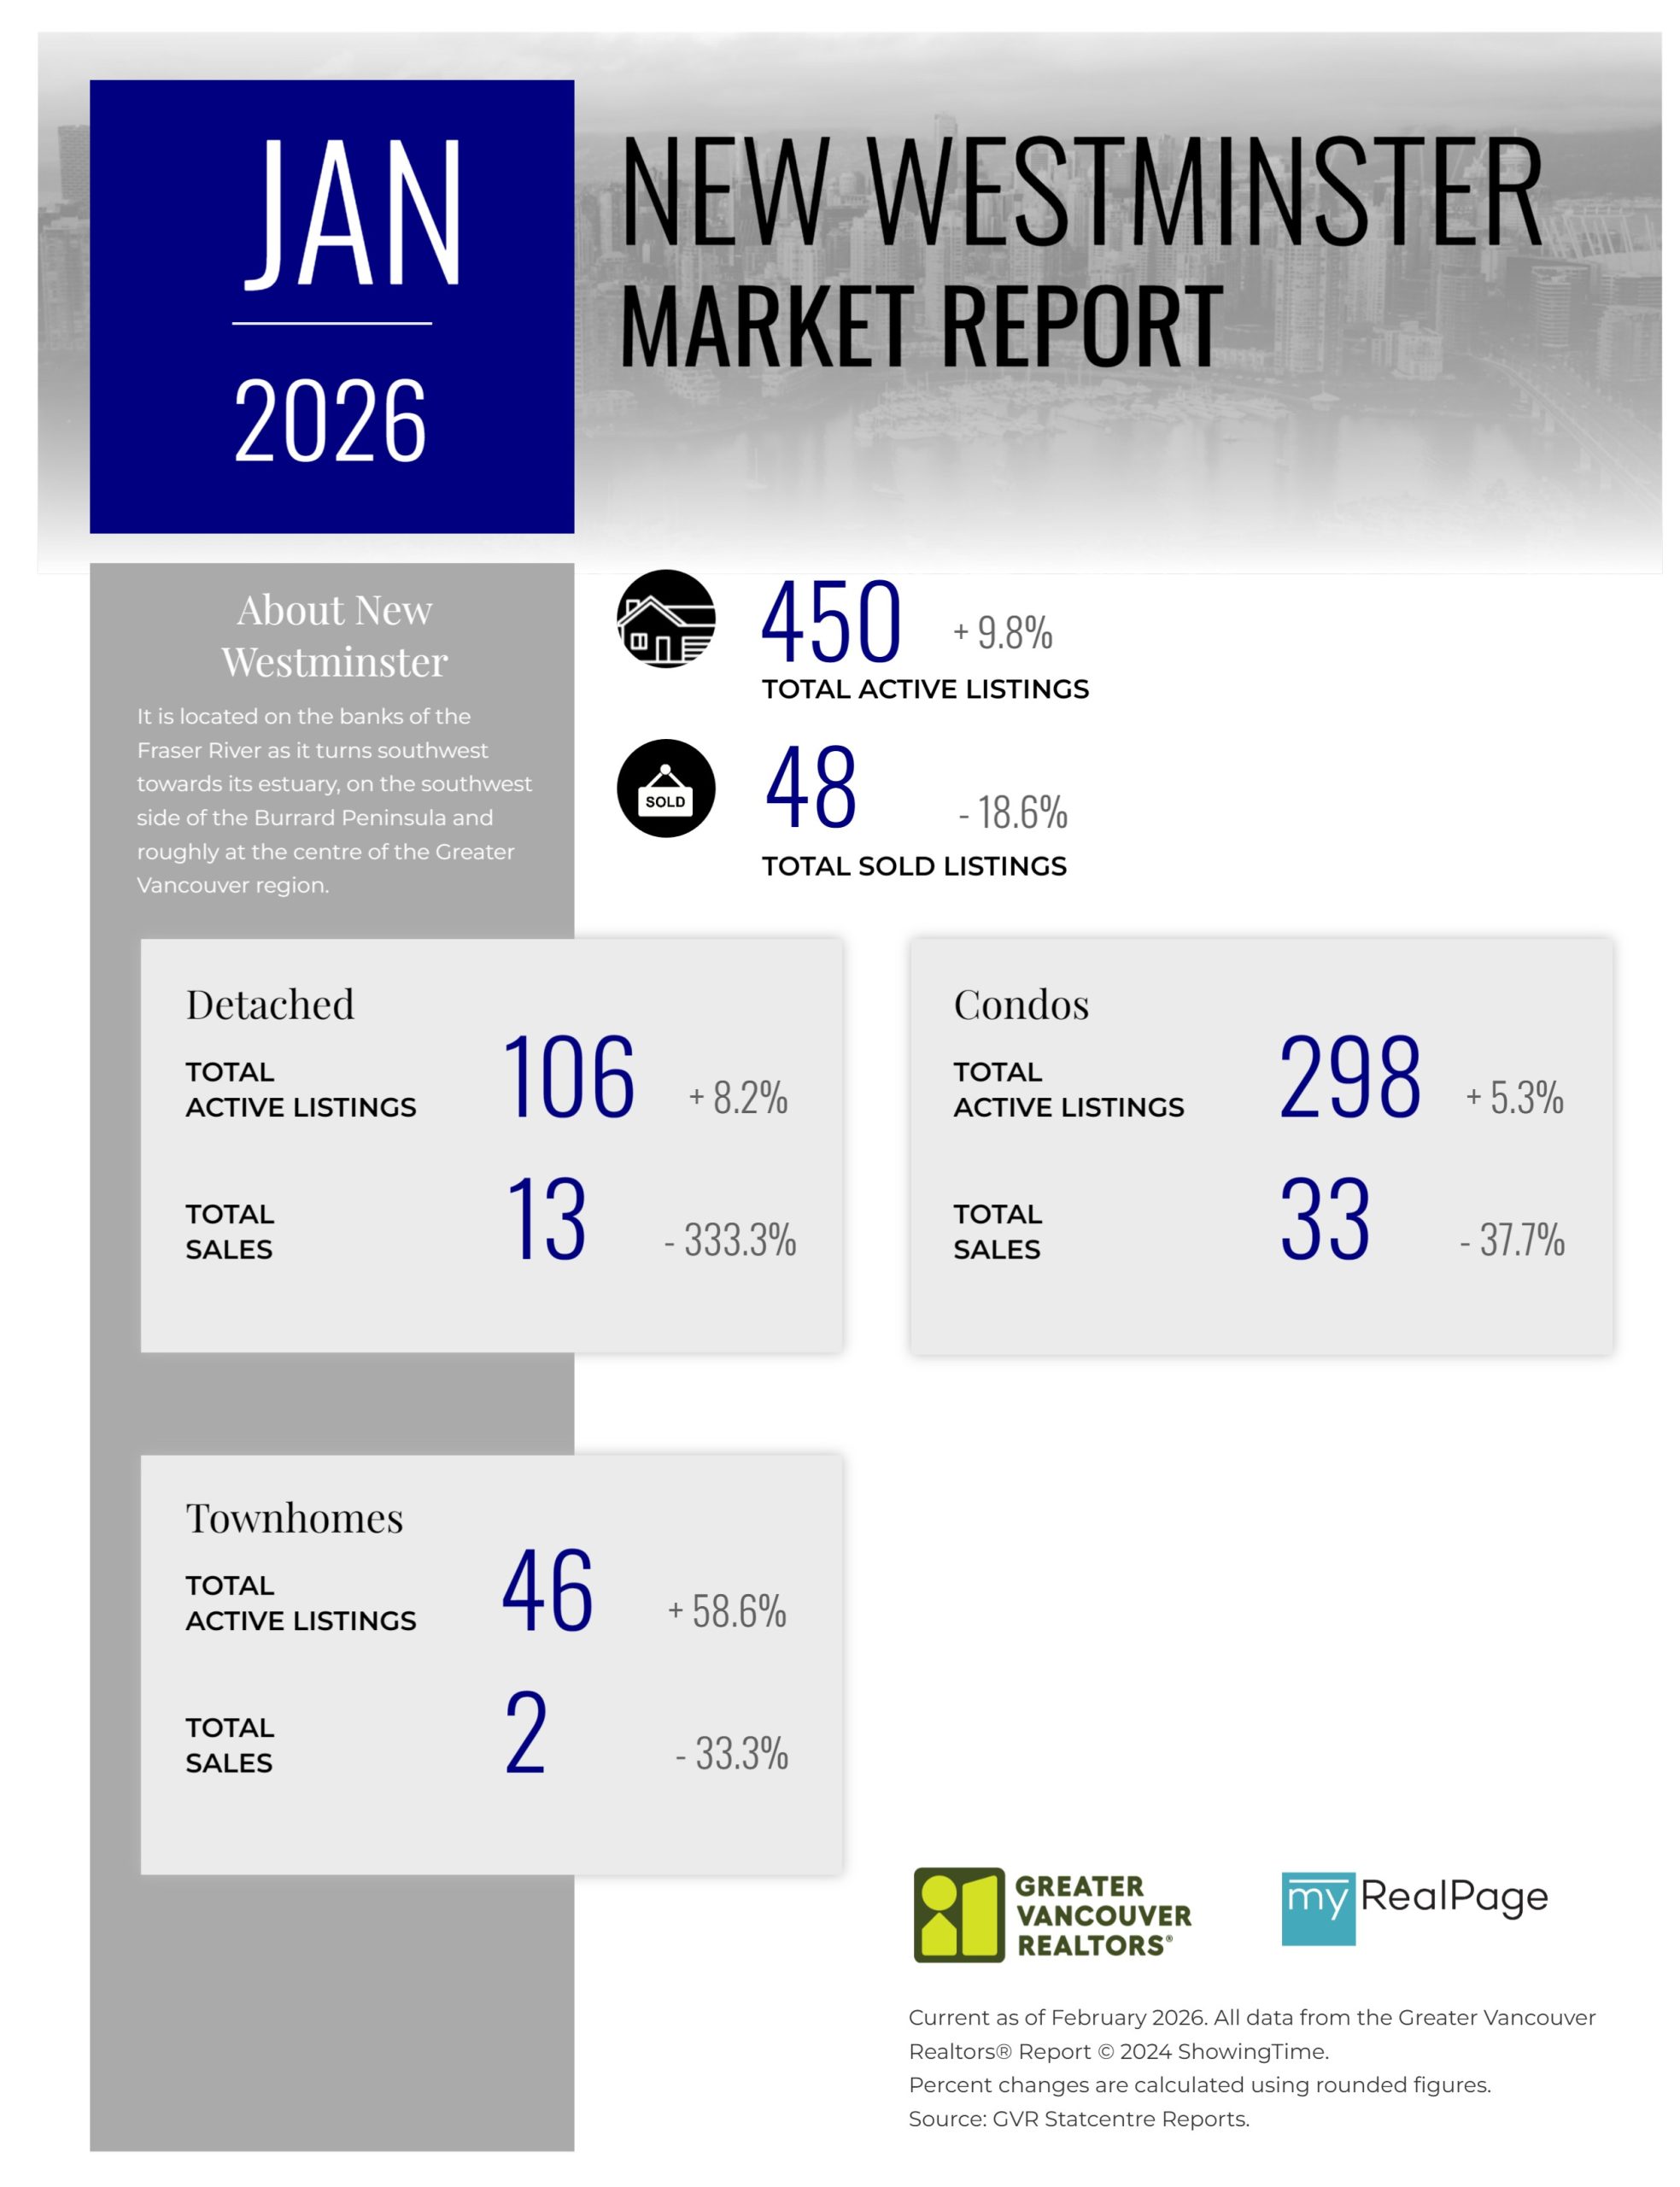
Printable Version – GVR January 2026 Data Infographics Report New Westminster
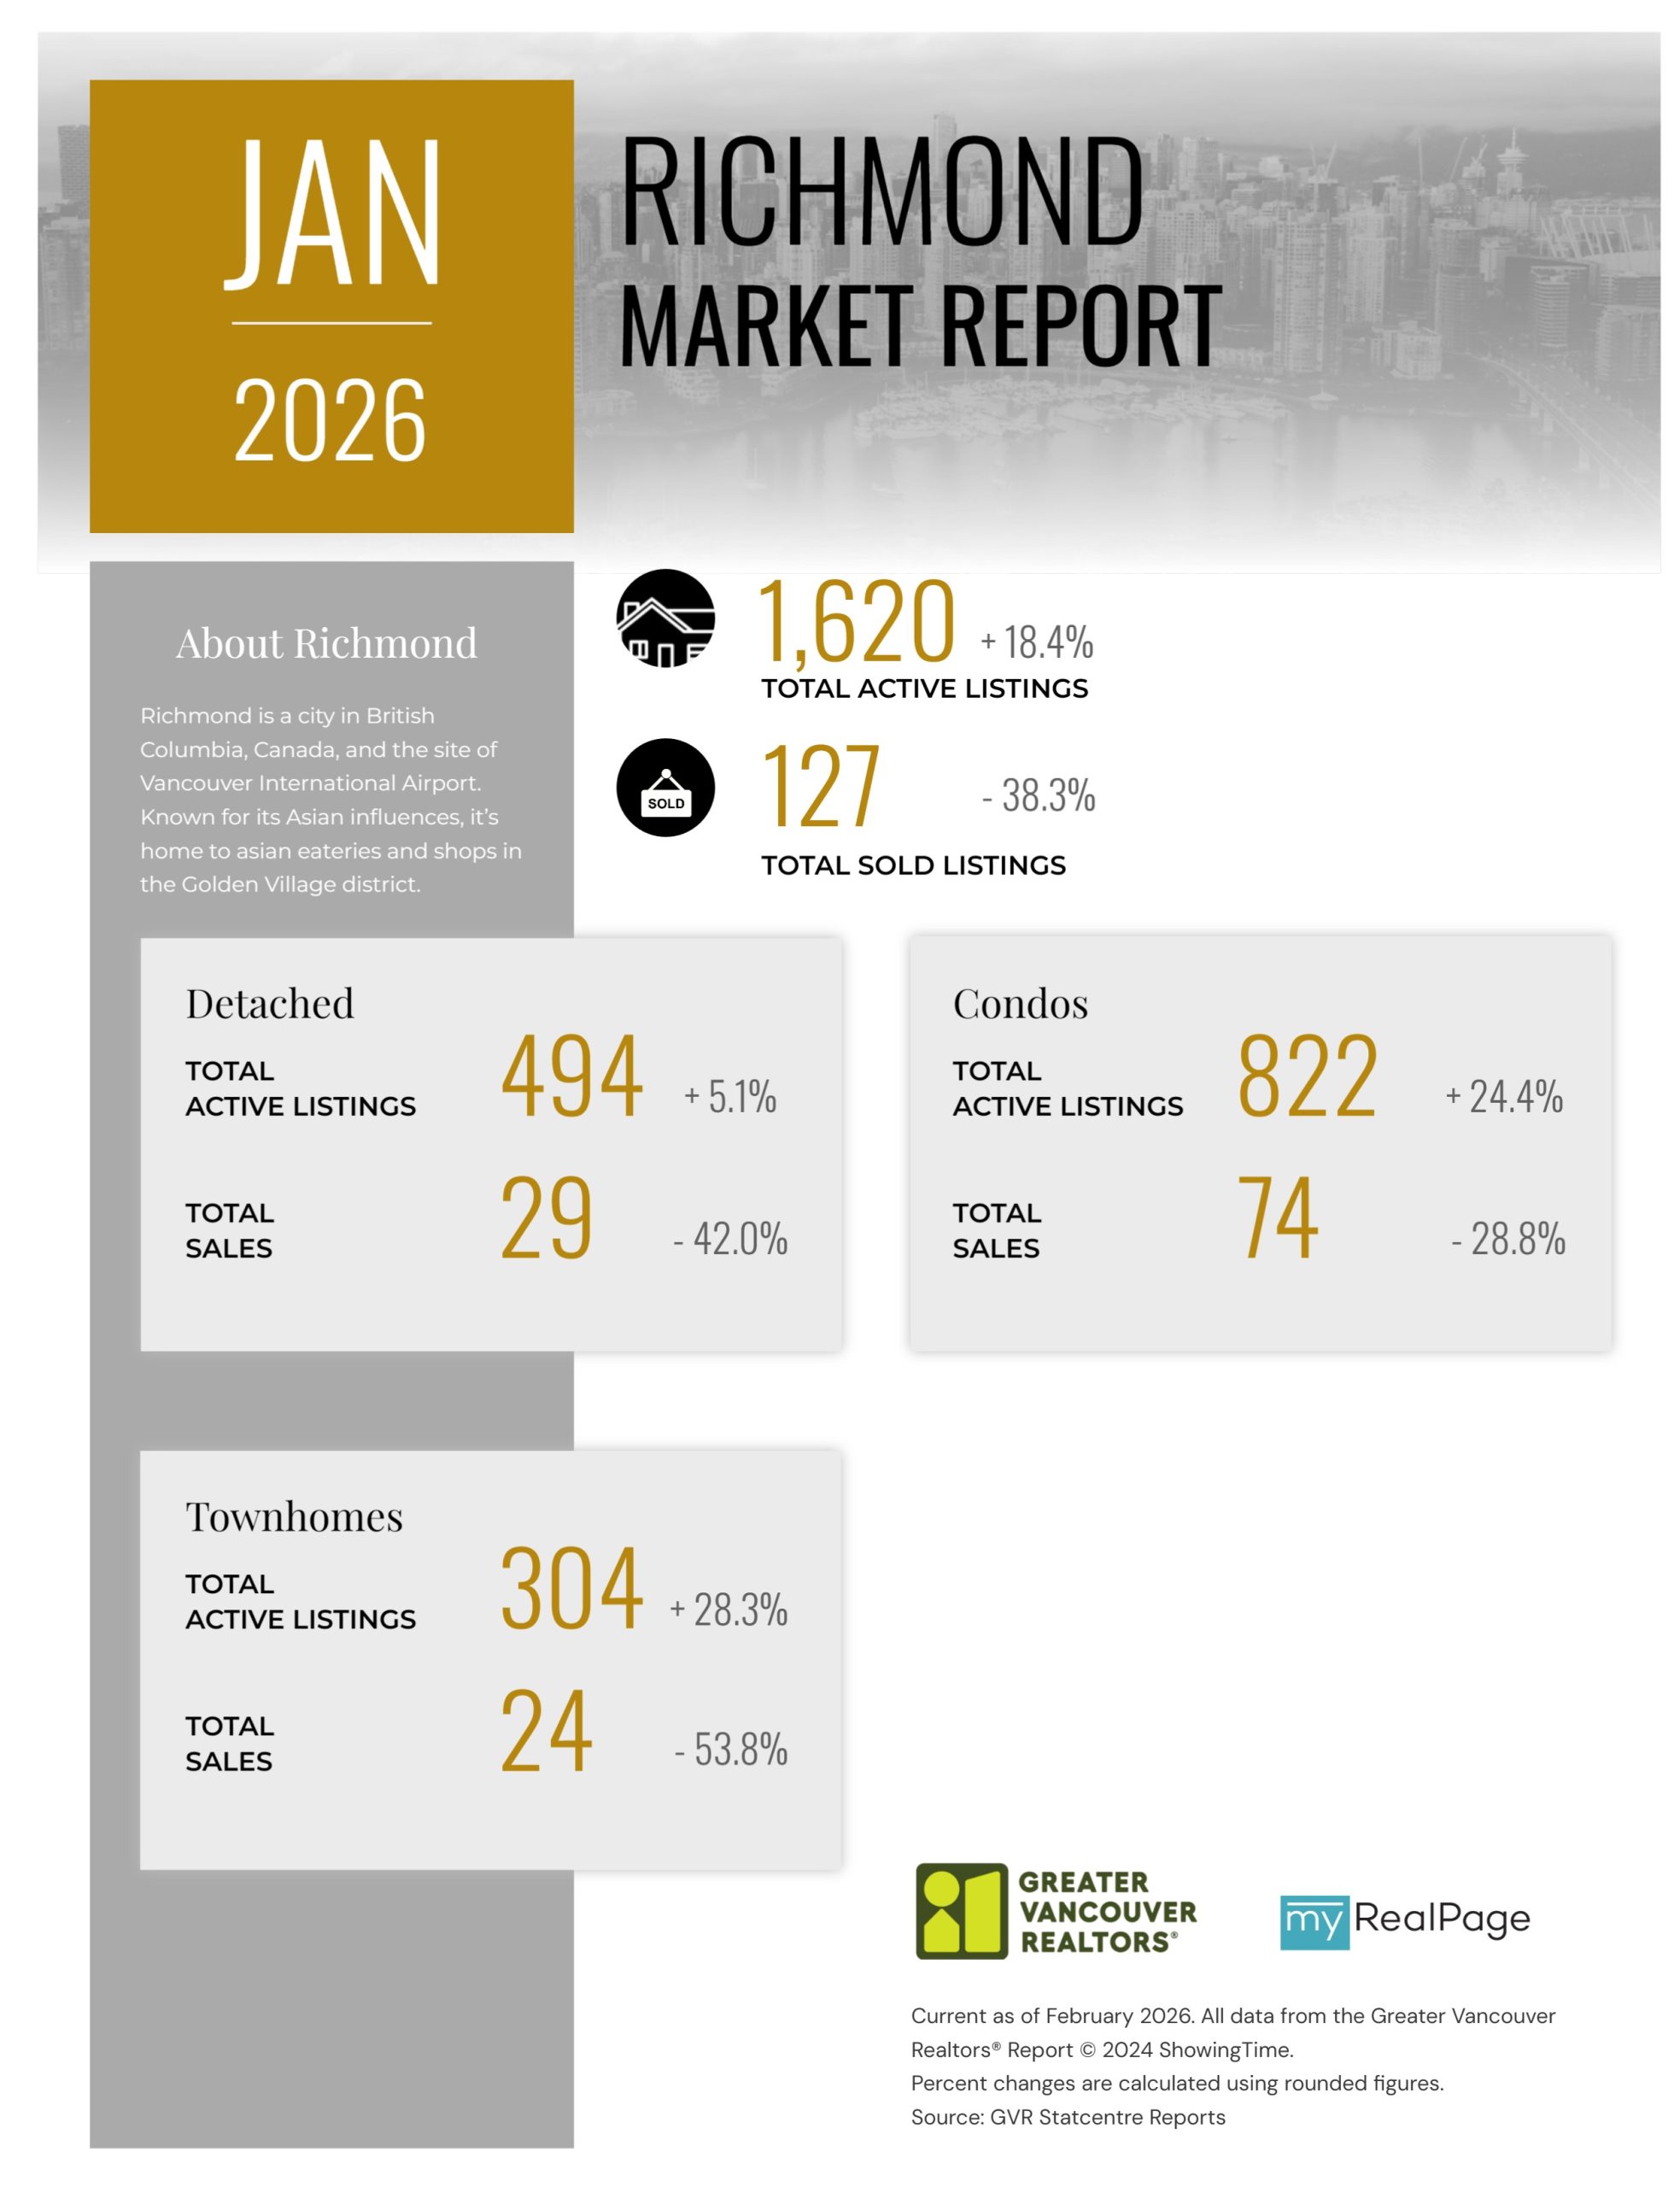
Printable Version – GVR January 2026 Data Infographics Report Richmond
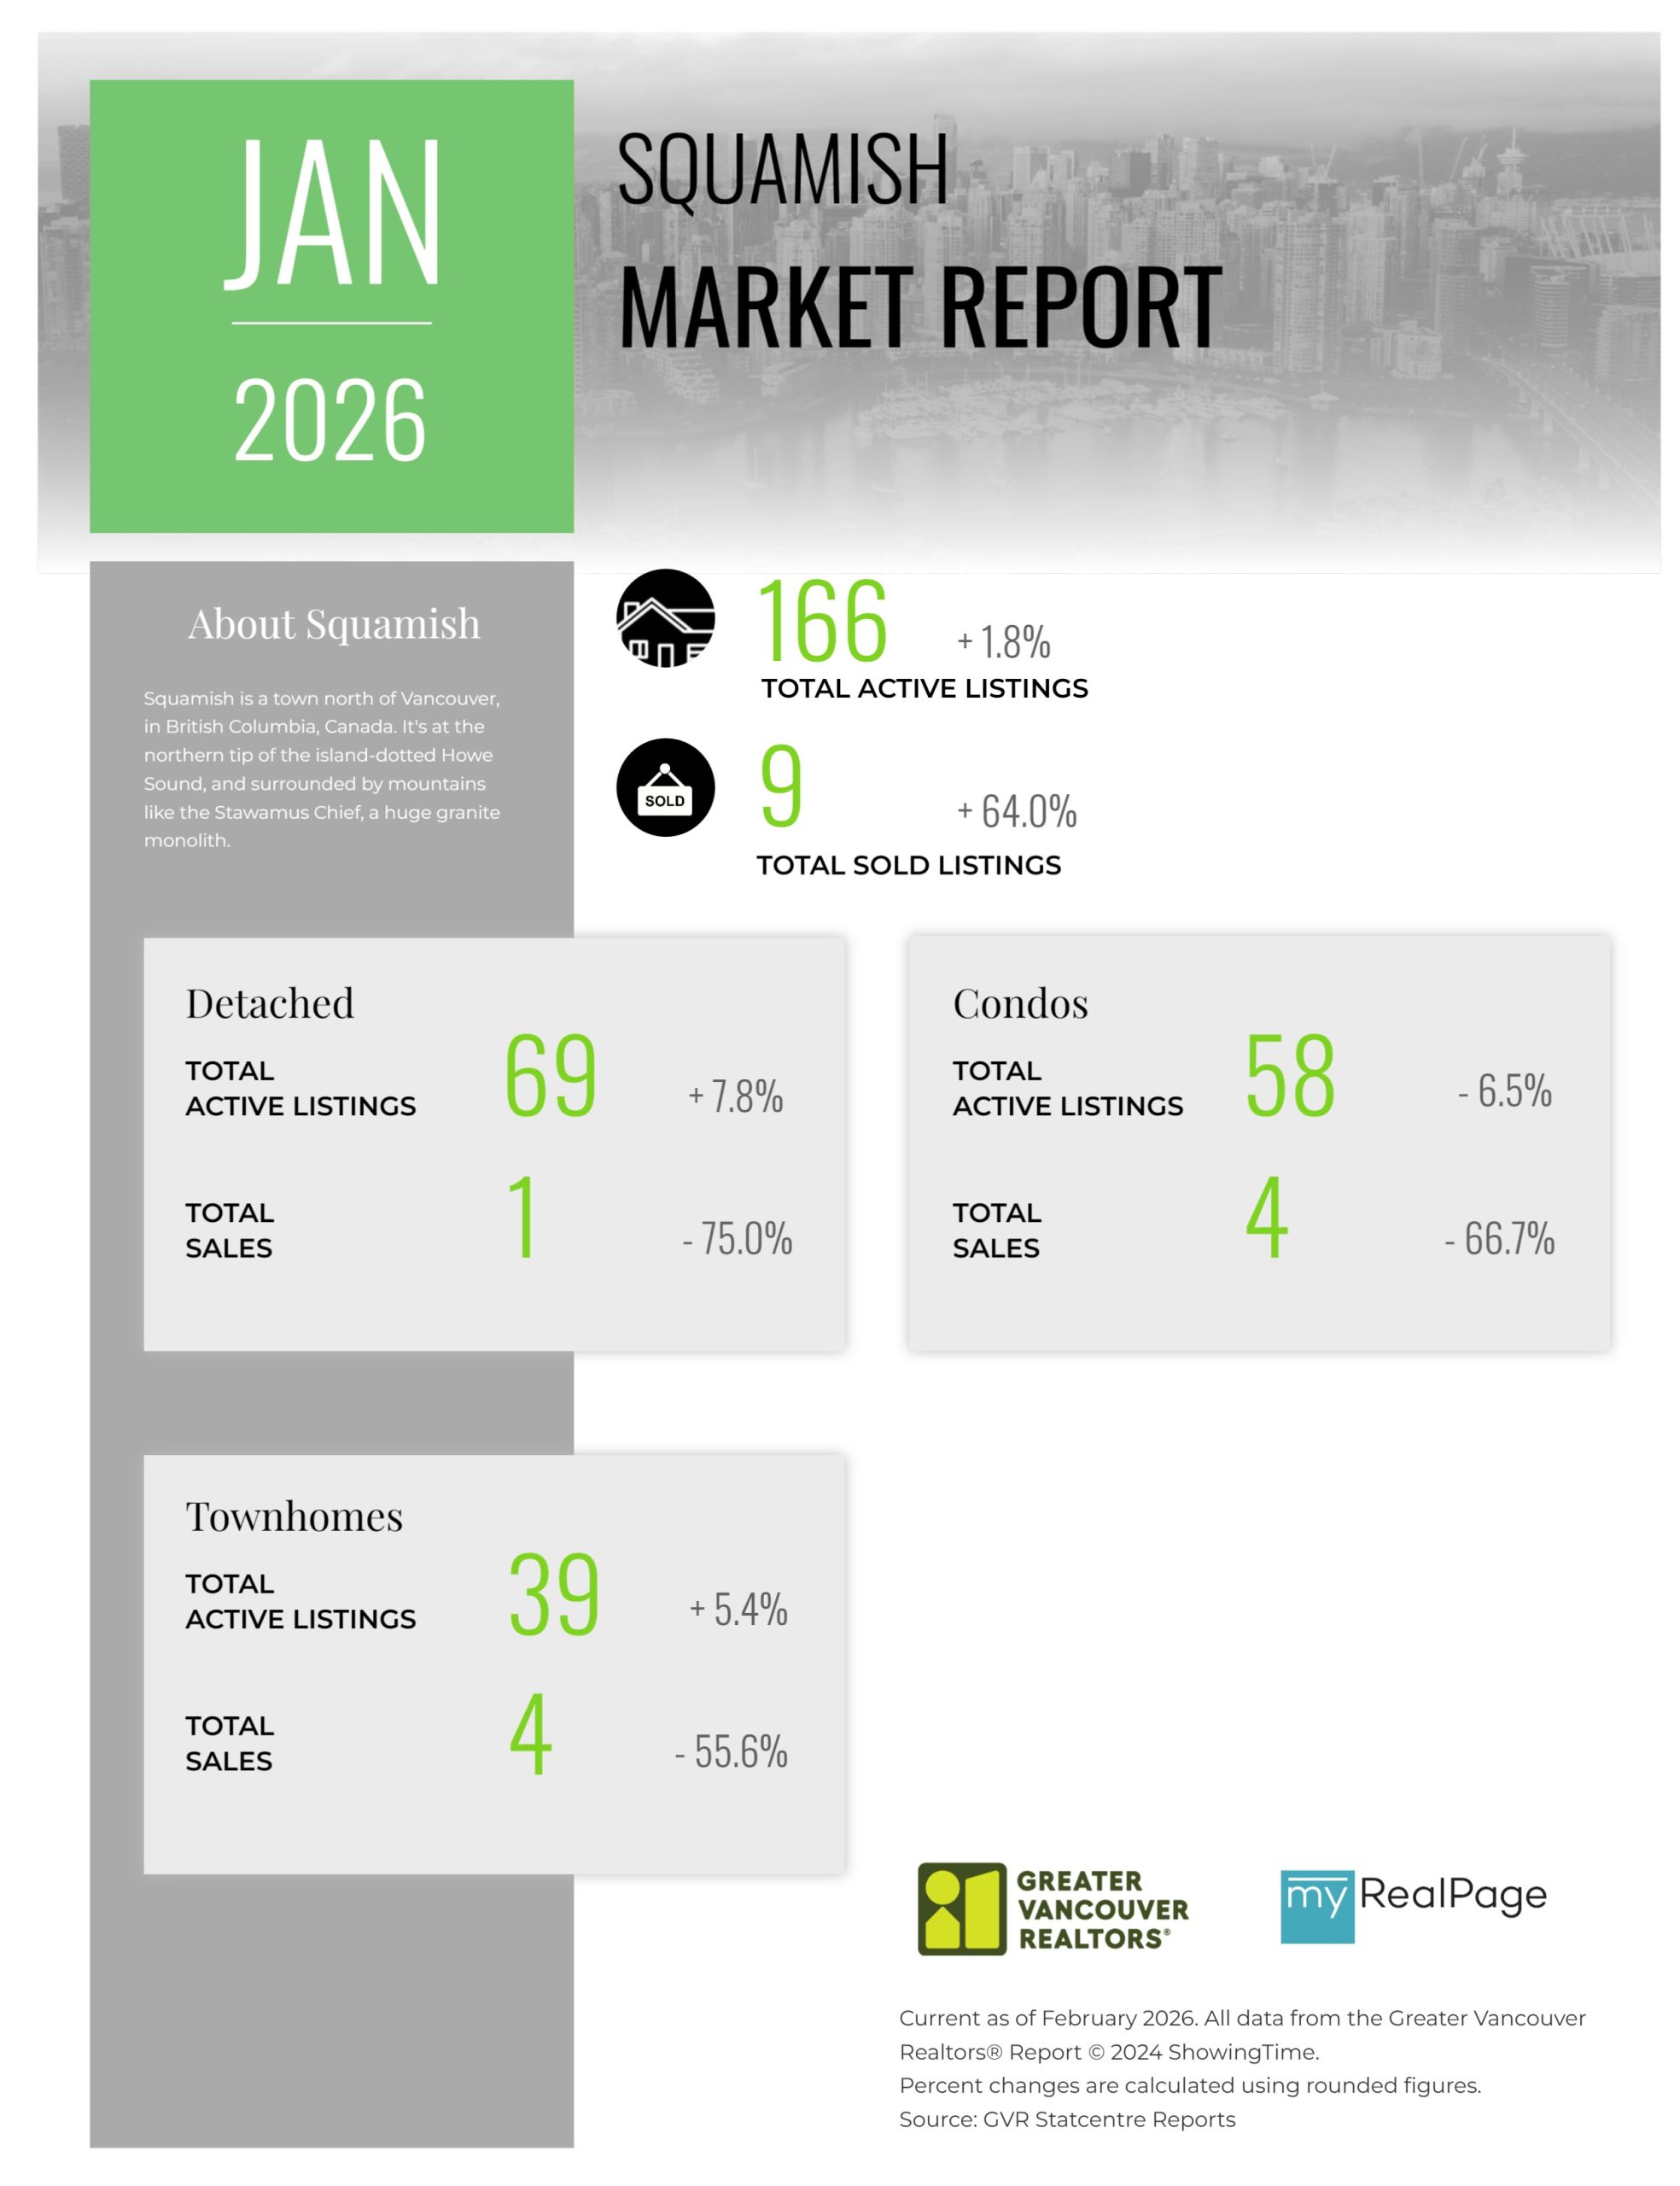
Printable Version – GVR January 2026 Data Infographics Report Squamish
Last Updated on February 9, 2026 by myRealPage
