INFOGRAPHICS: April 2025 GVR Greater Vancouver Market Reports

Spring market brings abundance of opportunity for buyers
The slowdown in home sales registered on the Multiple Listing Service® (MLS®) in Metro Vancouver* that began early this year continued in April, with sales down nearly 24 per cent year-over-year.
The Greater Vancouver REALTORS® (GVR) reports that residential sales in the region totalled 2,163 in April 2025, a 23.6 per cent decrease from the 2,831 sales recorded in April 2024. This was 28.2 per cent below the 10-year seasonal average (3,014).
“From a historical perspective, the slower sales we’re now seeing stand out as unusual, particularly against a backdrop of significantly improved borrowing conditions, which typically helps to boost sales. What’s also unusual is starting the year with Canada’s largest trading partner threatening to tilt our economy into recession via trade policy, while at the same time having Canadians head to the polls to elect a new federal government. These issues have been hard to ignore, and the April home sales figures suggest some buyers have continued to patiently wait out the storm.” said Andrew Lis, GVR director of economics and data analytics
Read the full report on the REBGV website!
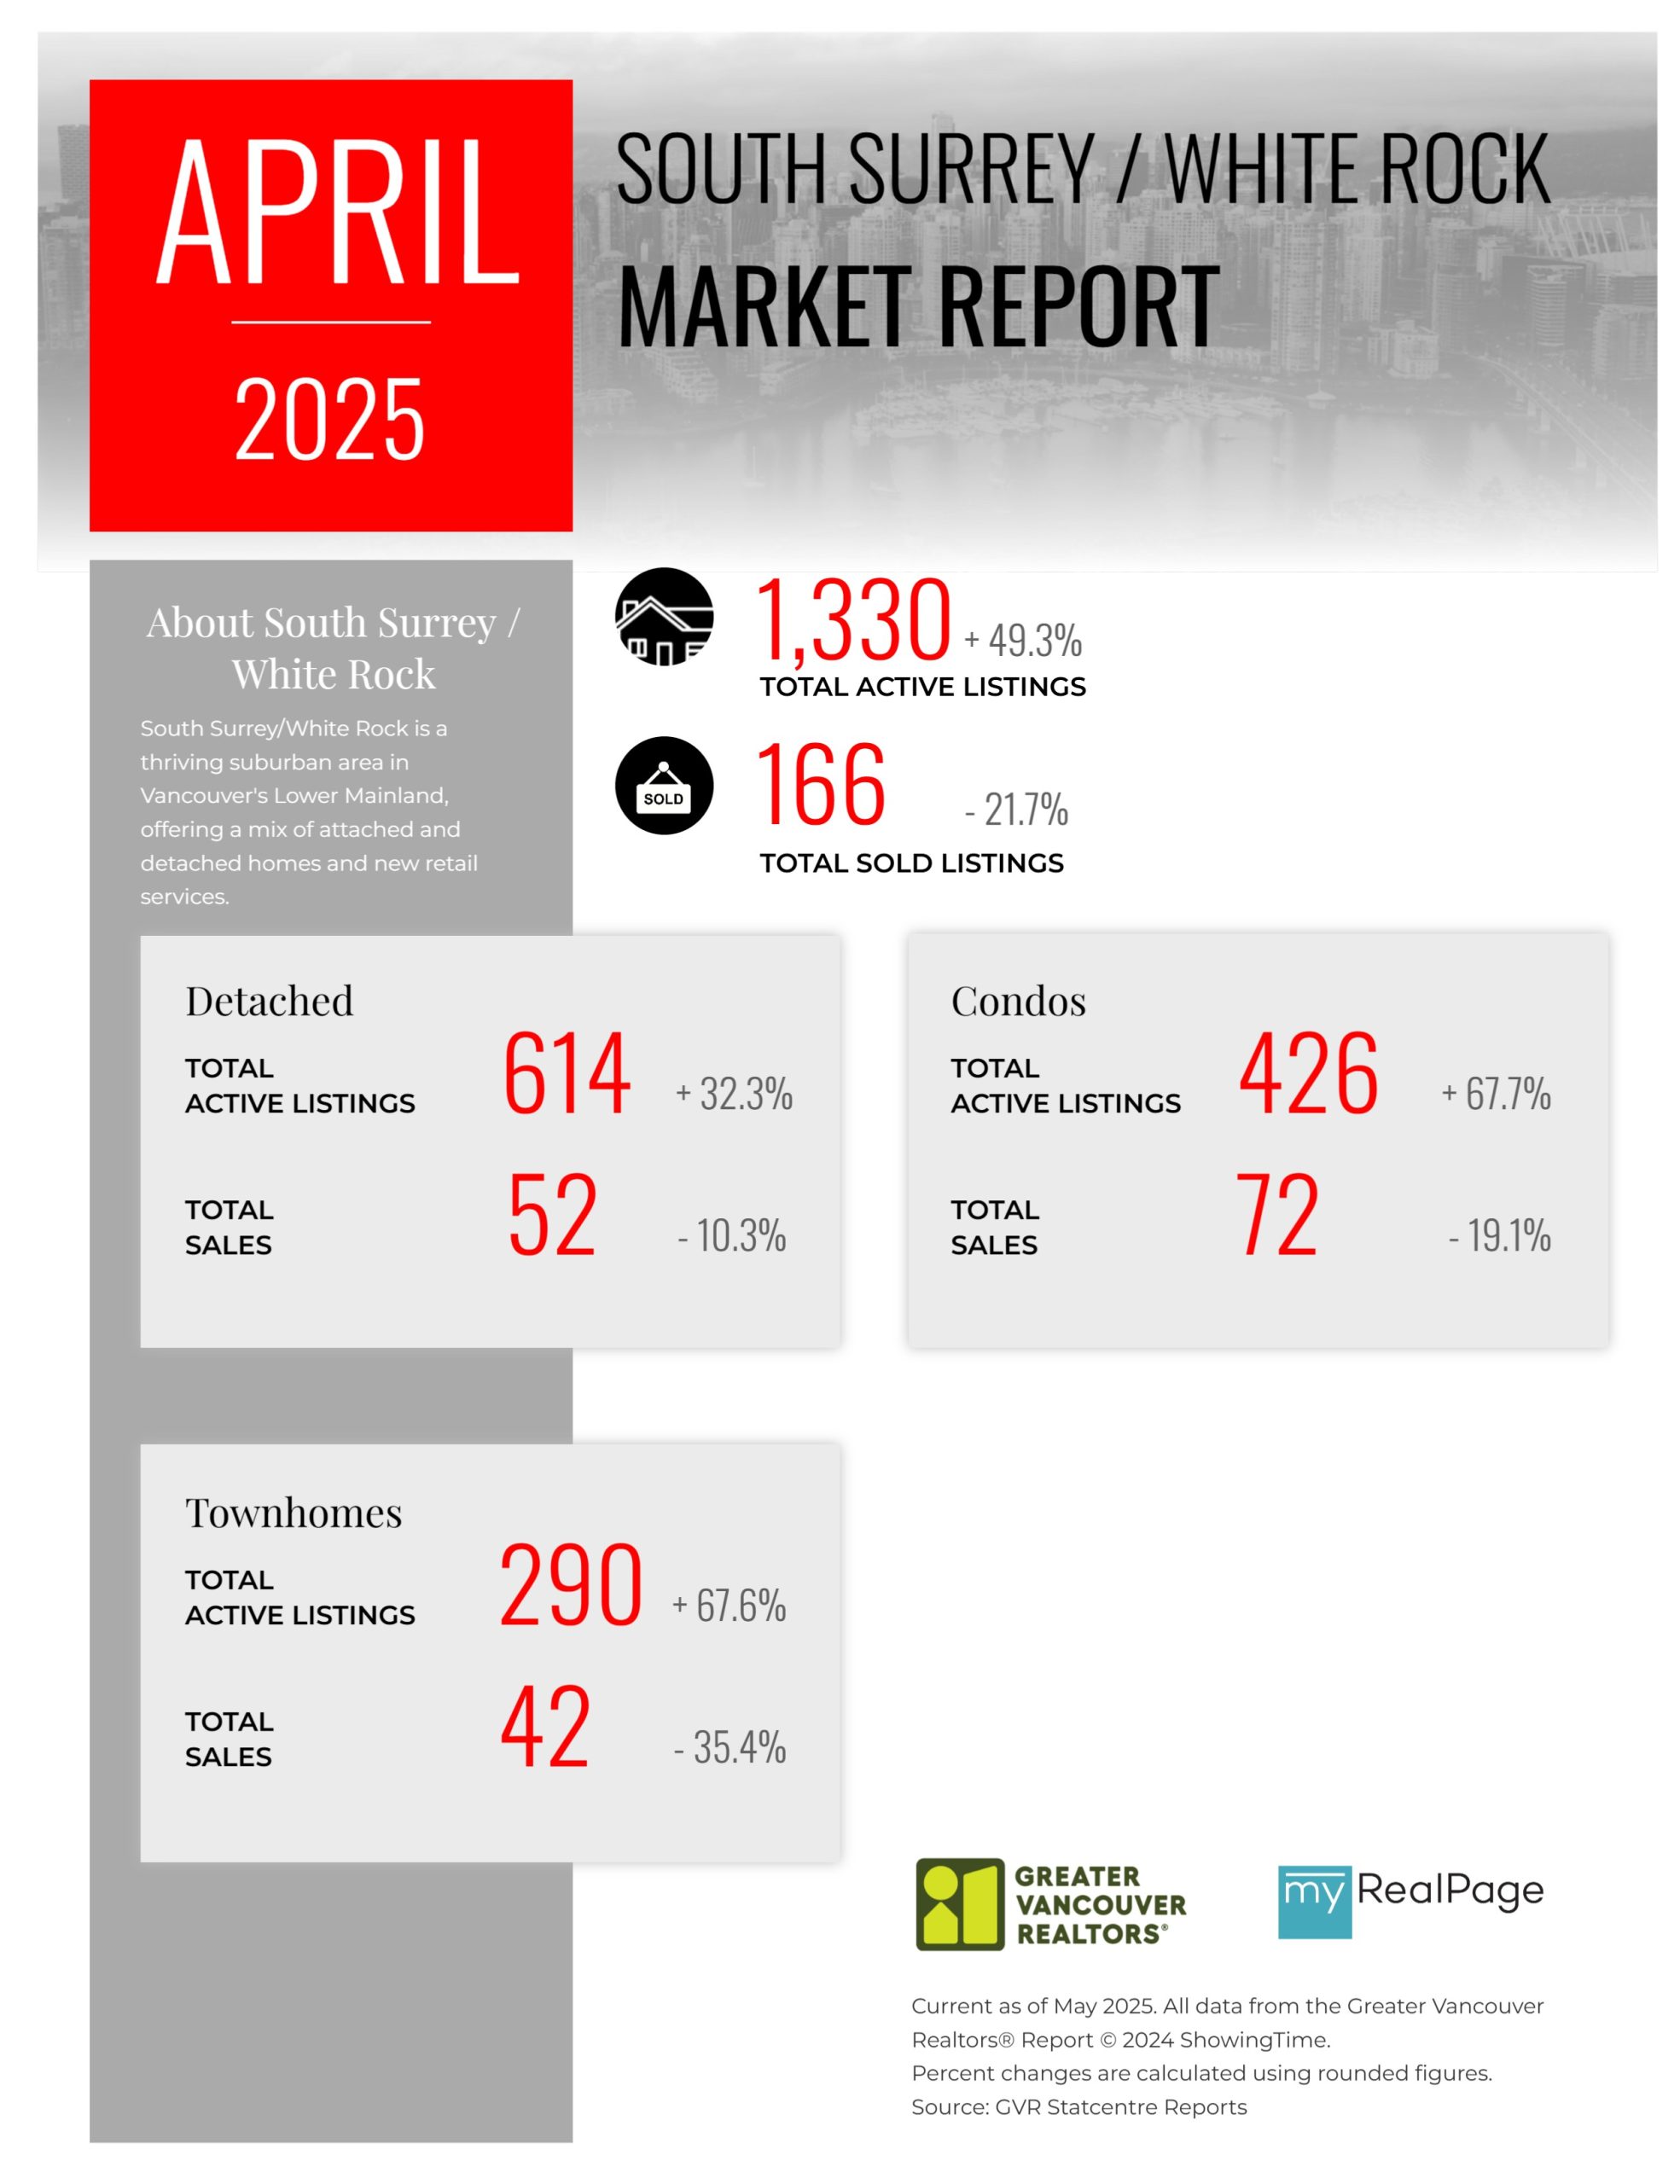
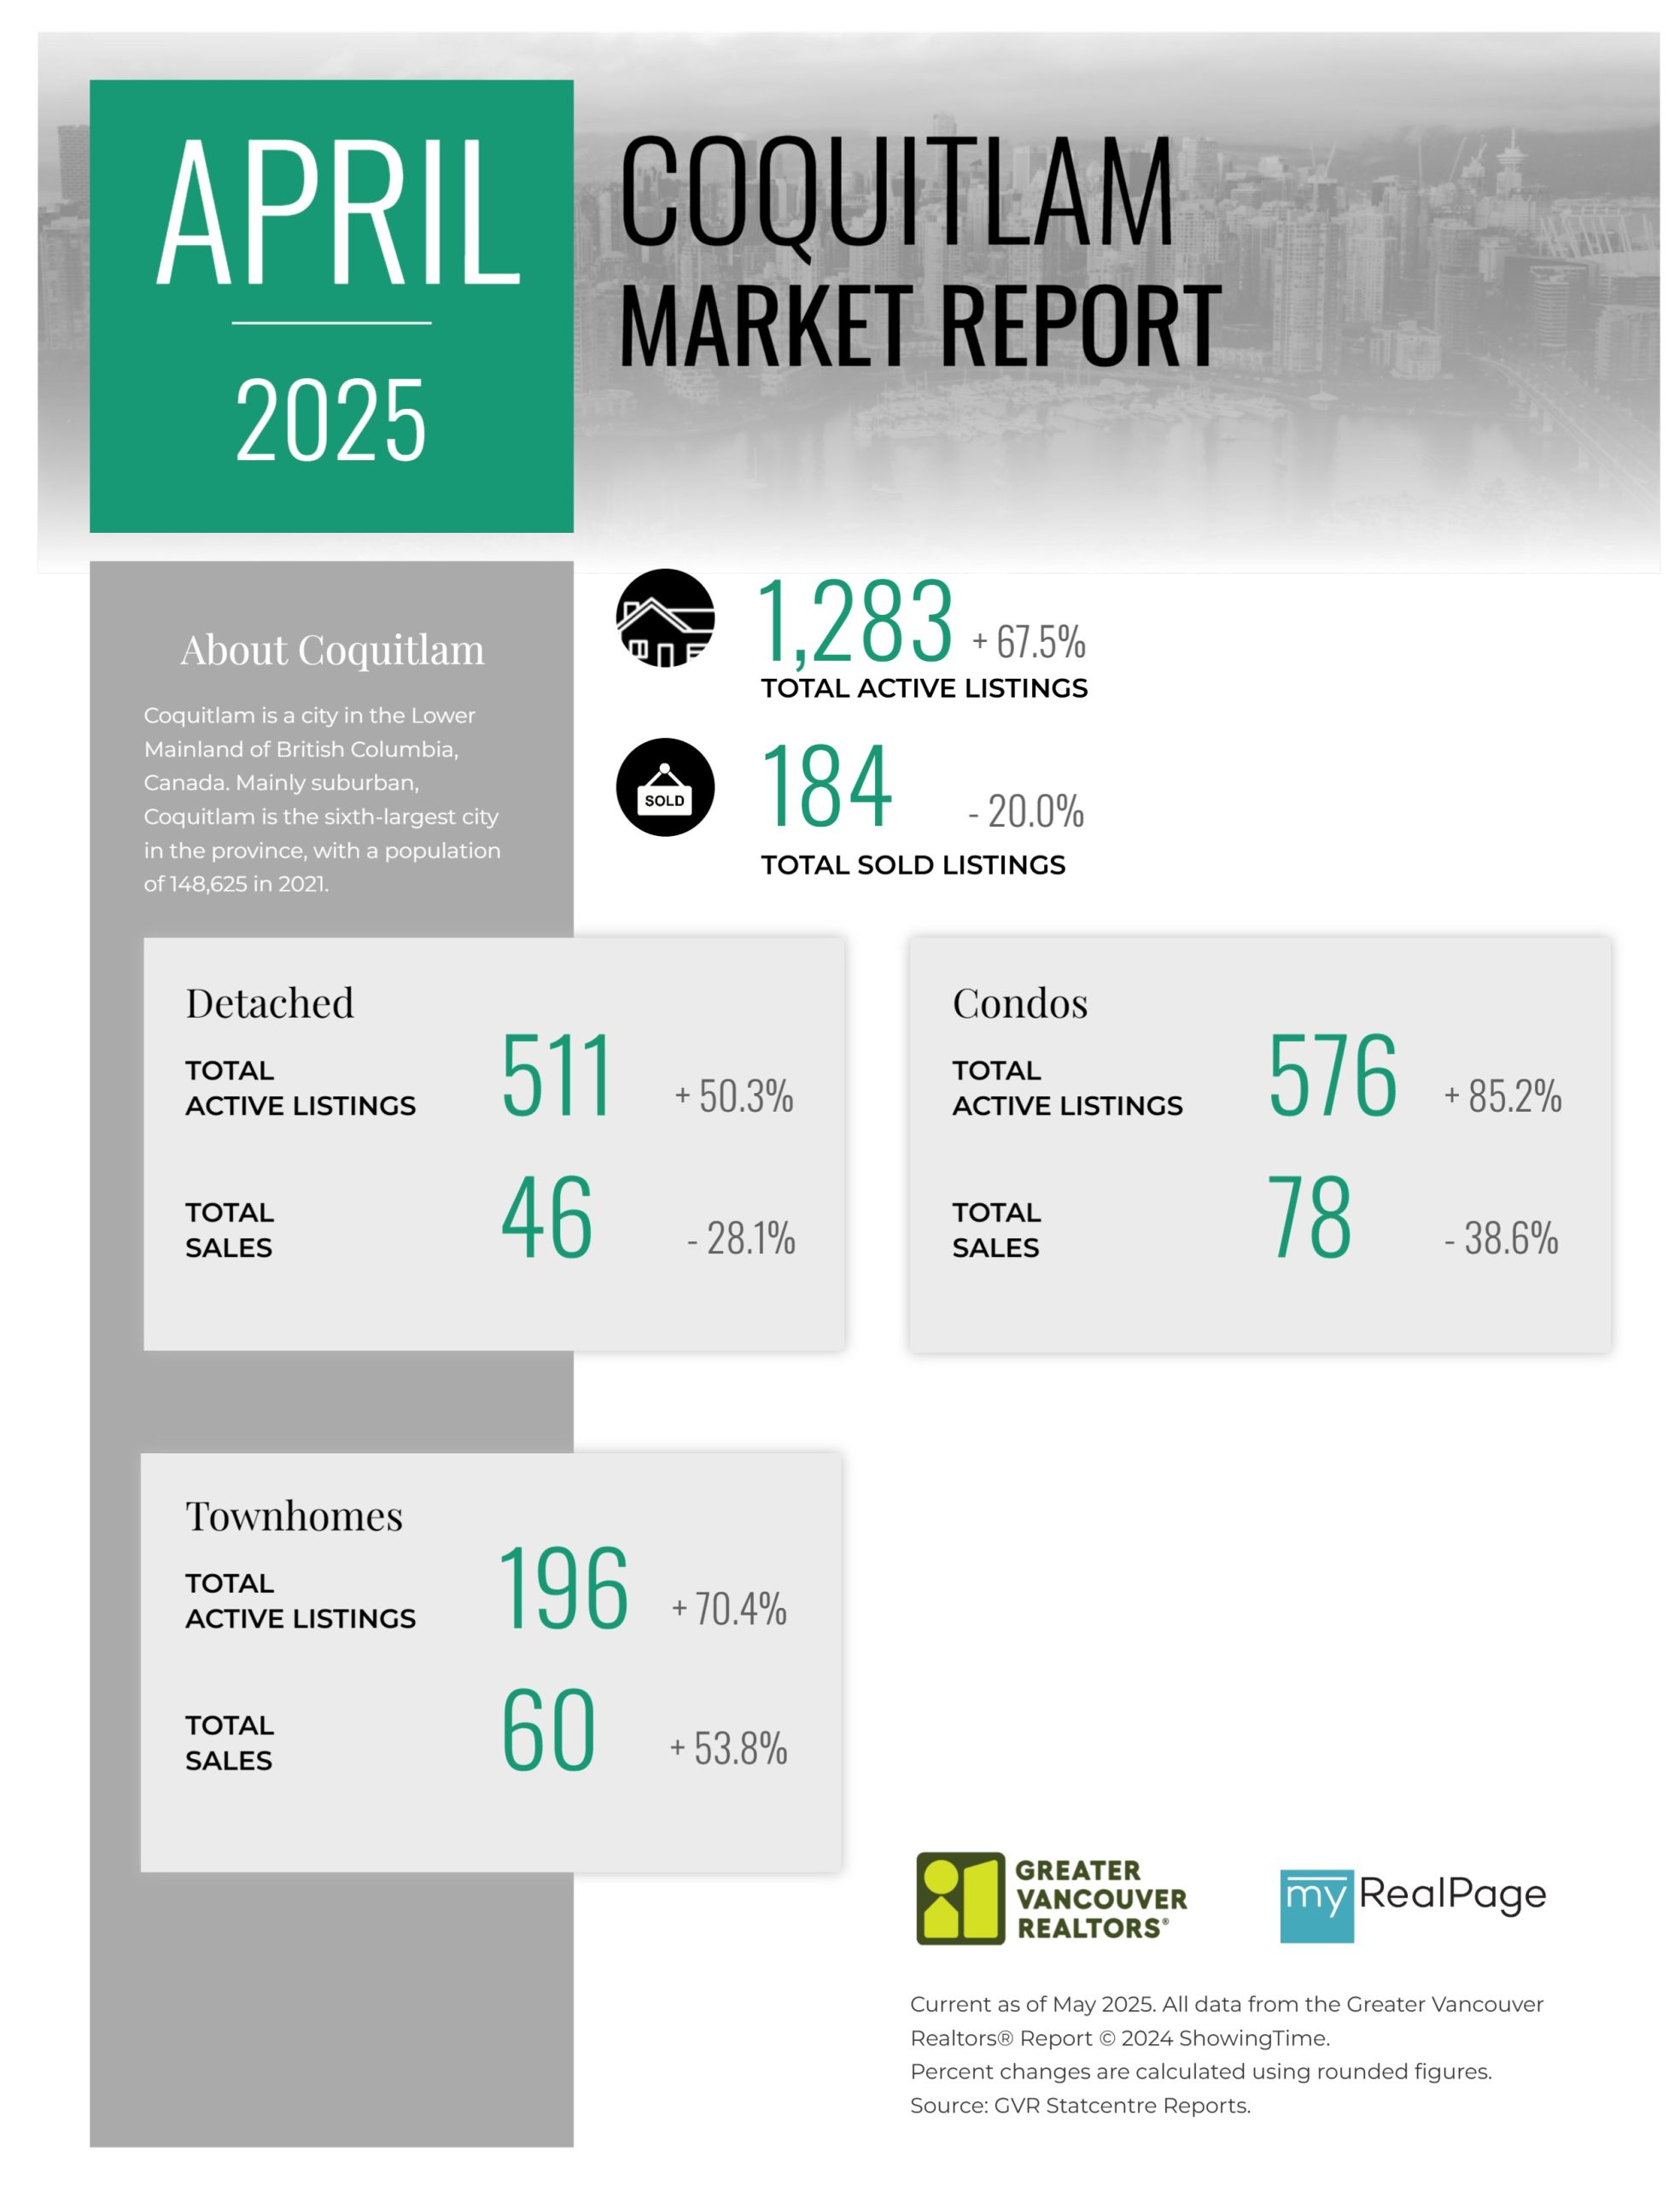
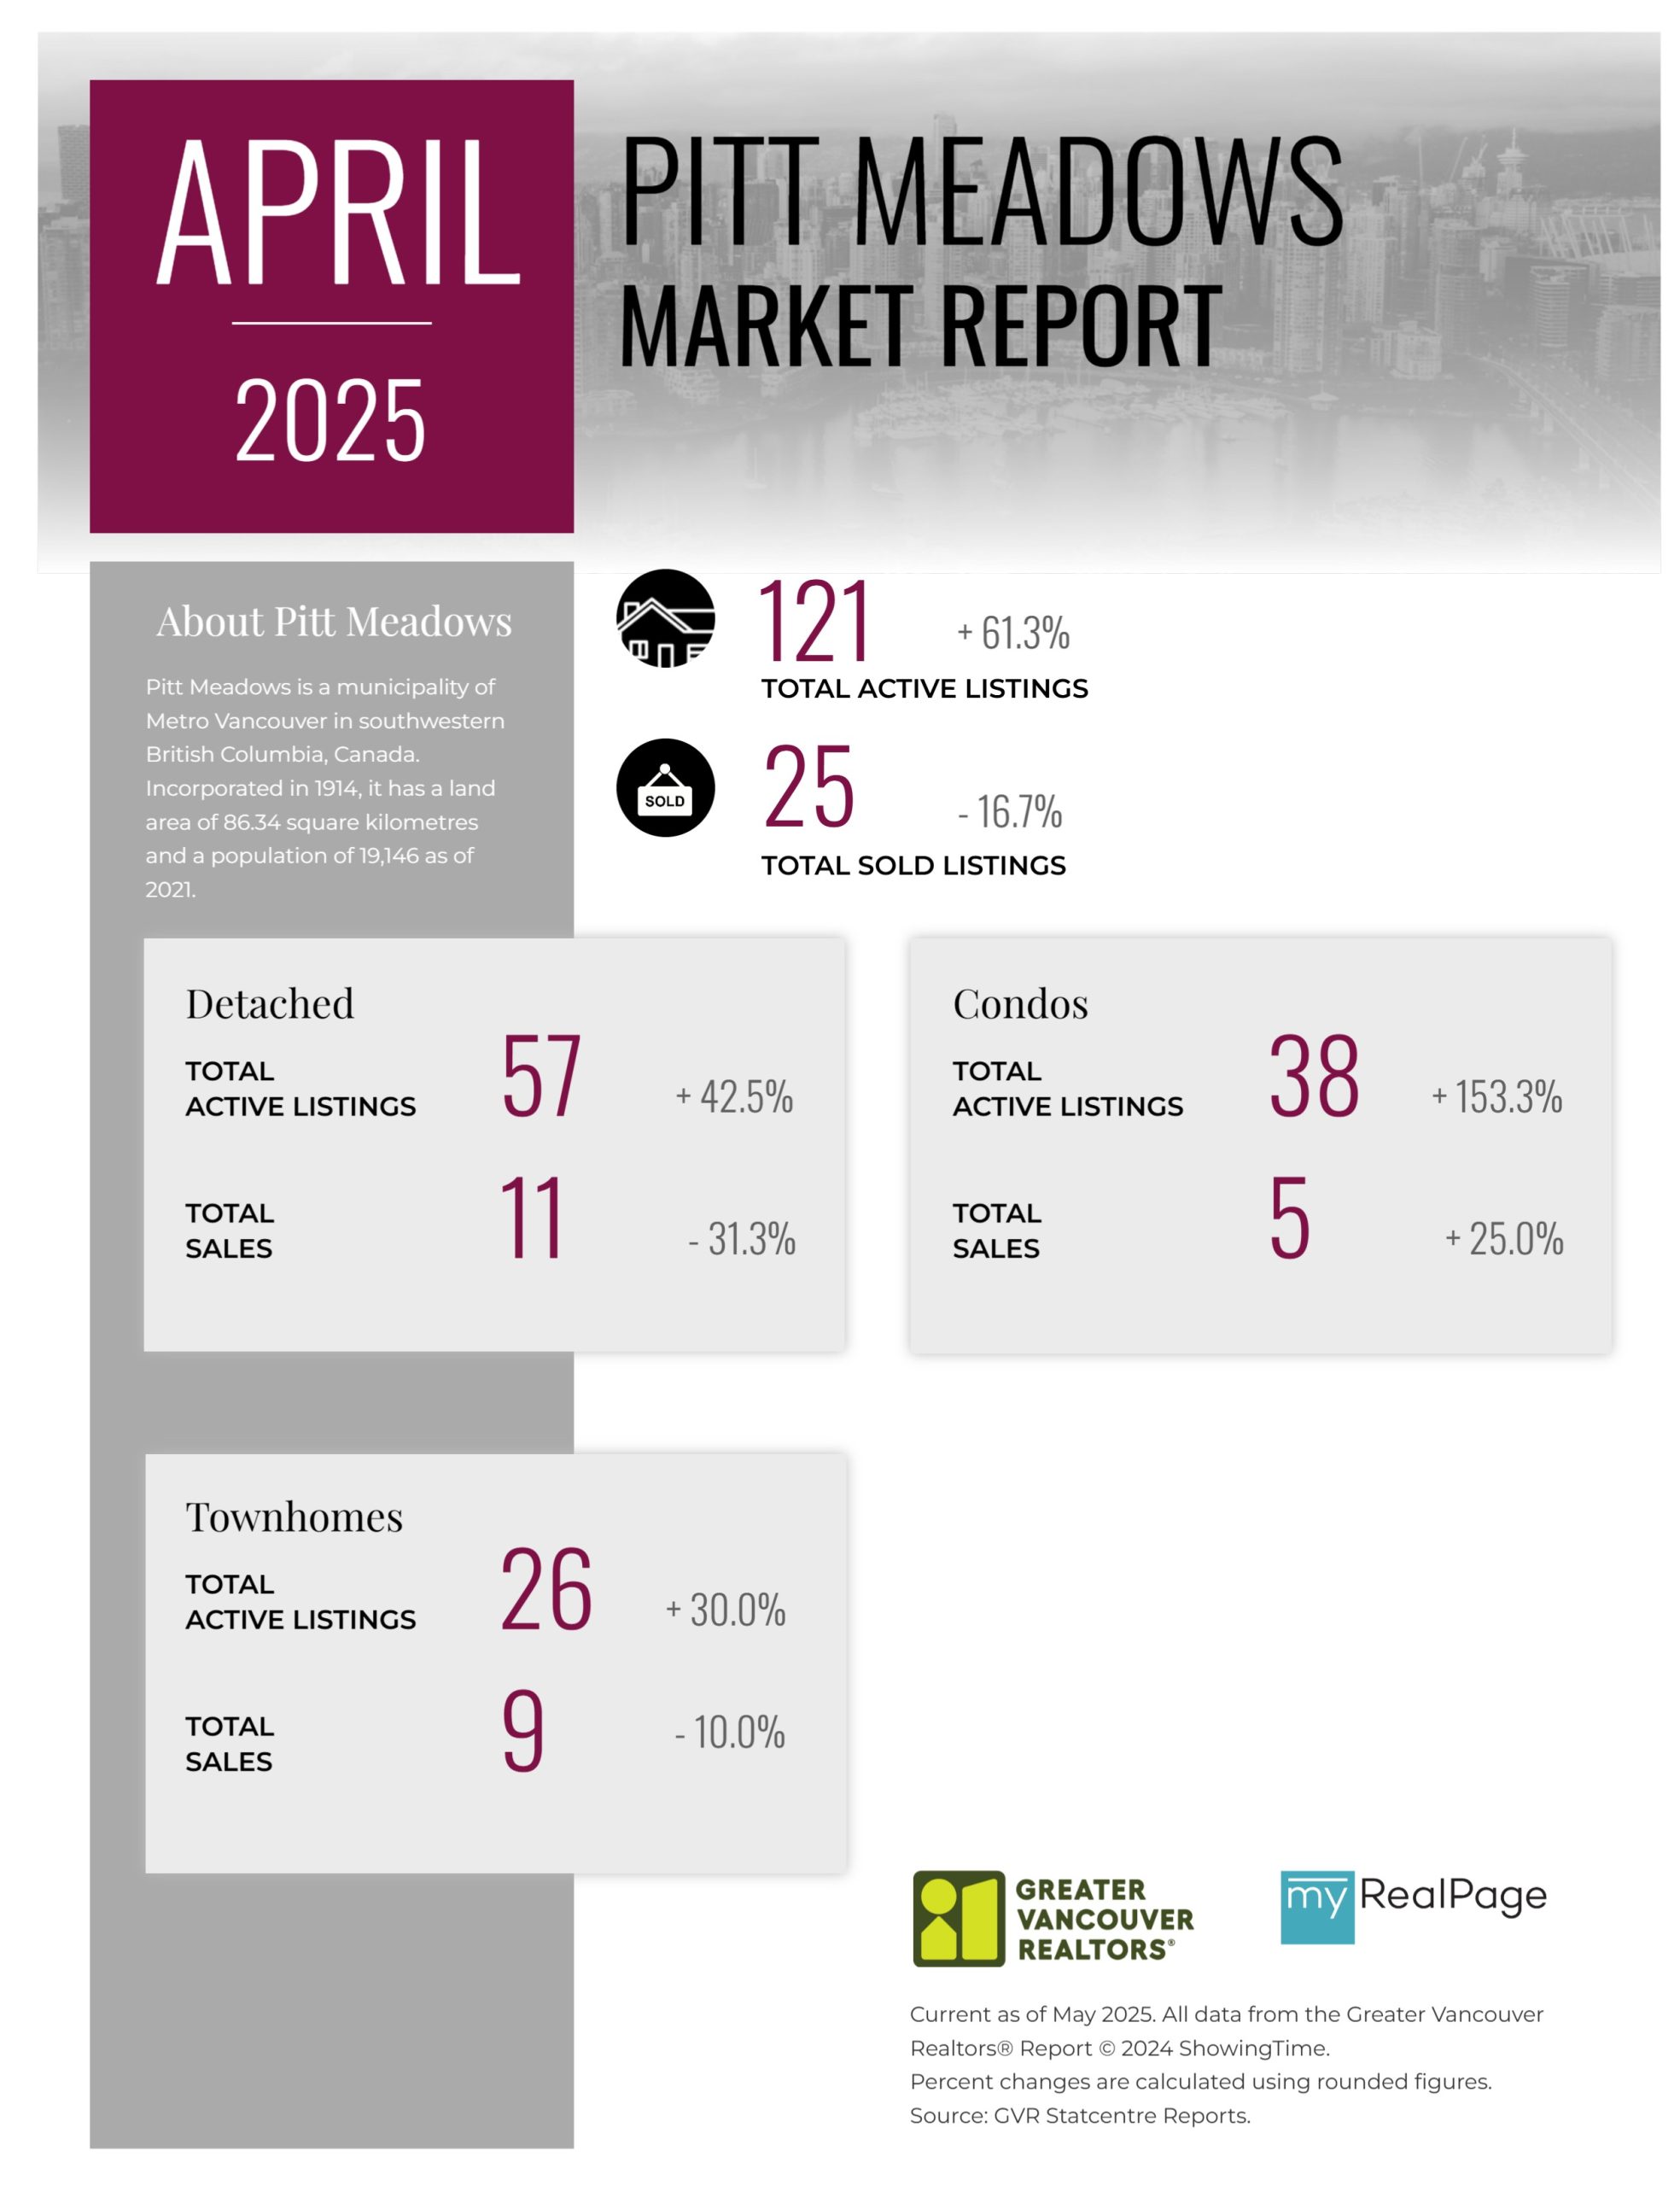
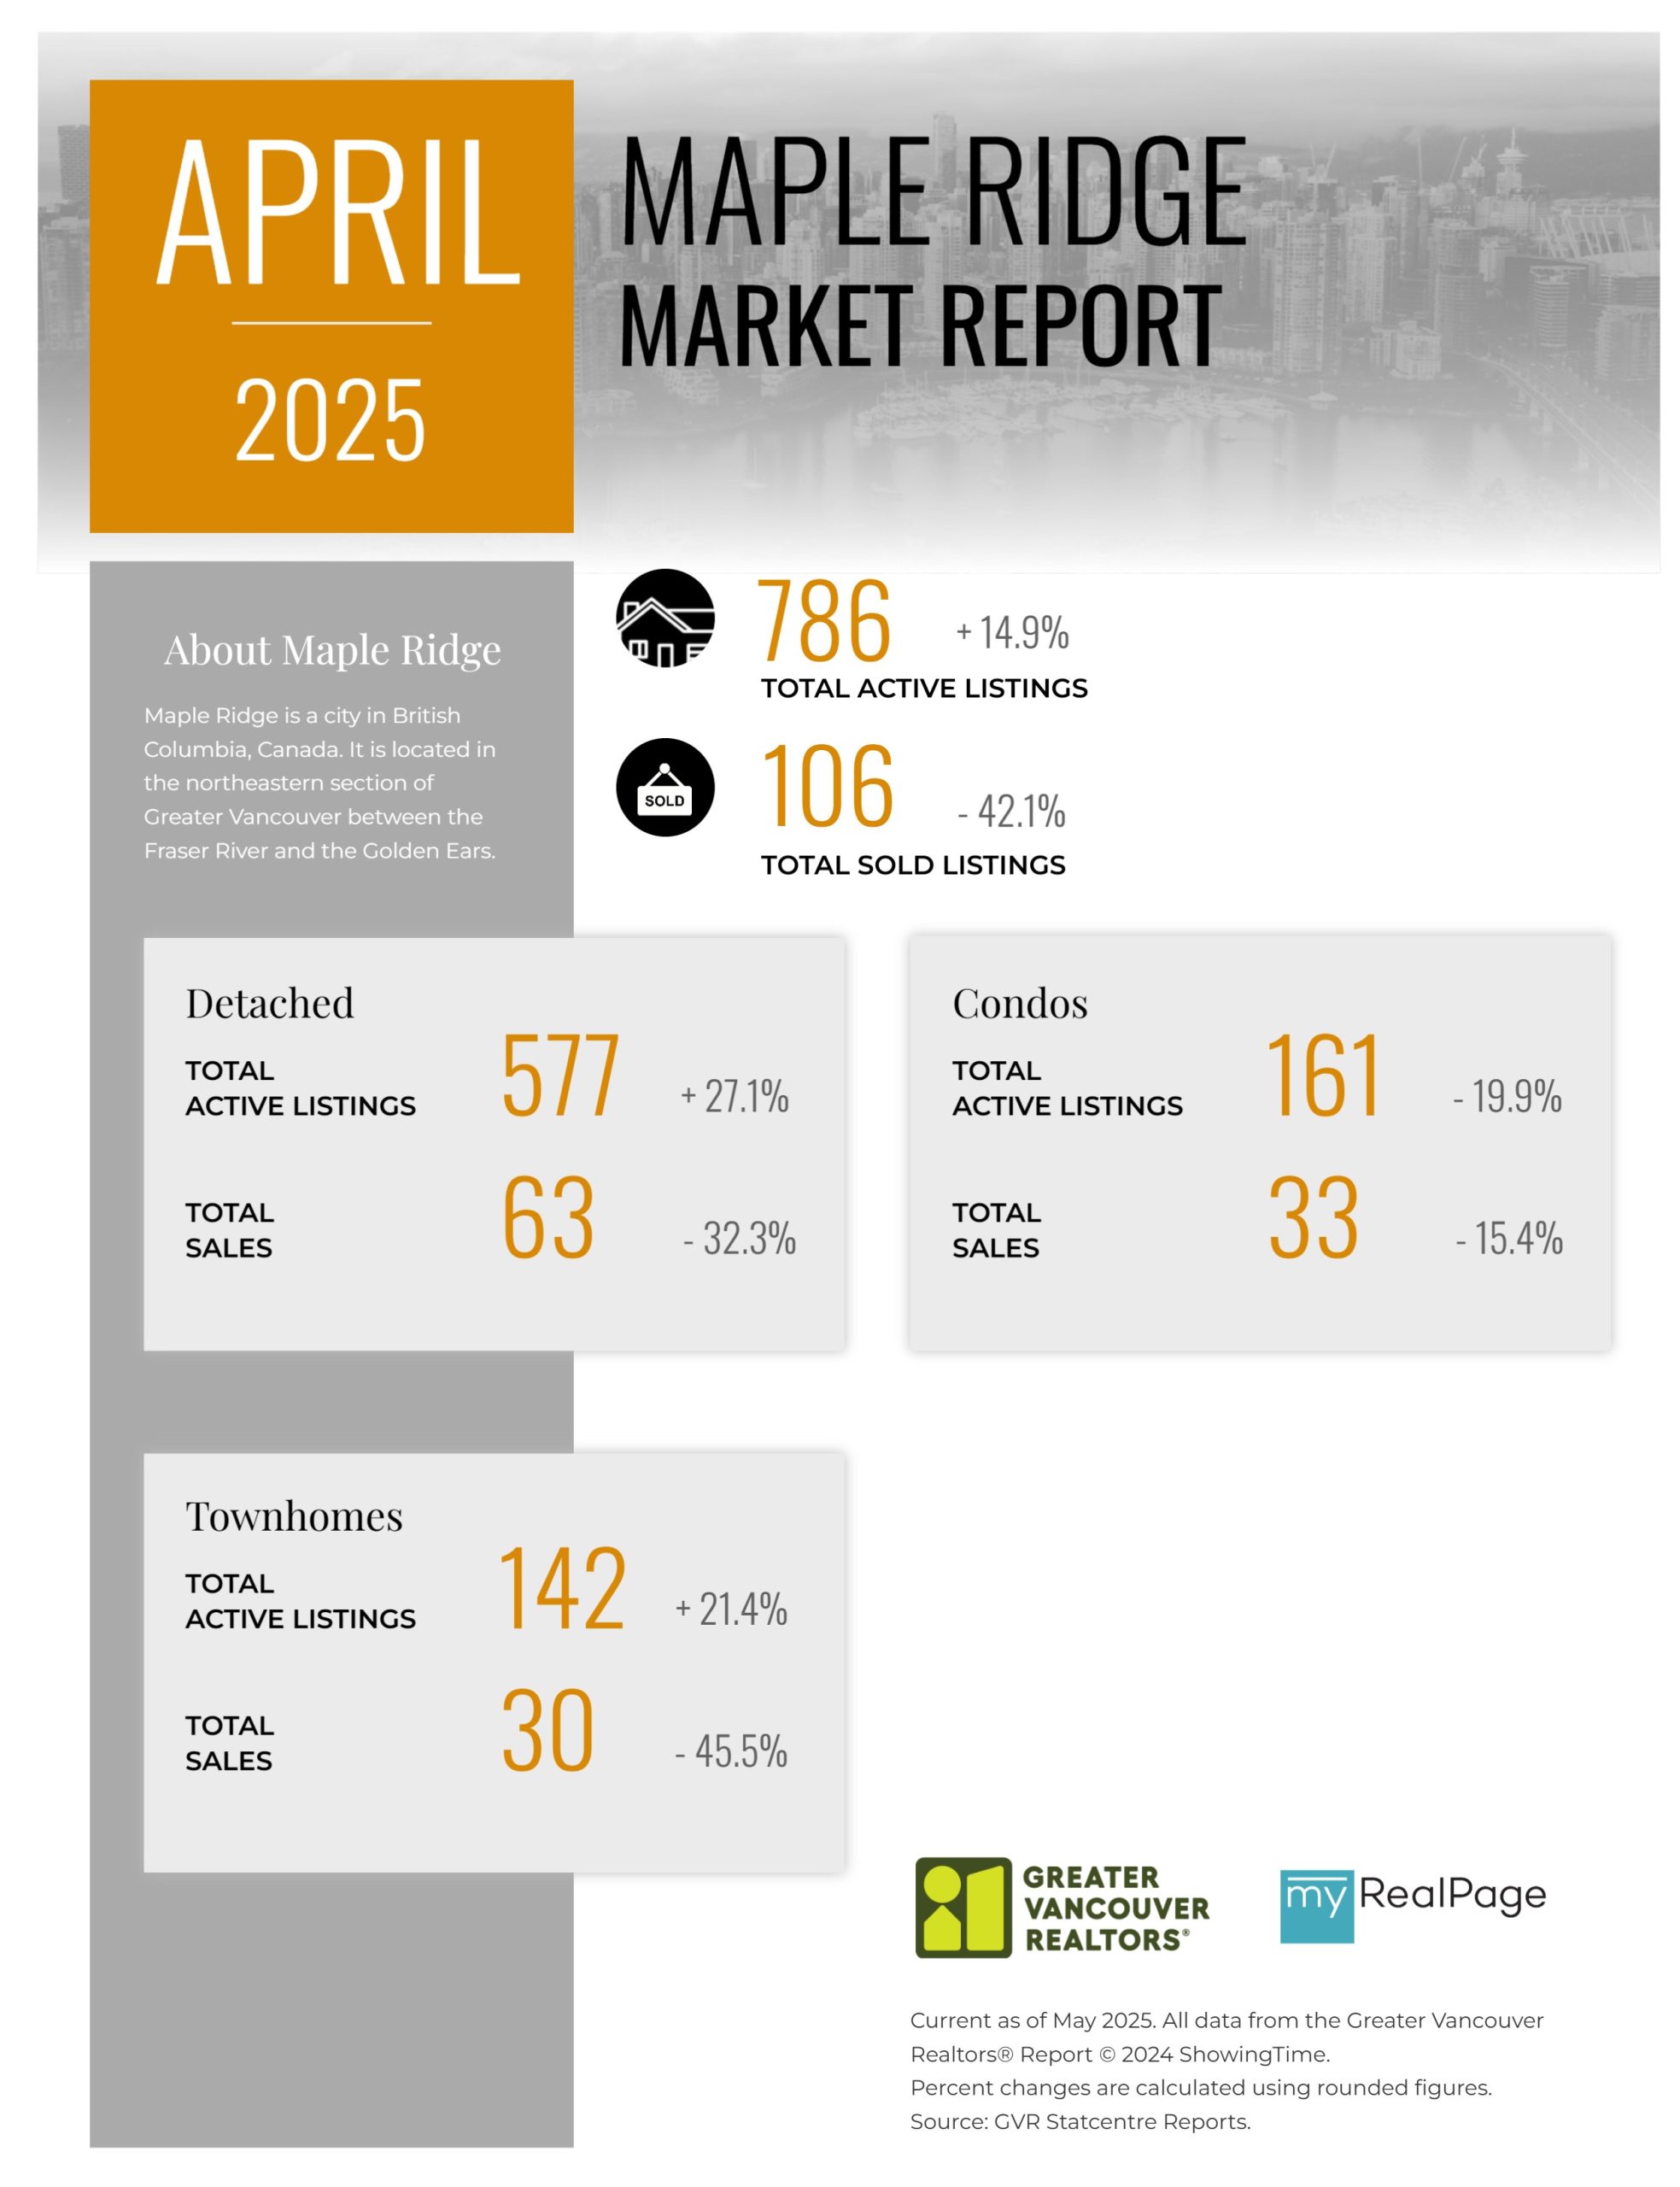
The following data is a comparison between April 2025 and April 2024 numbers, and is current as of May of 2025. For last month’s update, you can check out our previous post!
Or follow this link for all our GVR Infographics!
These infographics cover current trends in several areas within the Greater Vancouver region. Click on the images for a larger view!
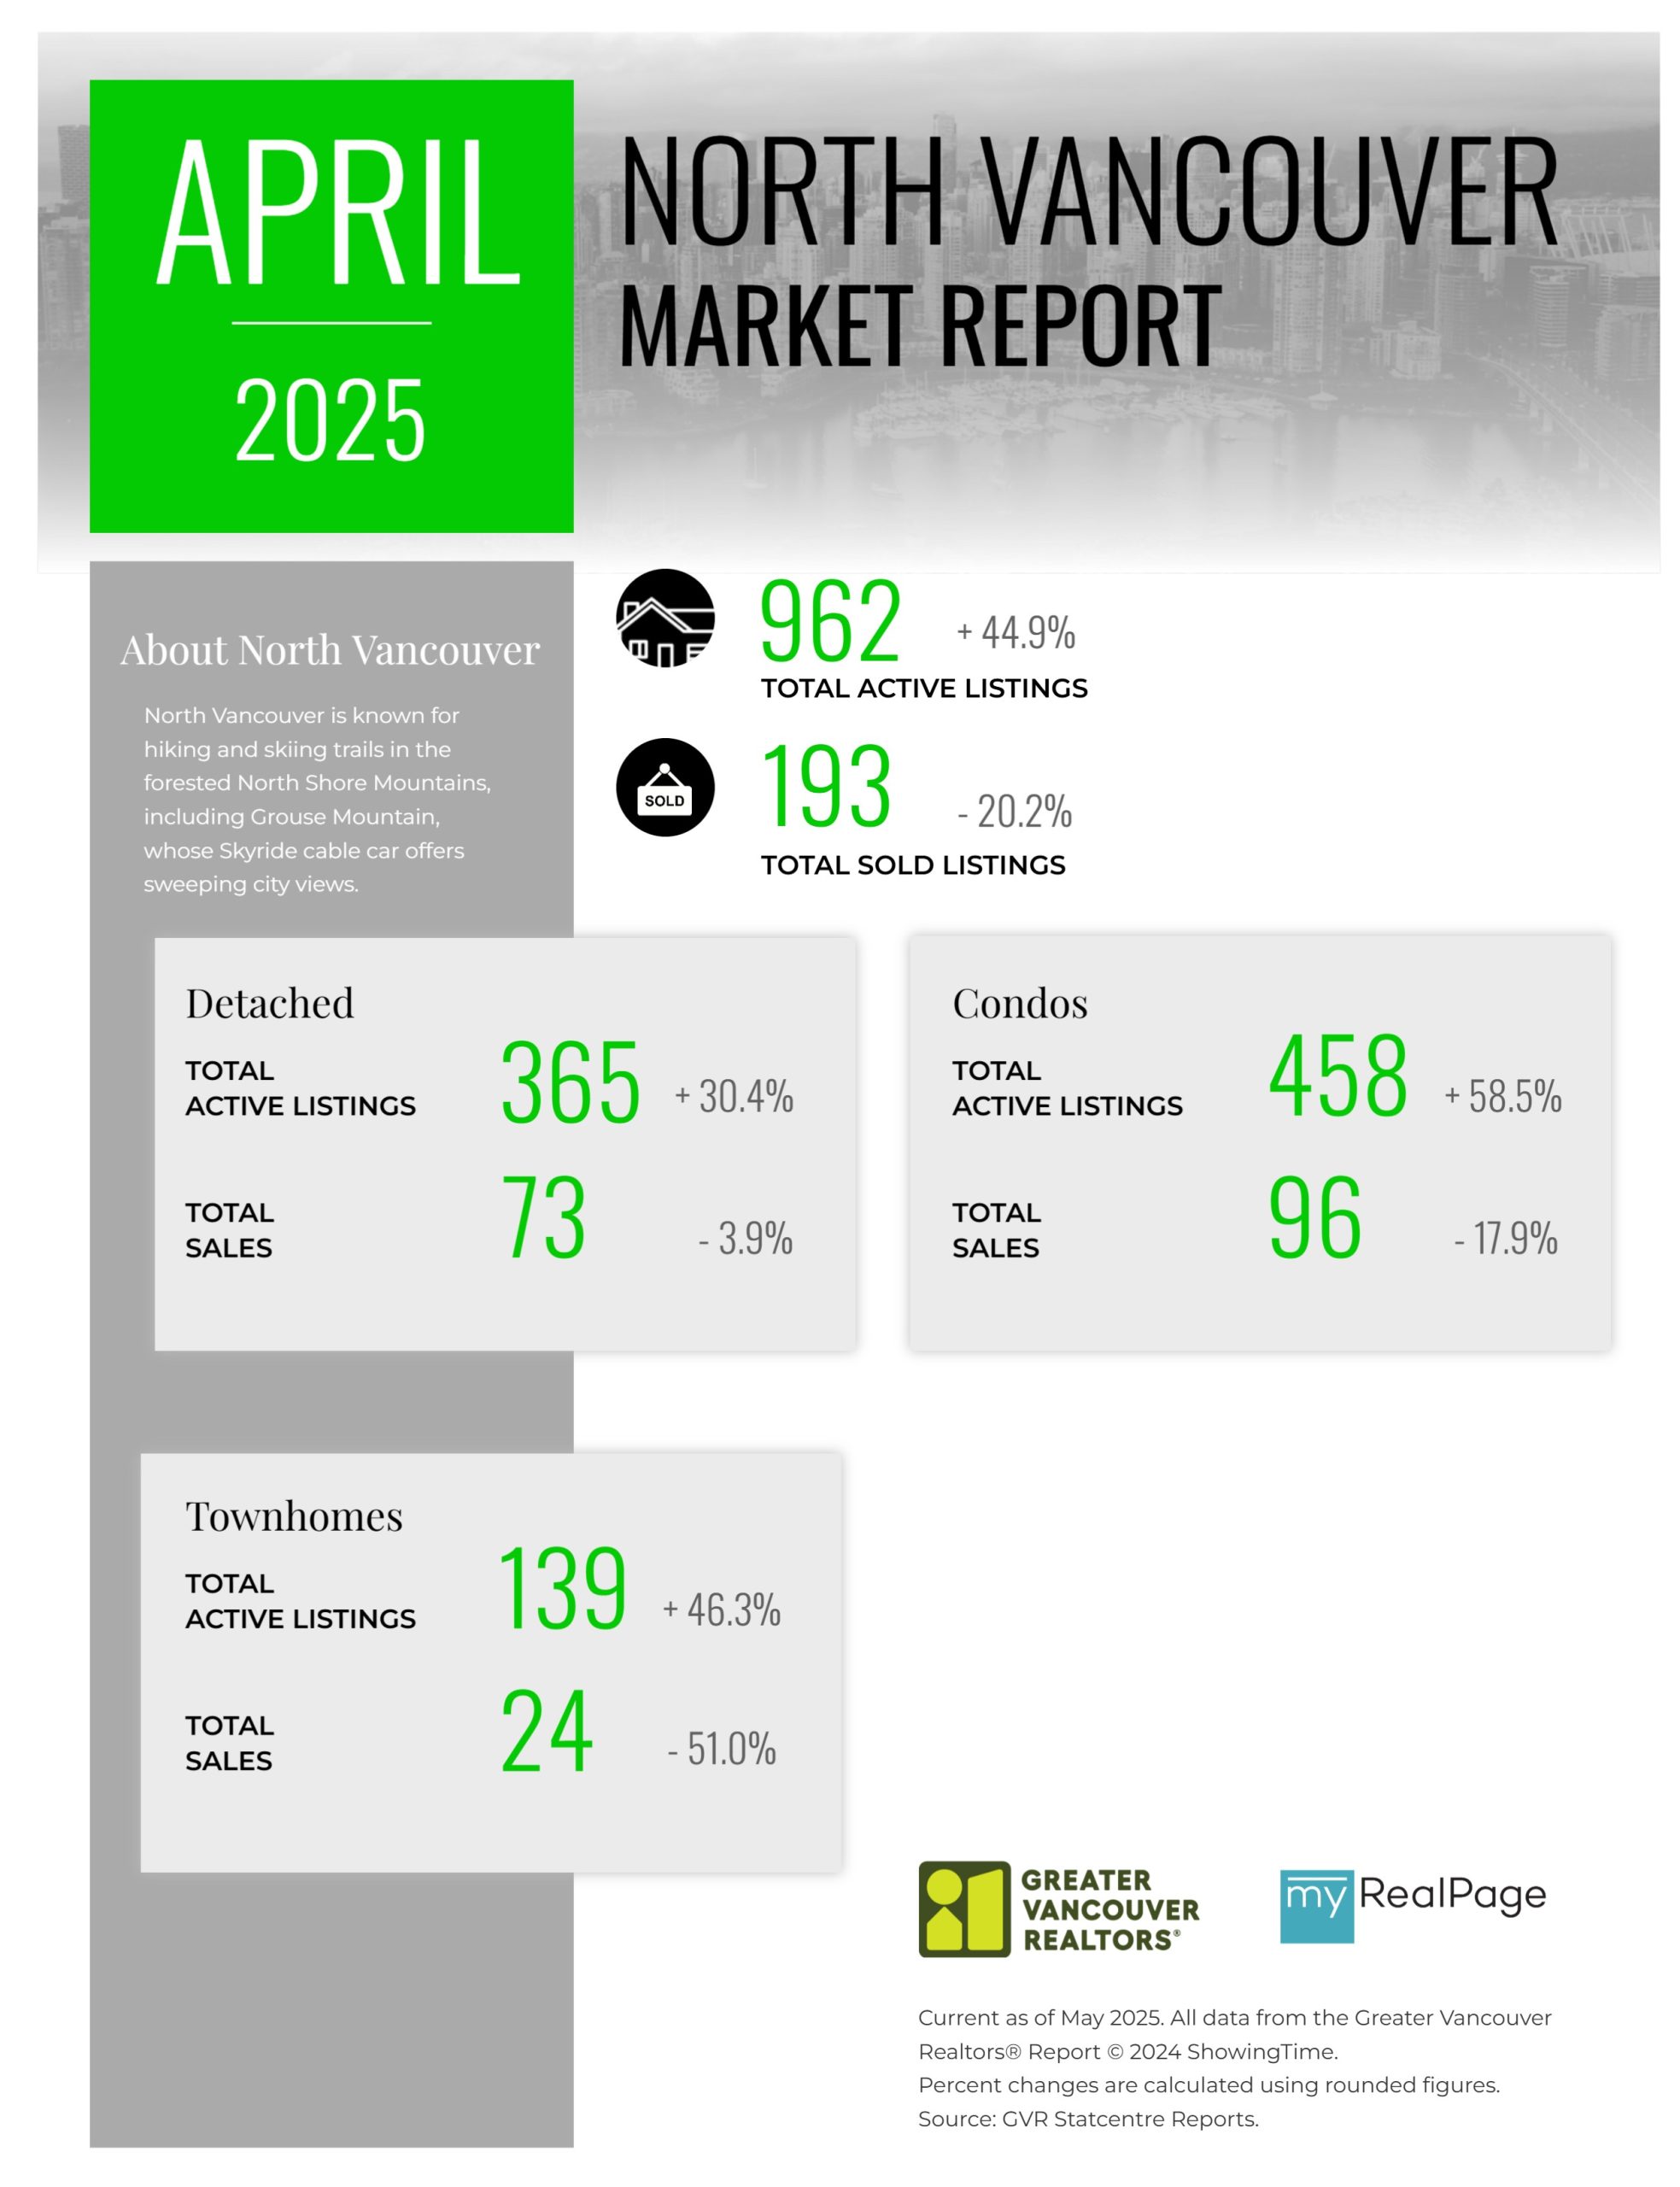
Printable Version – GVR April 2025 Data Infographic Report North Vancouver
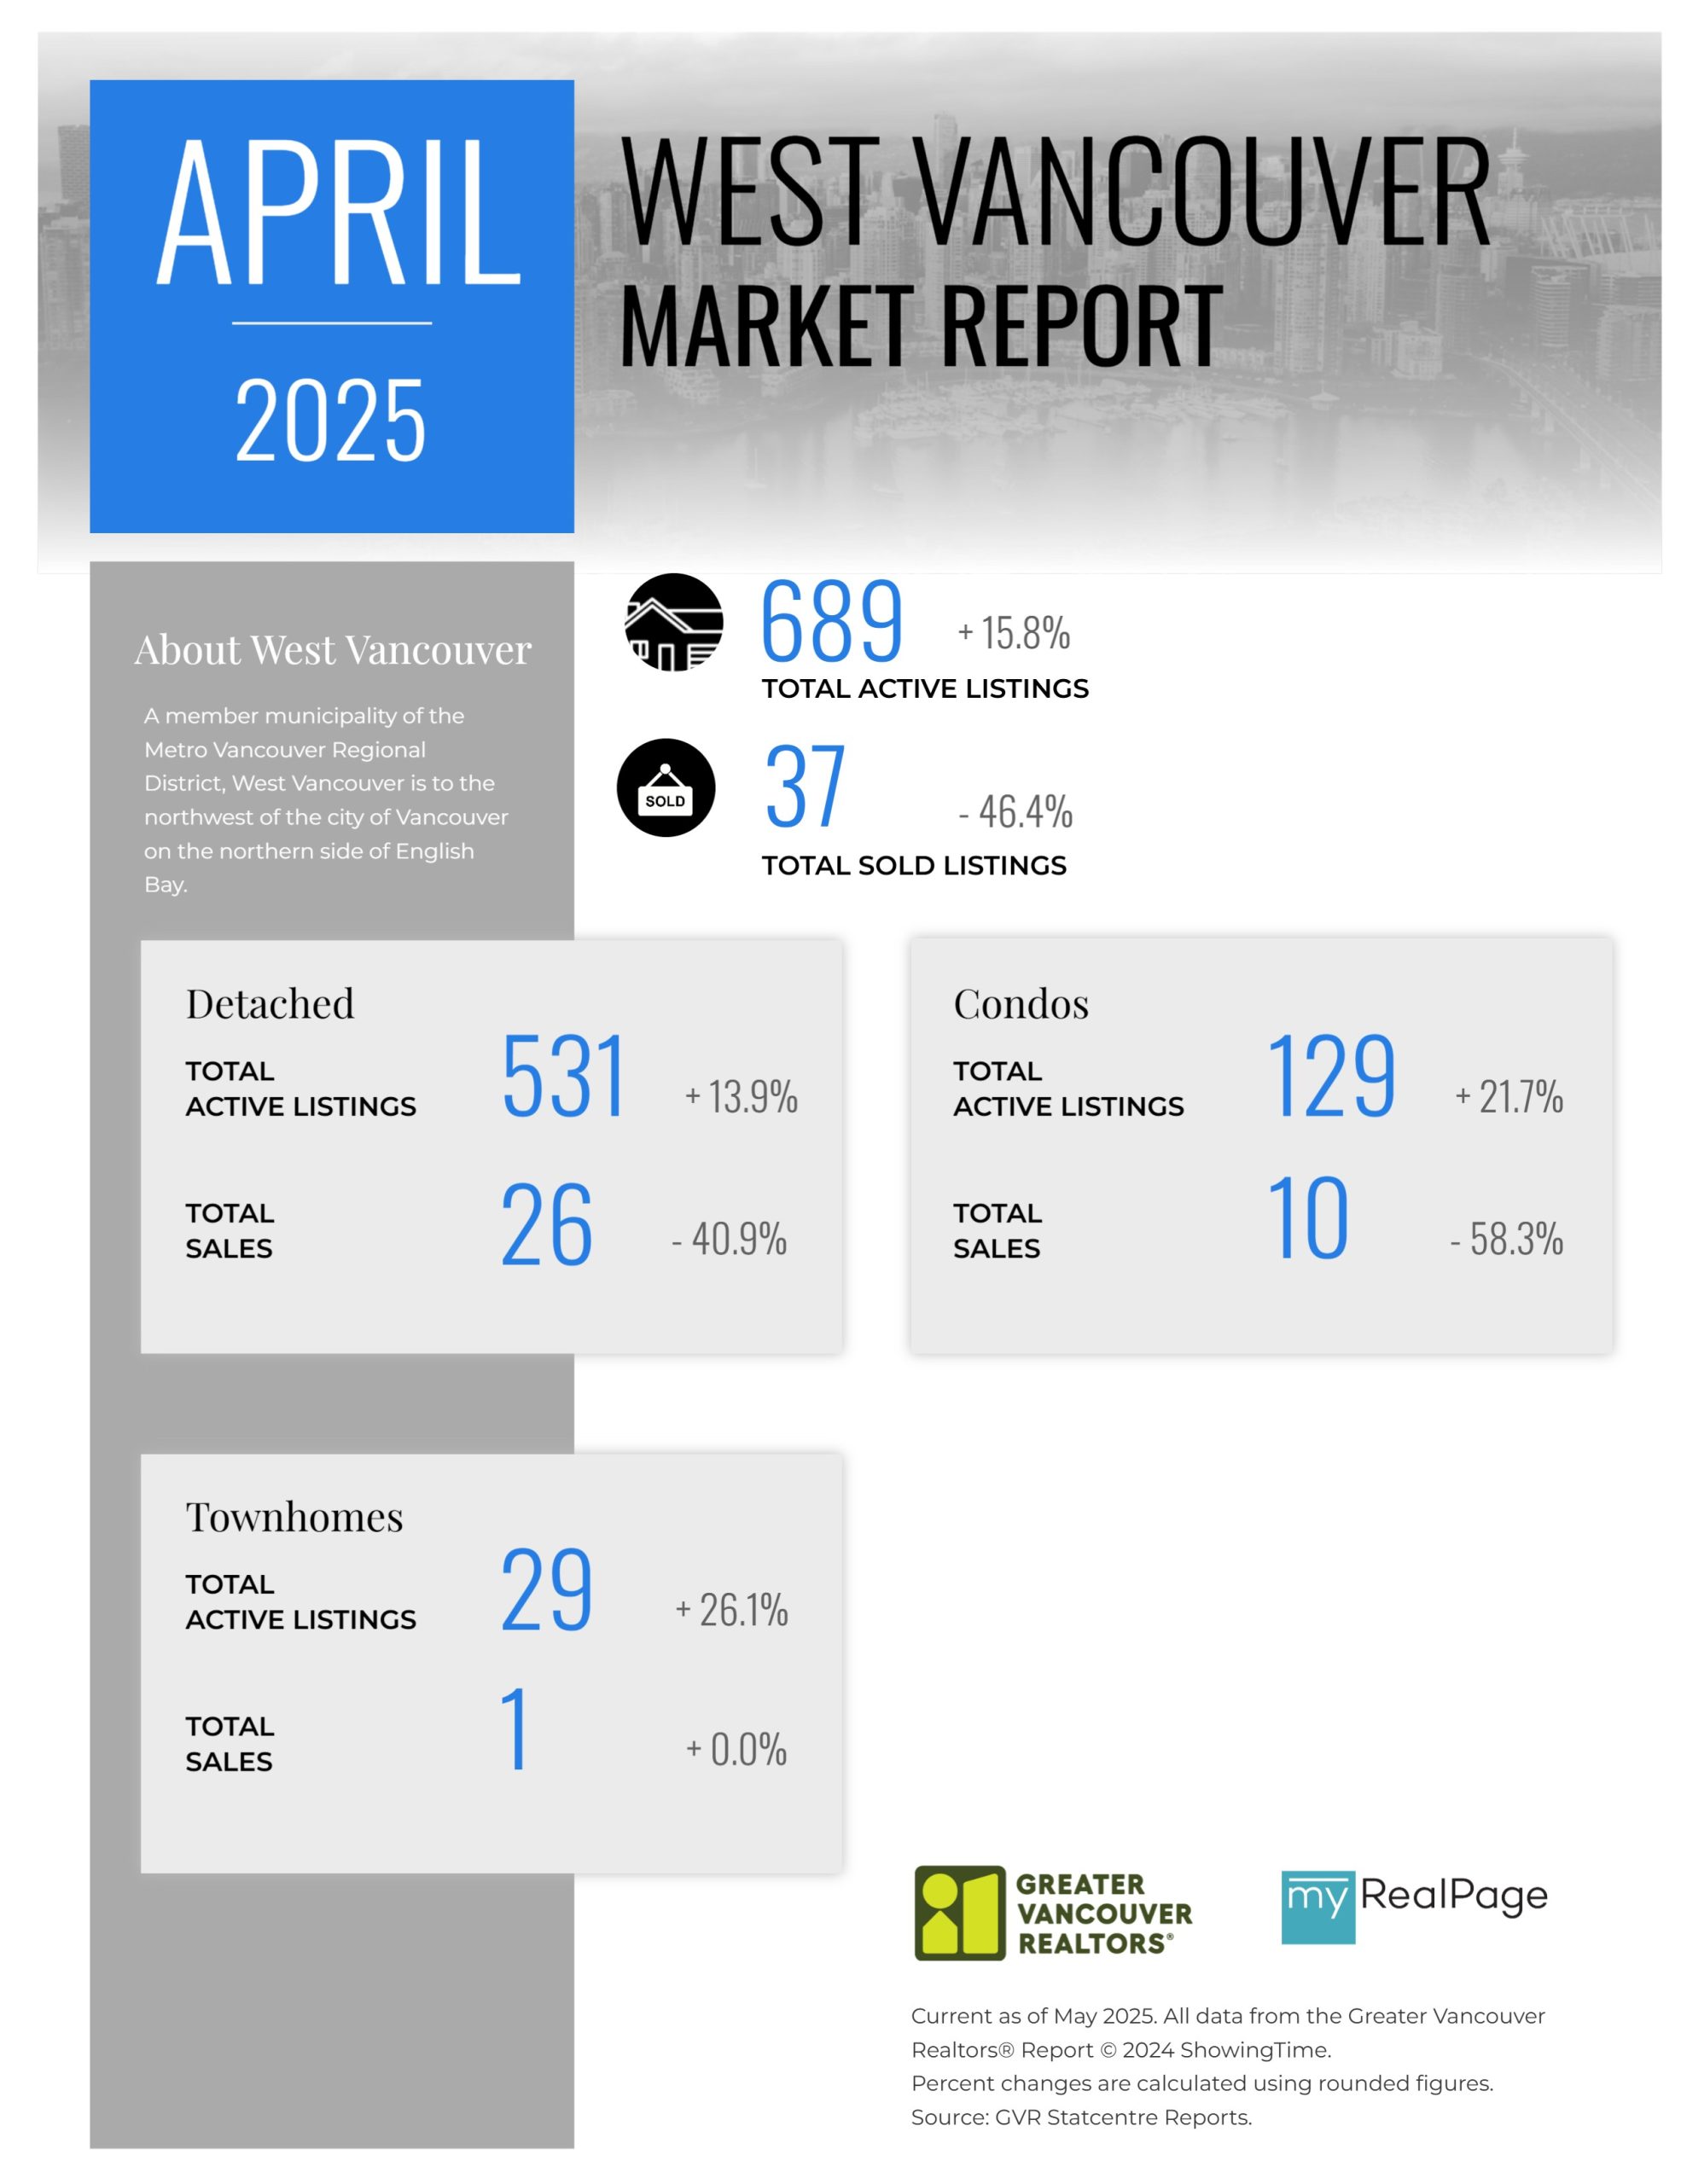
Printable Version – GVR April 2025 Data Infographics Report West Vancouver
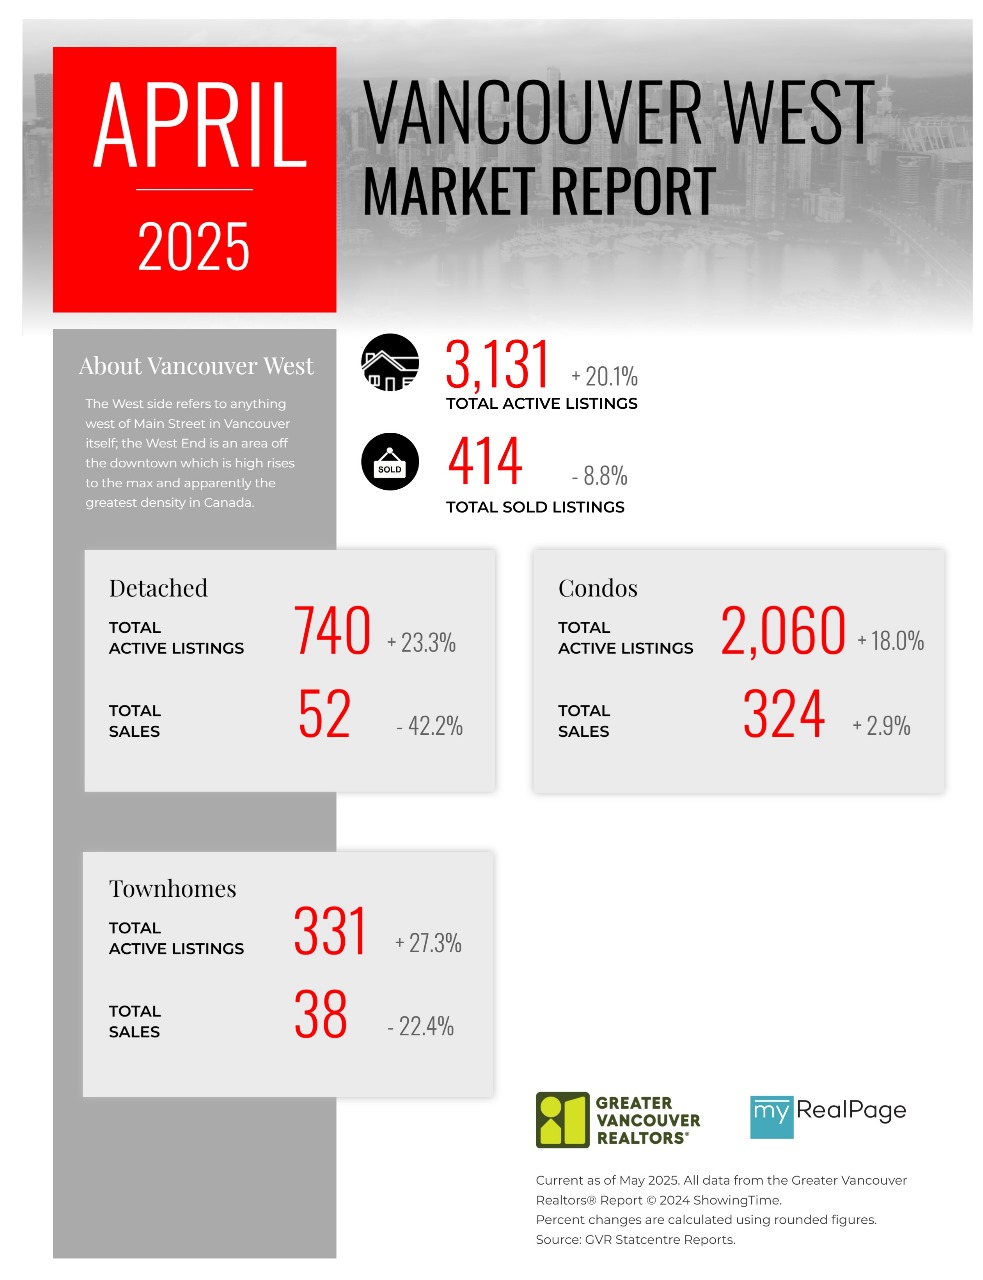
Printable Version – GVR April 2025 Data Infographics Report Vancouver West
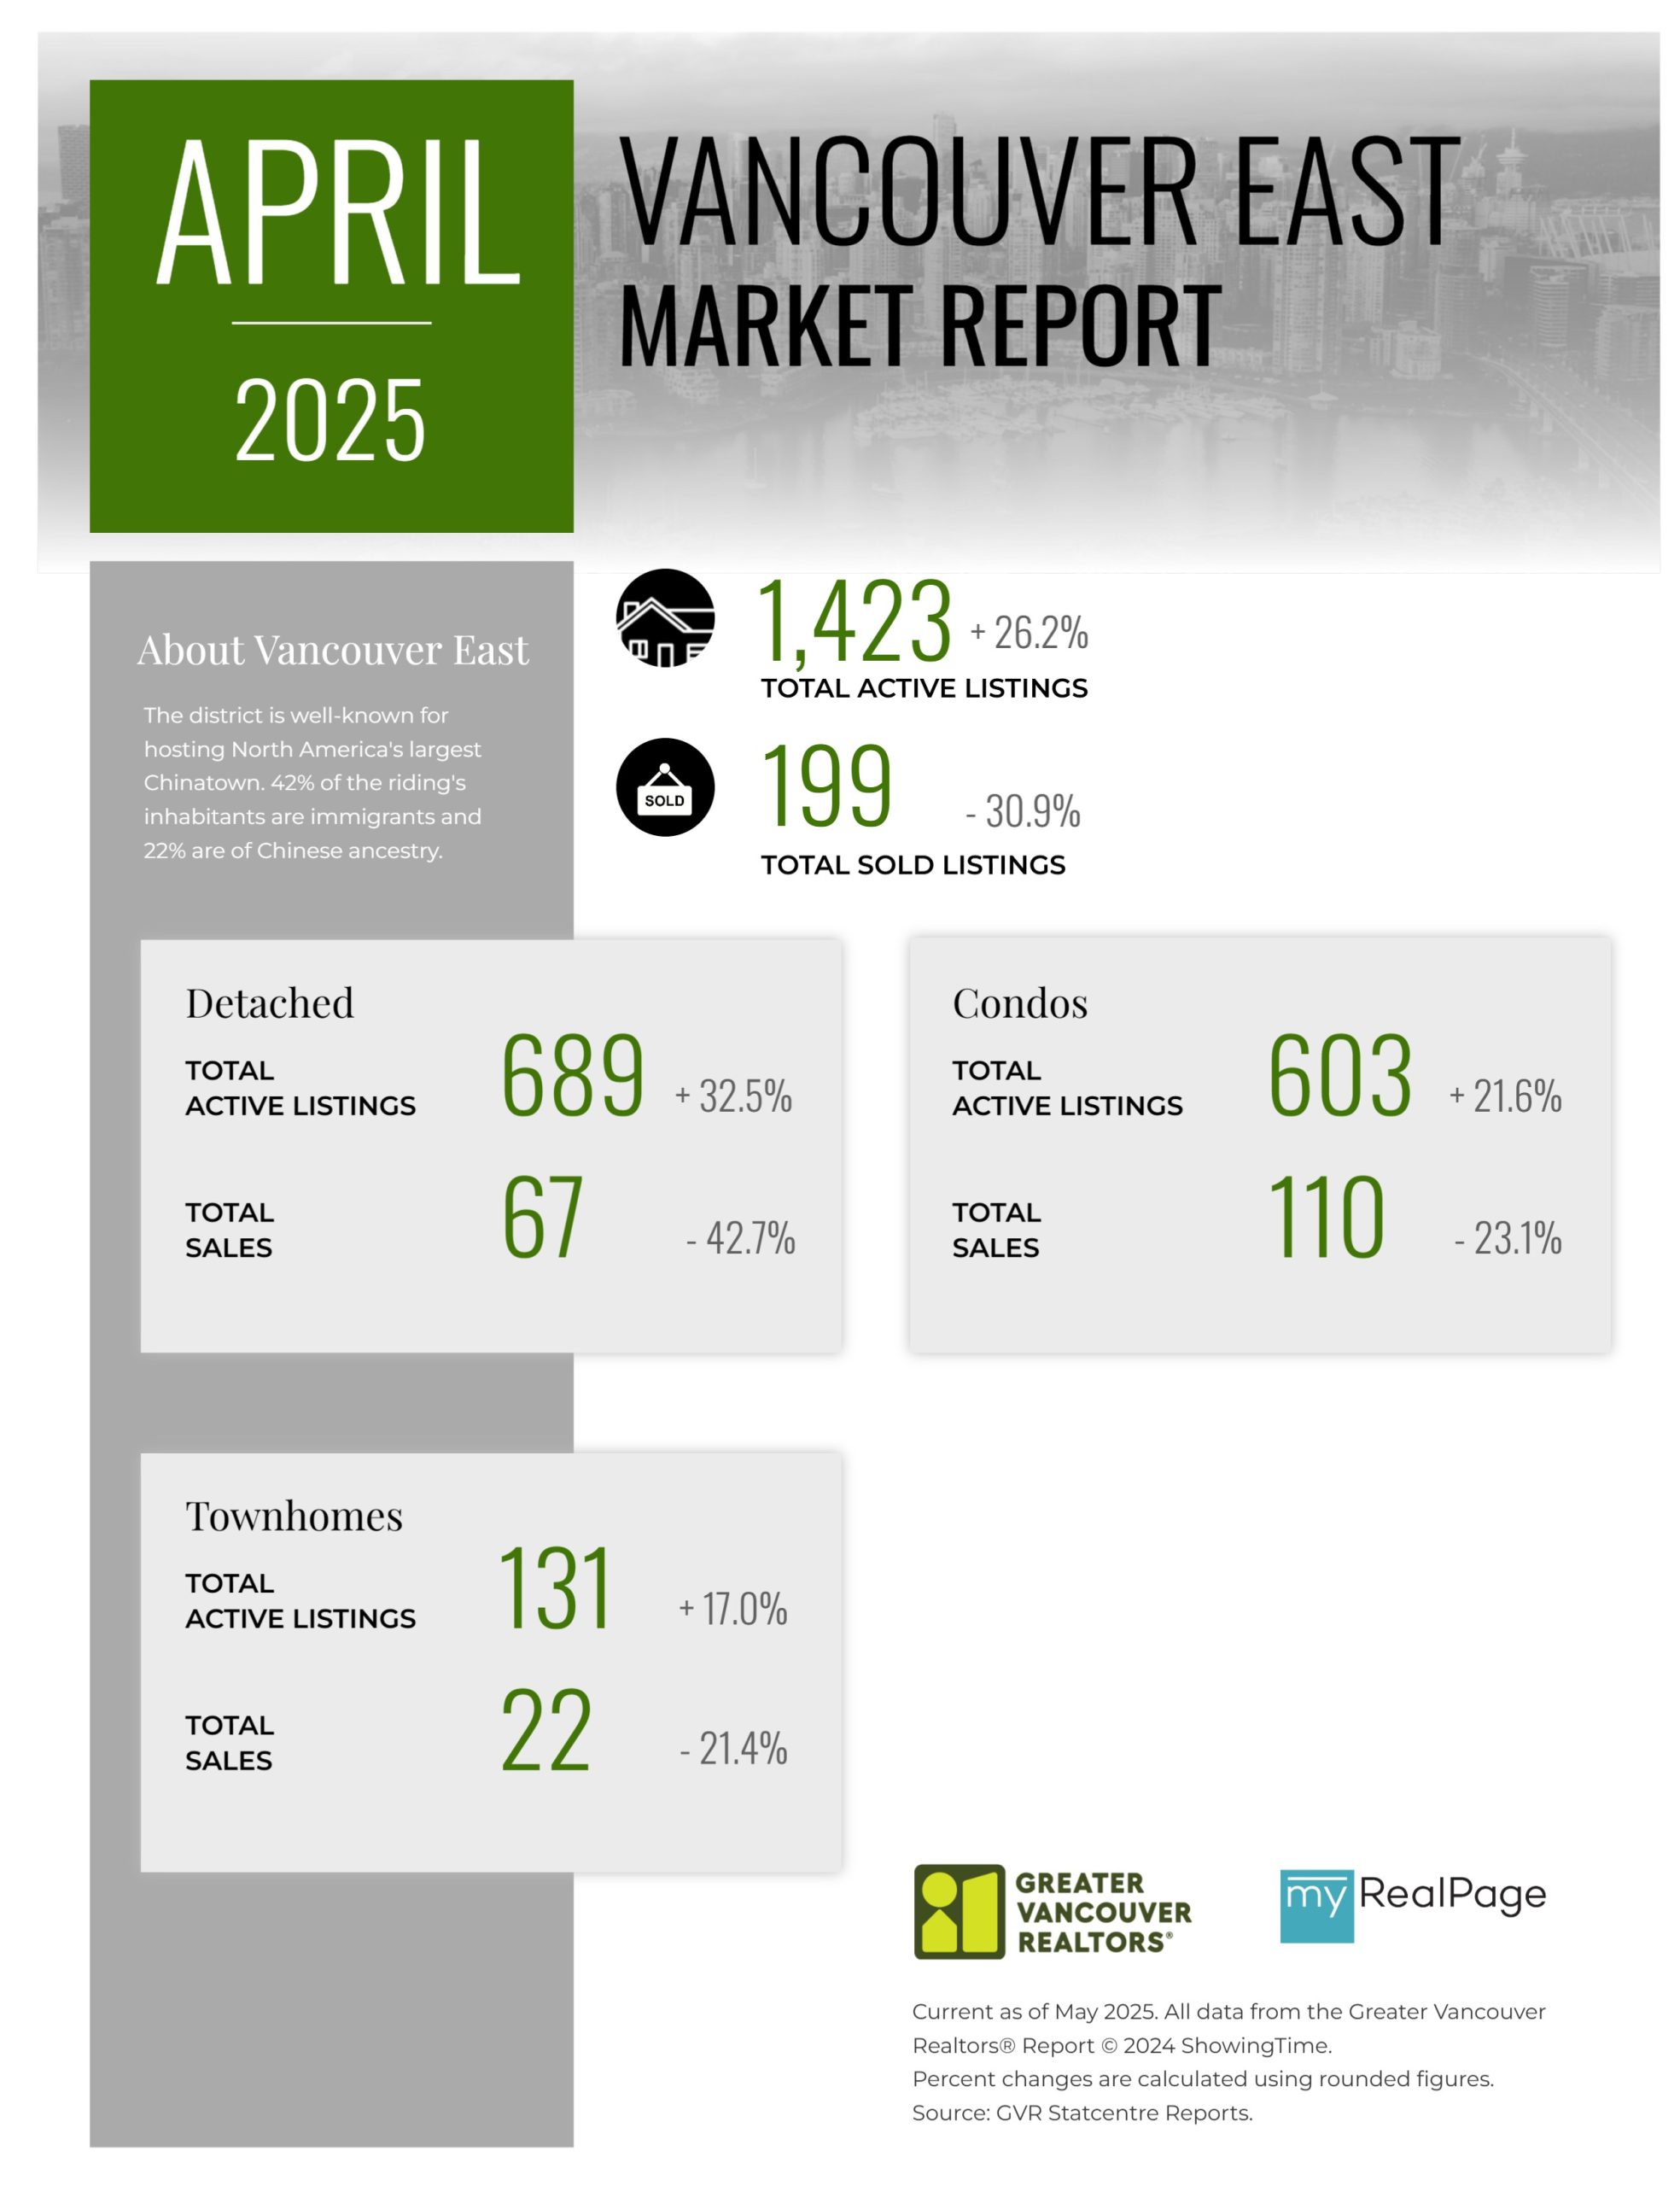
Printable Version – GVR April 2025 Data Infographics Report Vancouver East
Printable Version – GVR April 2025 Data Infographic Report Maple Ridge
Printable Version – GVR April 2025 Data Infographics Report Pitt Meadows
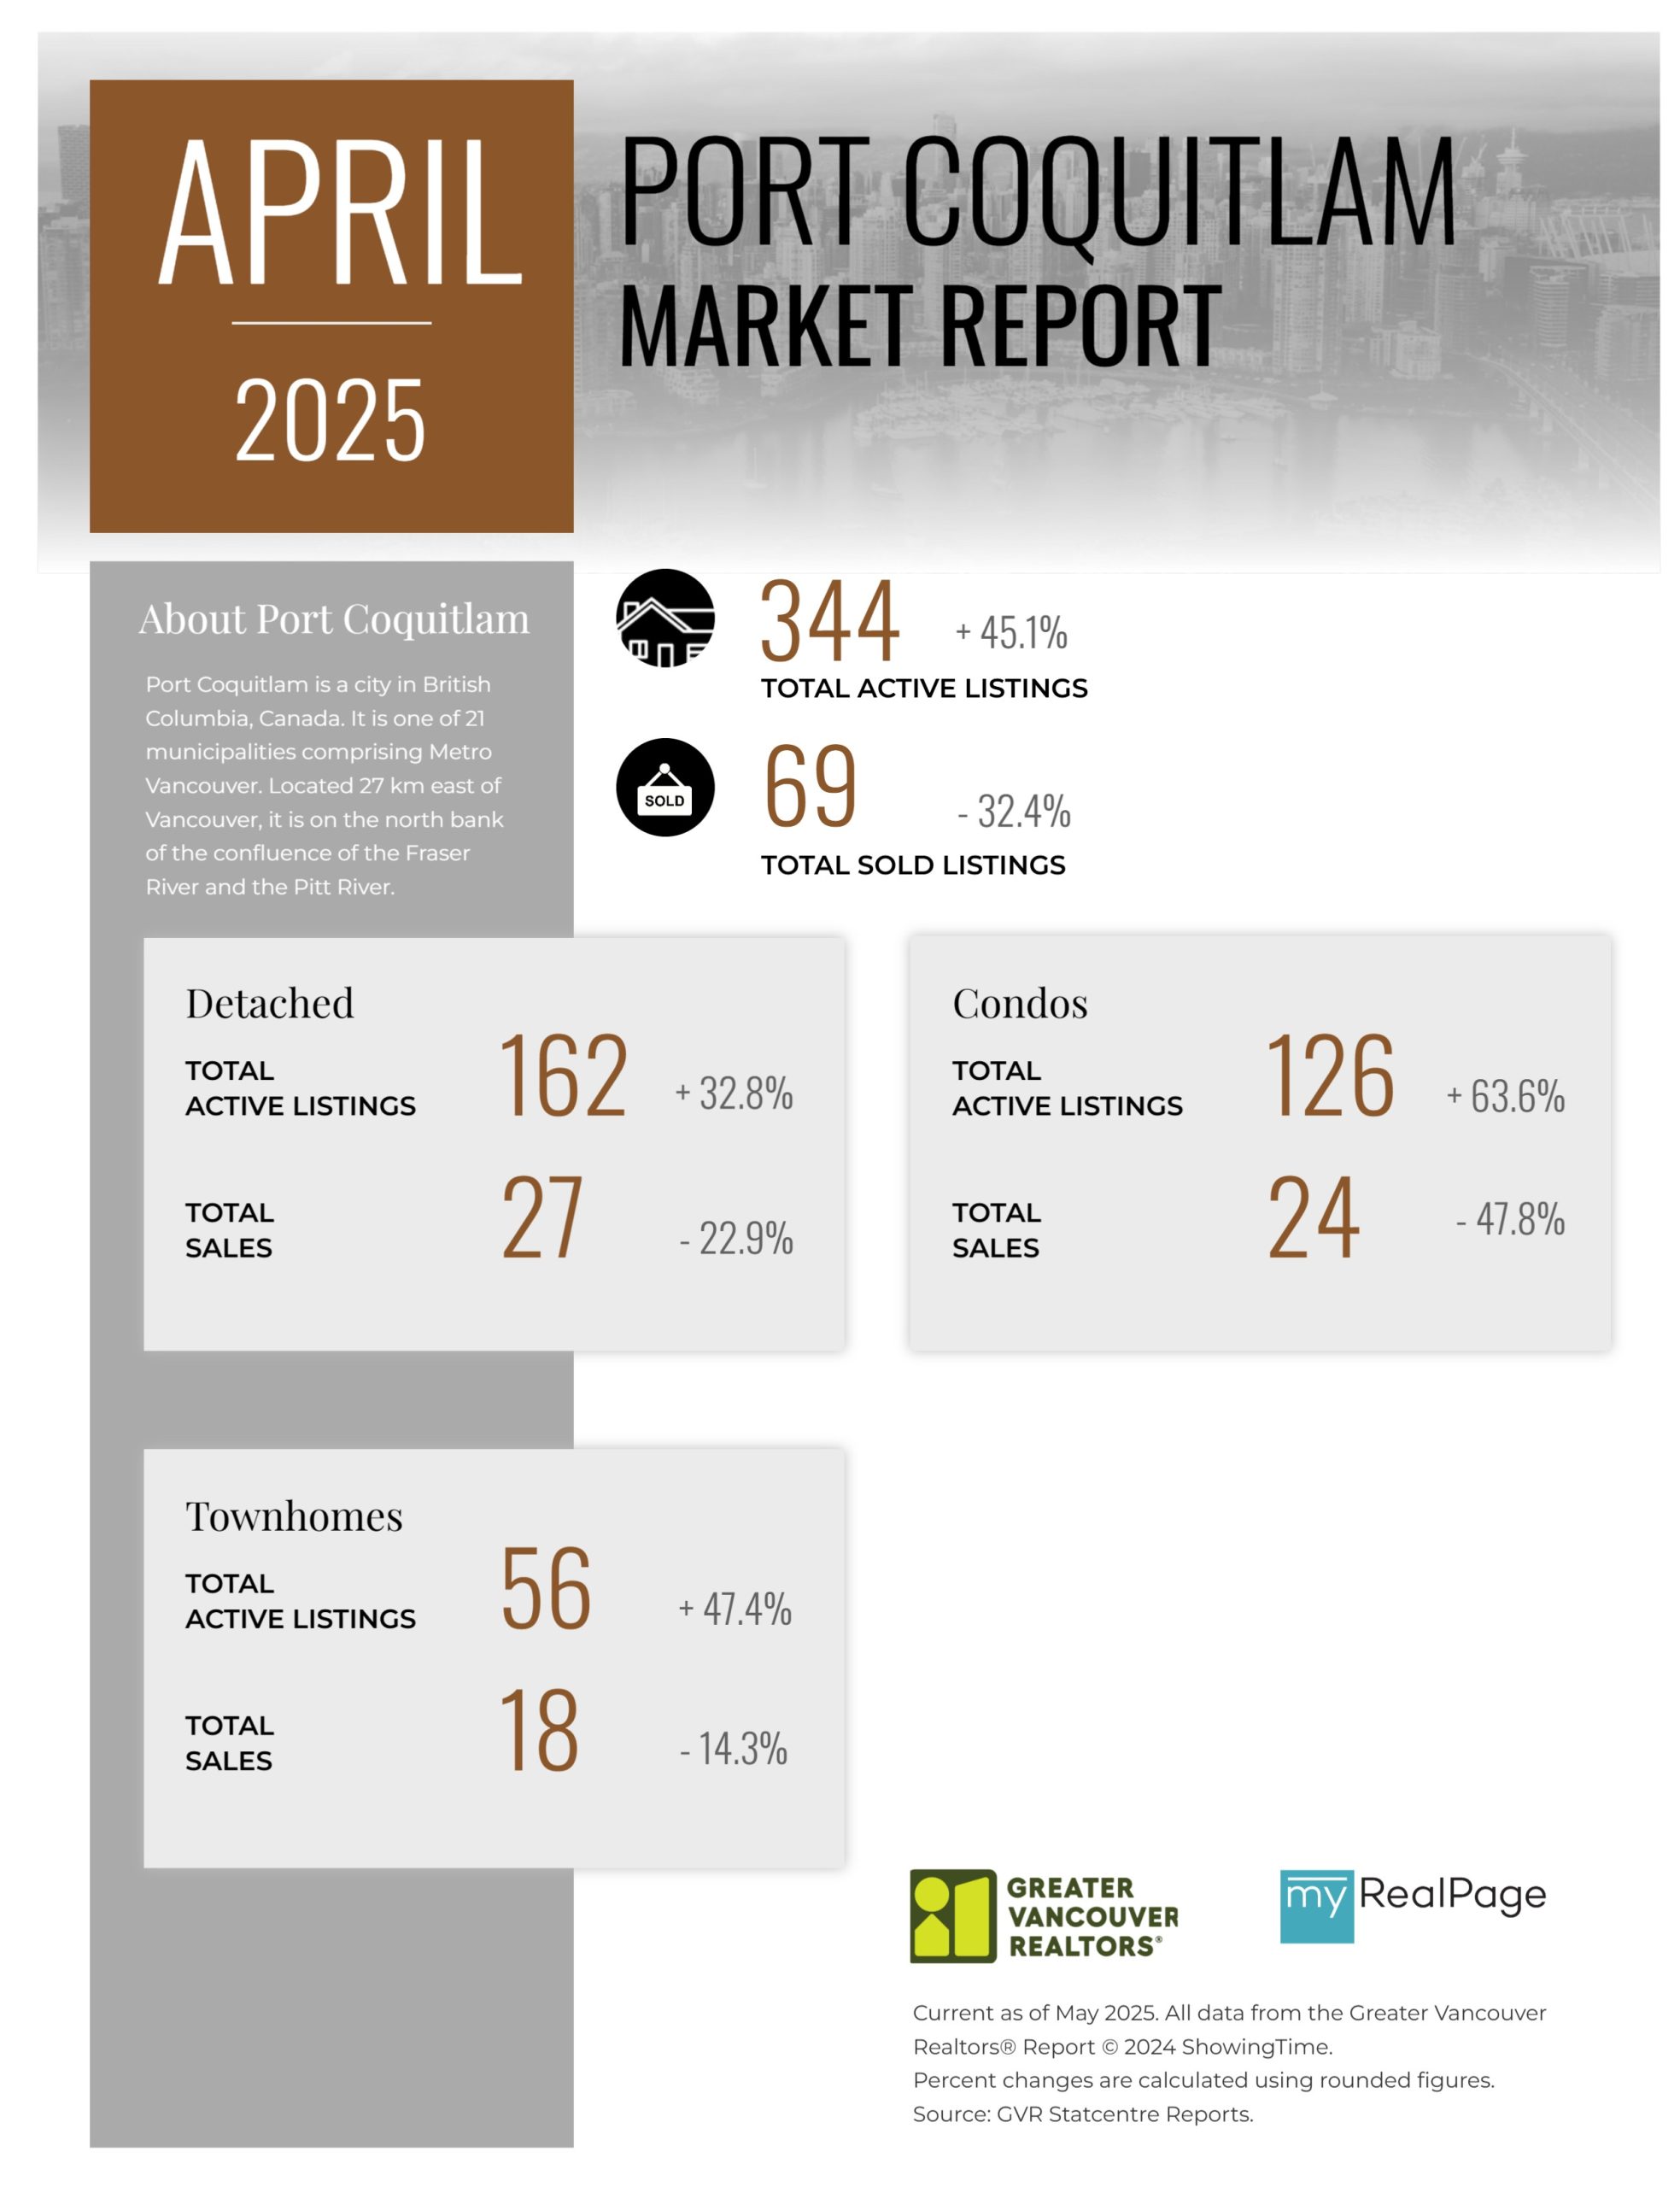
Printable Version – GVR April 2025 Data Infographics Report Port Coquitlam
Printable Version – GVR April 2025 Data Infographics Report Coquitlam
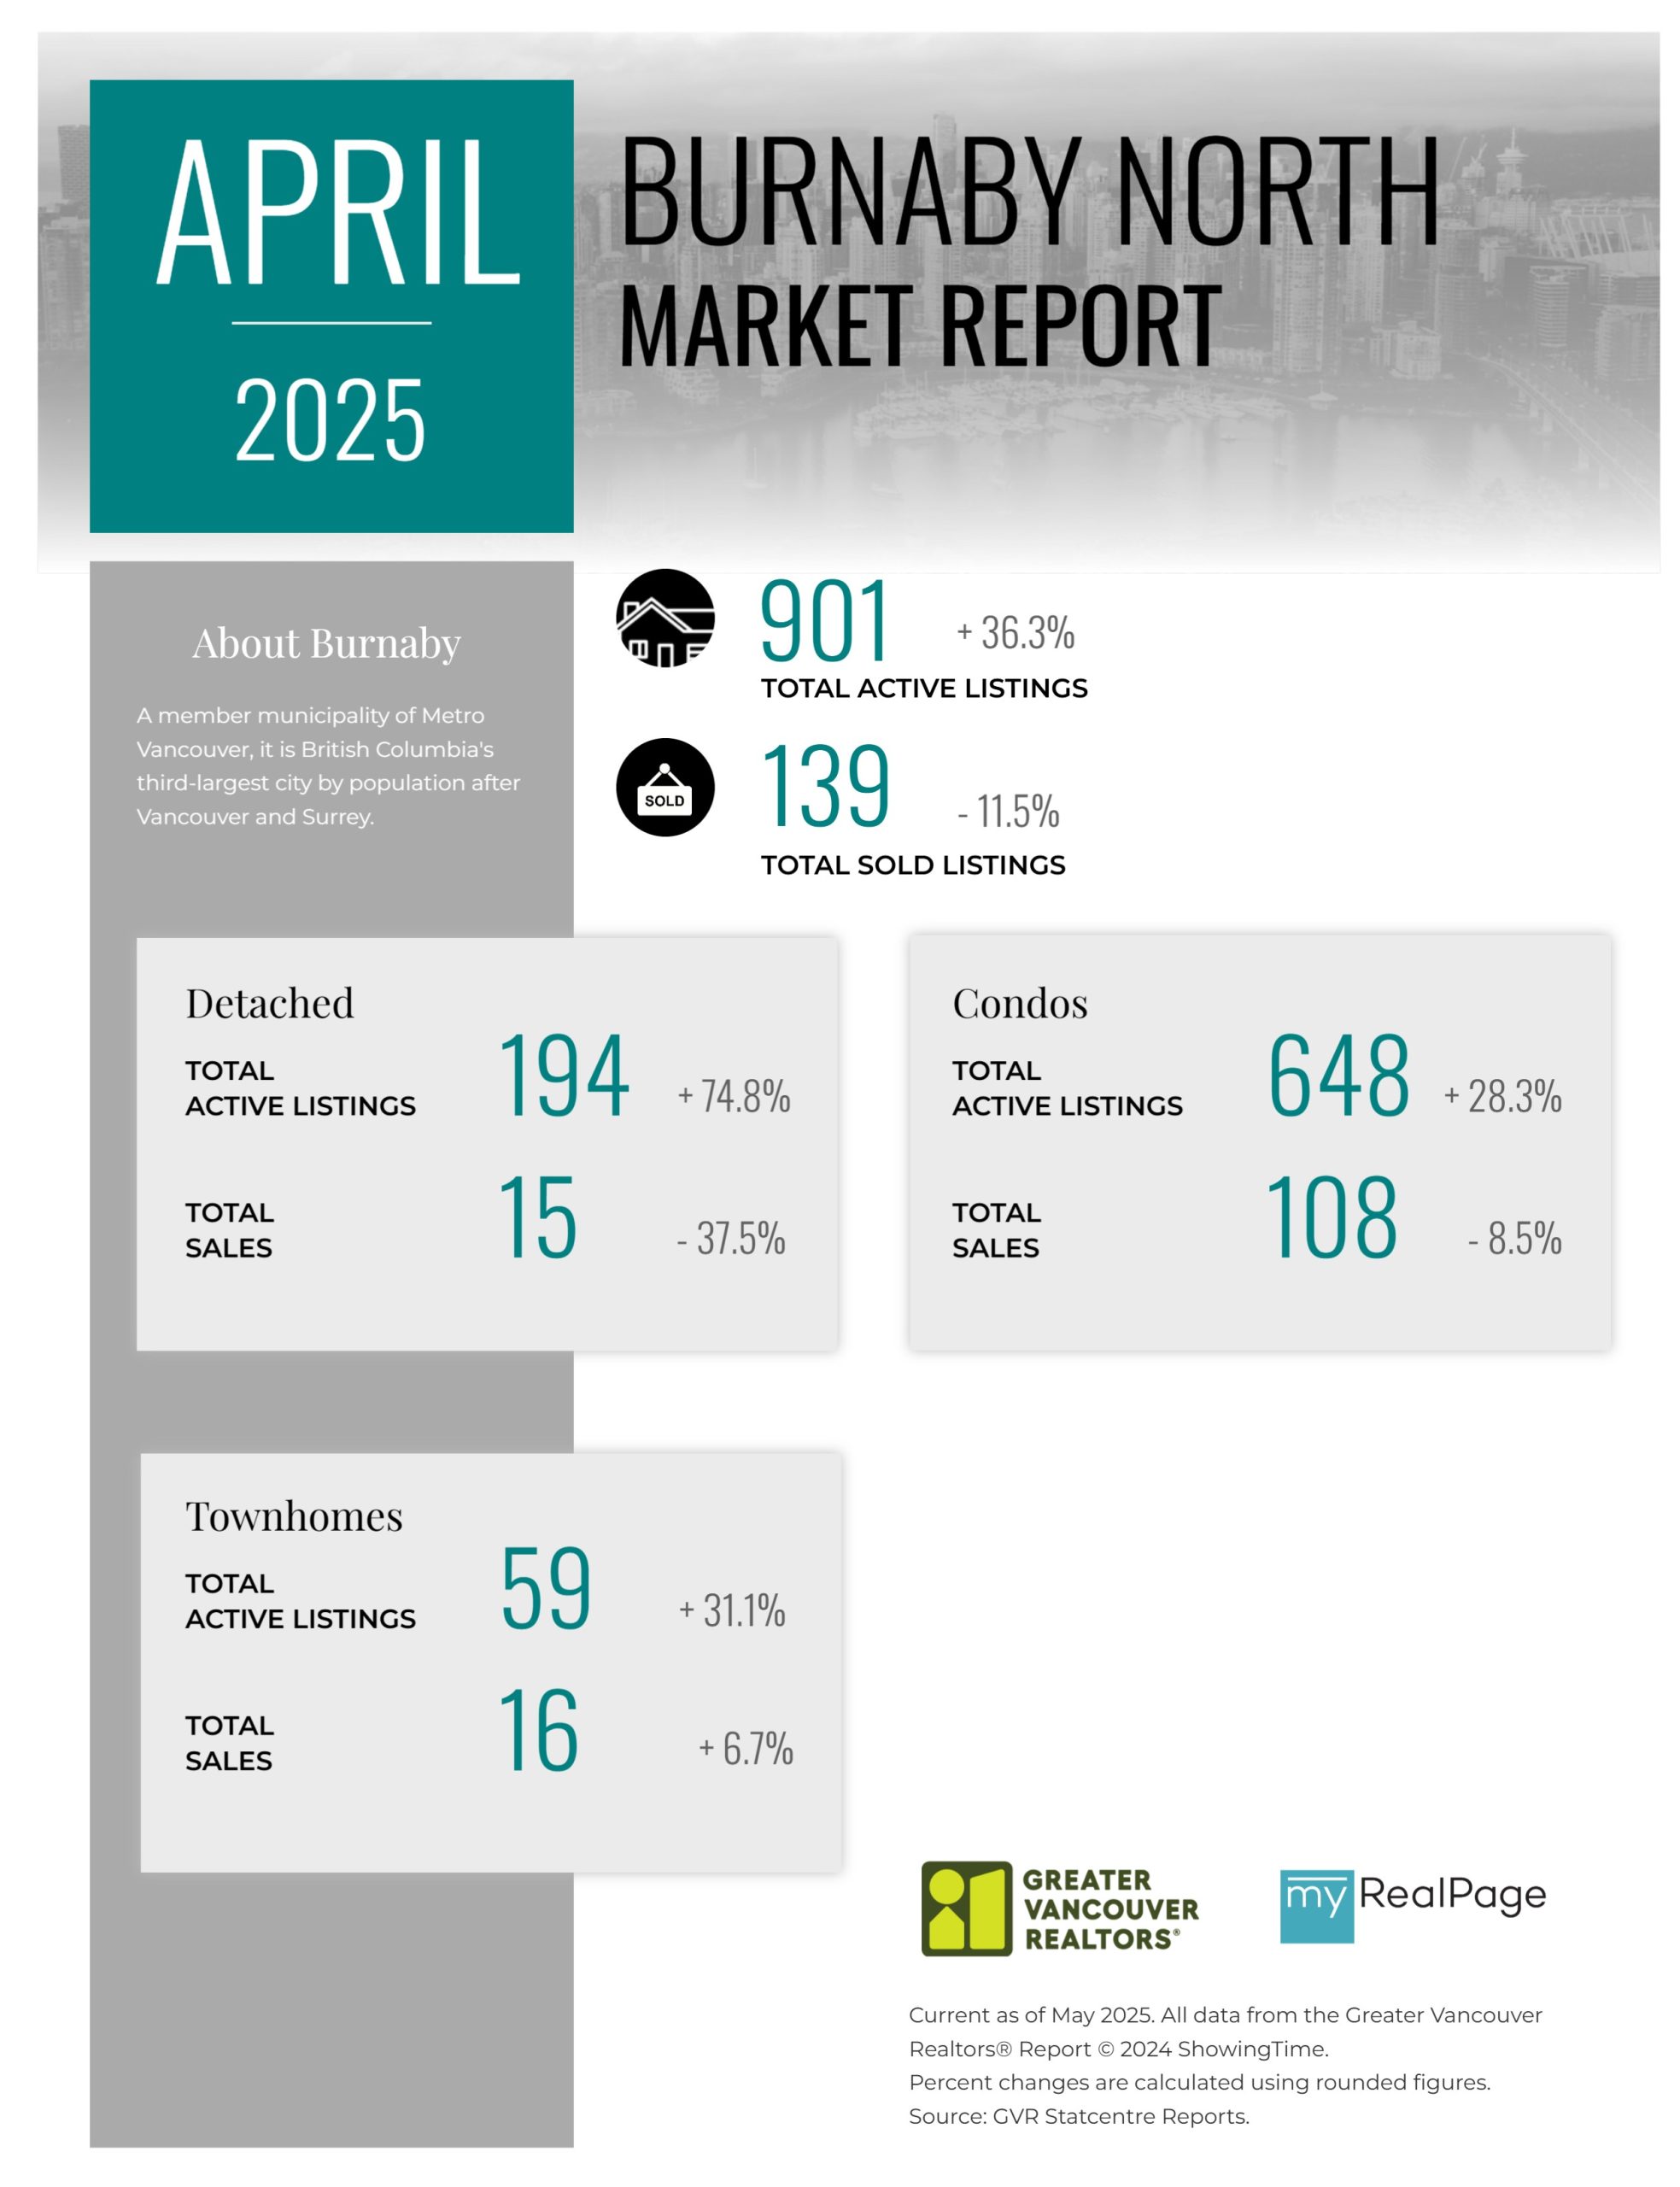
Printable Version – GVR April 2025 Data Infographic Report Burnaby North
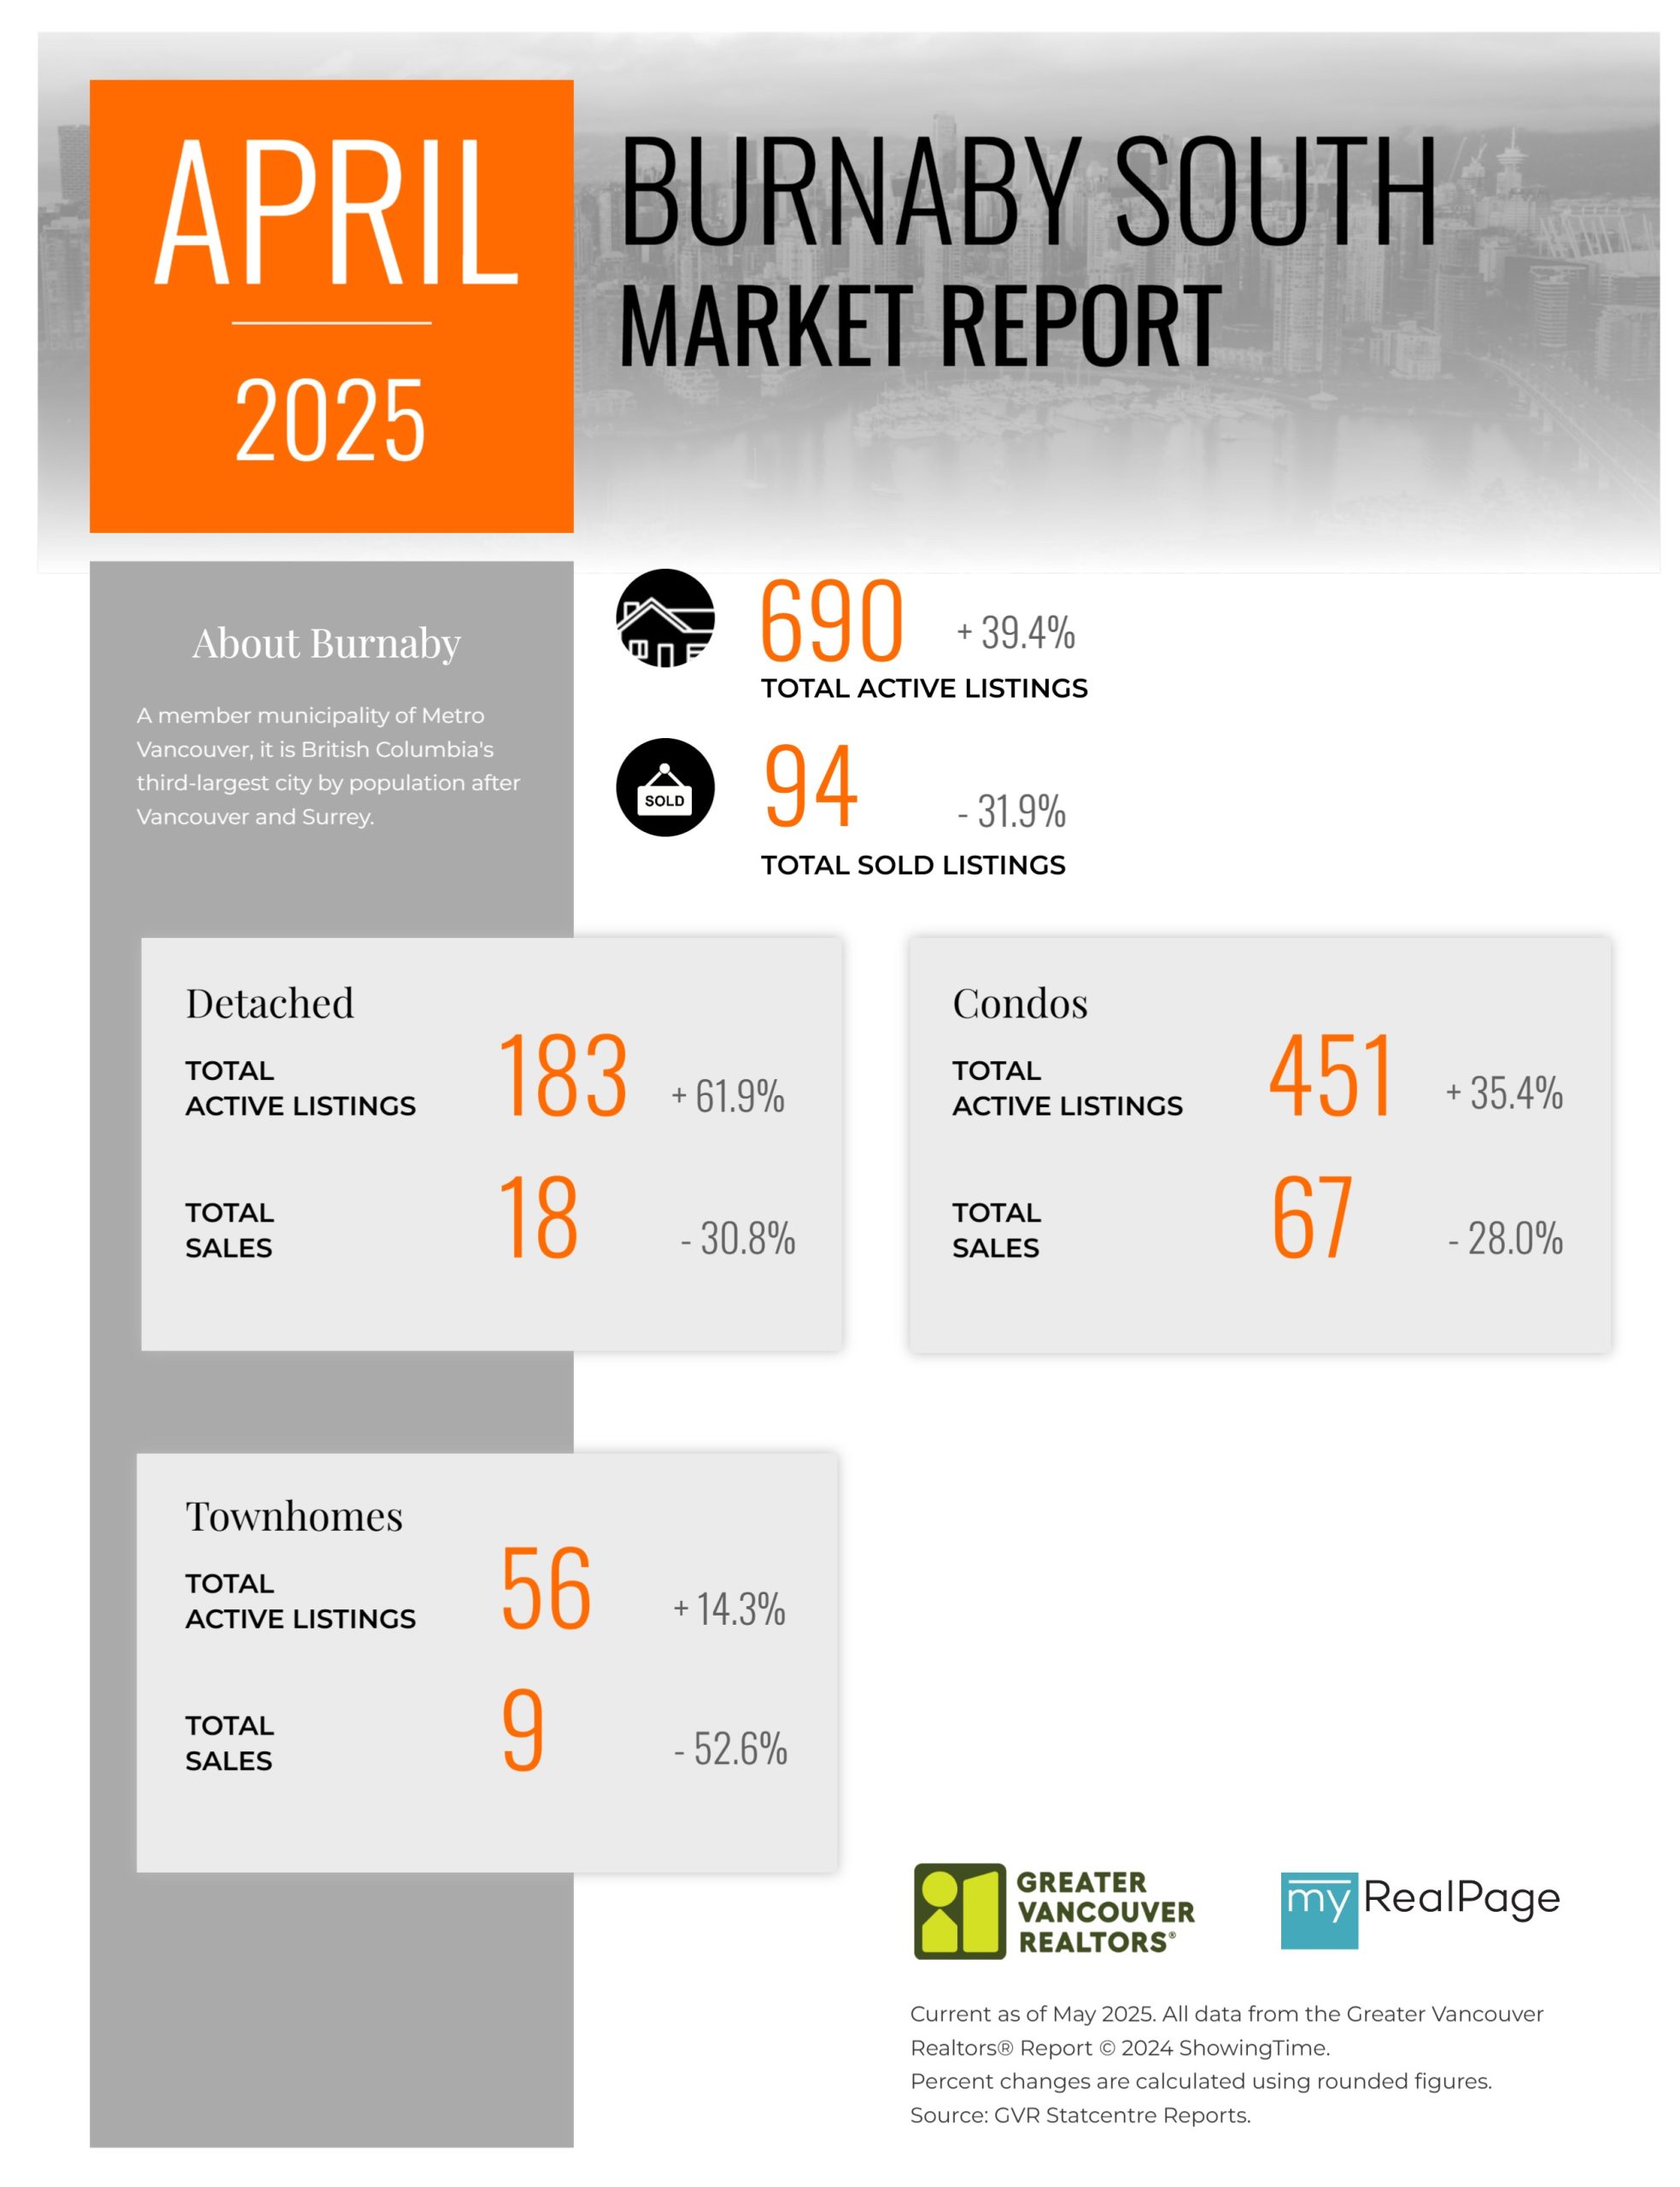
Printable Version – GVR April 2025 Data Infographics Report Burnaby South
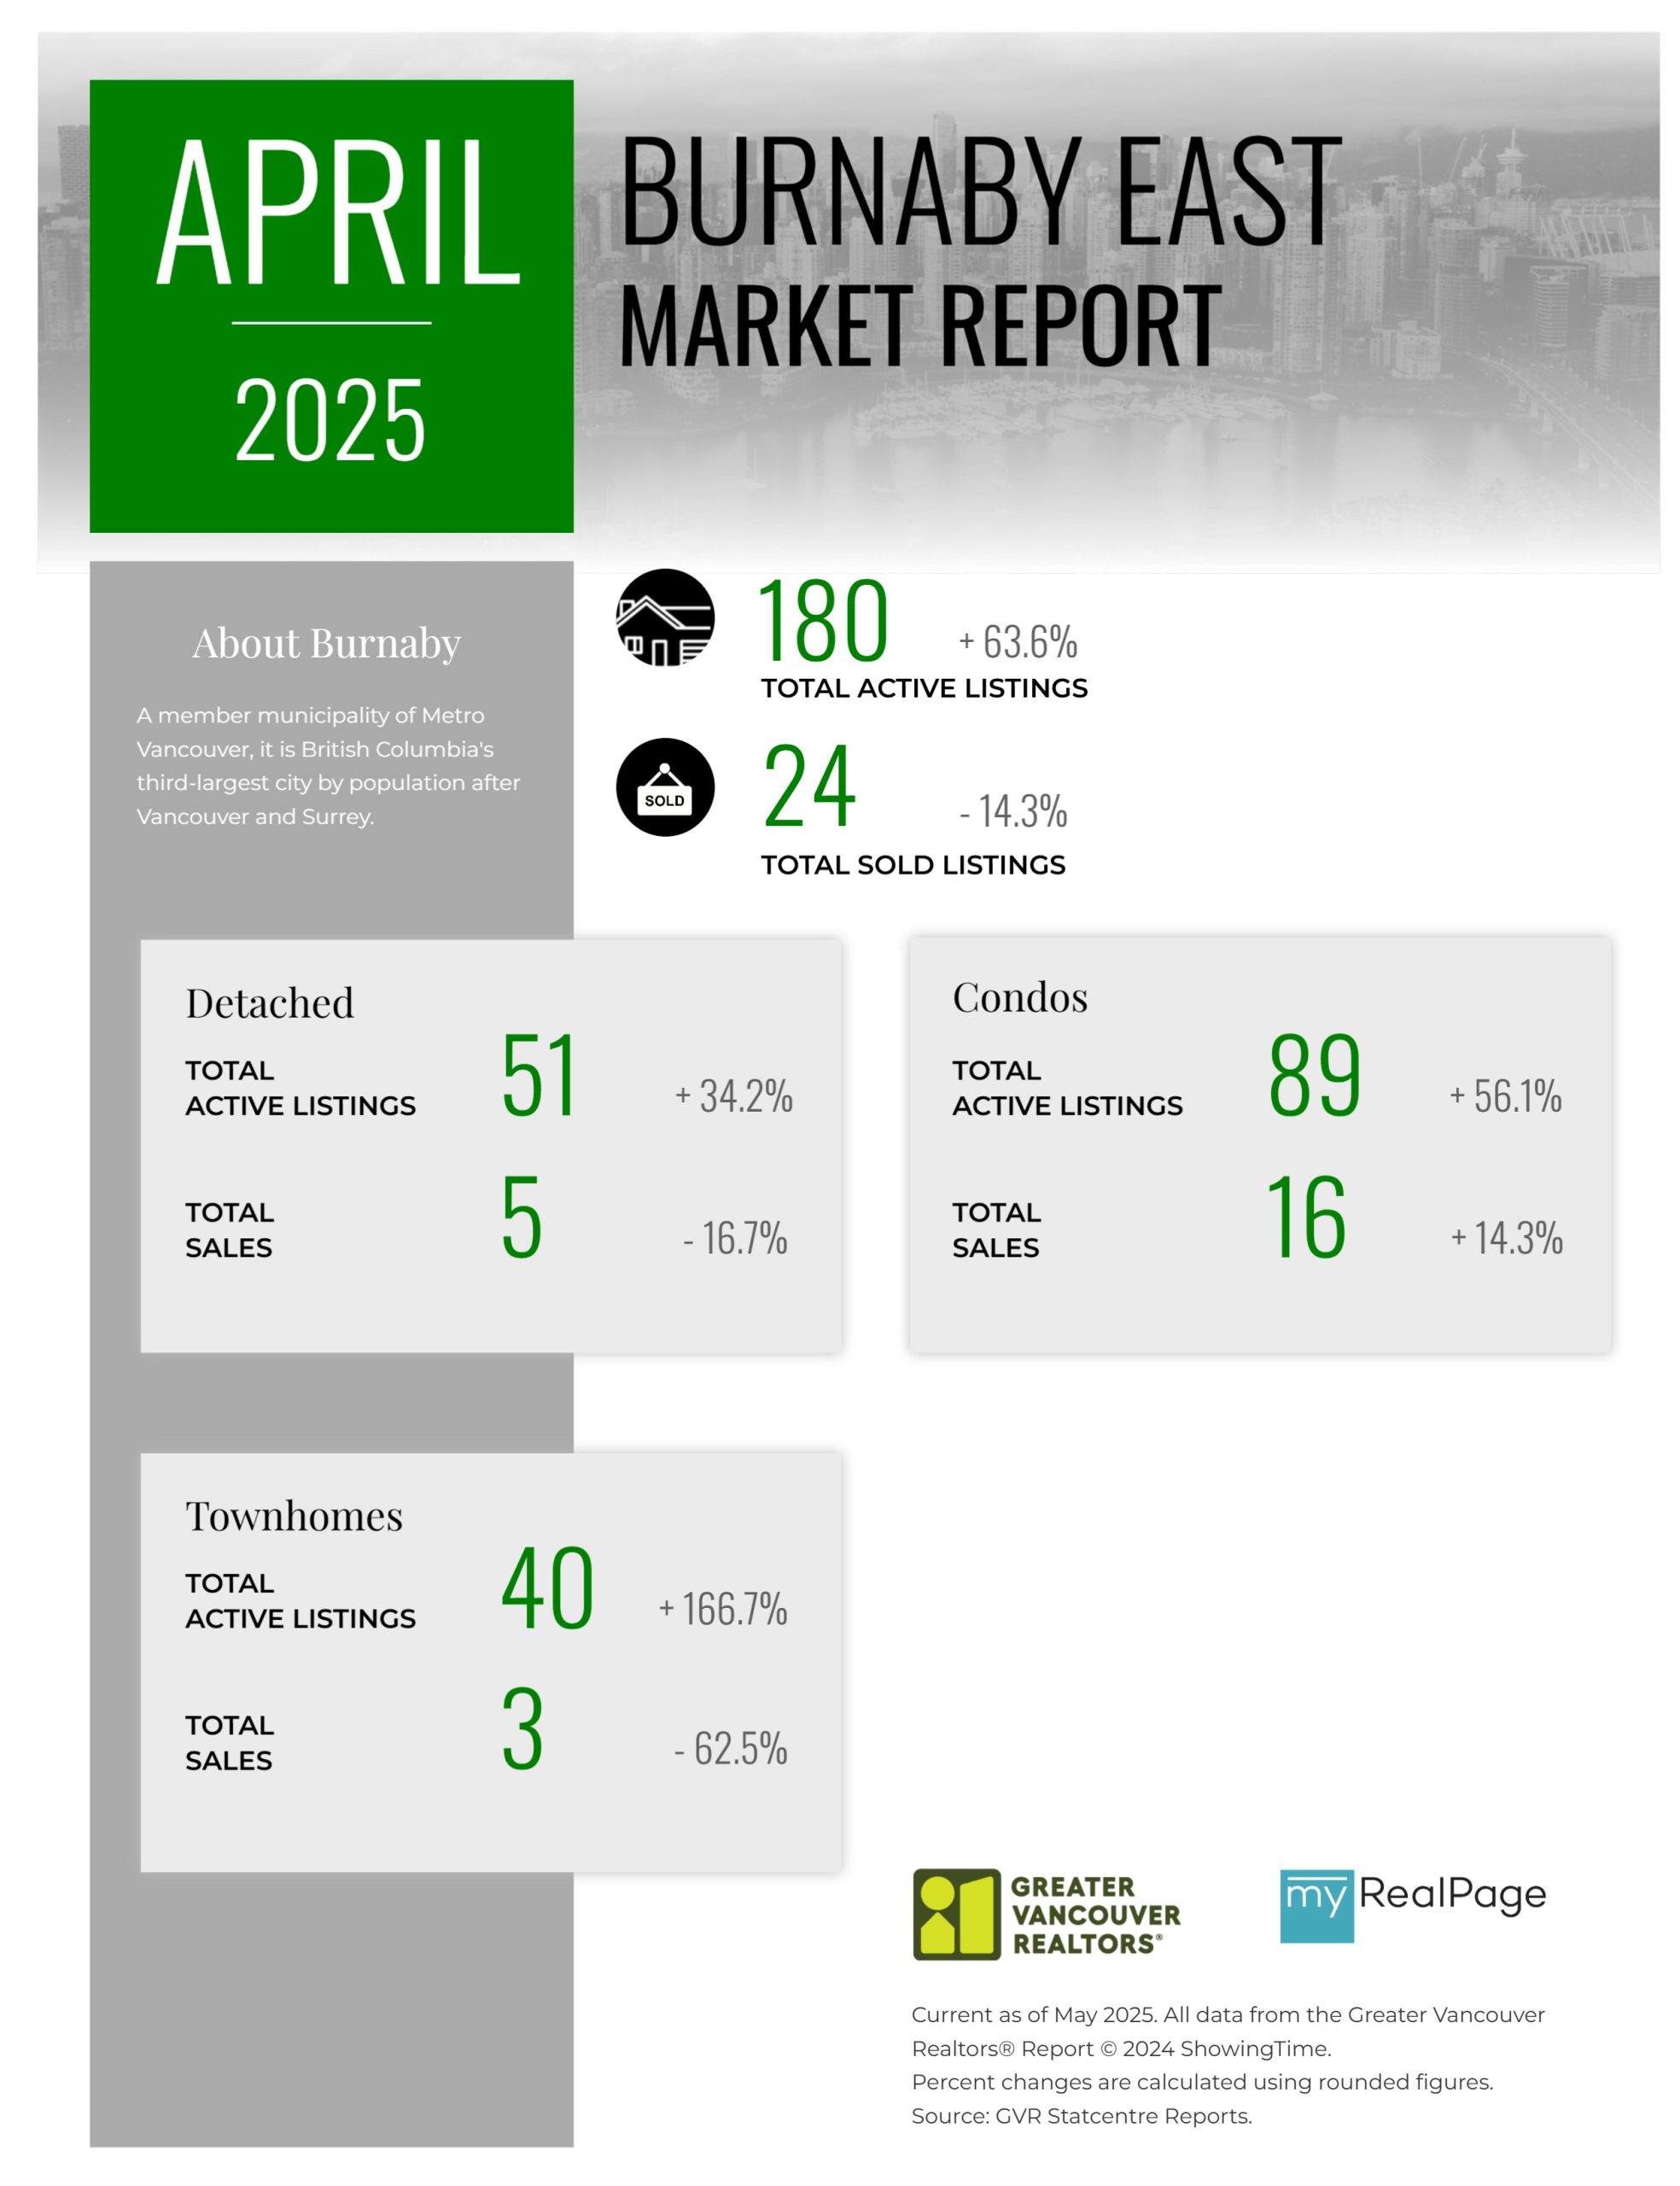
Printable Version – GVR April 2025 Data Infographics Report Burnaby East
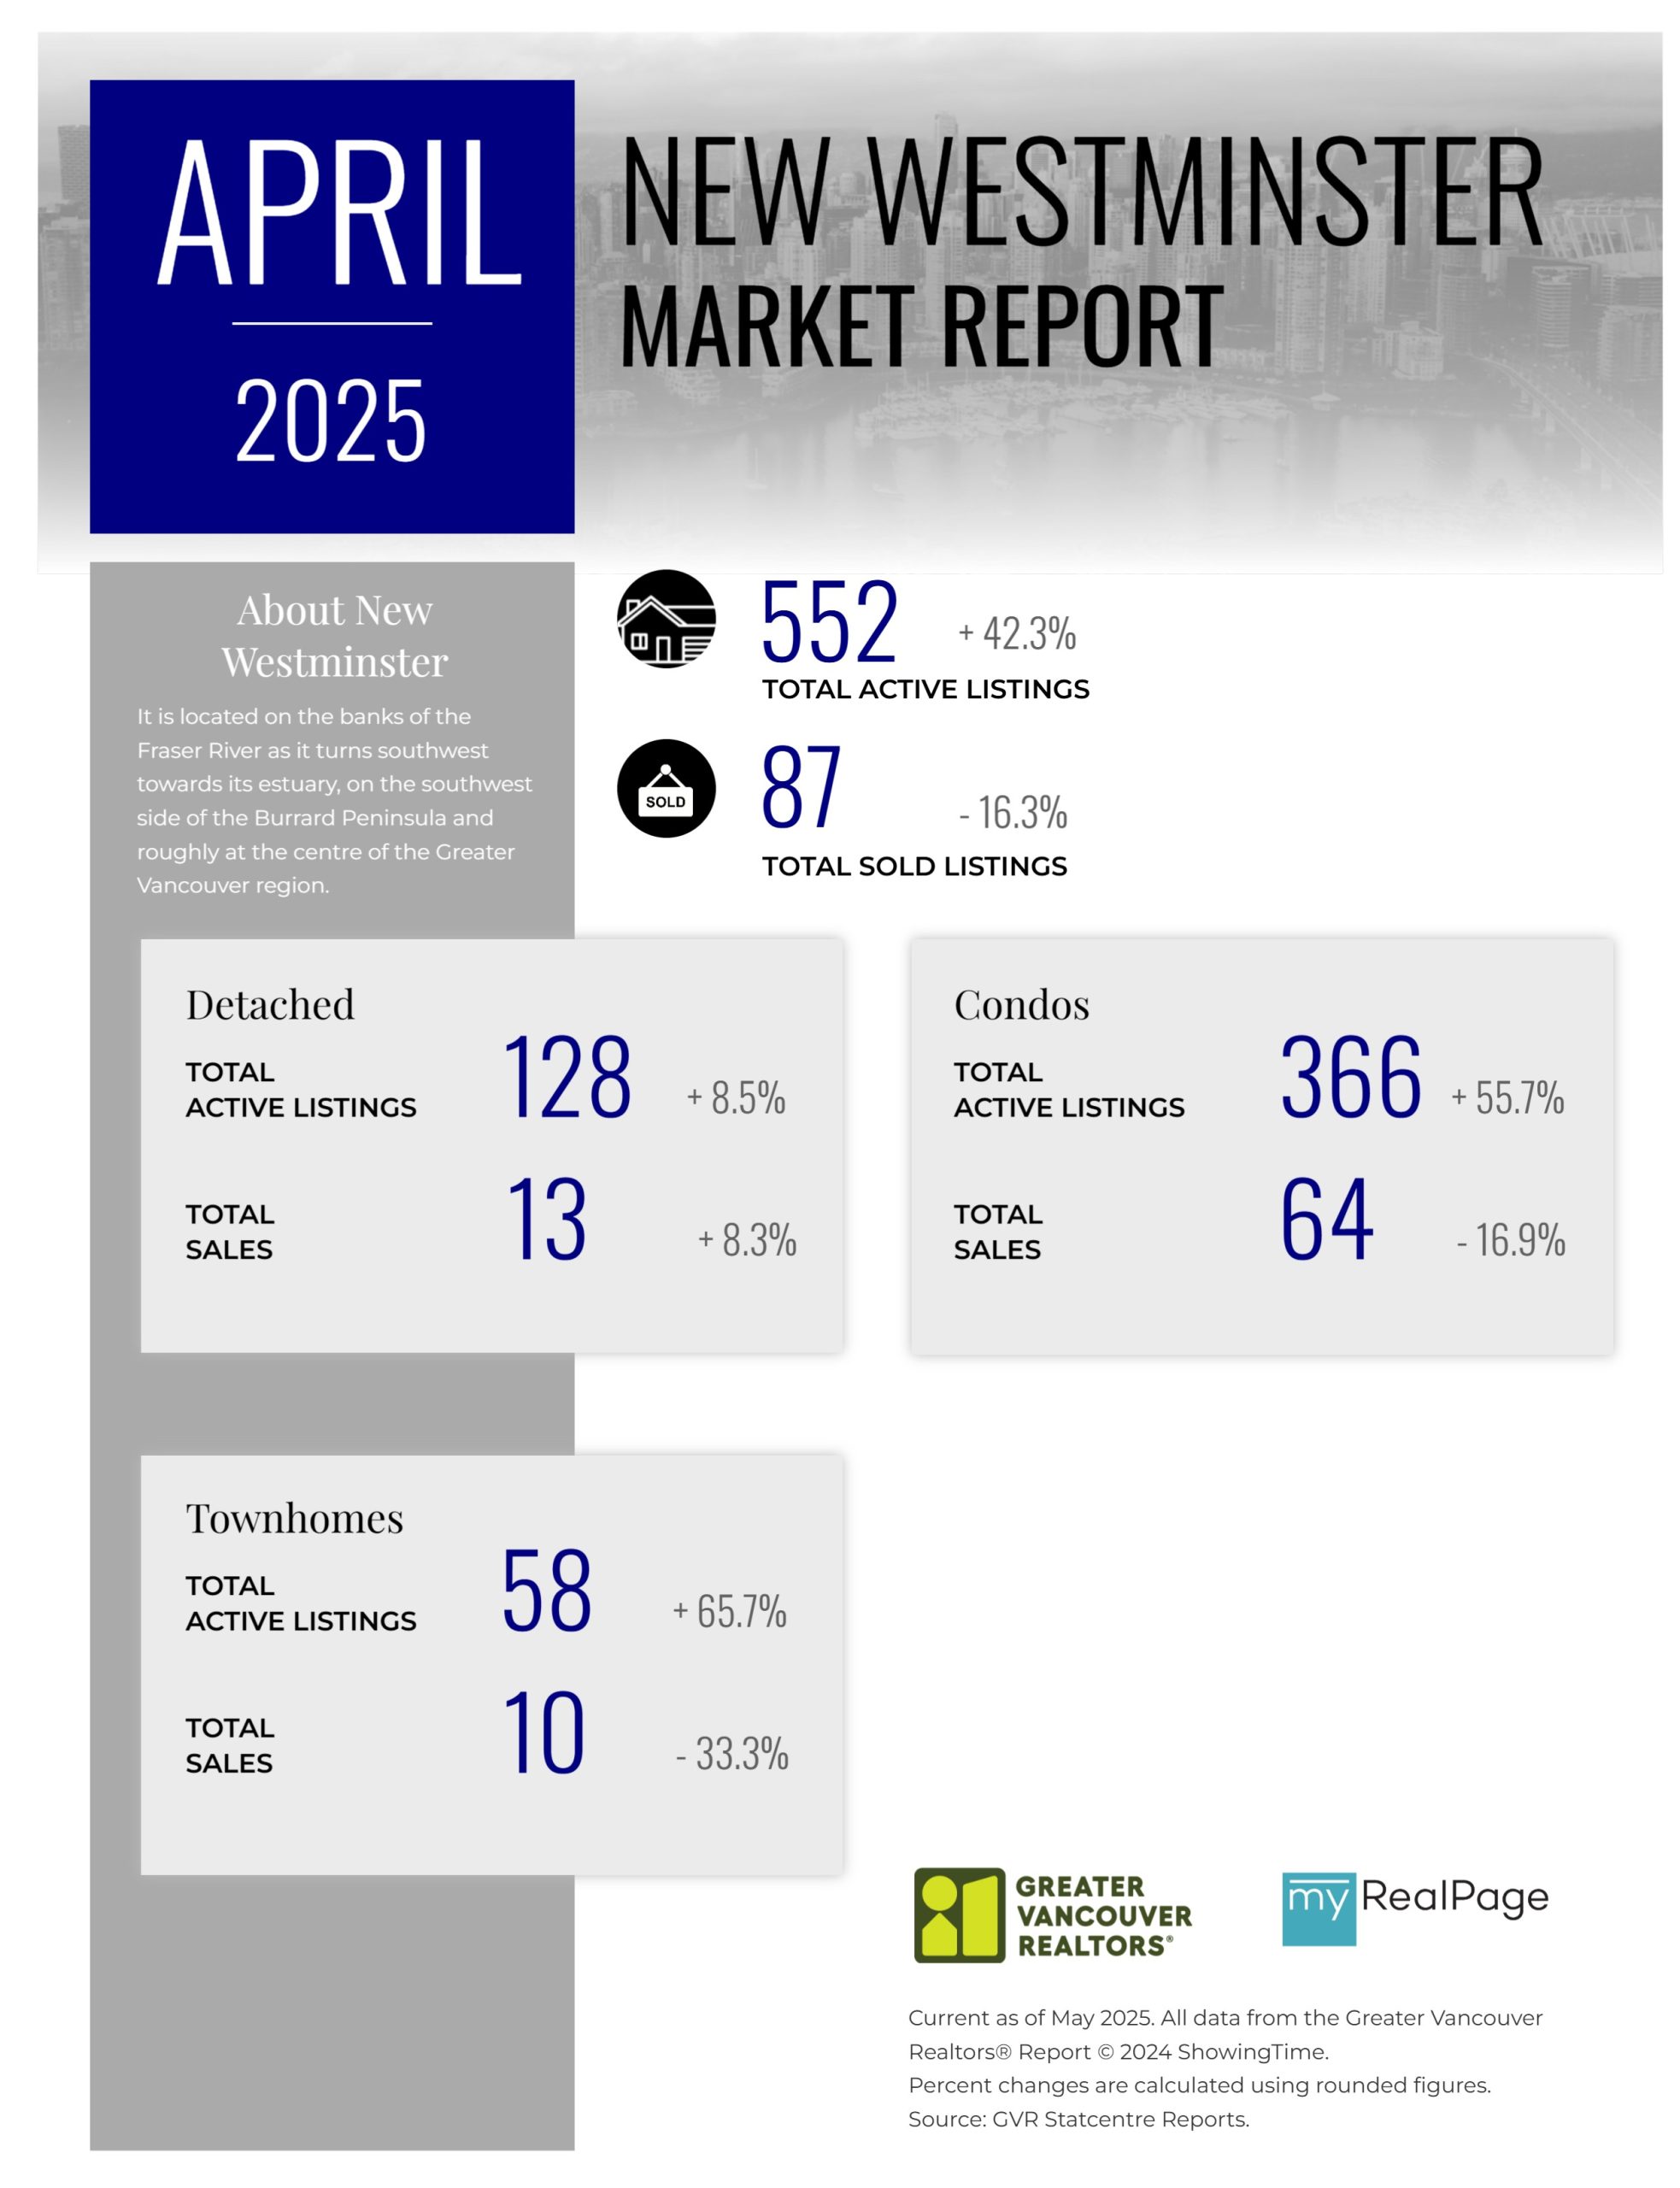
Printable Version – GVR April 2025 Data Infographics Report New Westminster
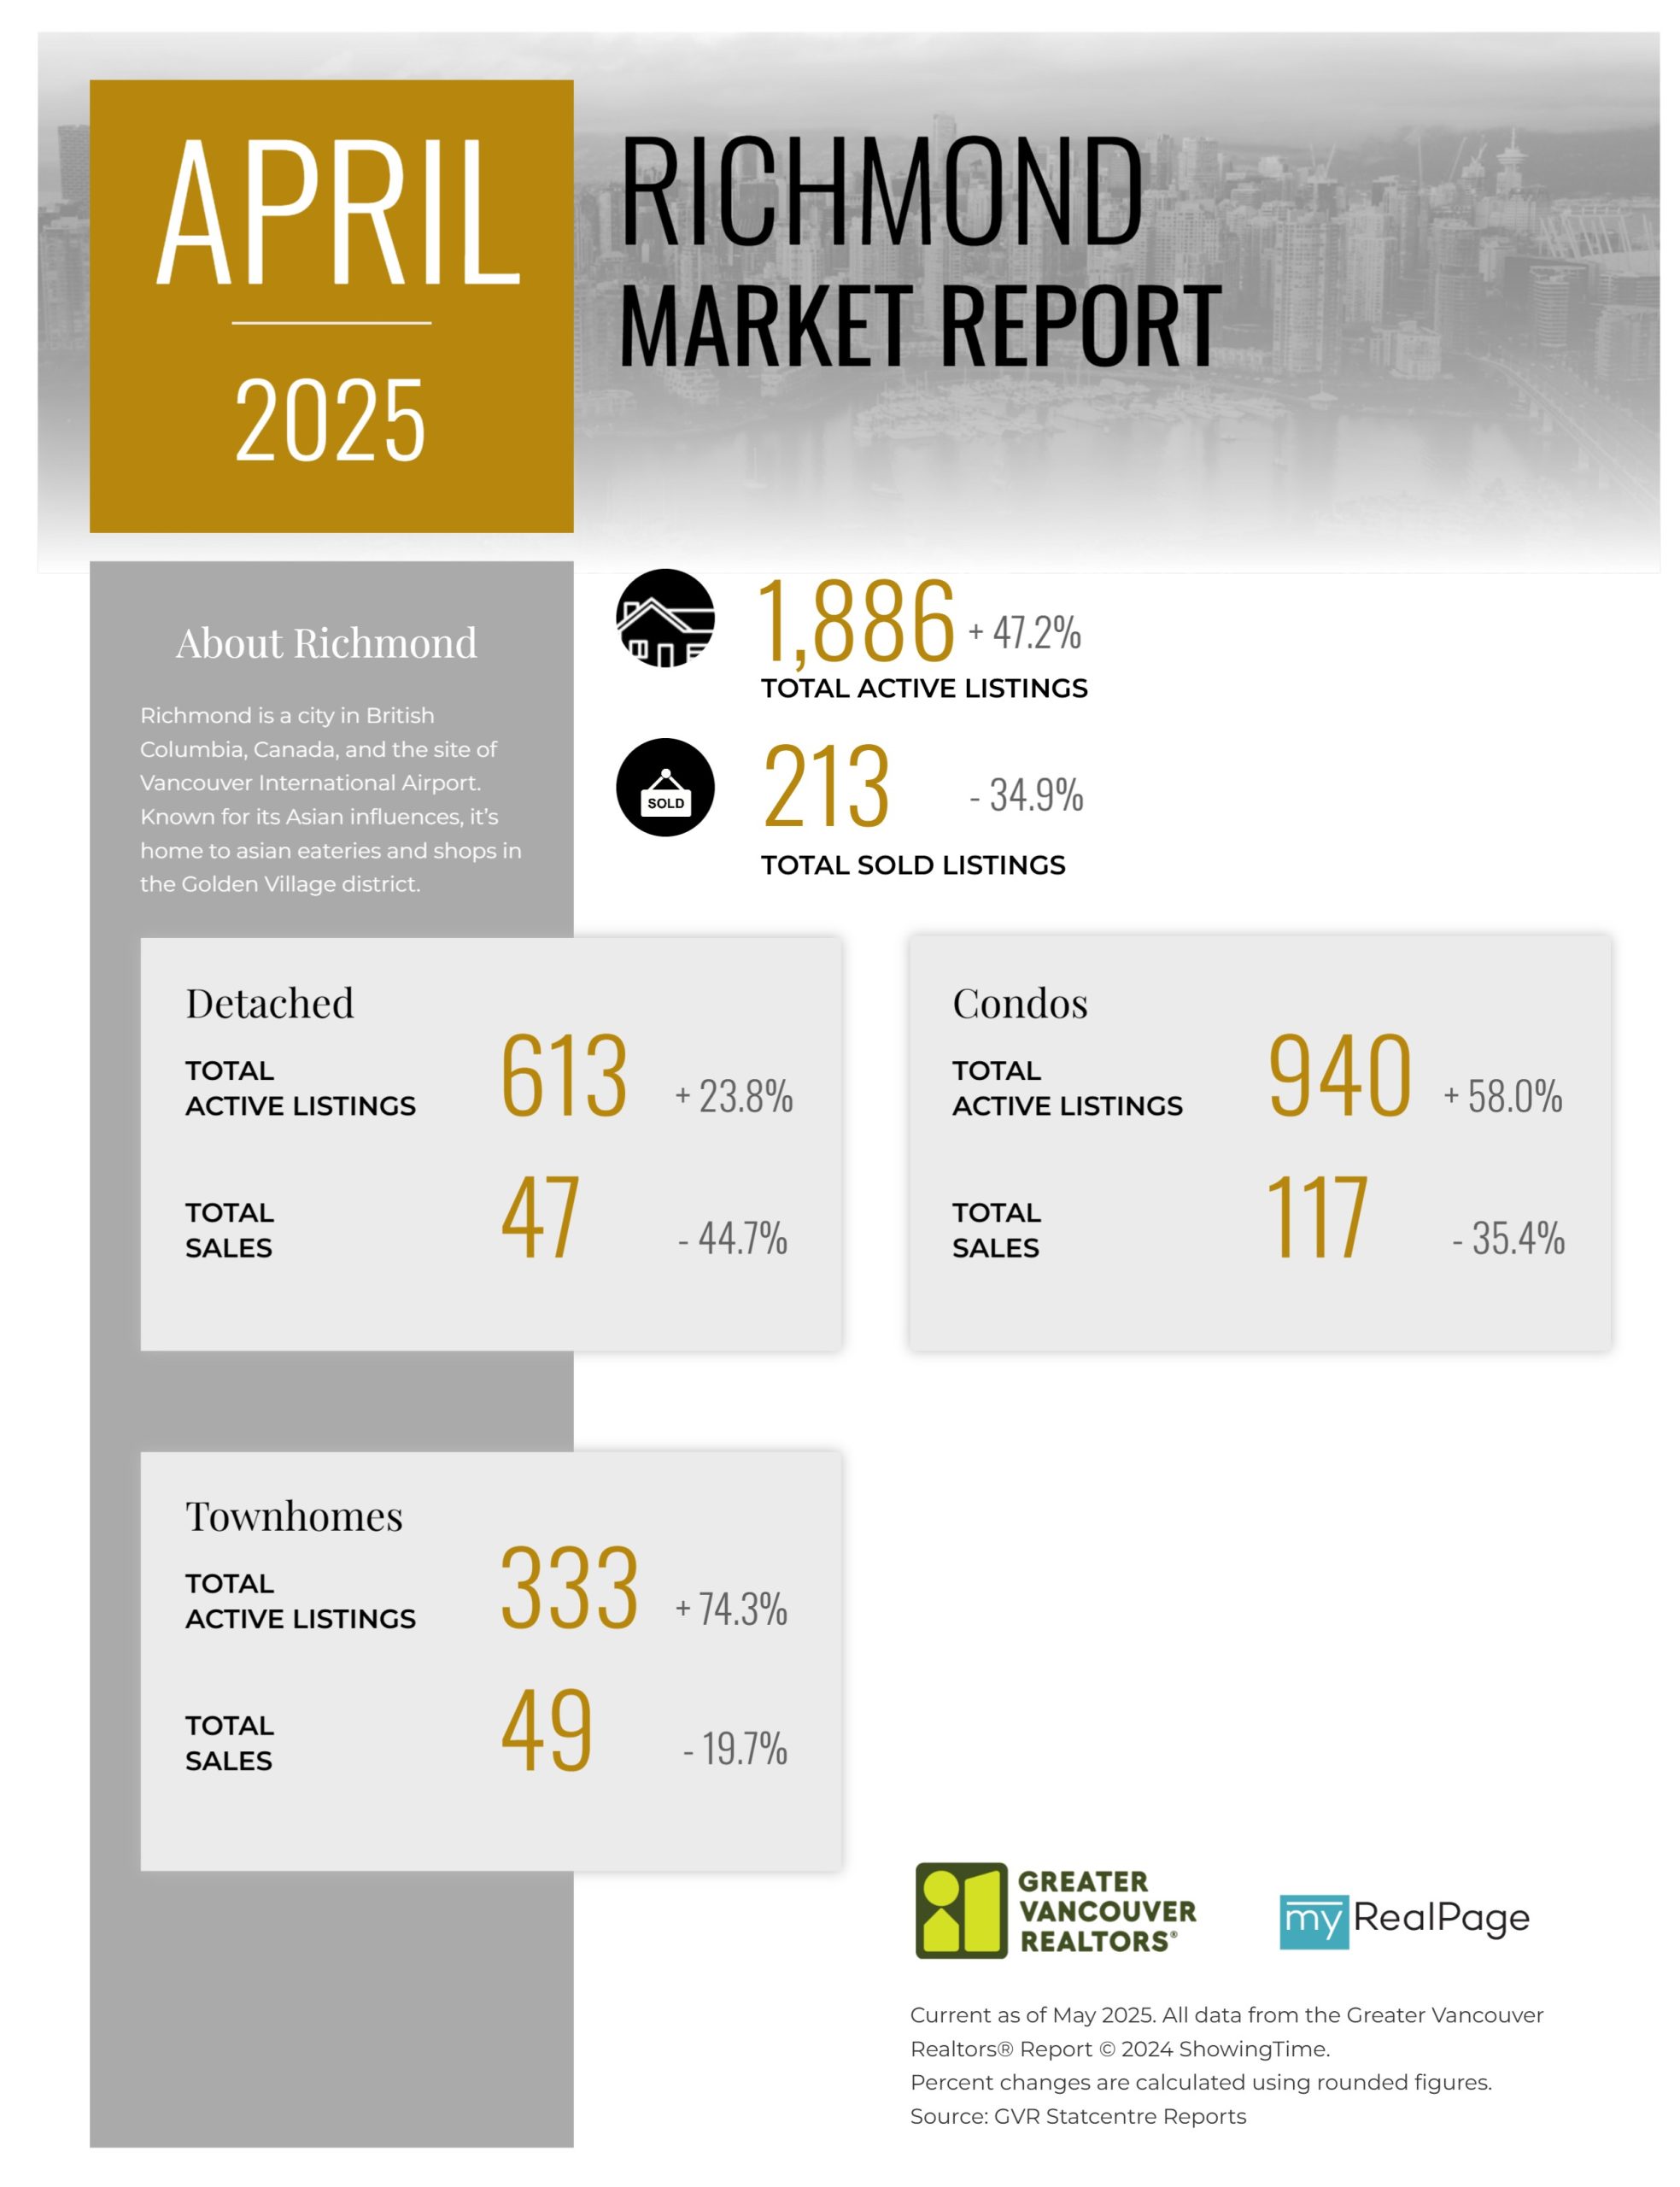
Printable Version – GVR April 2025 Data Infographics Report Richmond
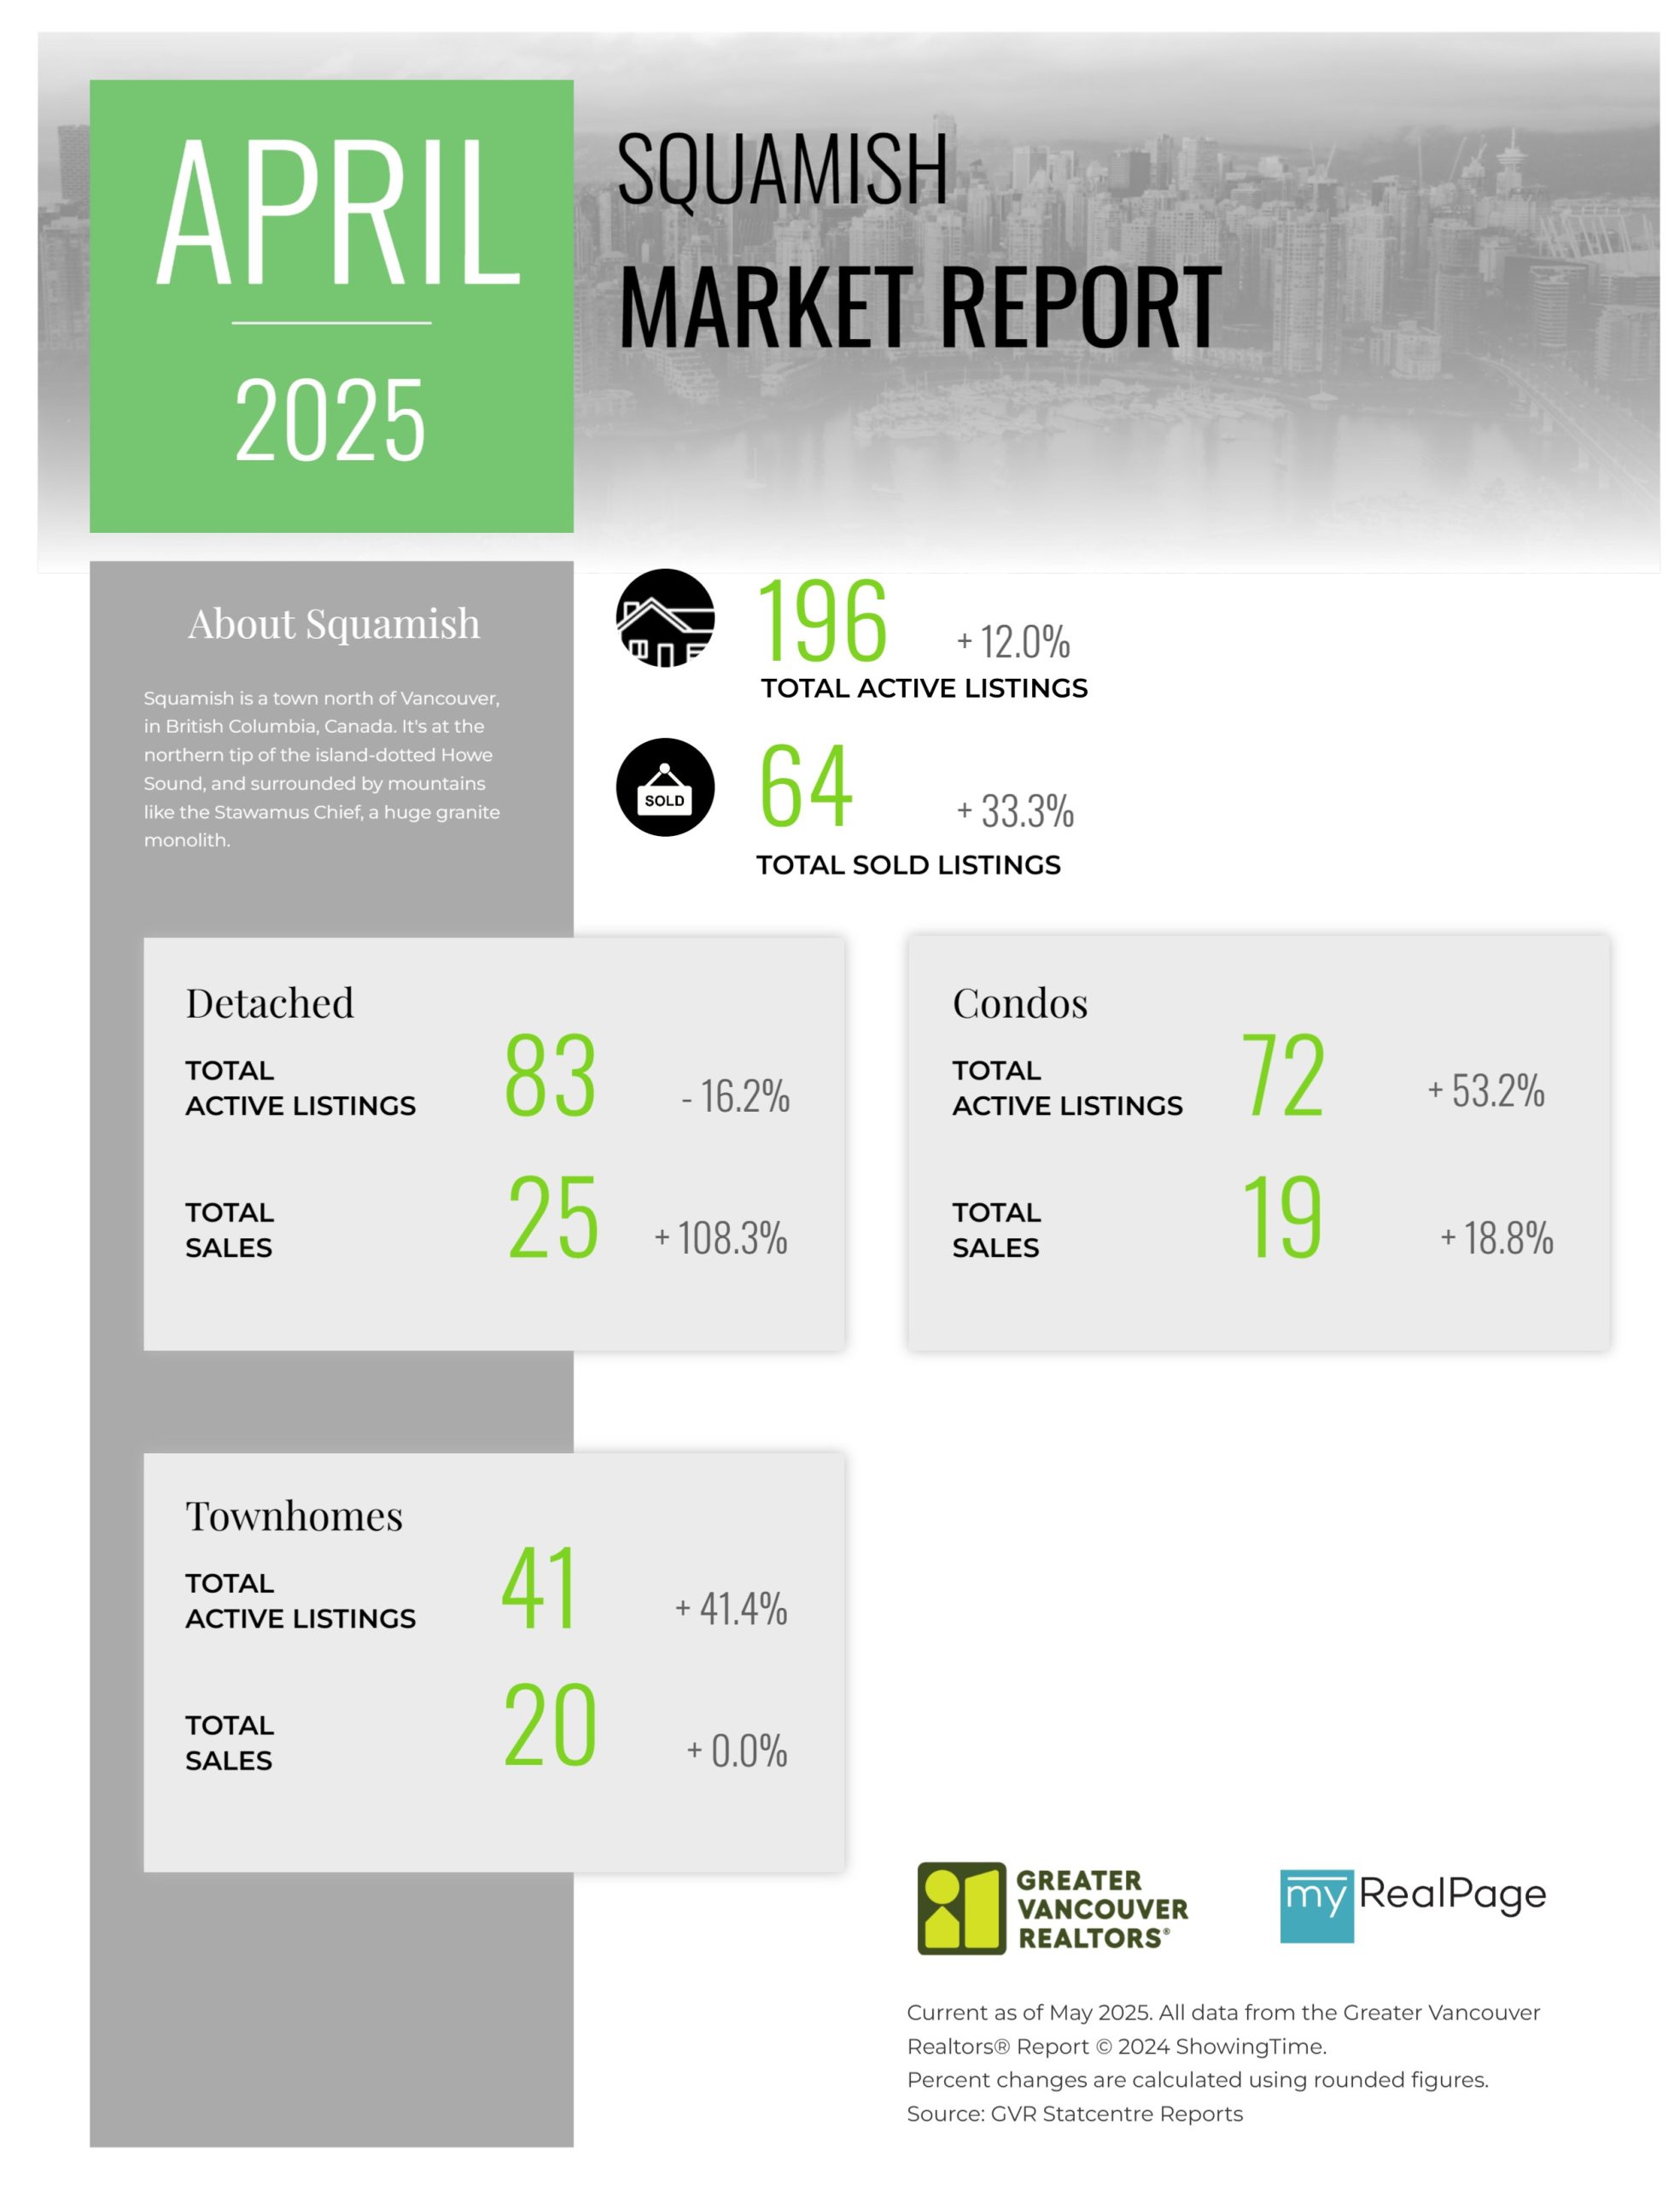
Printable Version – GVR April 2025 Data Infographics Report Squamish
Last Updated on May 14, 2025 by myRealPage
