INFOGRAPHICS: December 2025 GVR Greater Vancouver Market Reports

2025 saw lowest annual sales total in over two decades
Home sales registered in the Multiple Listing Service® (MLS®) in Metro Vancouver* finished the year down 10 per cent, marking the lowest annual sales total in over twenty years.
The Greater Vancouver REALTORS® (GVR) reports that residential sales in the region totalled 23,800 in 2025, a 10.4 per cent decrease from the 26,561 sales recorded in 2024, and a 9.3 per cent decrease from the 26,249 sales in 2023.
Last year’s sales total was 24.7 per cent below the 10-year annual sales average (31,625).
“This year was one for the history books. Although the sales total was the lowest in over two decades, Realtors were still busy listing properties. Sellers brought the highest total of listings to market on record since the mid-1990s, eclipsing the previous record high in 2008 by a little over 1,000 listings.” Andrew Lis, GVR chief economist and vice-president data analytics
Read the full report on the REBGV website!
The following data is a comparison between December 2025 and December 2024 numbers, and is current as of January of 2026. For last month’s update, you can check out our previous post!
Or follow this link for all our GVR Infographics!
These infographics cover current trends in several areas within the Greater Vancouver region. Click on the images for a larger view!
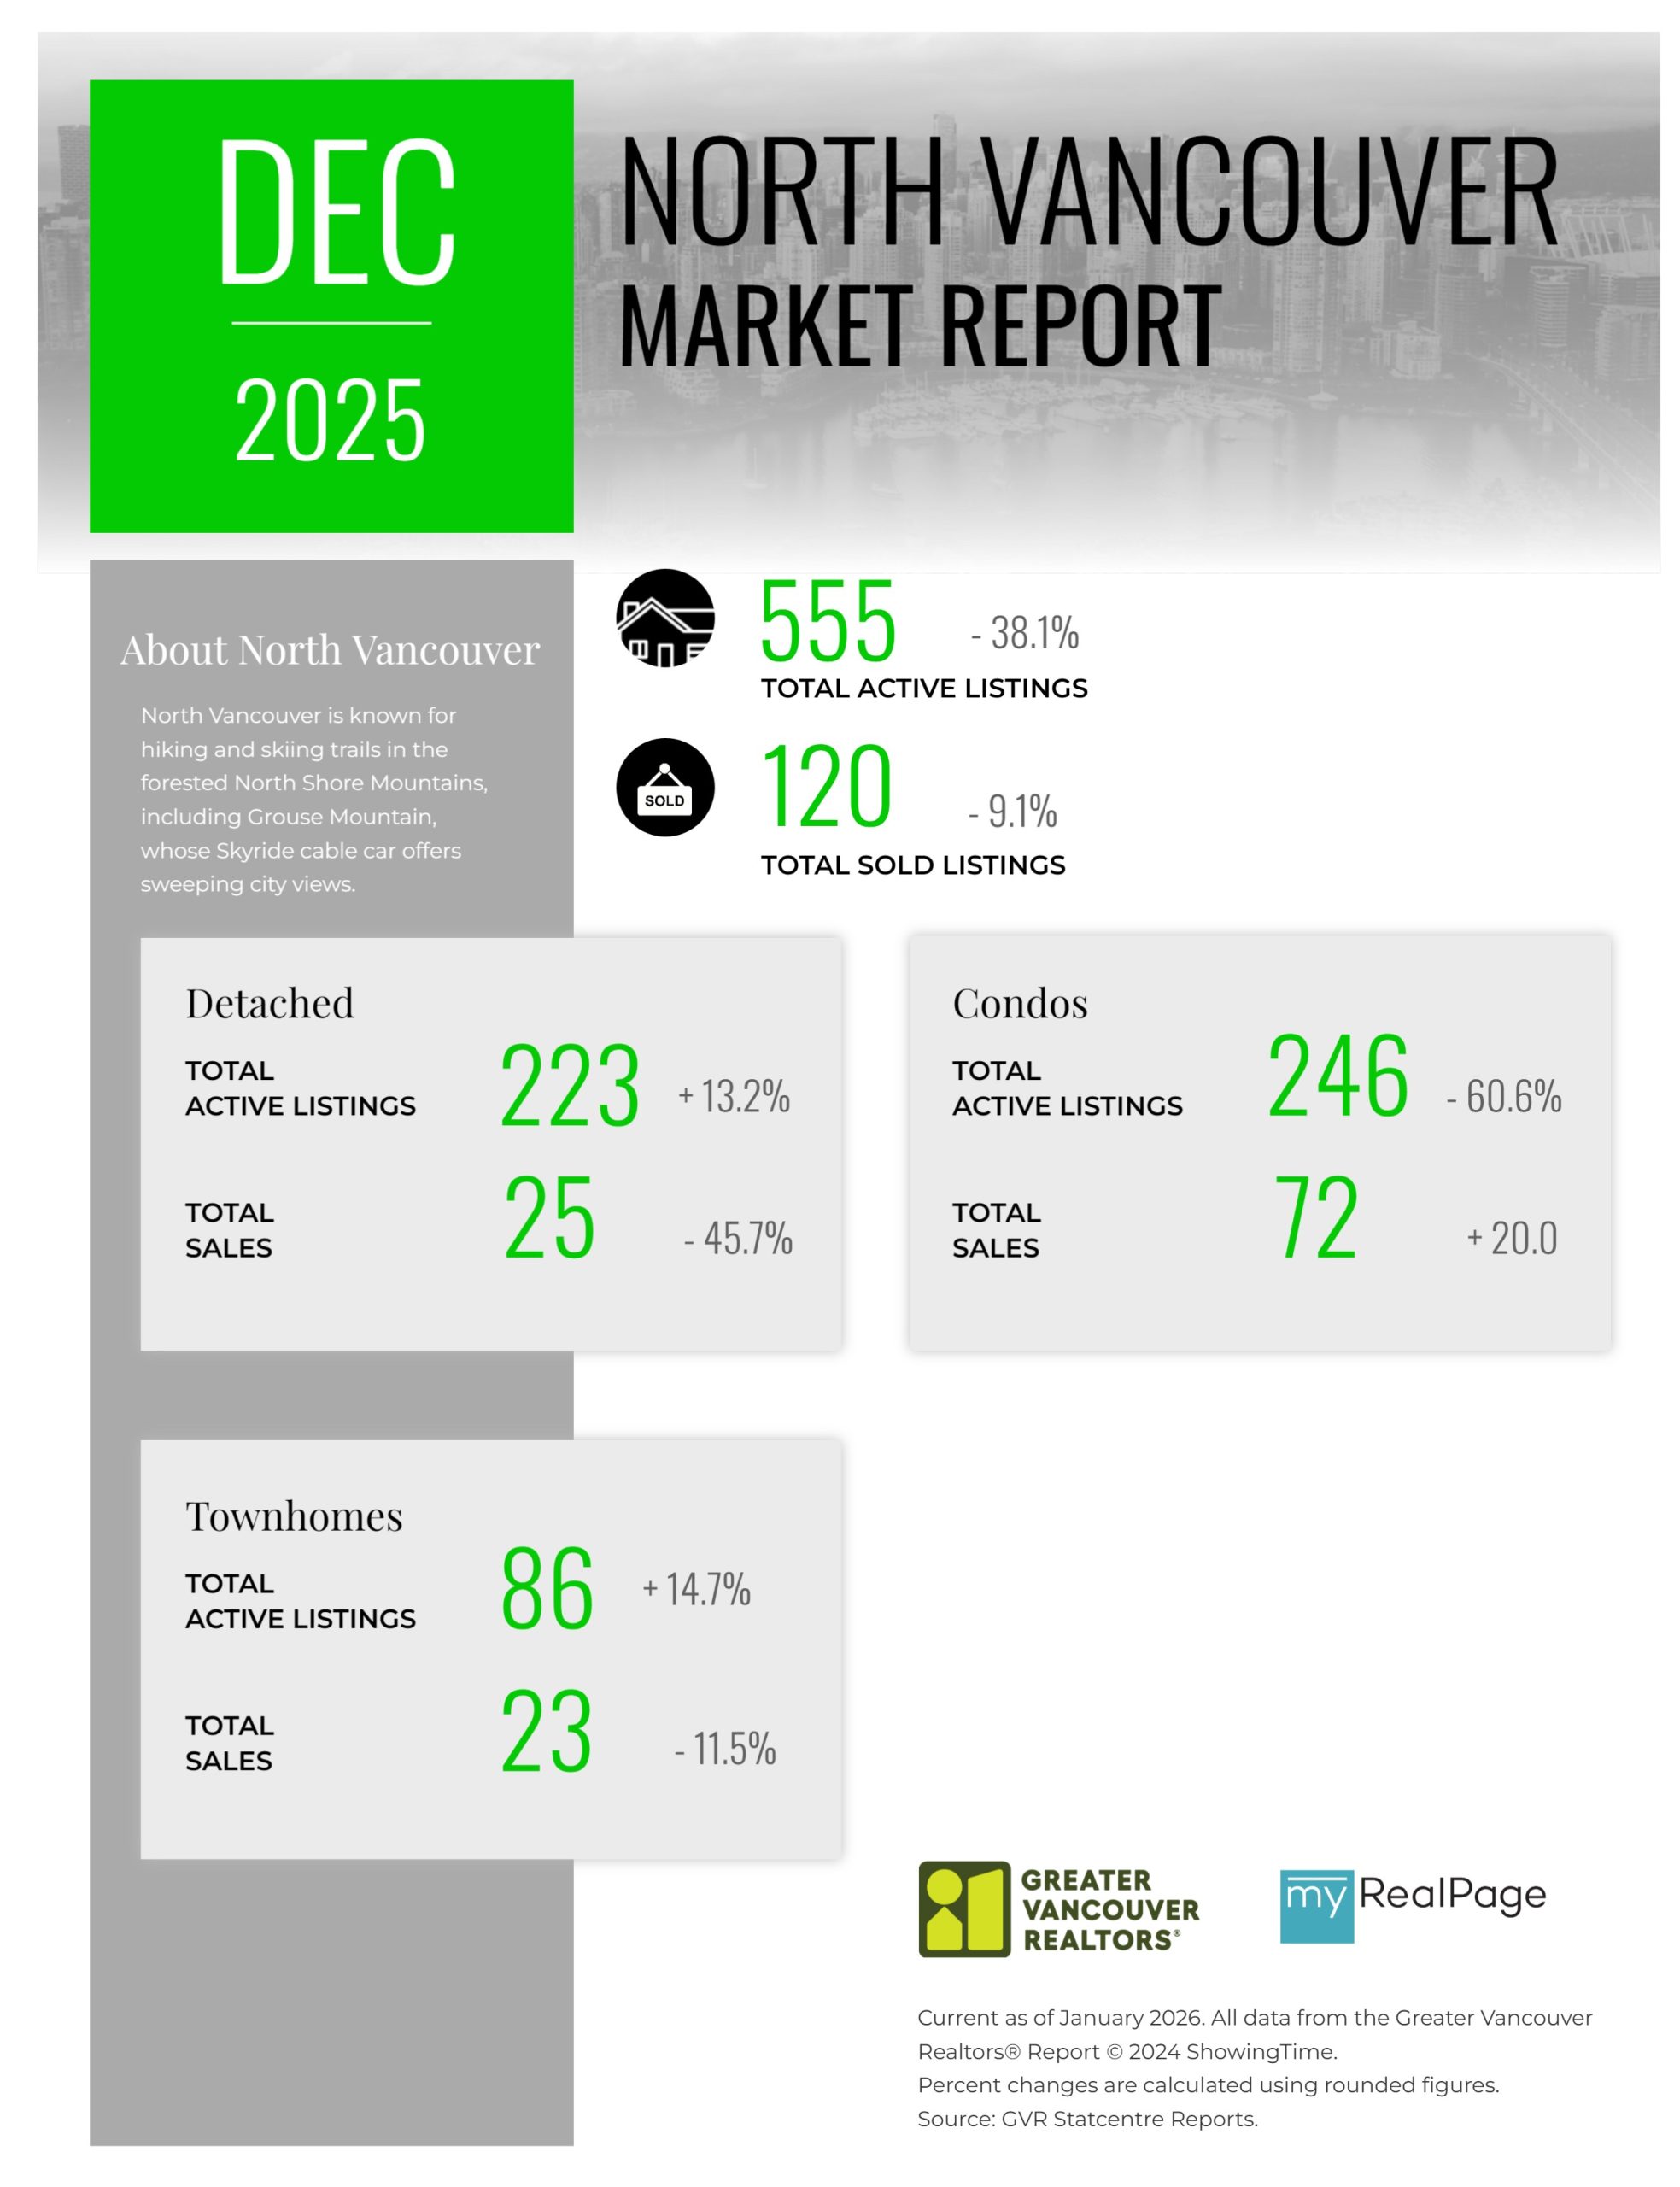
Printable Version – GVR December 2025 Data Infographic Report North Vancouver
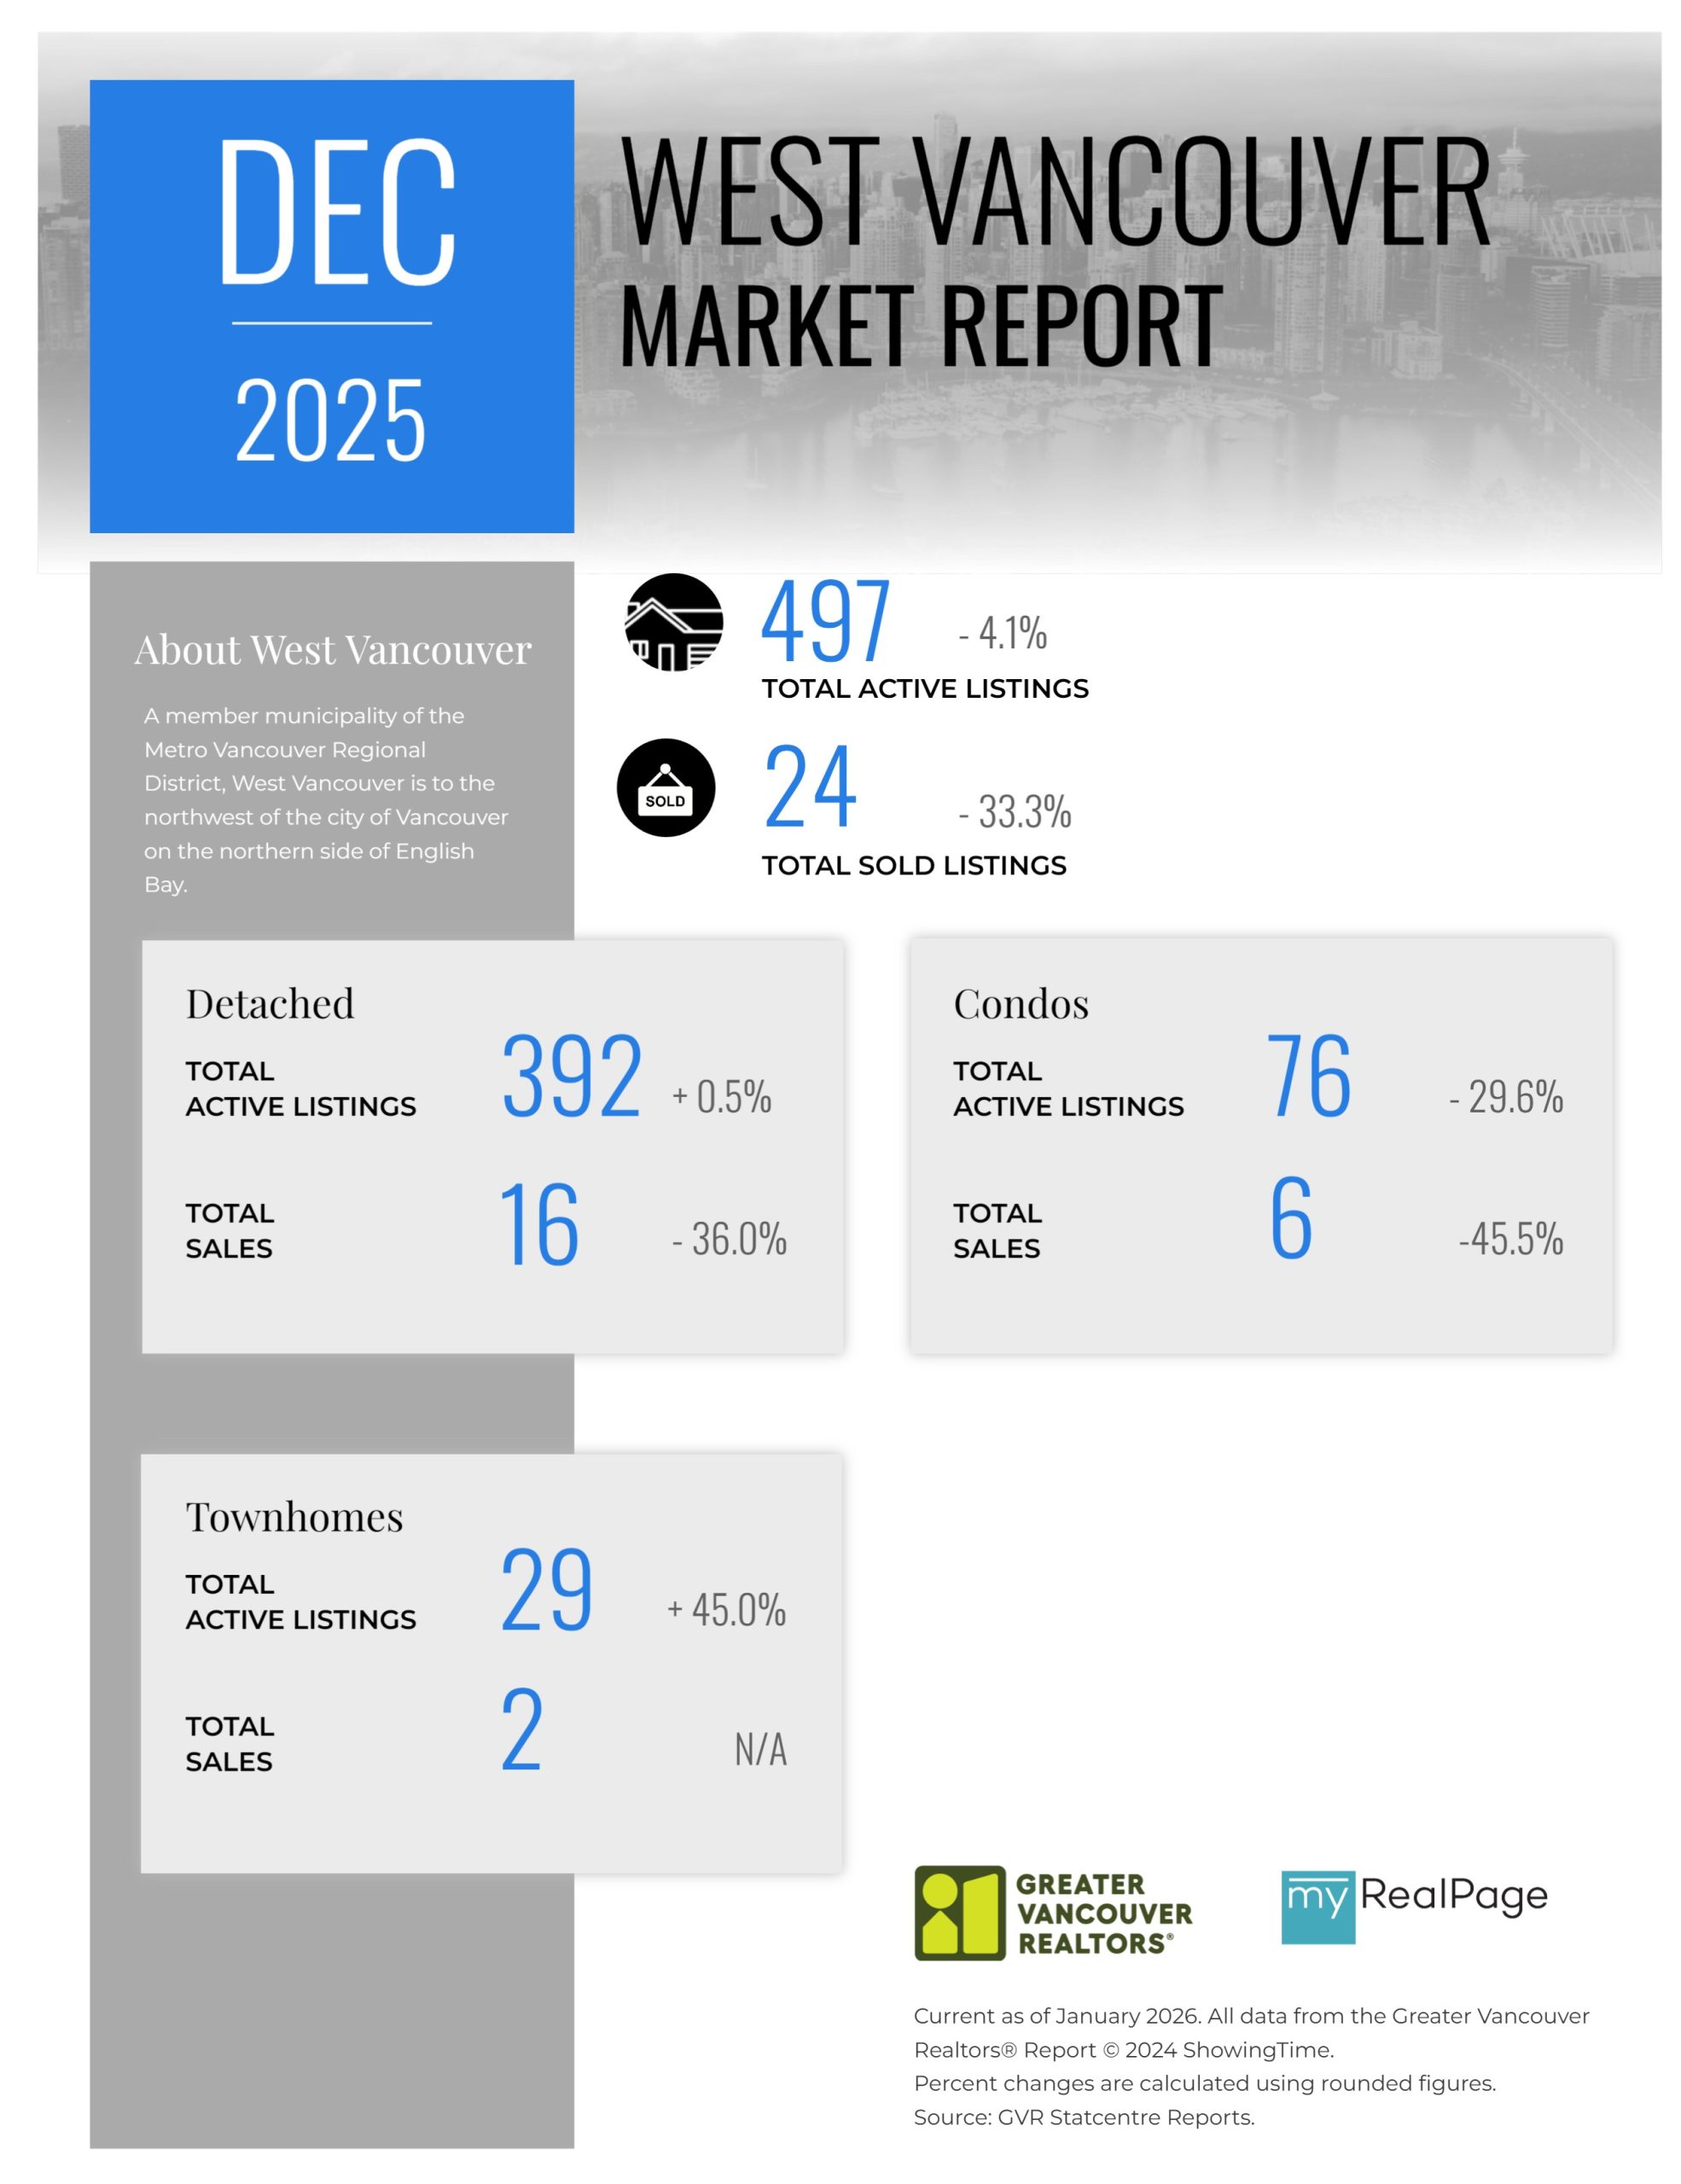
Printable Version – GVR December 2025 Data Infographics Report West Vancouver
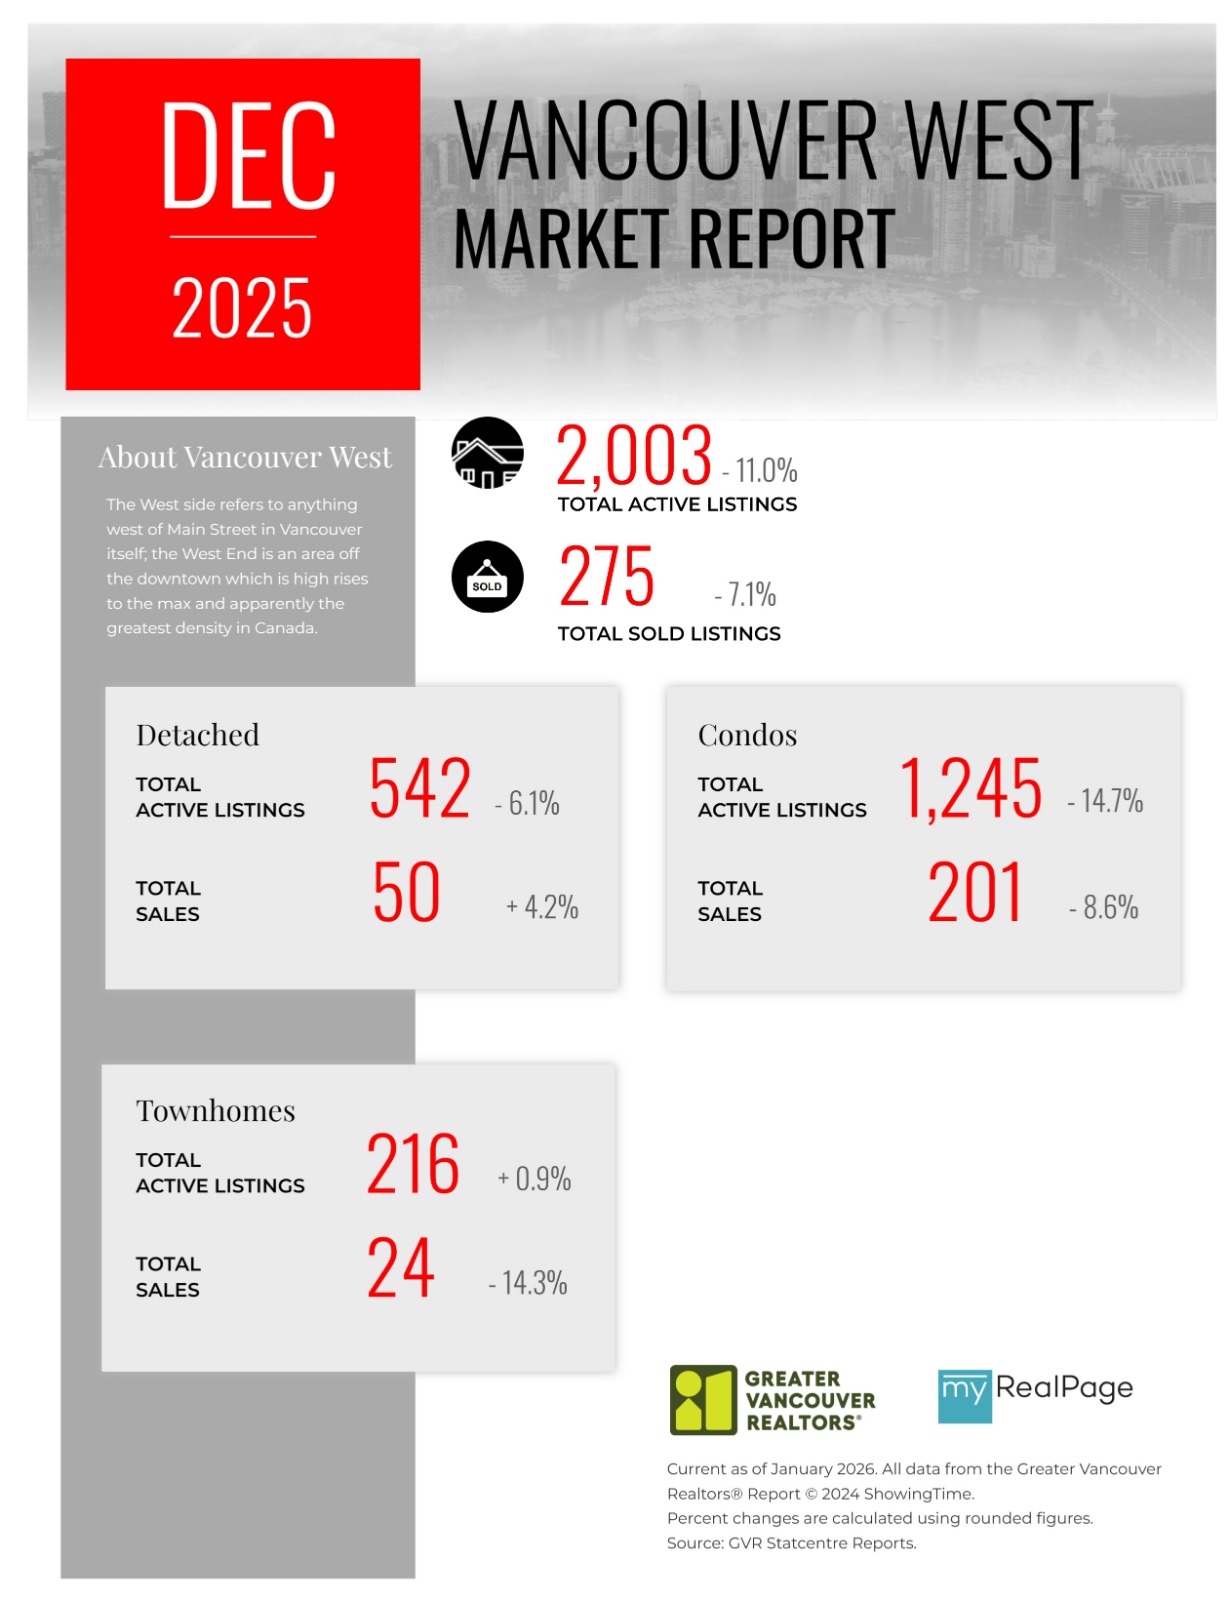
Printable Version – GVR December 2025 Data Infographics Report Vancouver West
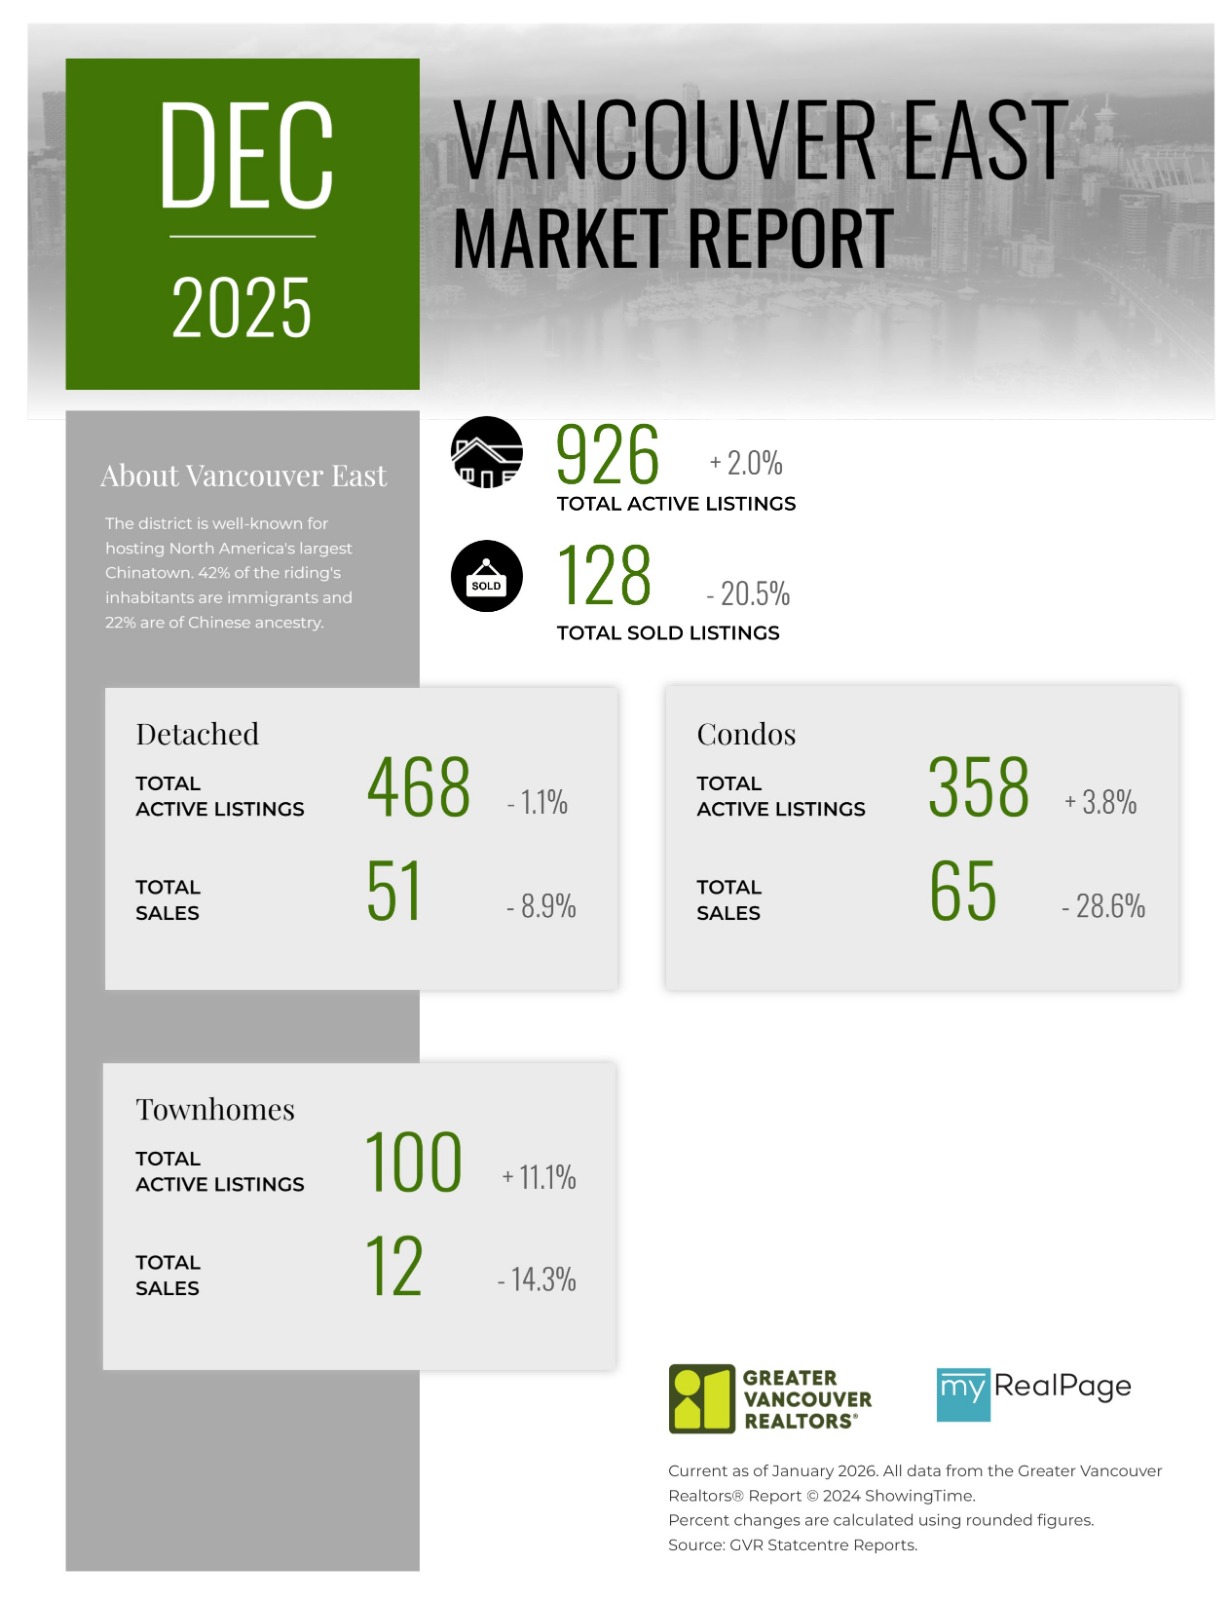
Printable Version – GVR December 2025 Data Infographics Report Vancouver East
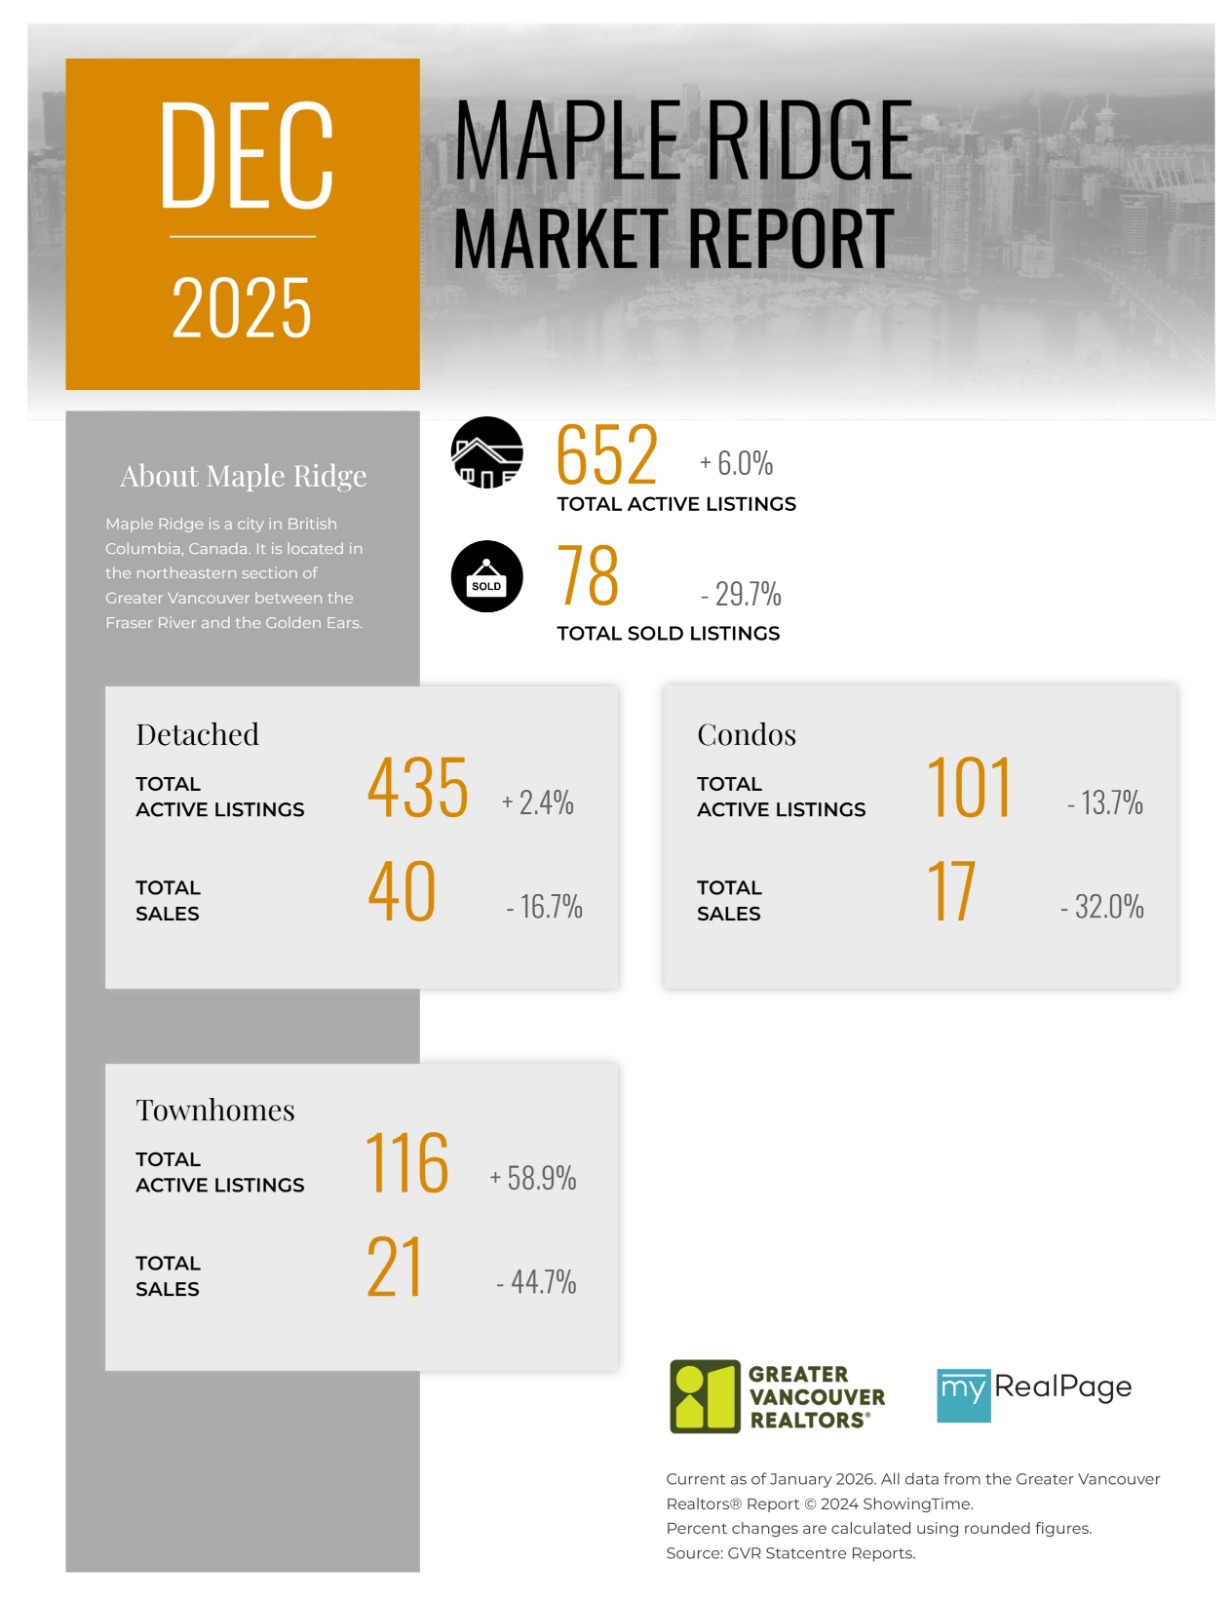
Printable Version – GVR December 2025 Data Infographic Report Maple Ridge
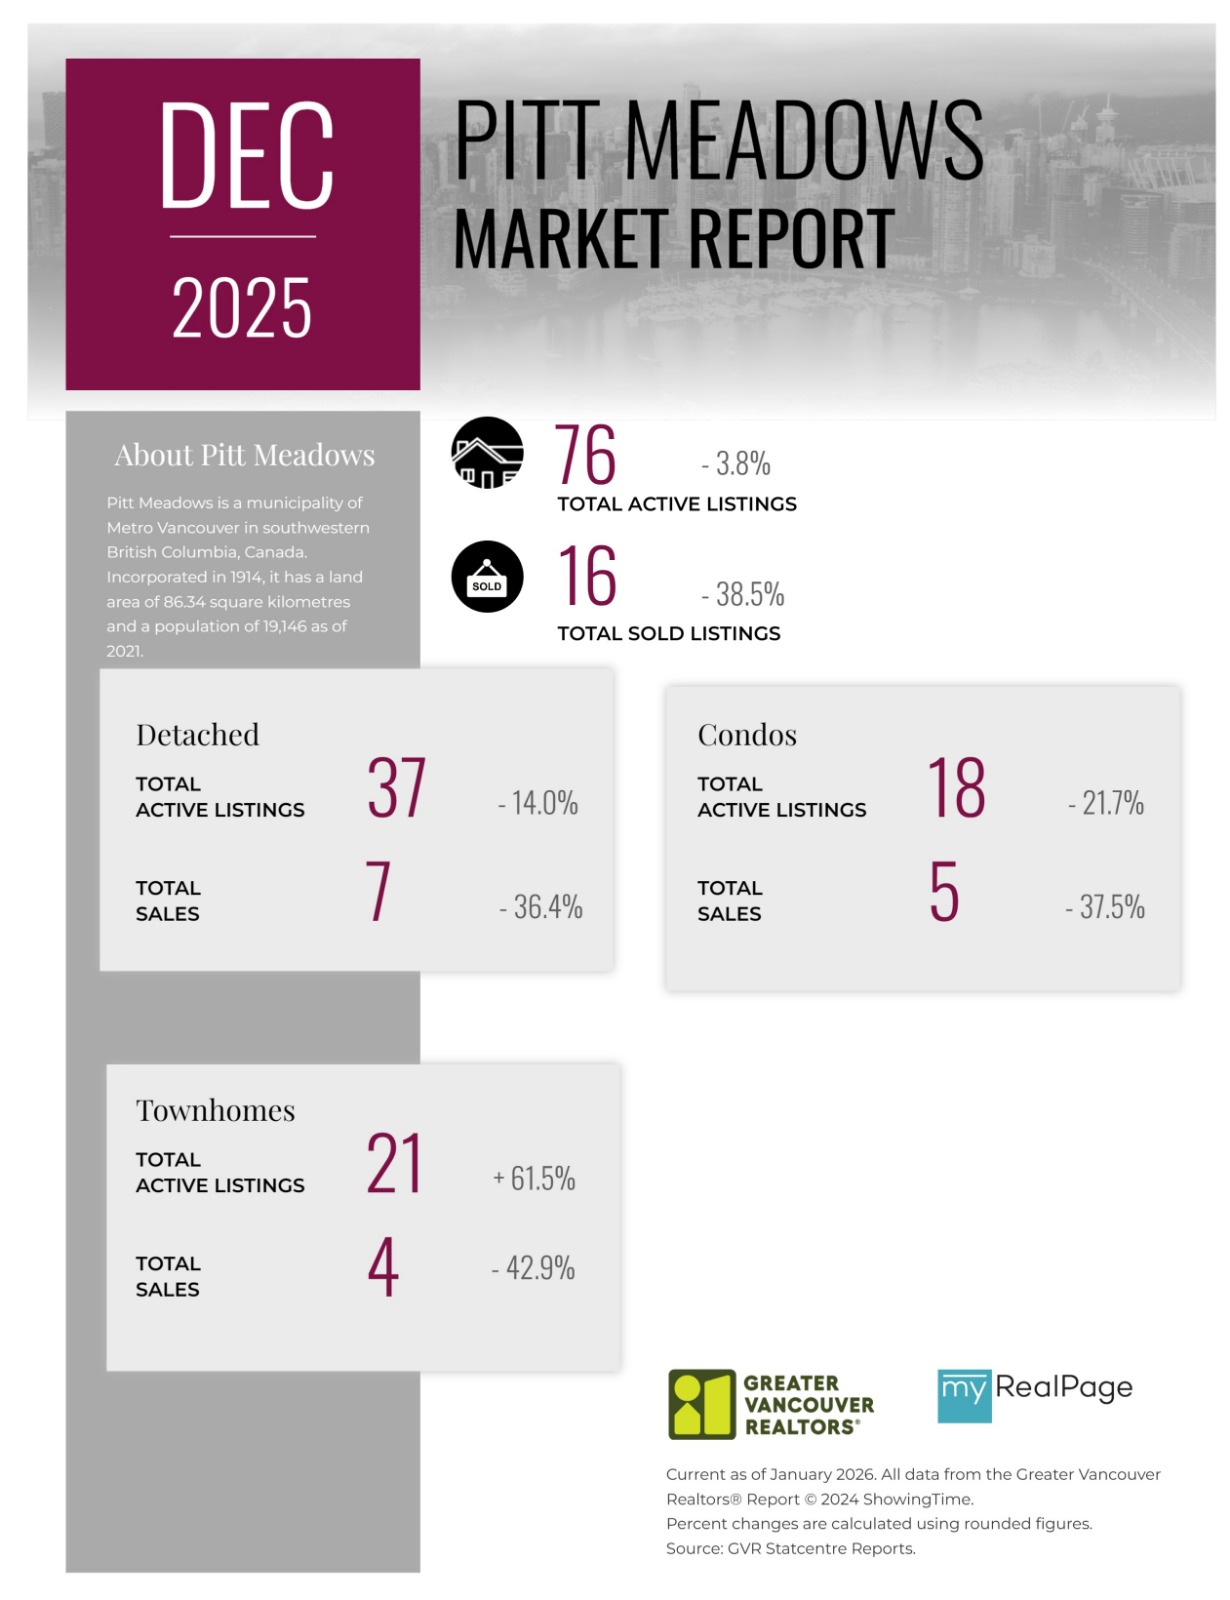
Printable Version – GVR December 2025 Data Infographics Report Pitt Meadows
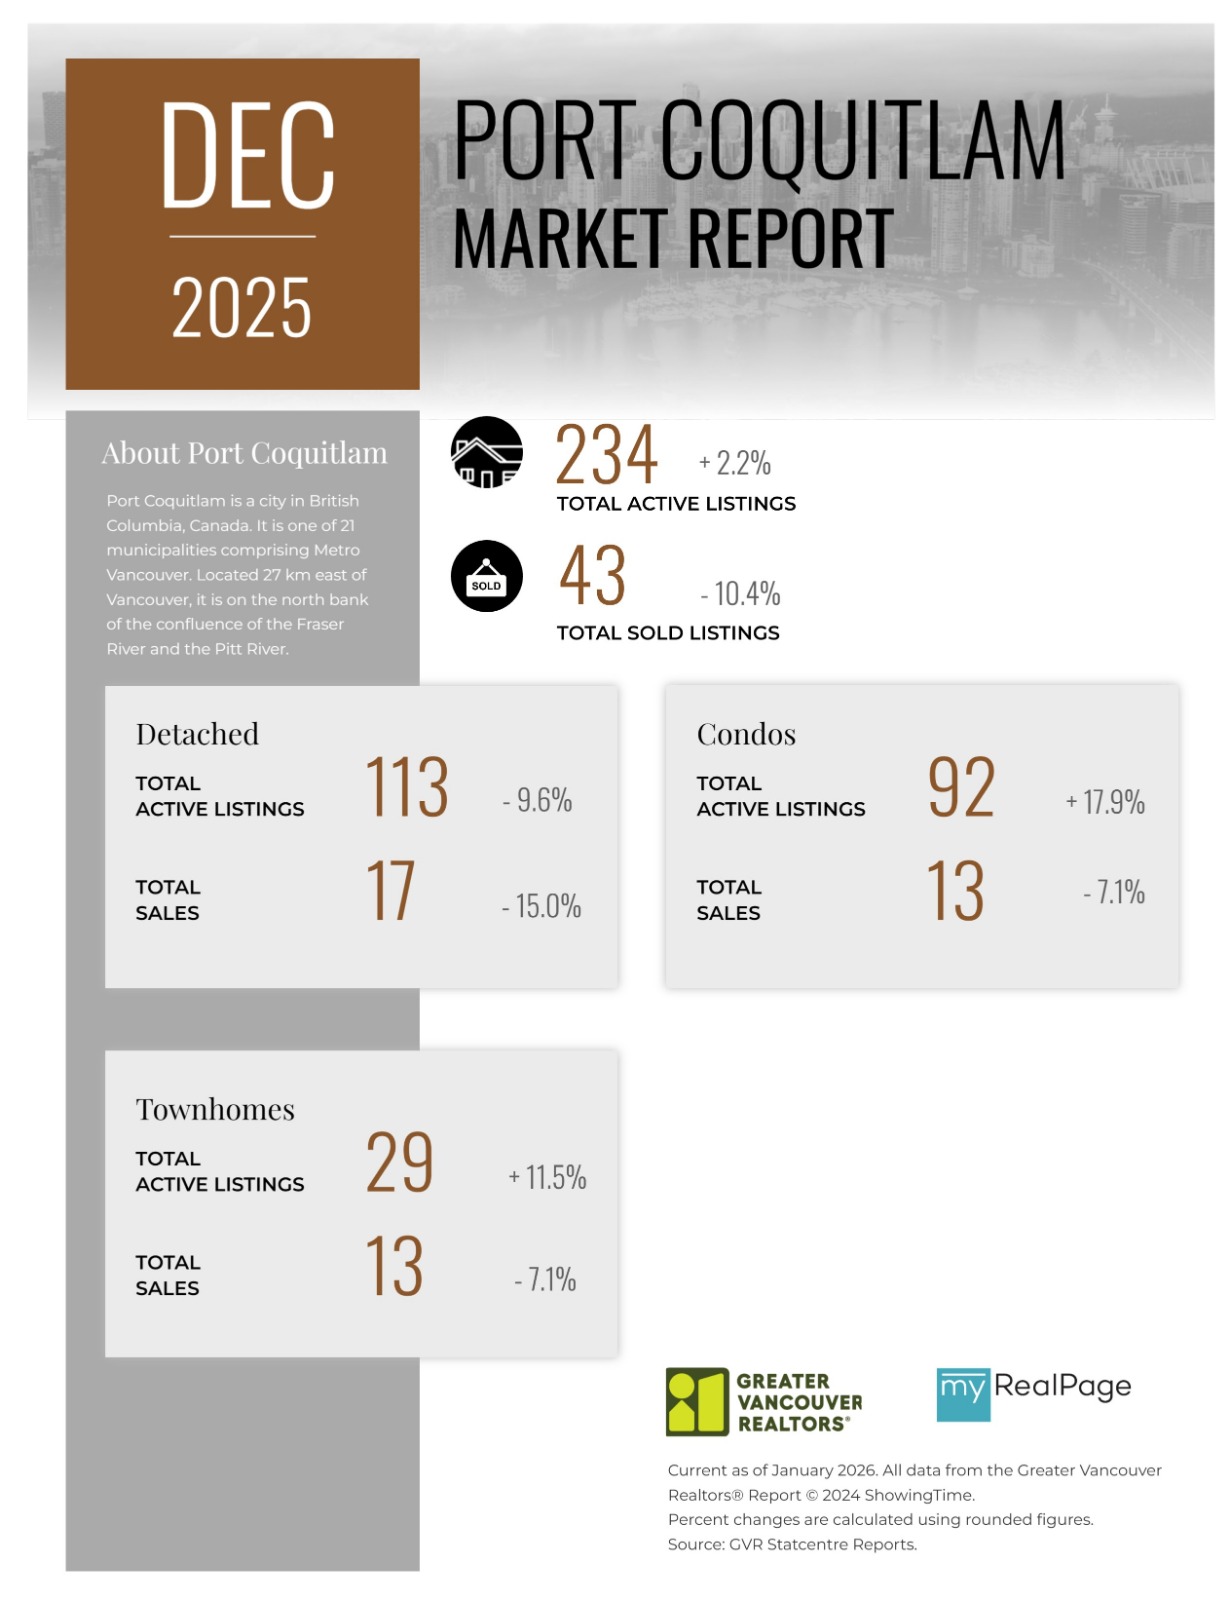
Printable Version – GVR December 2025 Data Infographics Report Port Coquitlam
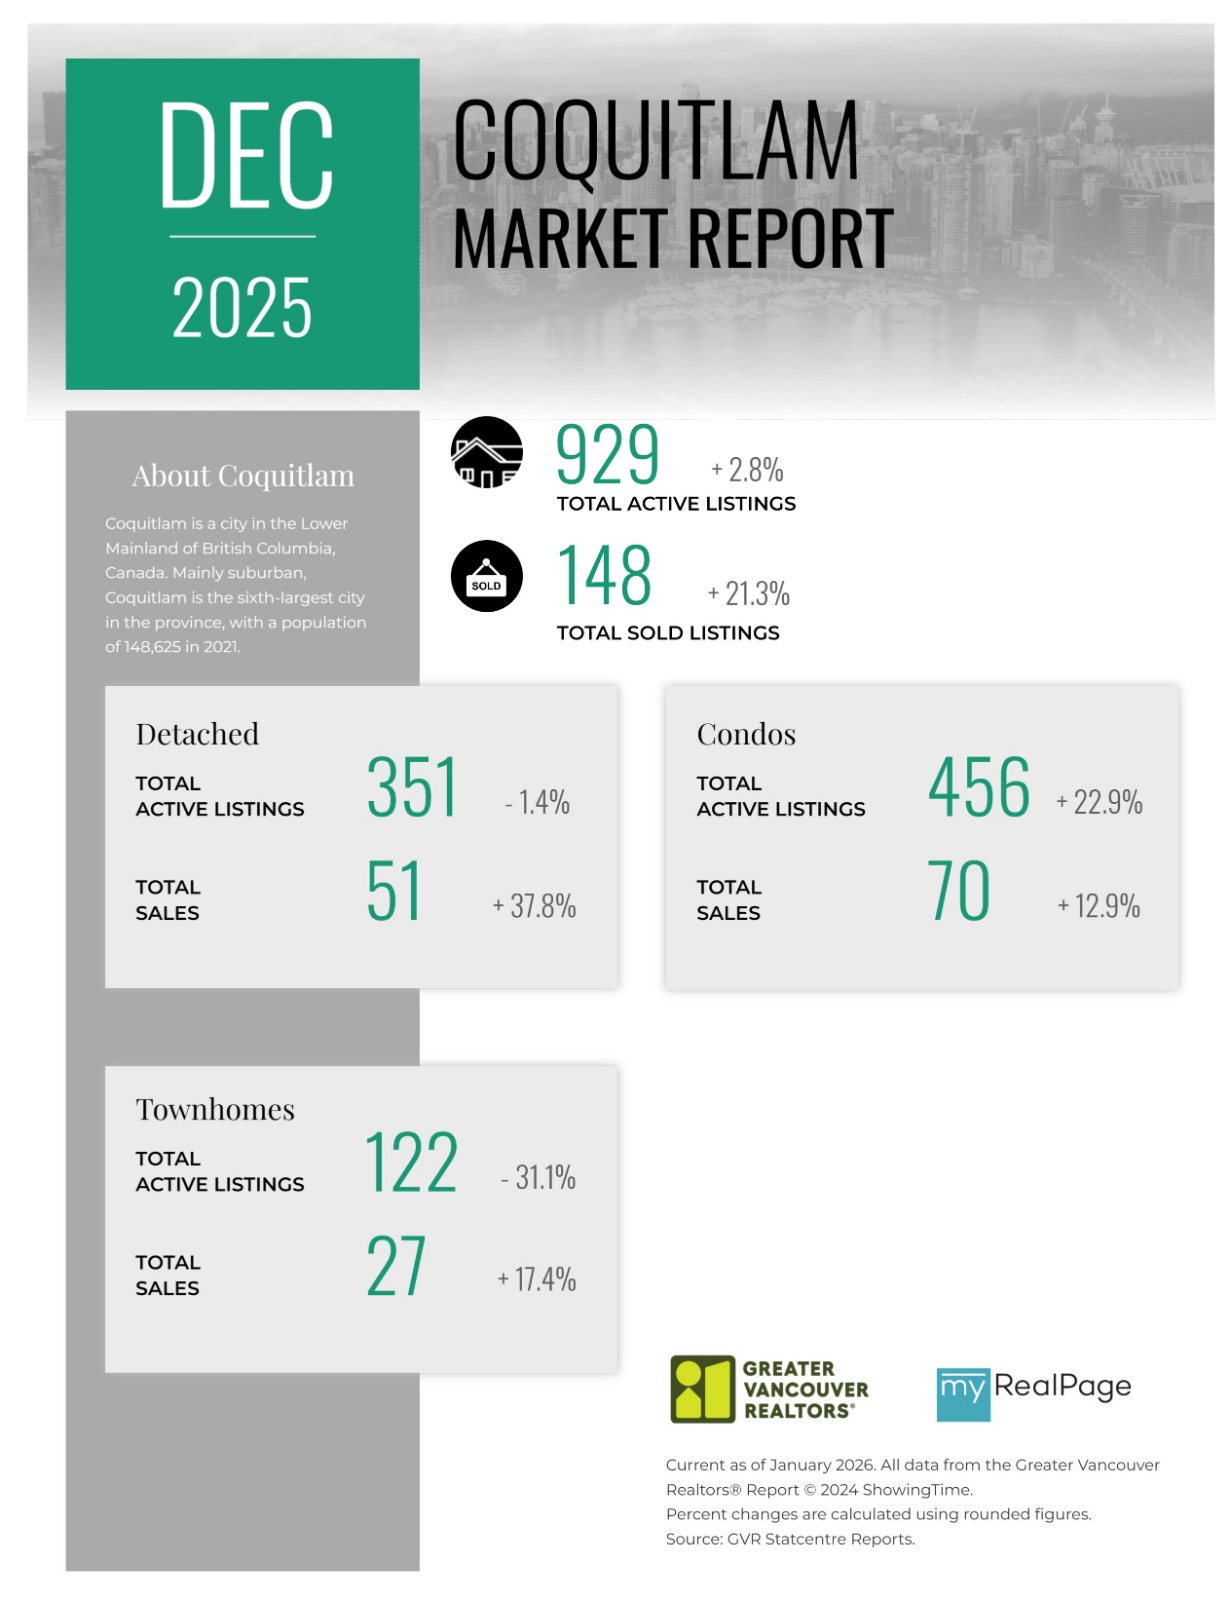
Printable Version – GVR December 2025 Data Infographics Report Coquitlam
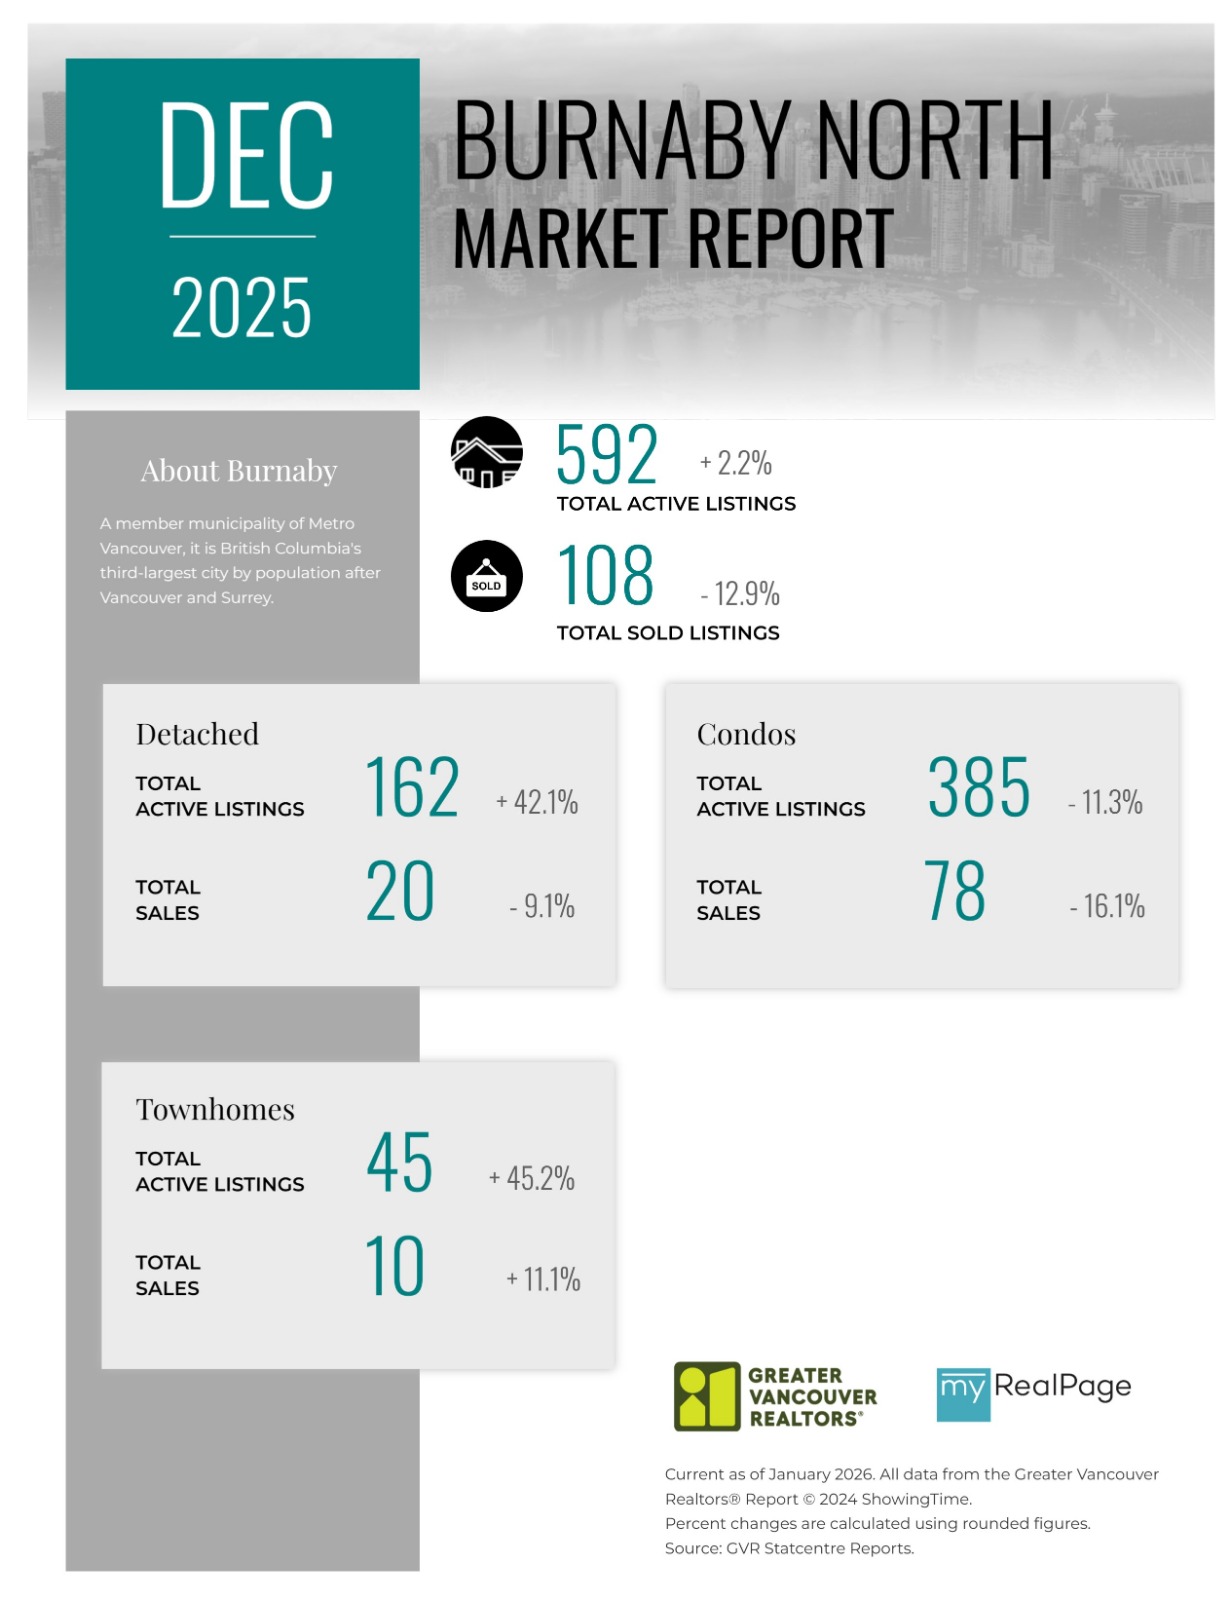
Printable Version – GVR December 2025 Data Infographic Report Burnaby North
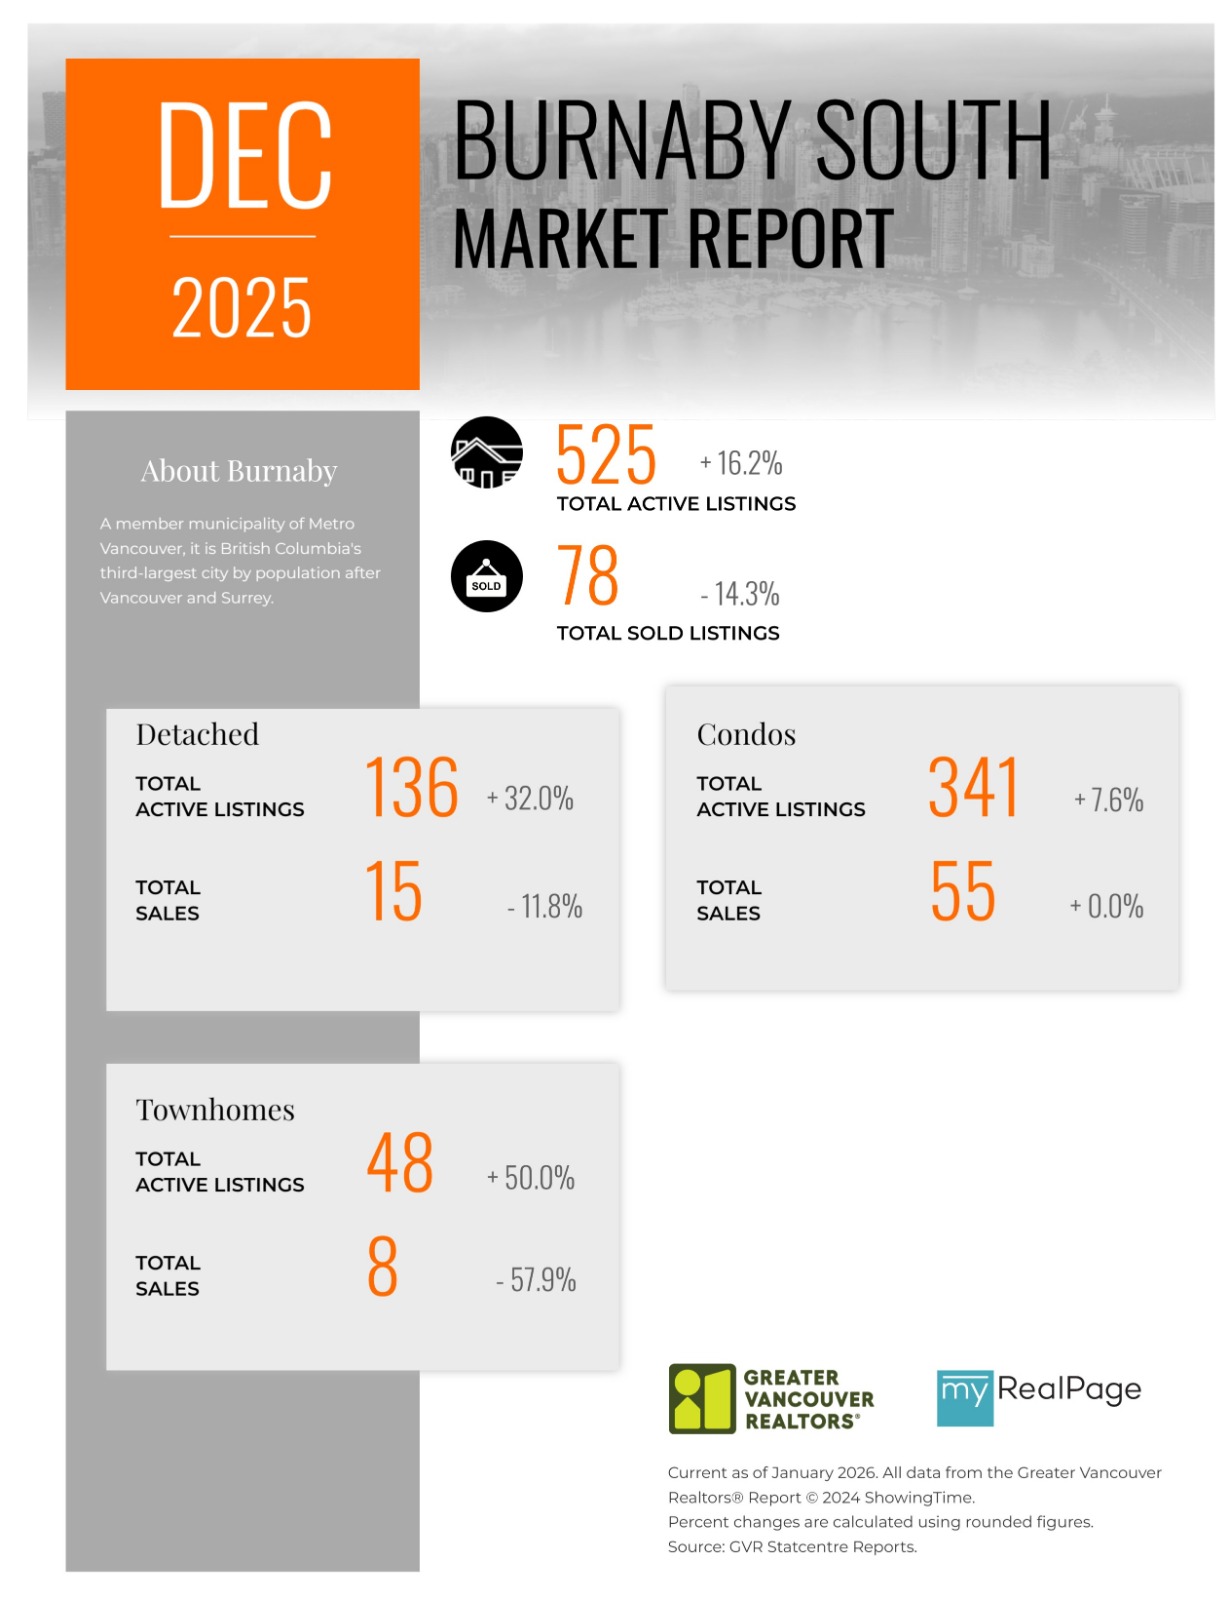
Printable Version – GVR December 2025 Data Infographics Report Burnaby South
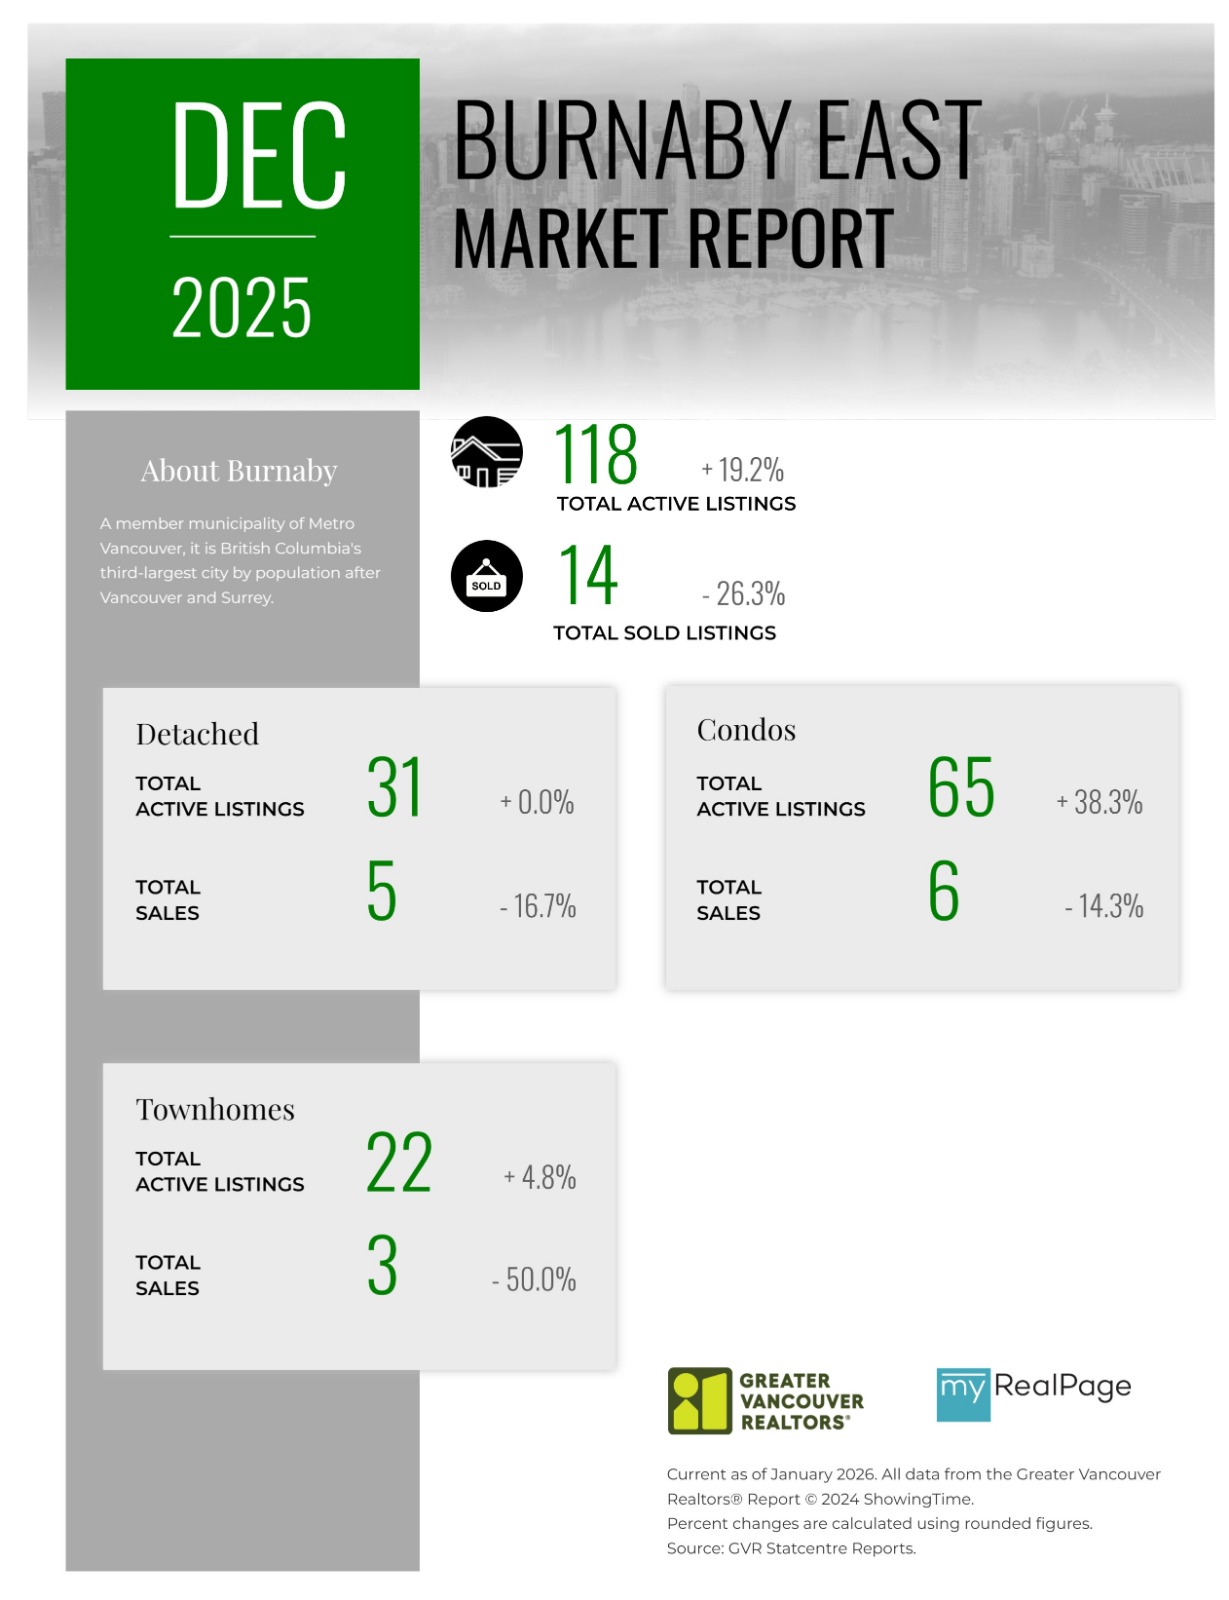
Printable Version – GVR December 2025 Data Infographics Report Burnaby East
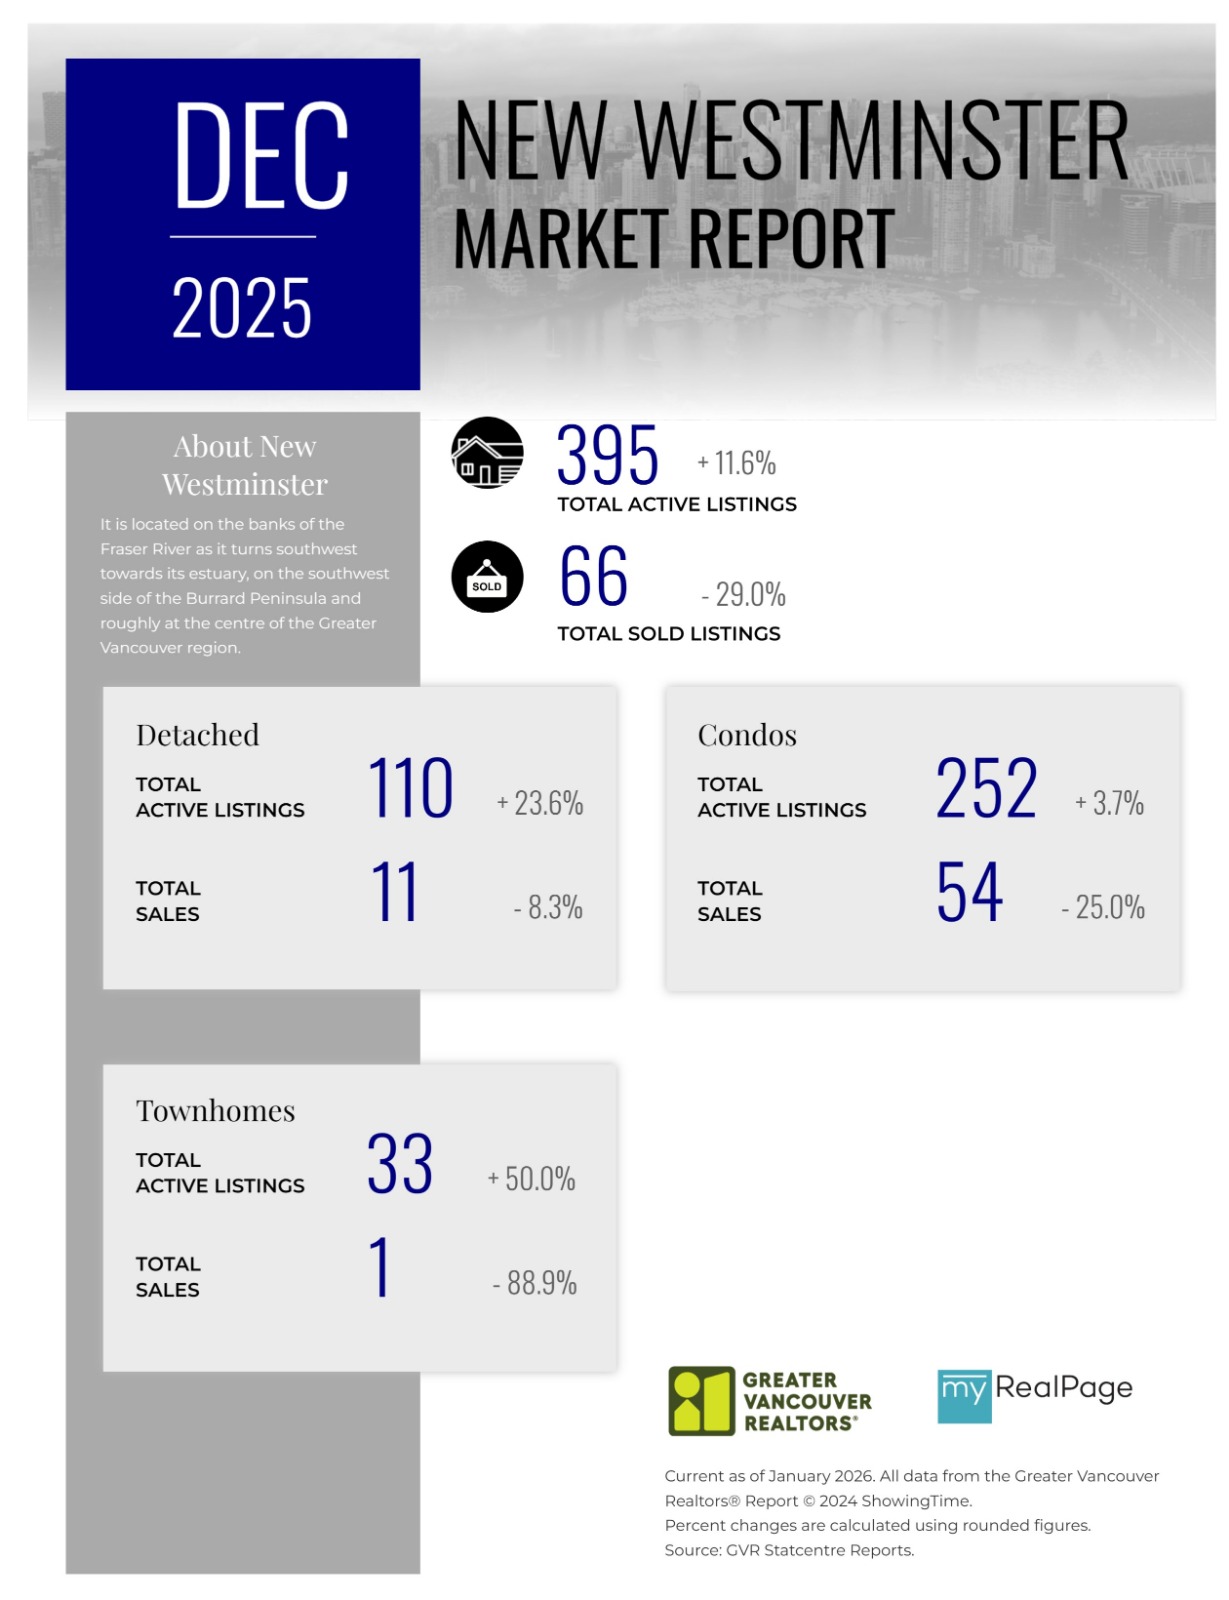
Printable Version – GVR December 2025 Data Infographics Report New Westminster
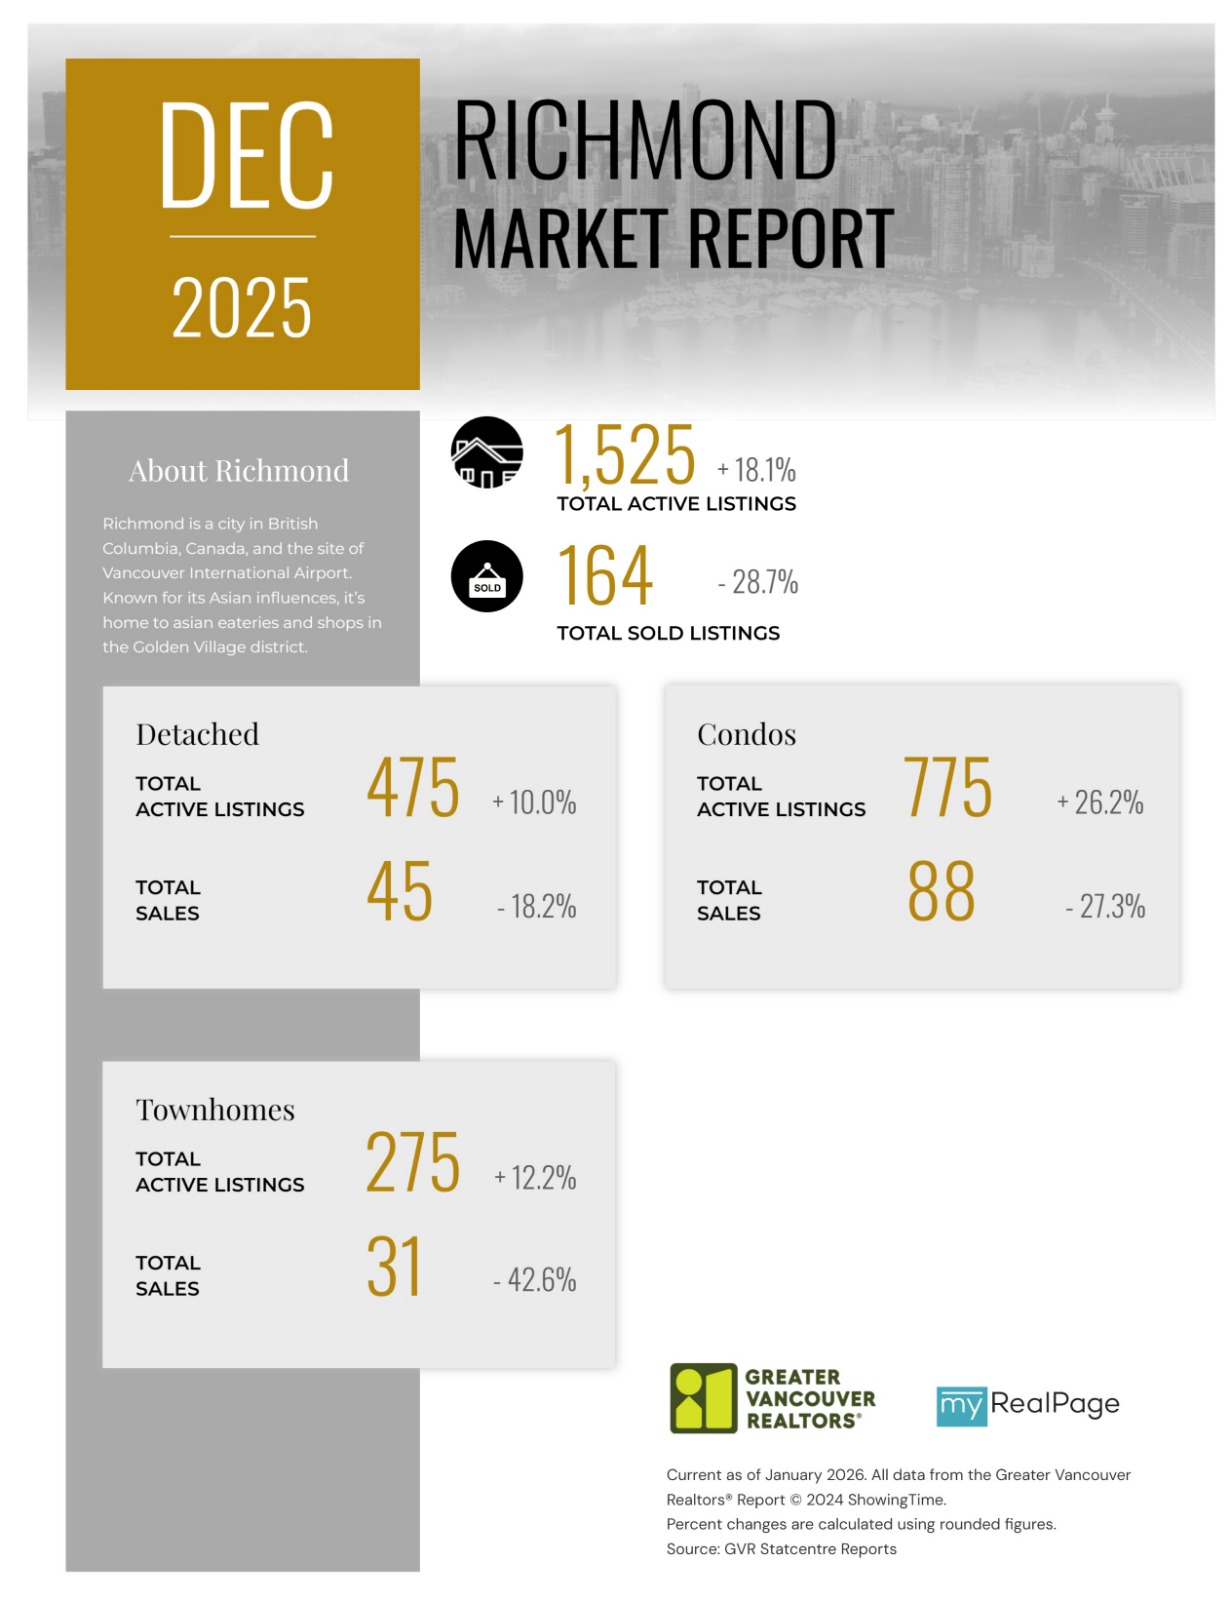
Printable Version – GVR December 2025 Data Infographics Report Richmond
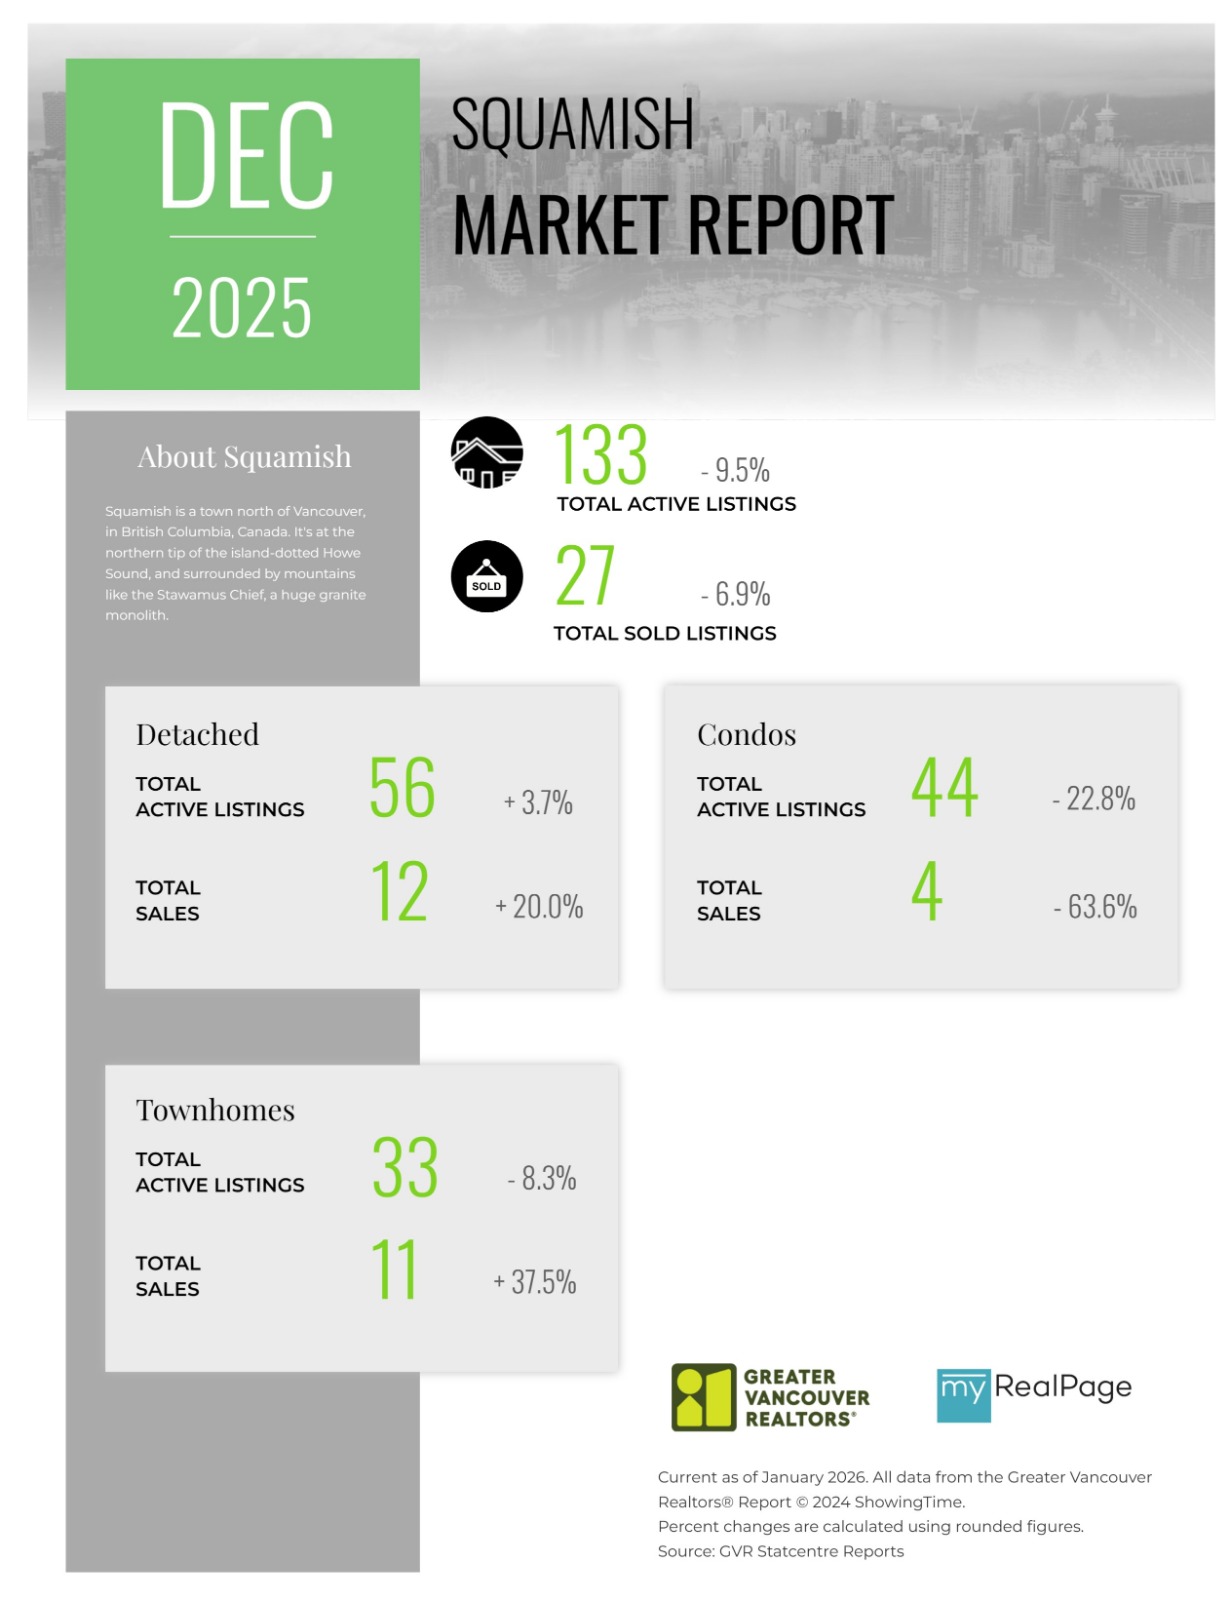
Printable Version – GVR December 2025 Data Infographics Report Squamish
Last Updated on January 9, 2026 by myRealPage
