INFOGRAPHICS: June 2025 GVR Greater Vancouver Market Reports

Home sale trend stabilizing in June
After a turbulent first half of the year, home sales registered on the MLS® across Metro Vancouver are showing emerging signs of a recovery, down ten per cent year-over-year – halving the decline seen last month.
The Greater Vancouver REALTORS® (GVR) reports that residential sales in the region totalled 2,181 in June 2025, a 9.8 per cent decrease from the 2,418 sales recorded in June 2024. This was 25.8 per cent below the 10-year seasonal average (2,940).
“On a trended basis, signs are emerging that sales activity is rounding the corner after a challenging first half to the year, with the year-over-year decline in sales in June halving the decline we saw in May. If this momentum continues, it may not be long before sales are up year-over-year, which would mark a shift toward a market with more demand than the unusually low demand we’ve seen so far this year.” said Andrew Lis, GVR director of economics and data analytics
Read the full report on the REBGV website!
The following data is a comparison between June 2025 and June 2024 numbers, and is current as of July of 2025. For last month’s update, you can check out our previous post!
Or follow this link for all our GVR Infographics!
These infographics cover current trends in several areas within the Greater Vancouver region. Click on the images for a larger view!
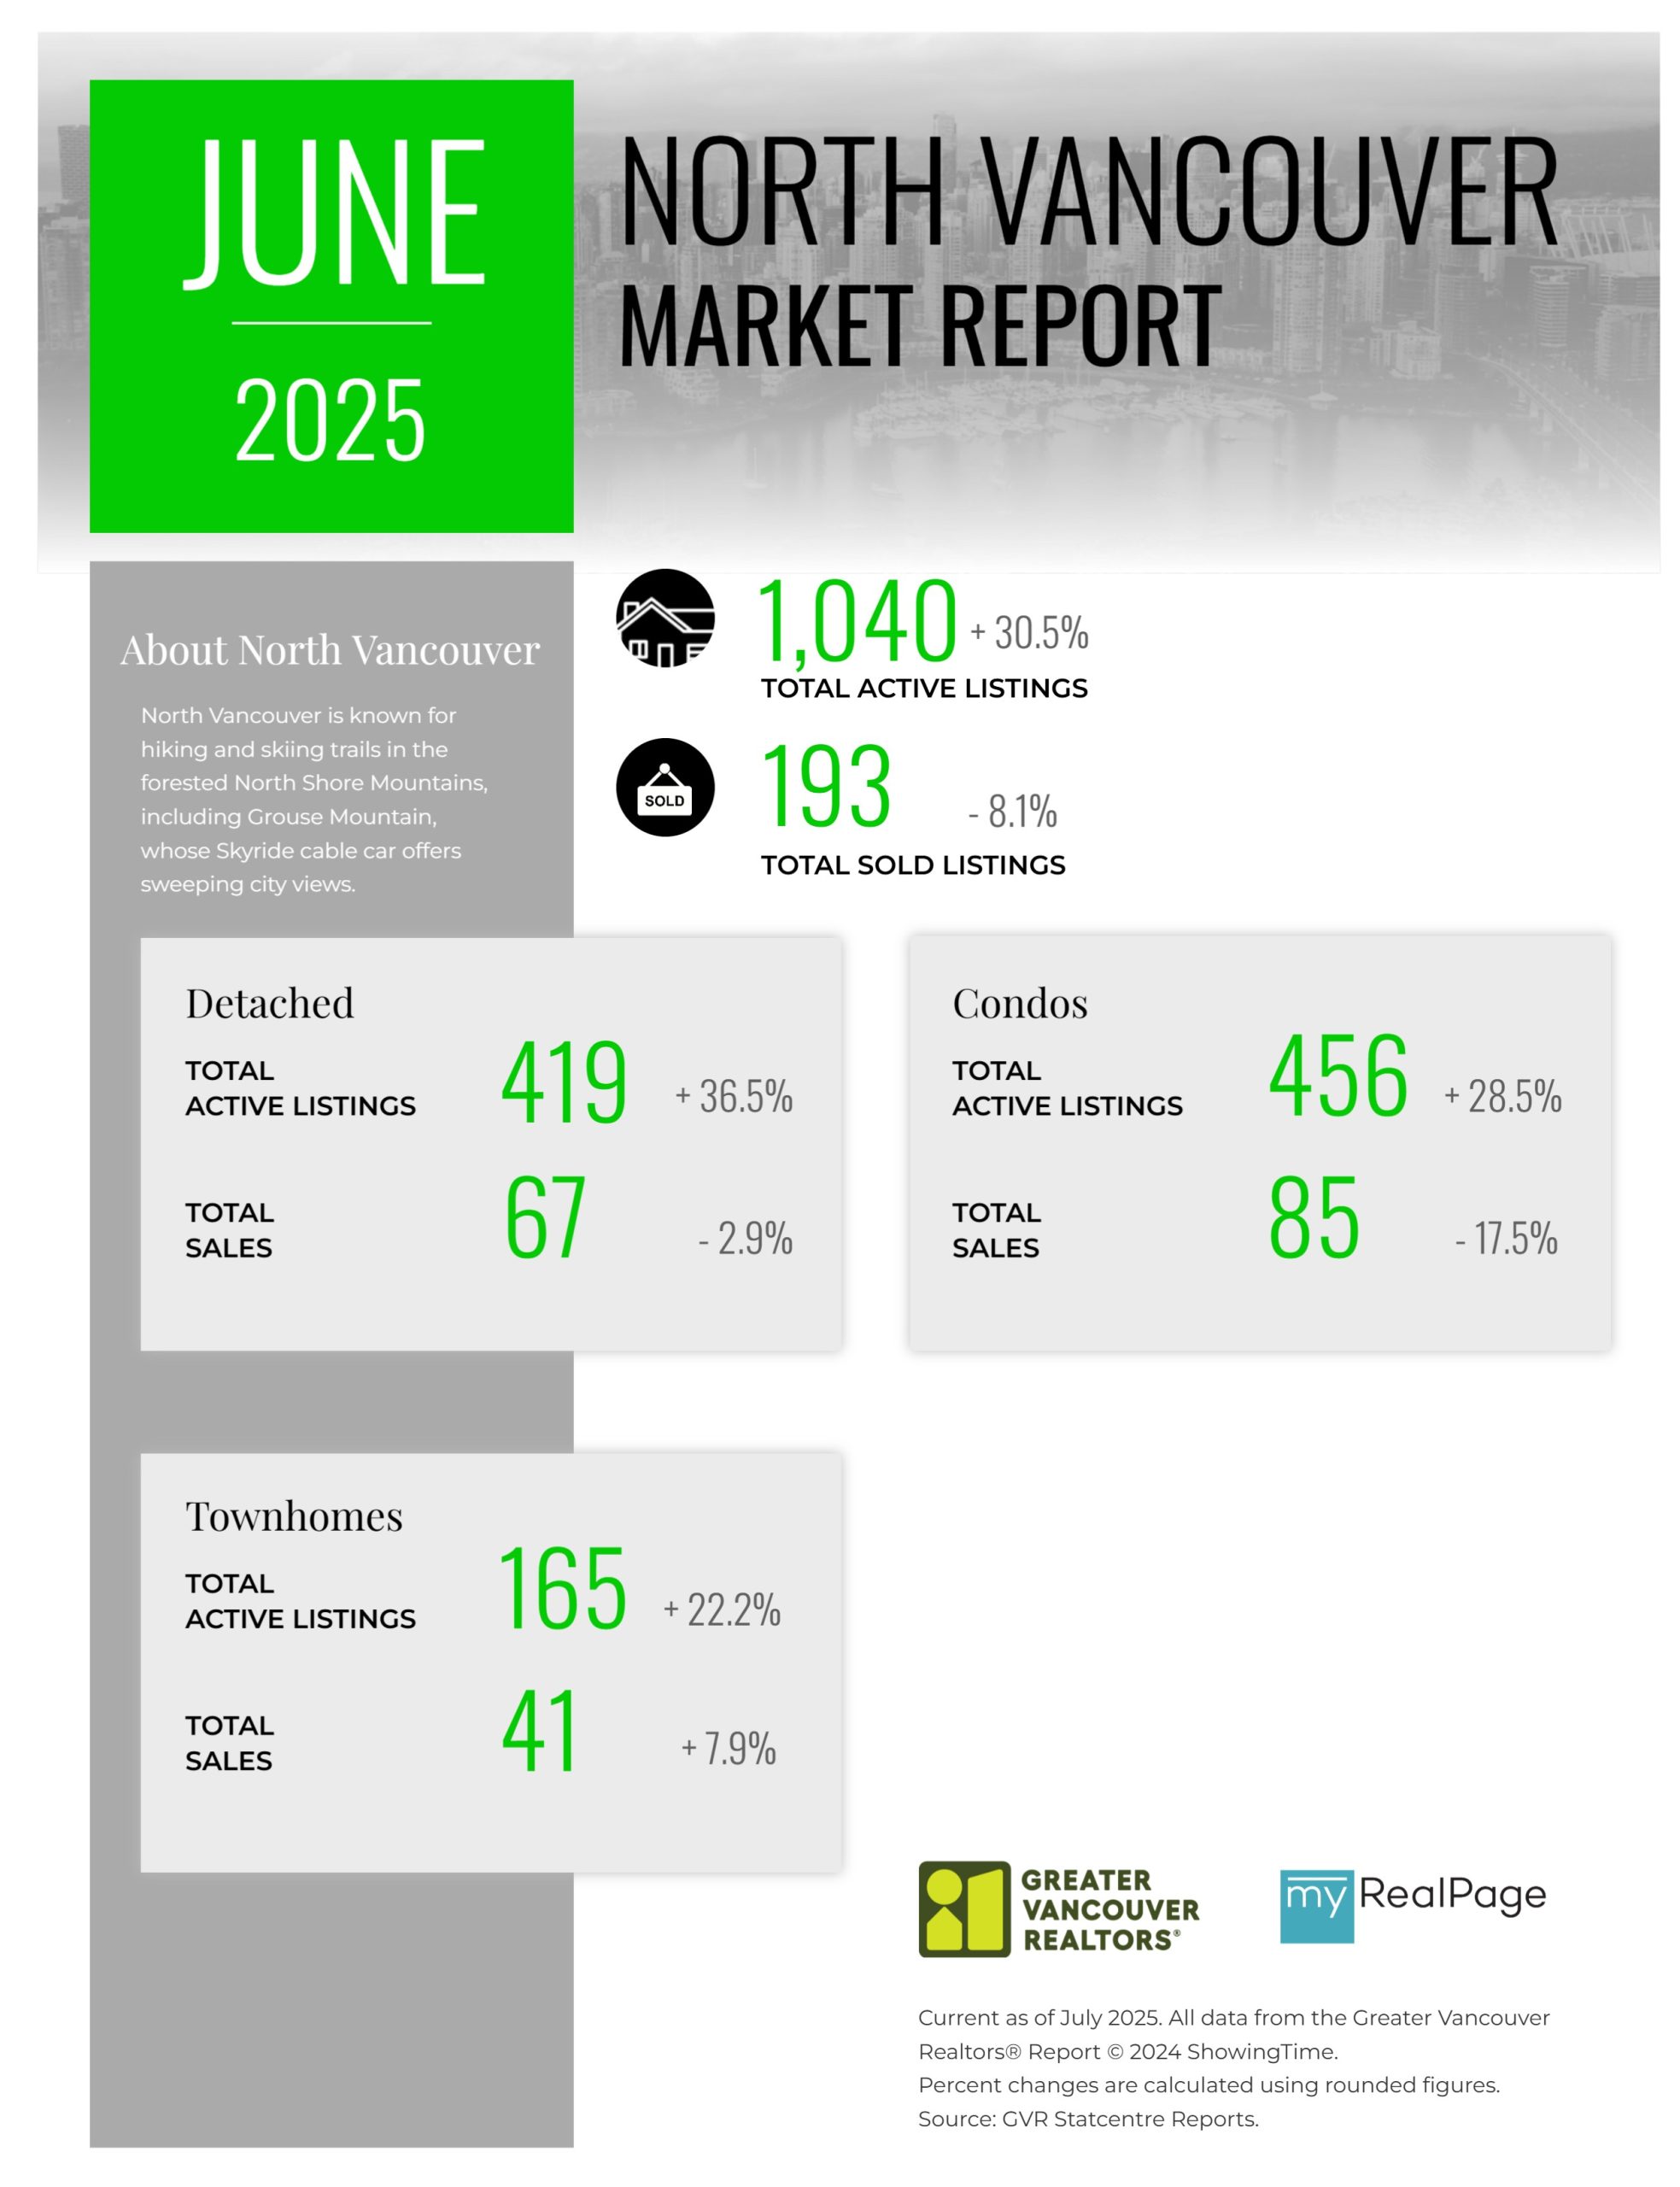
Printable Version – GVR June 2025 Data Infographic Report North Vancouver
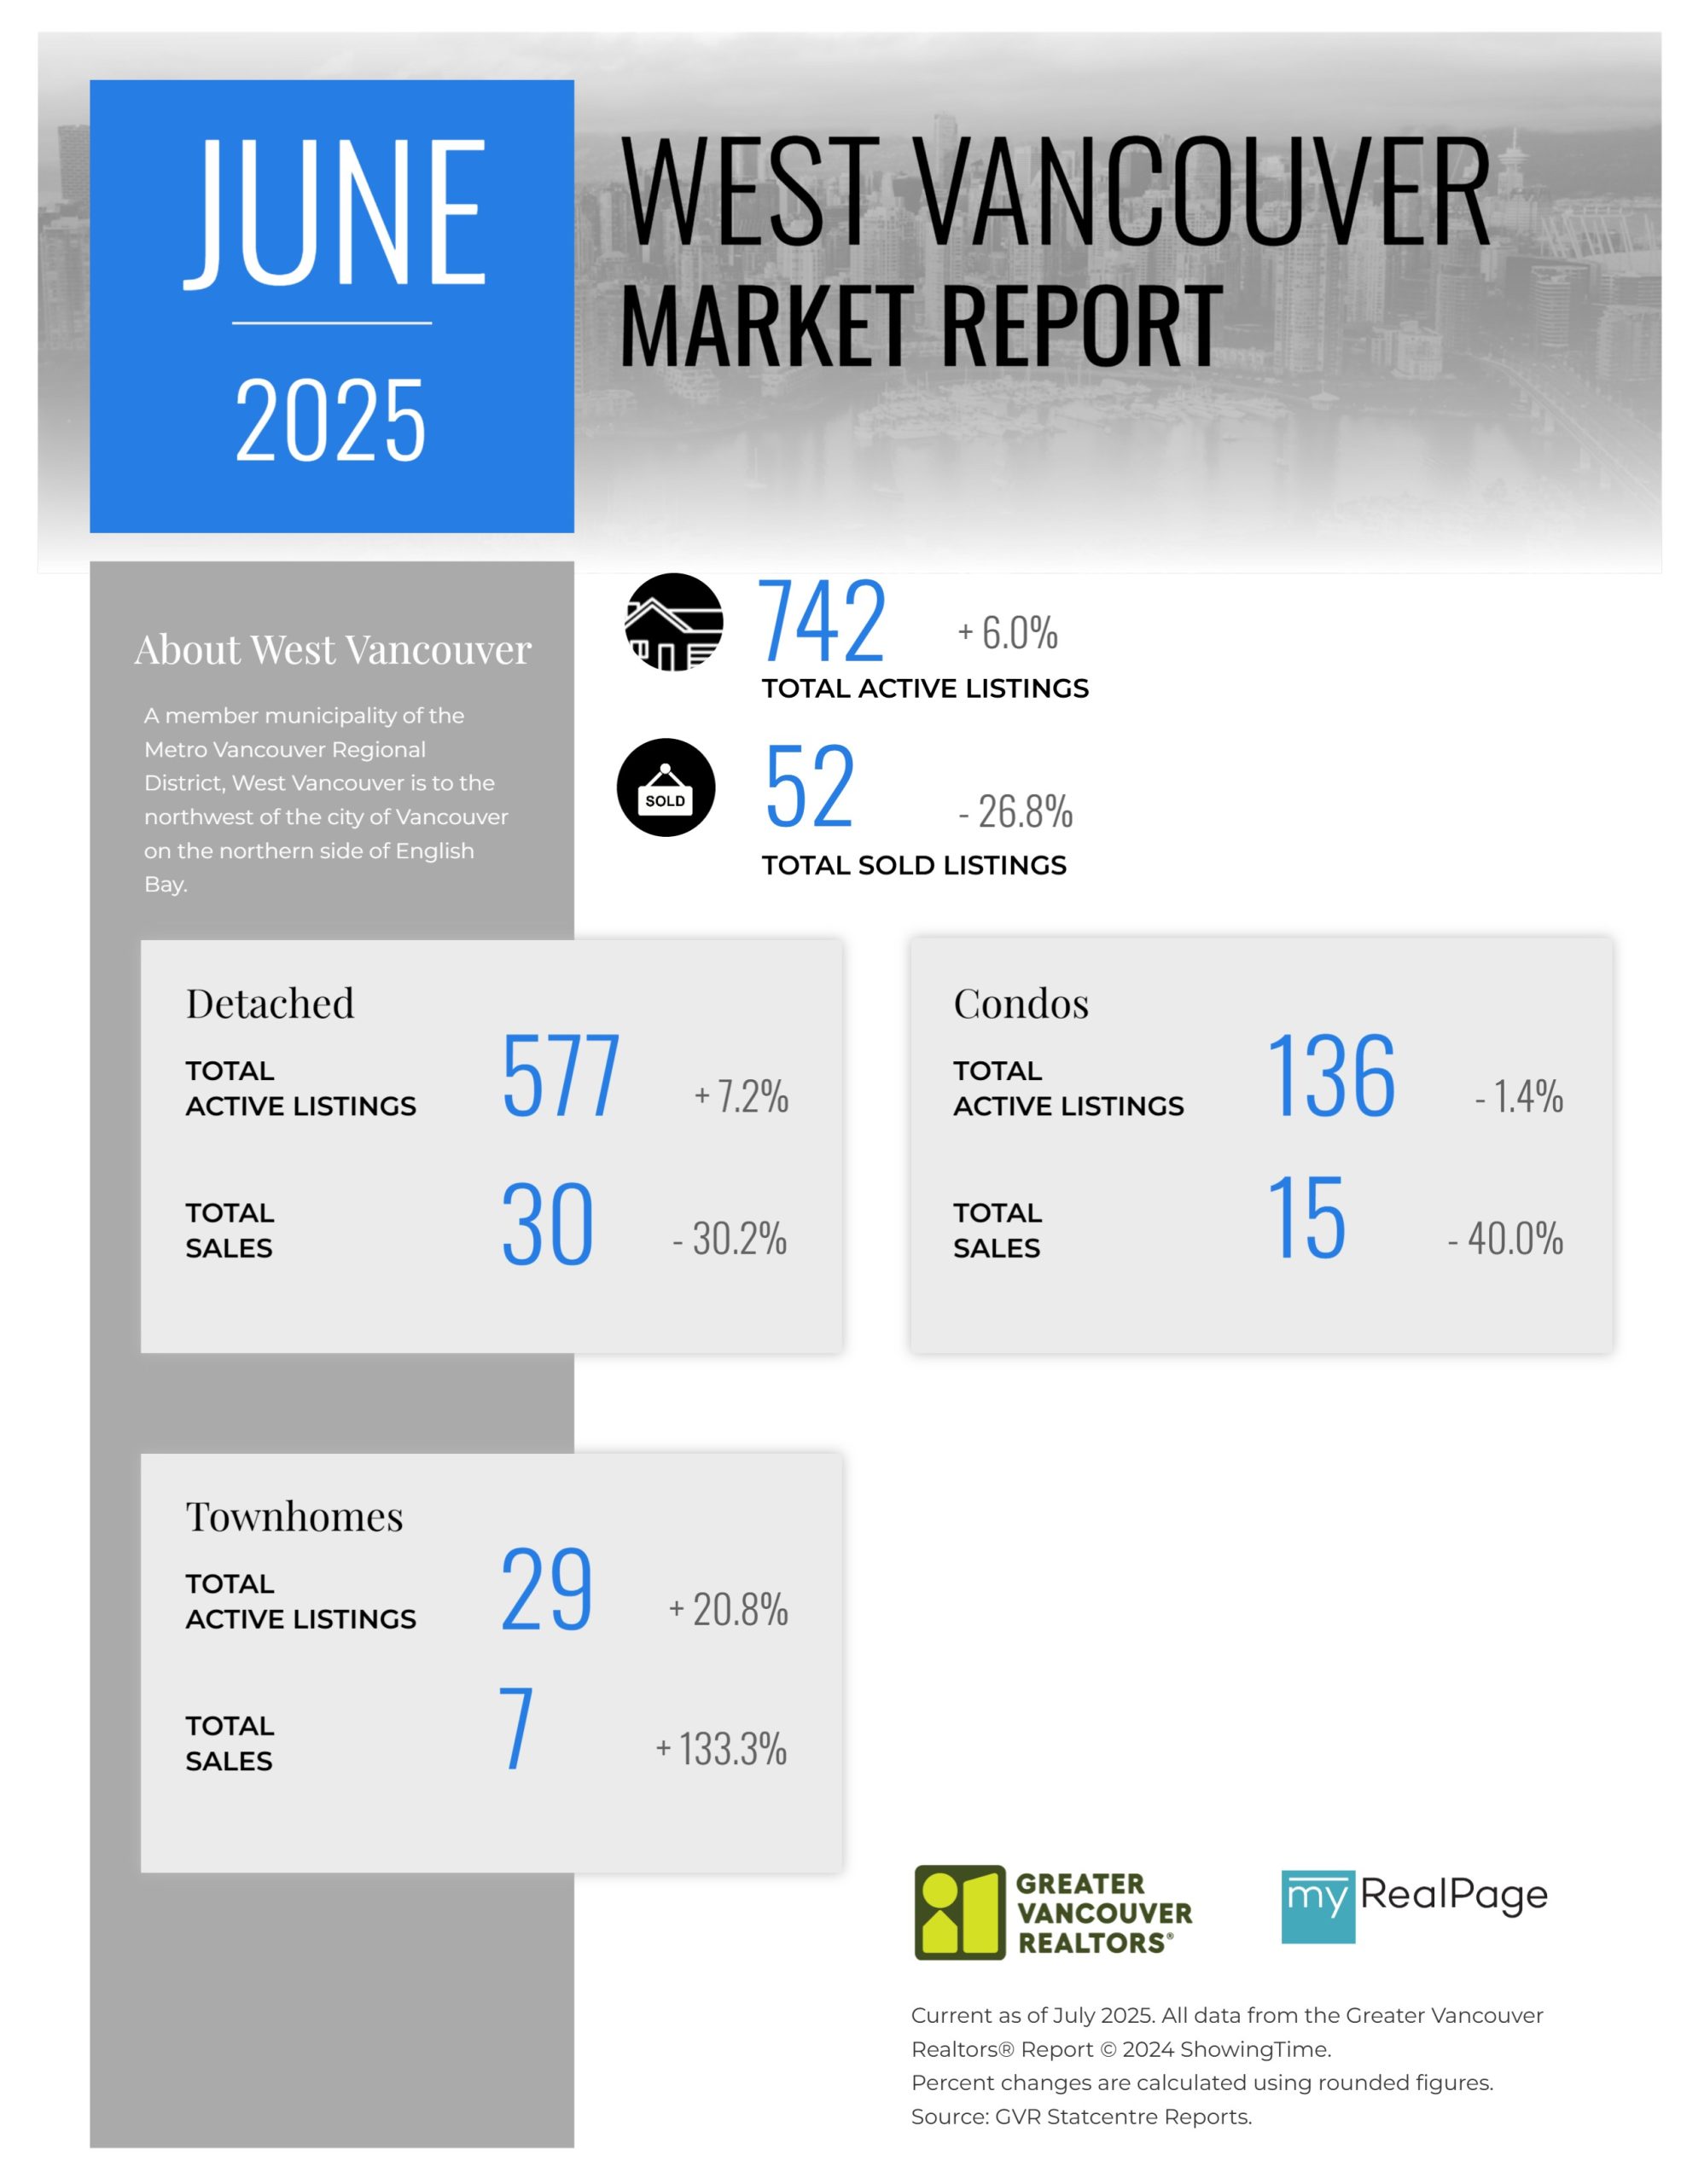
Printable Version – GVR June 2025 Data Infographics Report West Vancouver
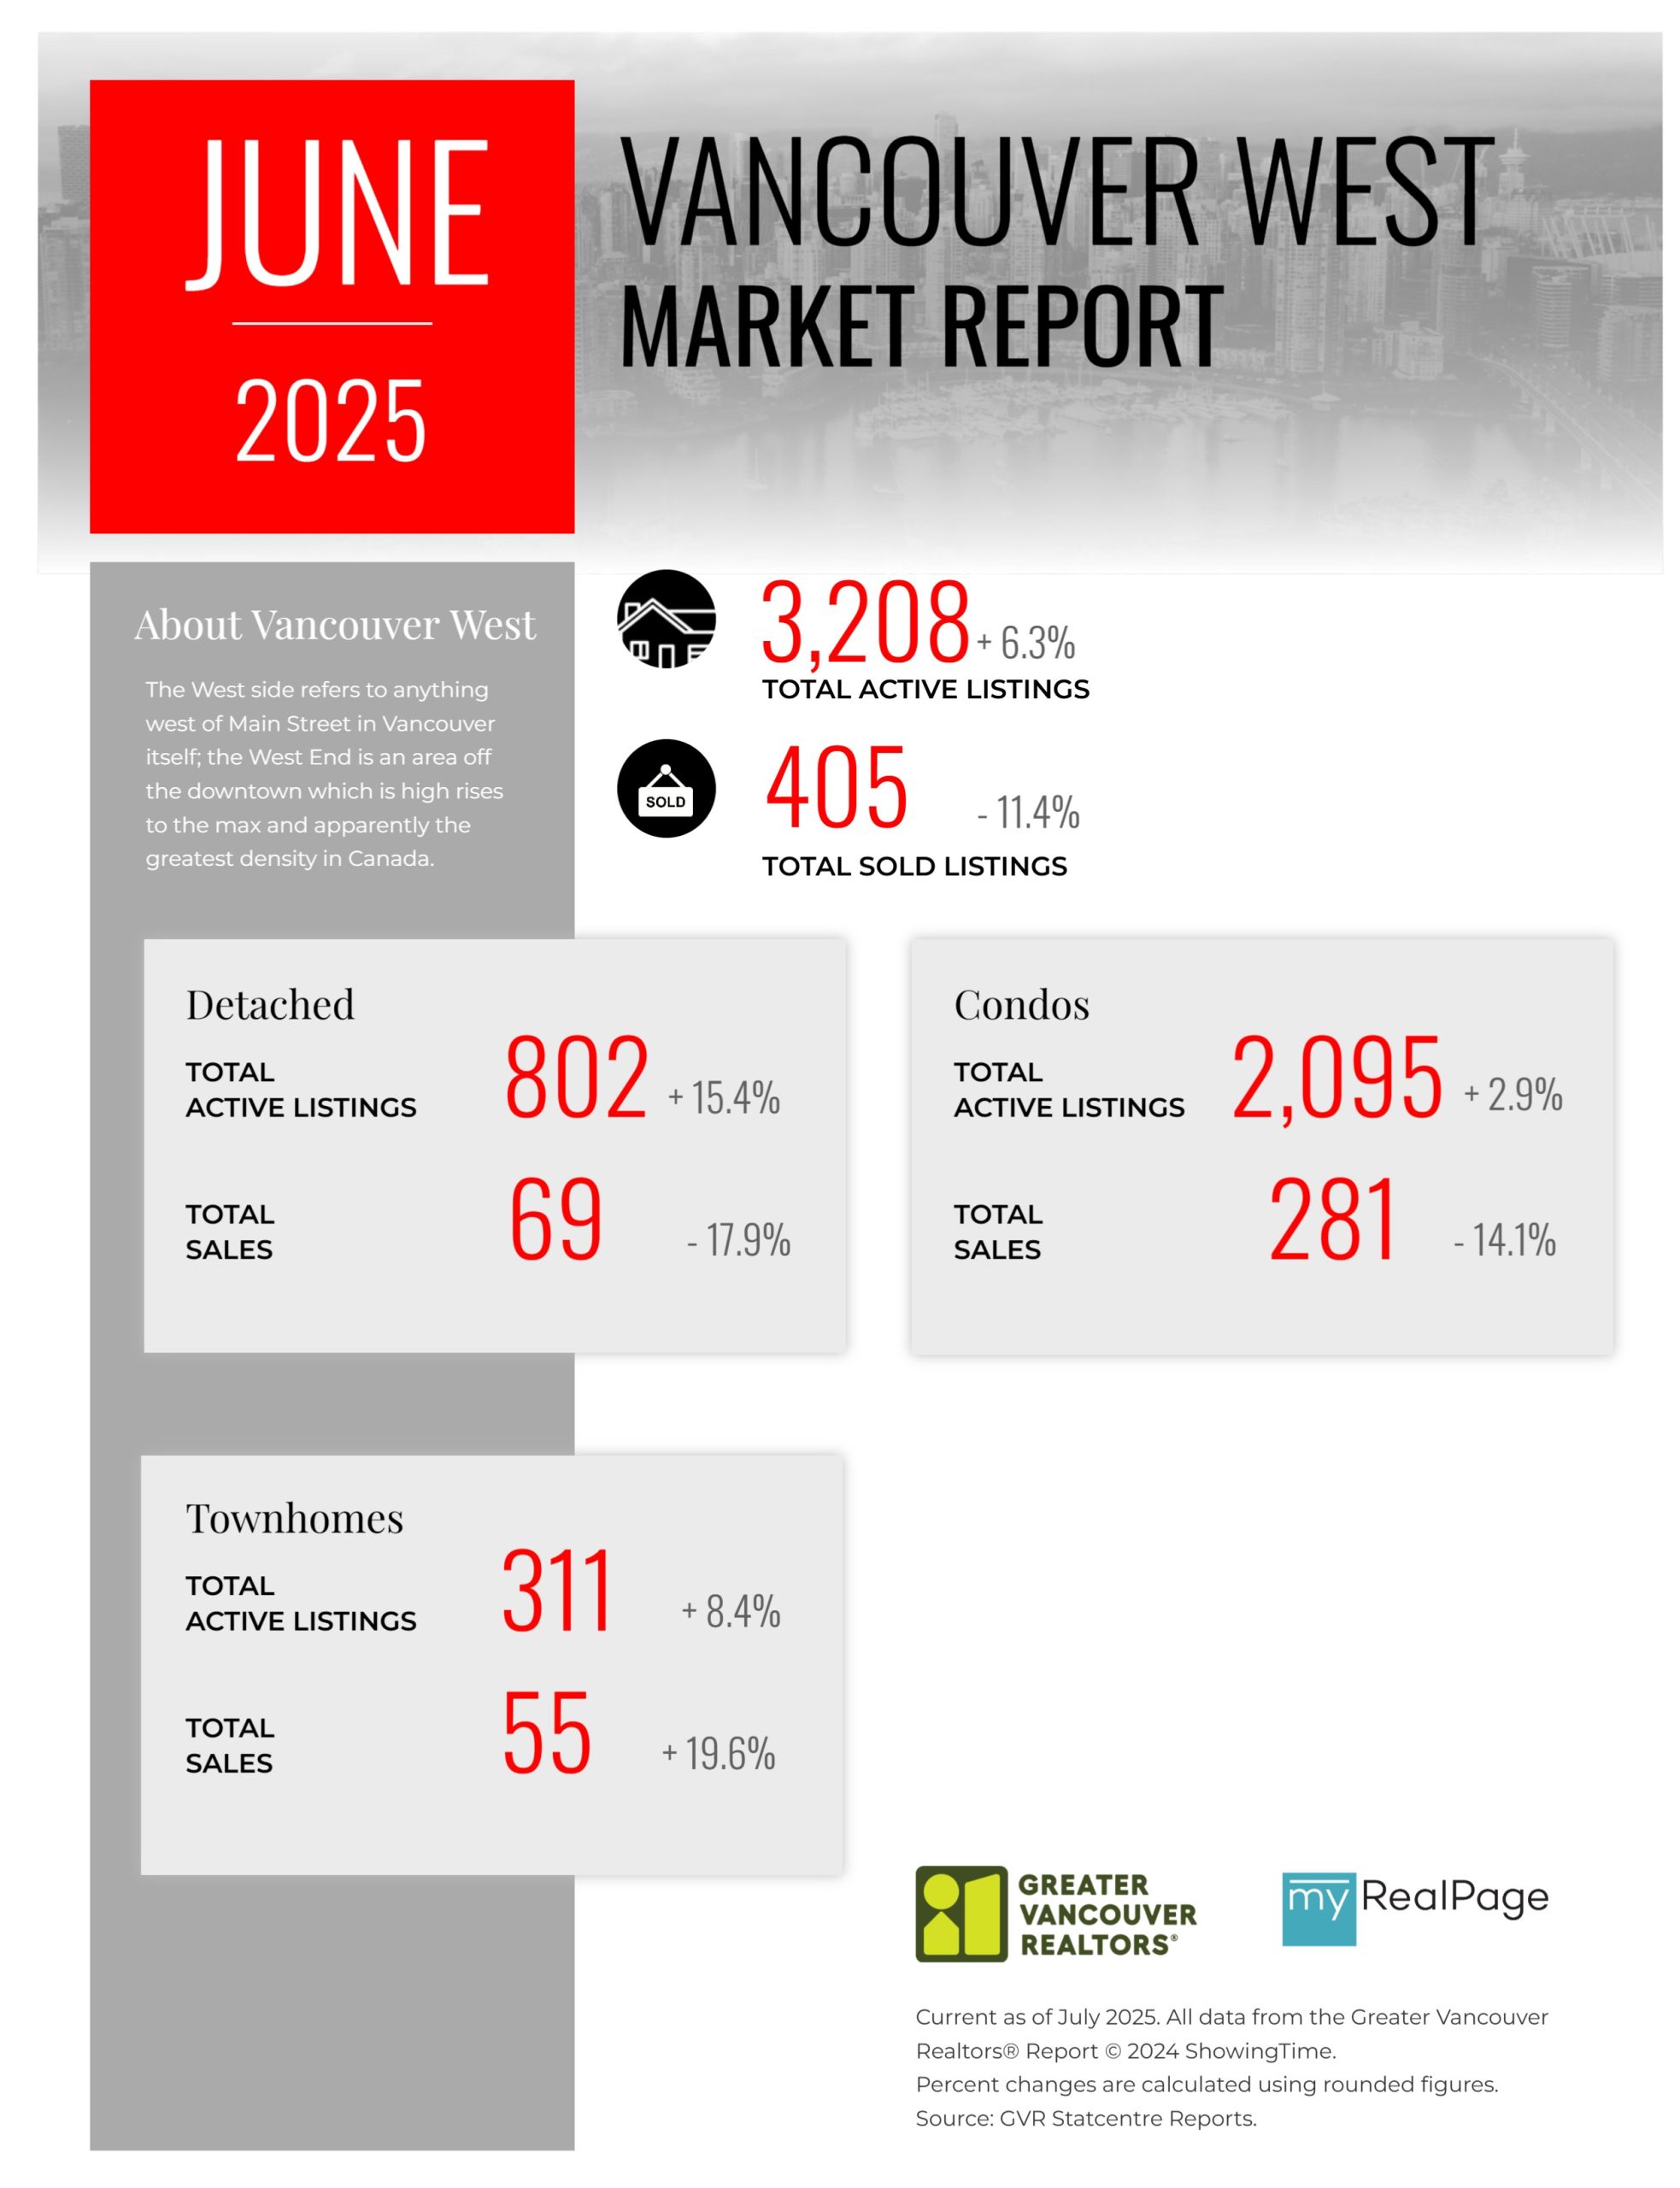
Printable Version – GVR June 2025 Data Infographics Report Vancouver West
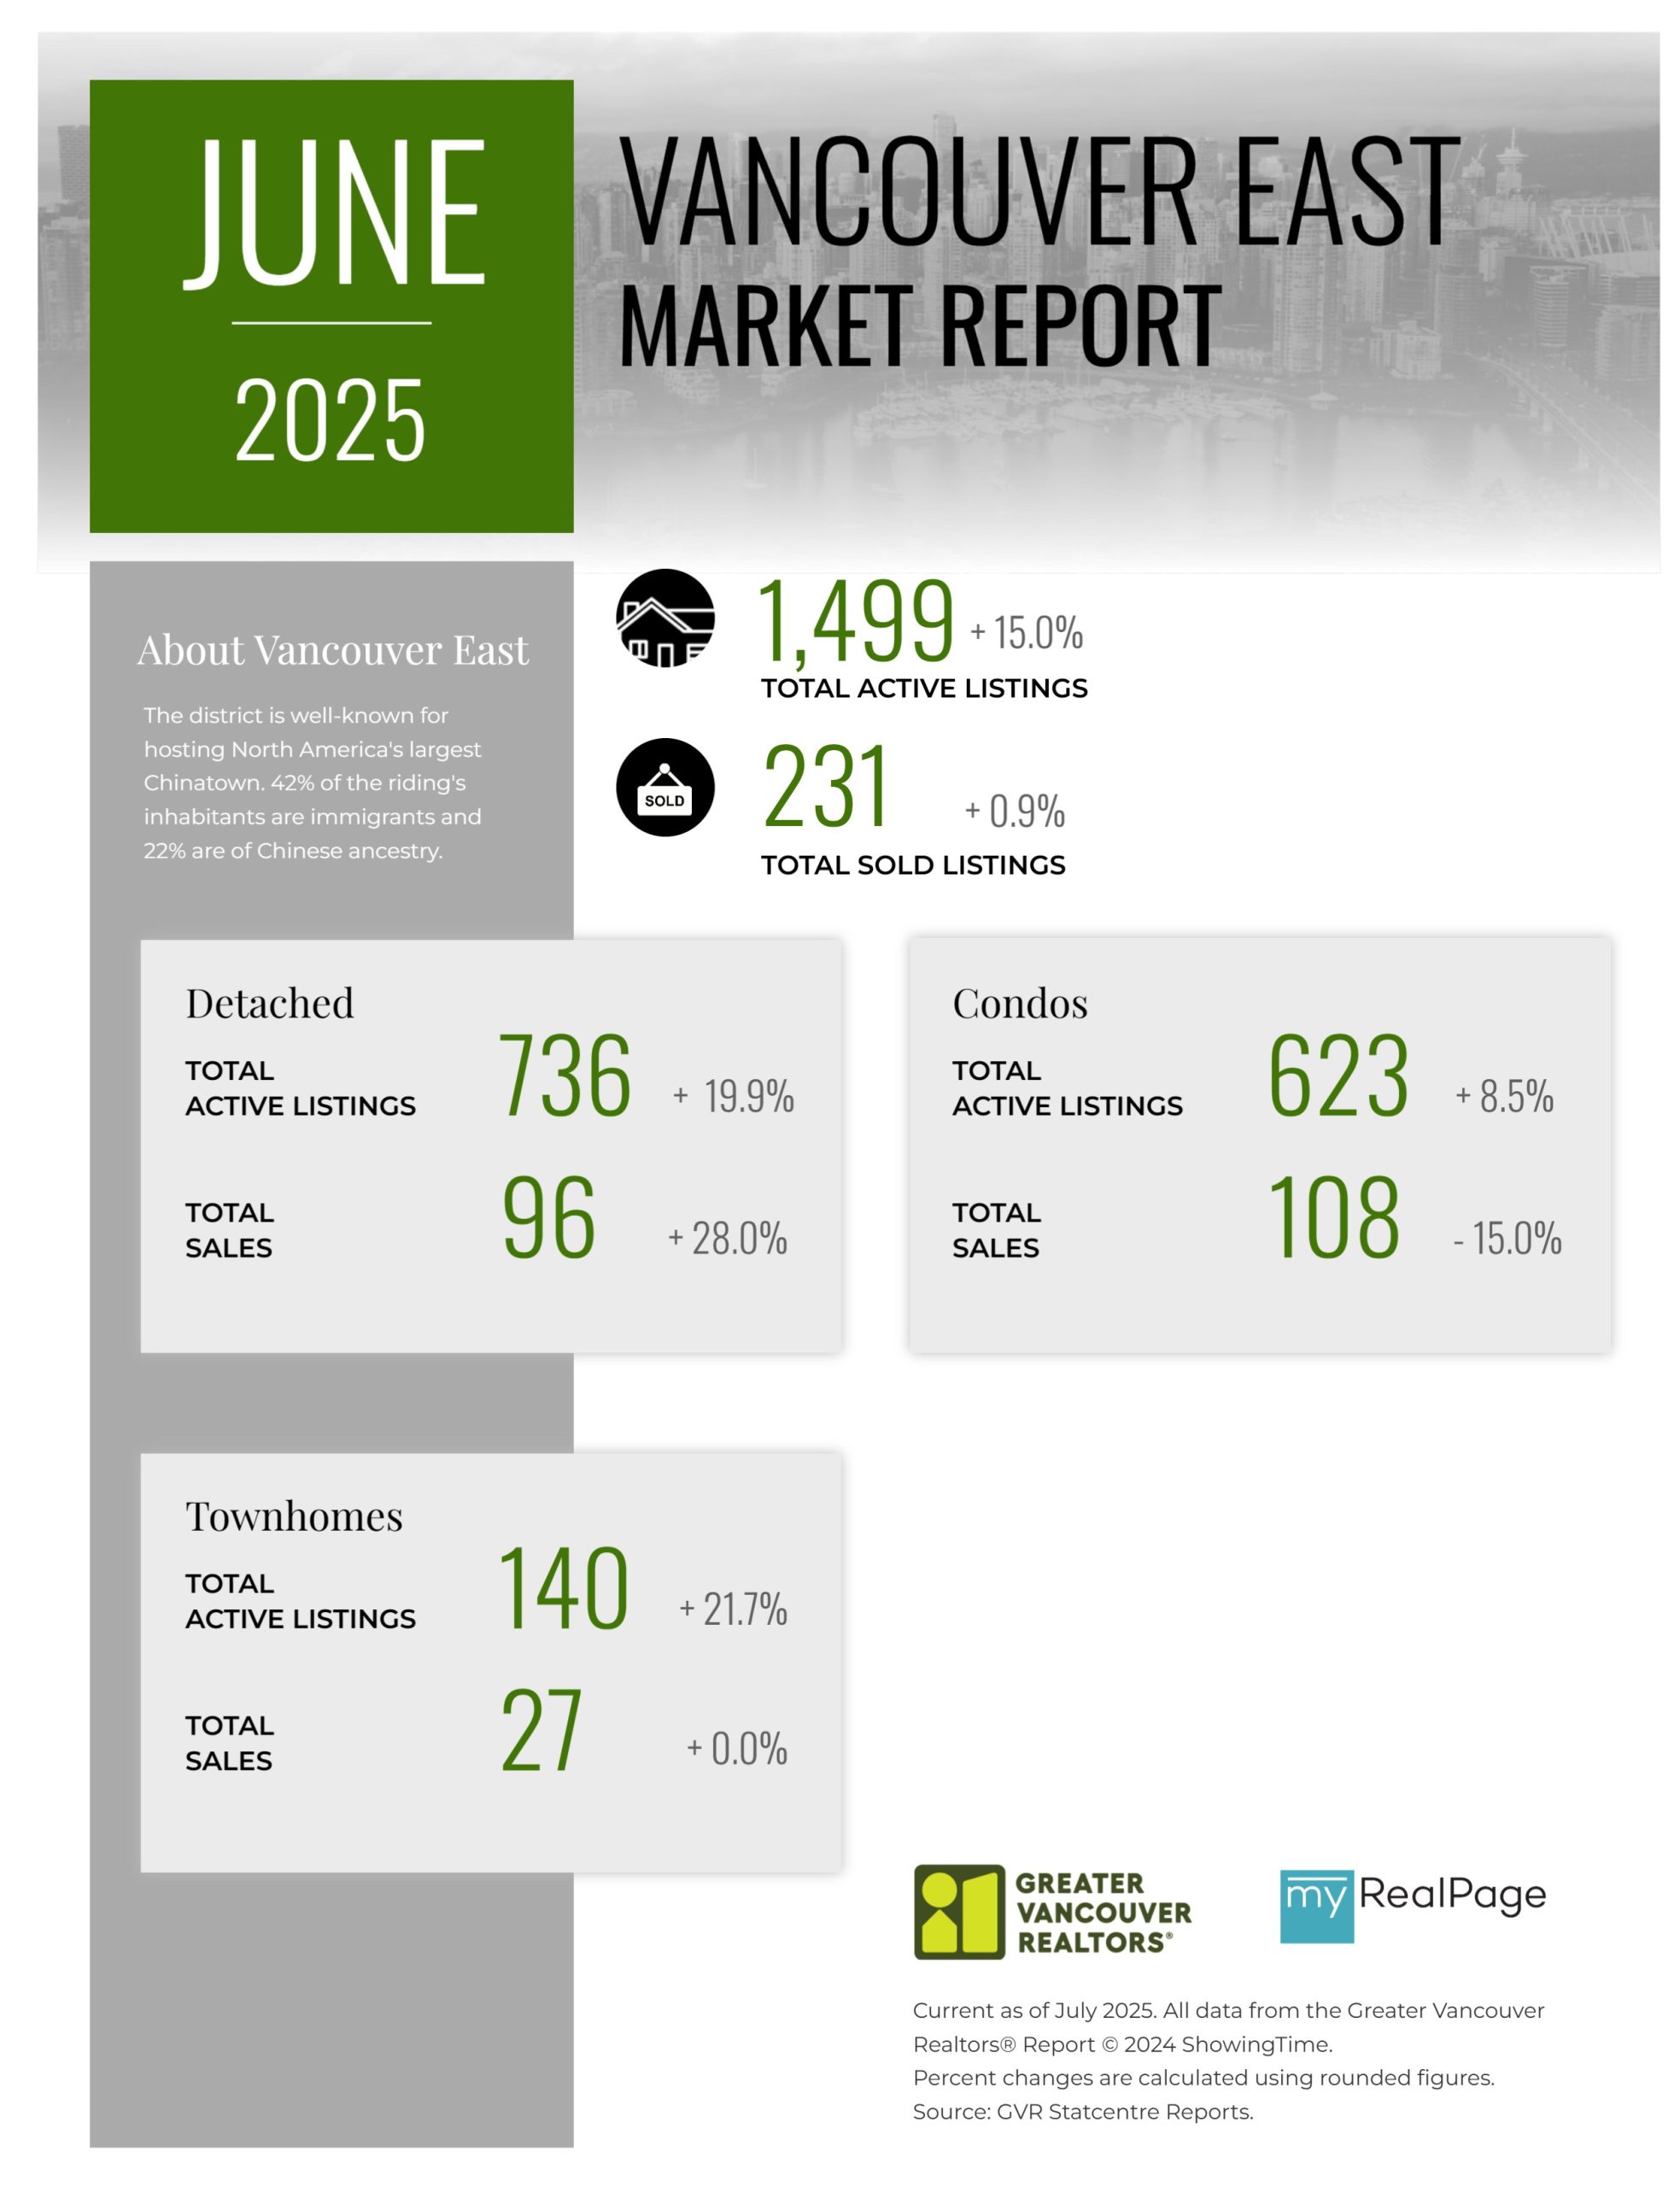
Printable Version – GVR June 2025 Data Infographics Report Vancouver East
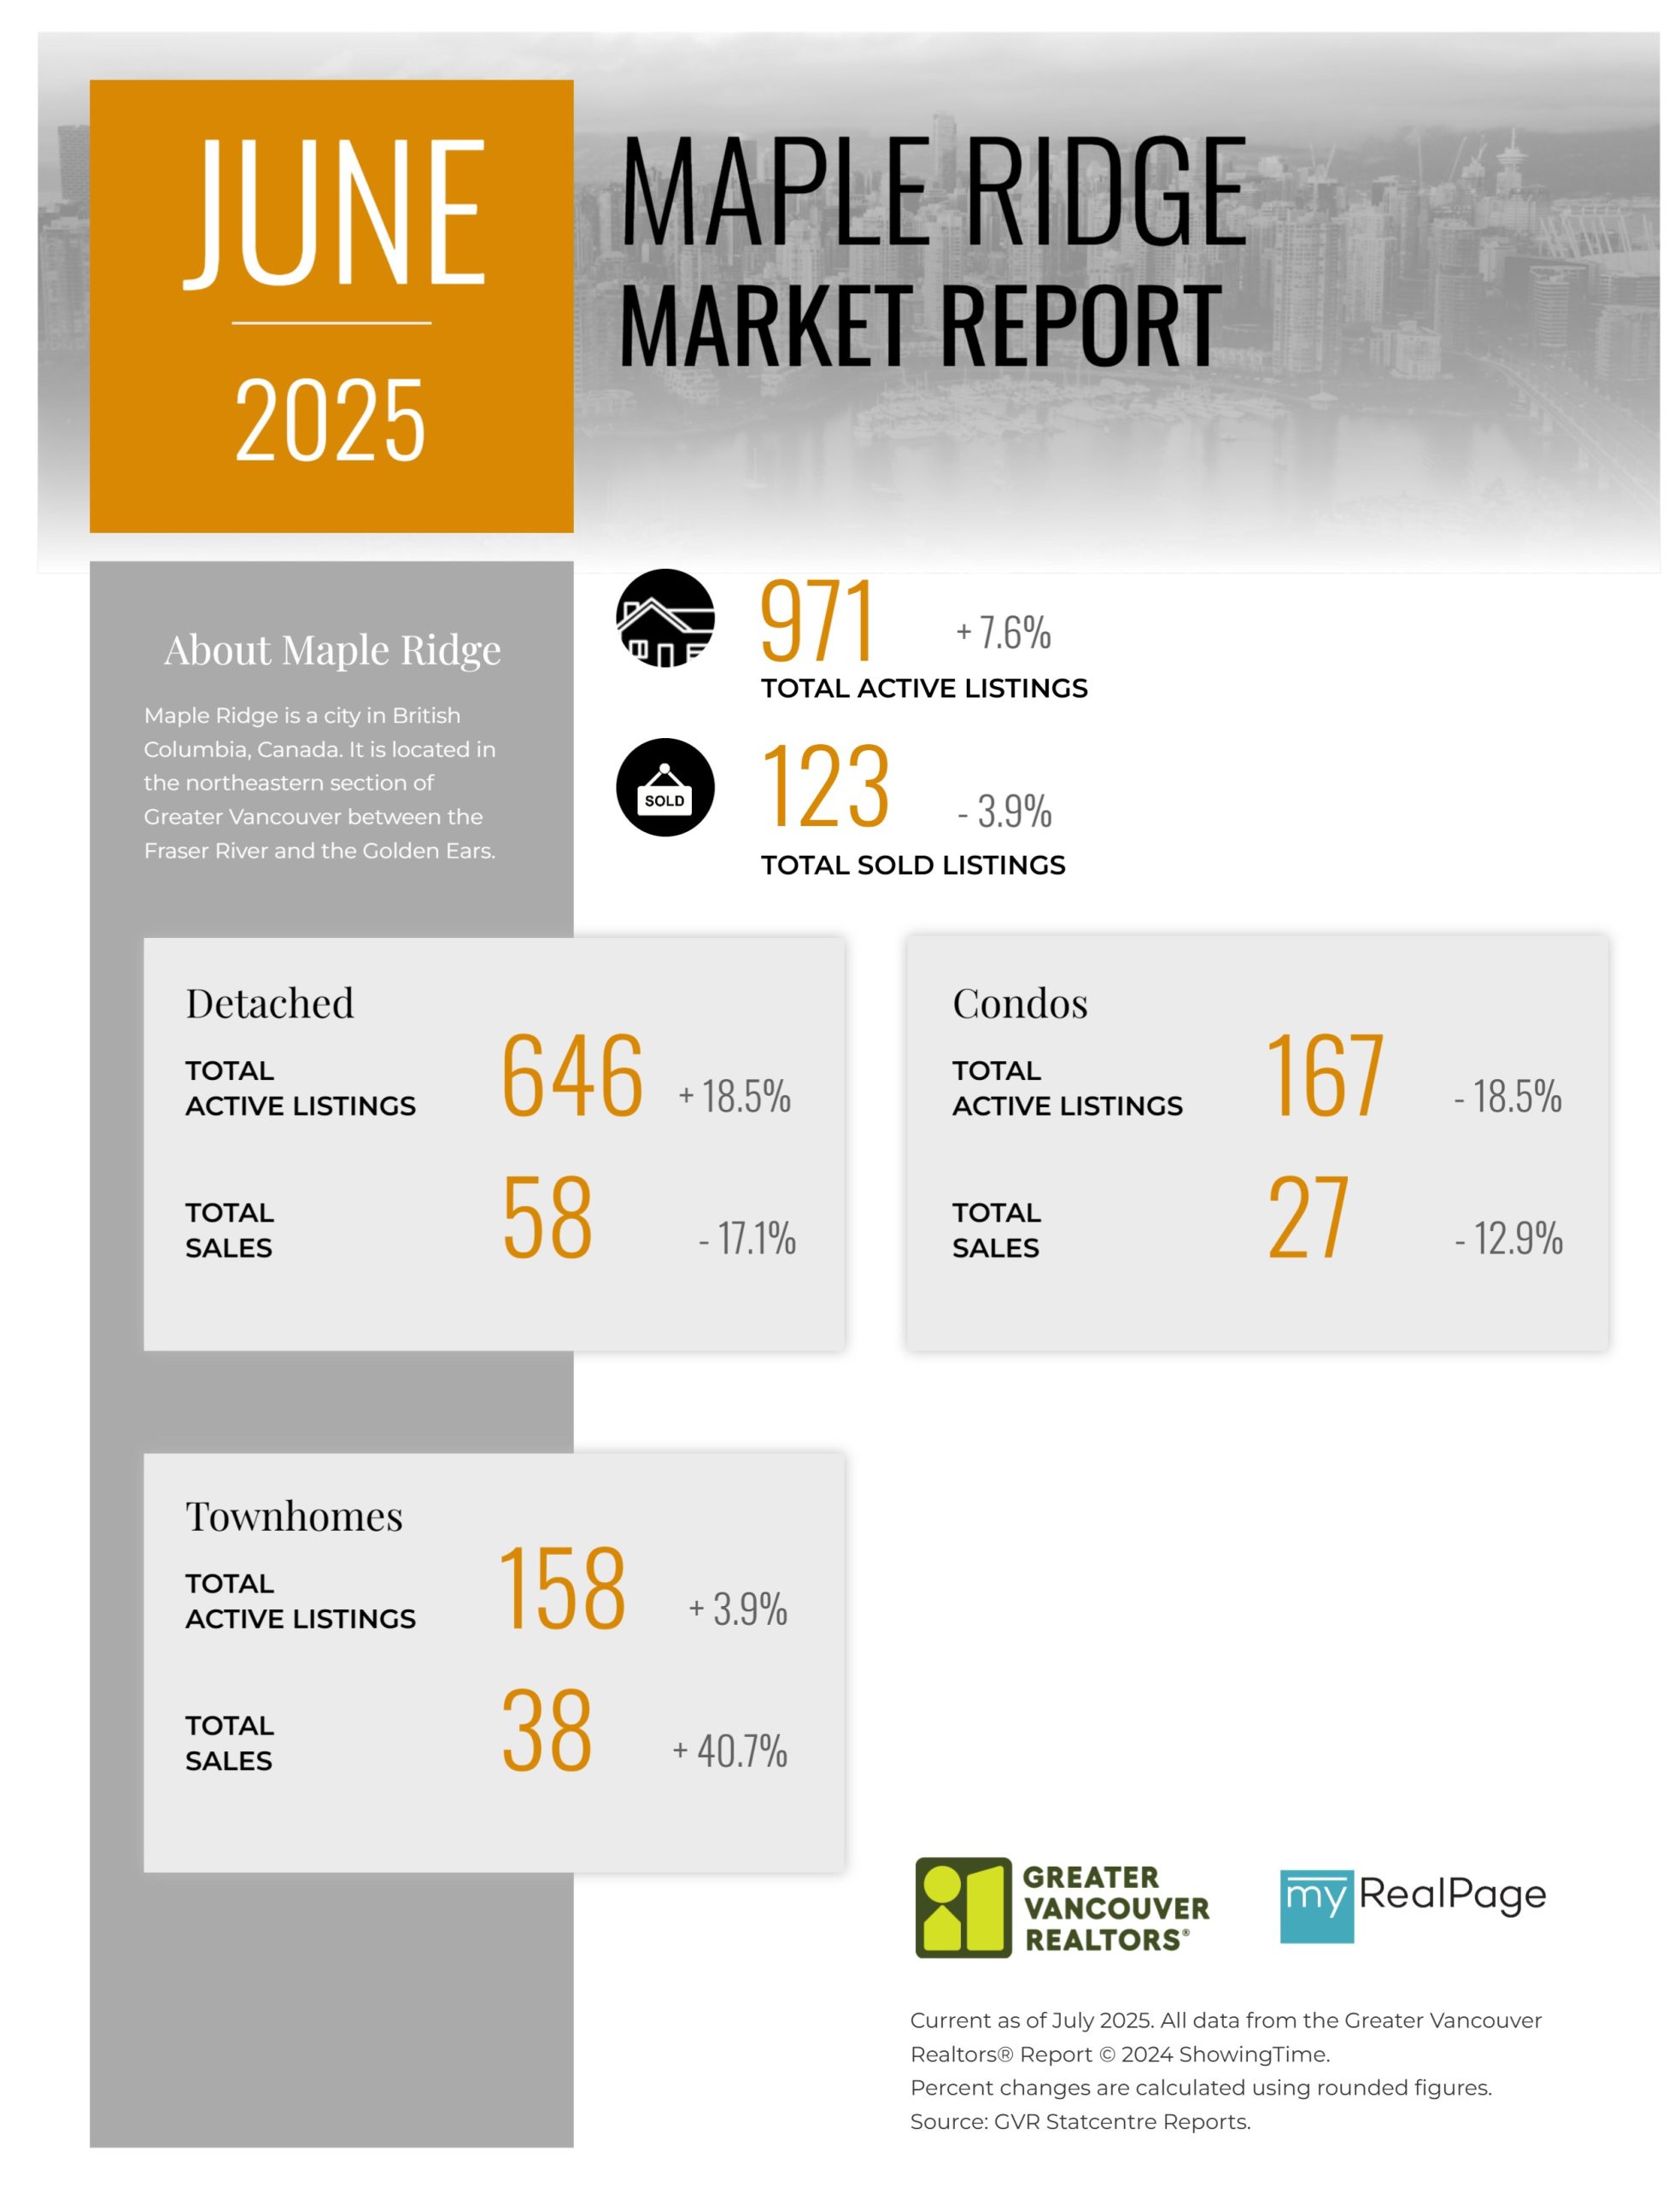
Printable Version – GVR June 2025 Data Infographic Report Maple Ridge
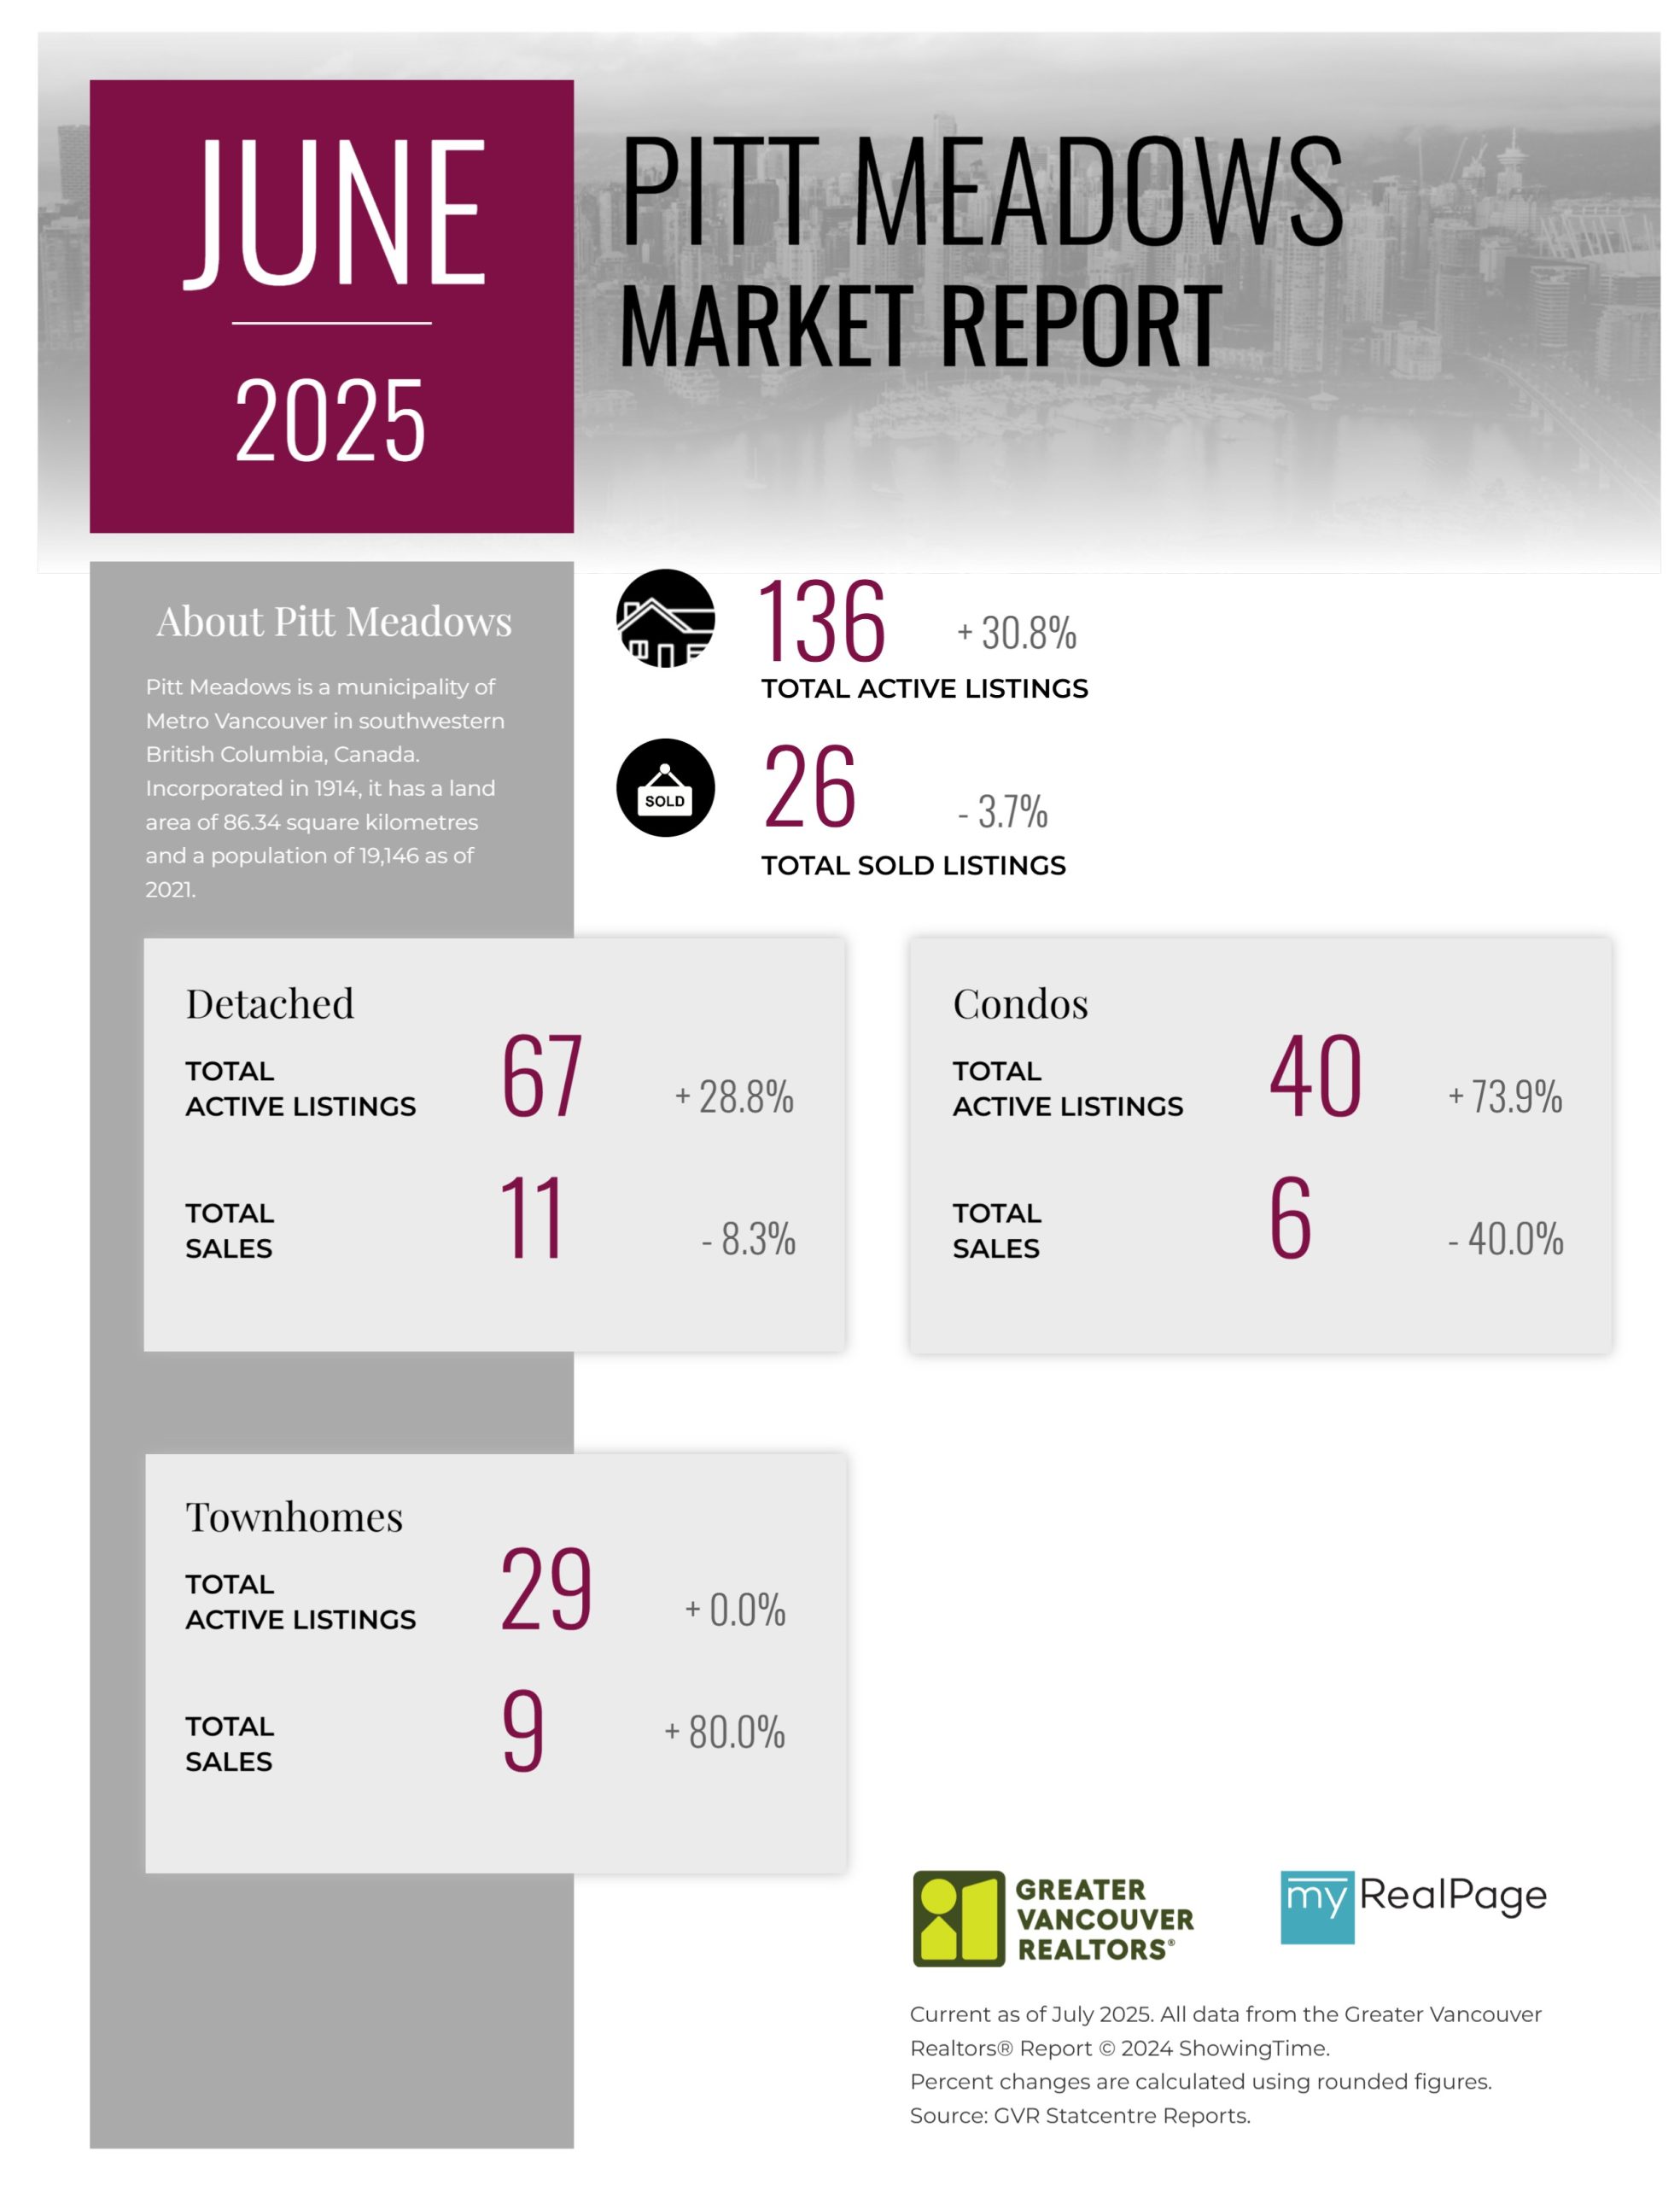
Printable Version – GVR June 2025 Data Infographics Report Pitt Meadows
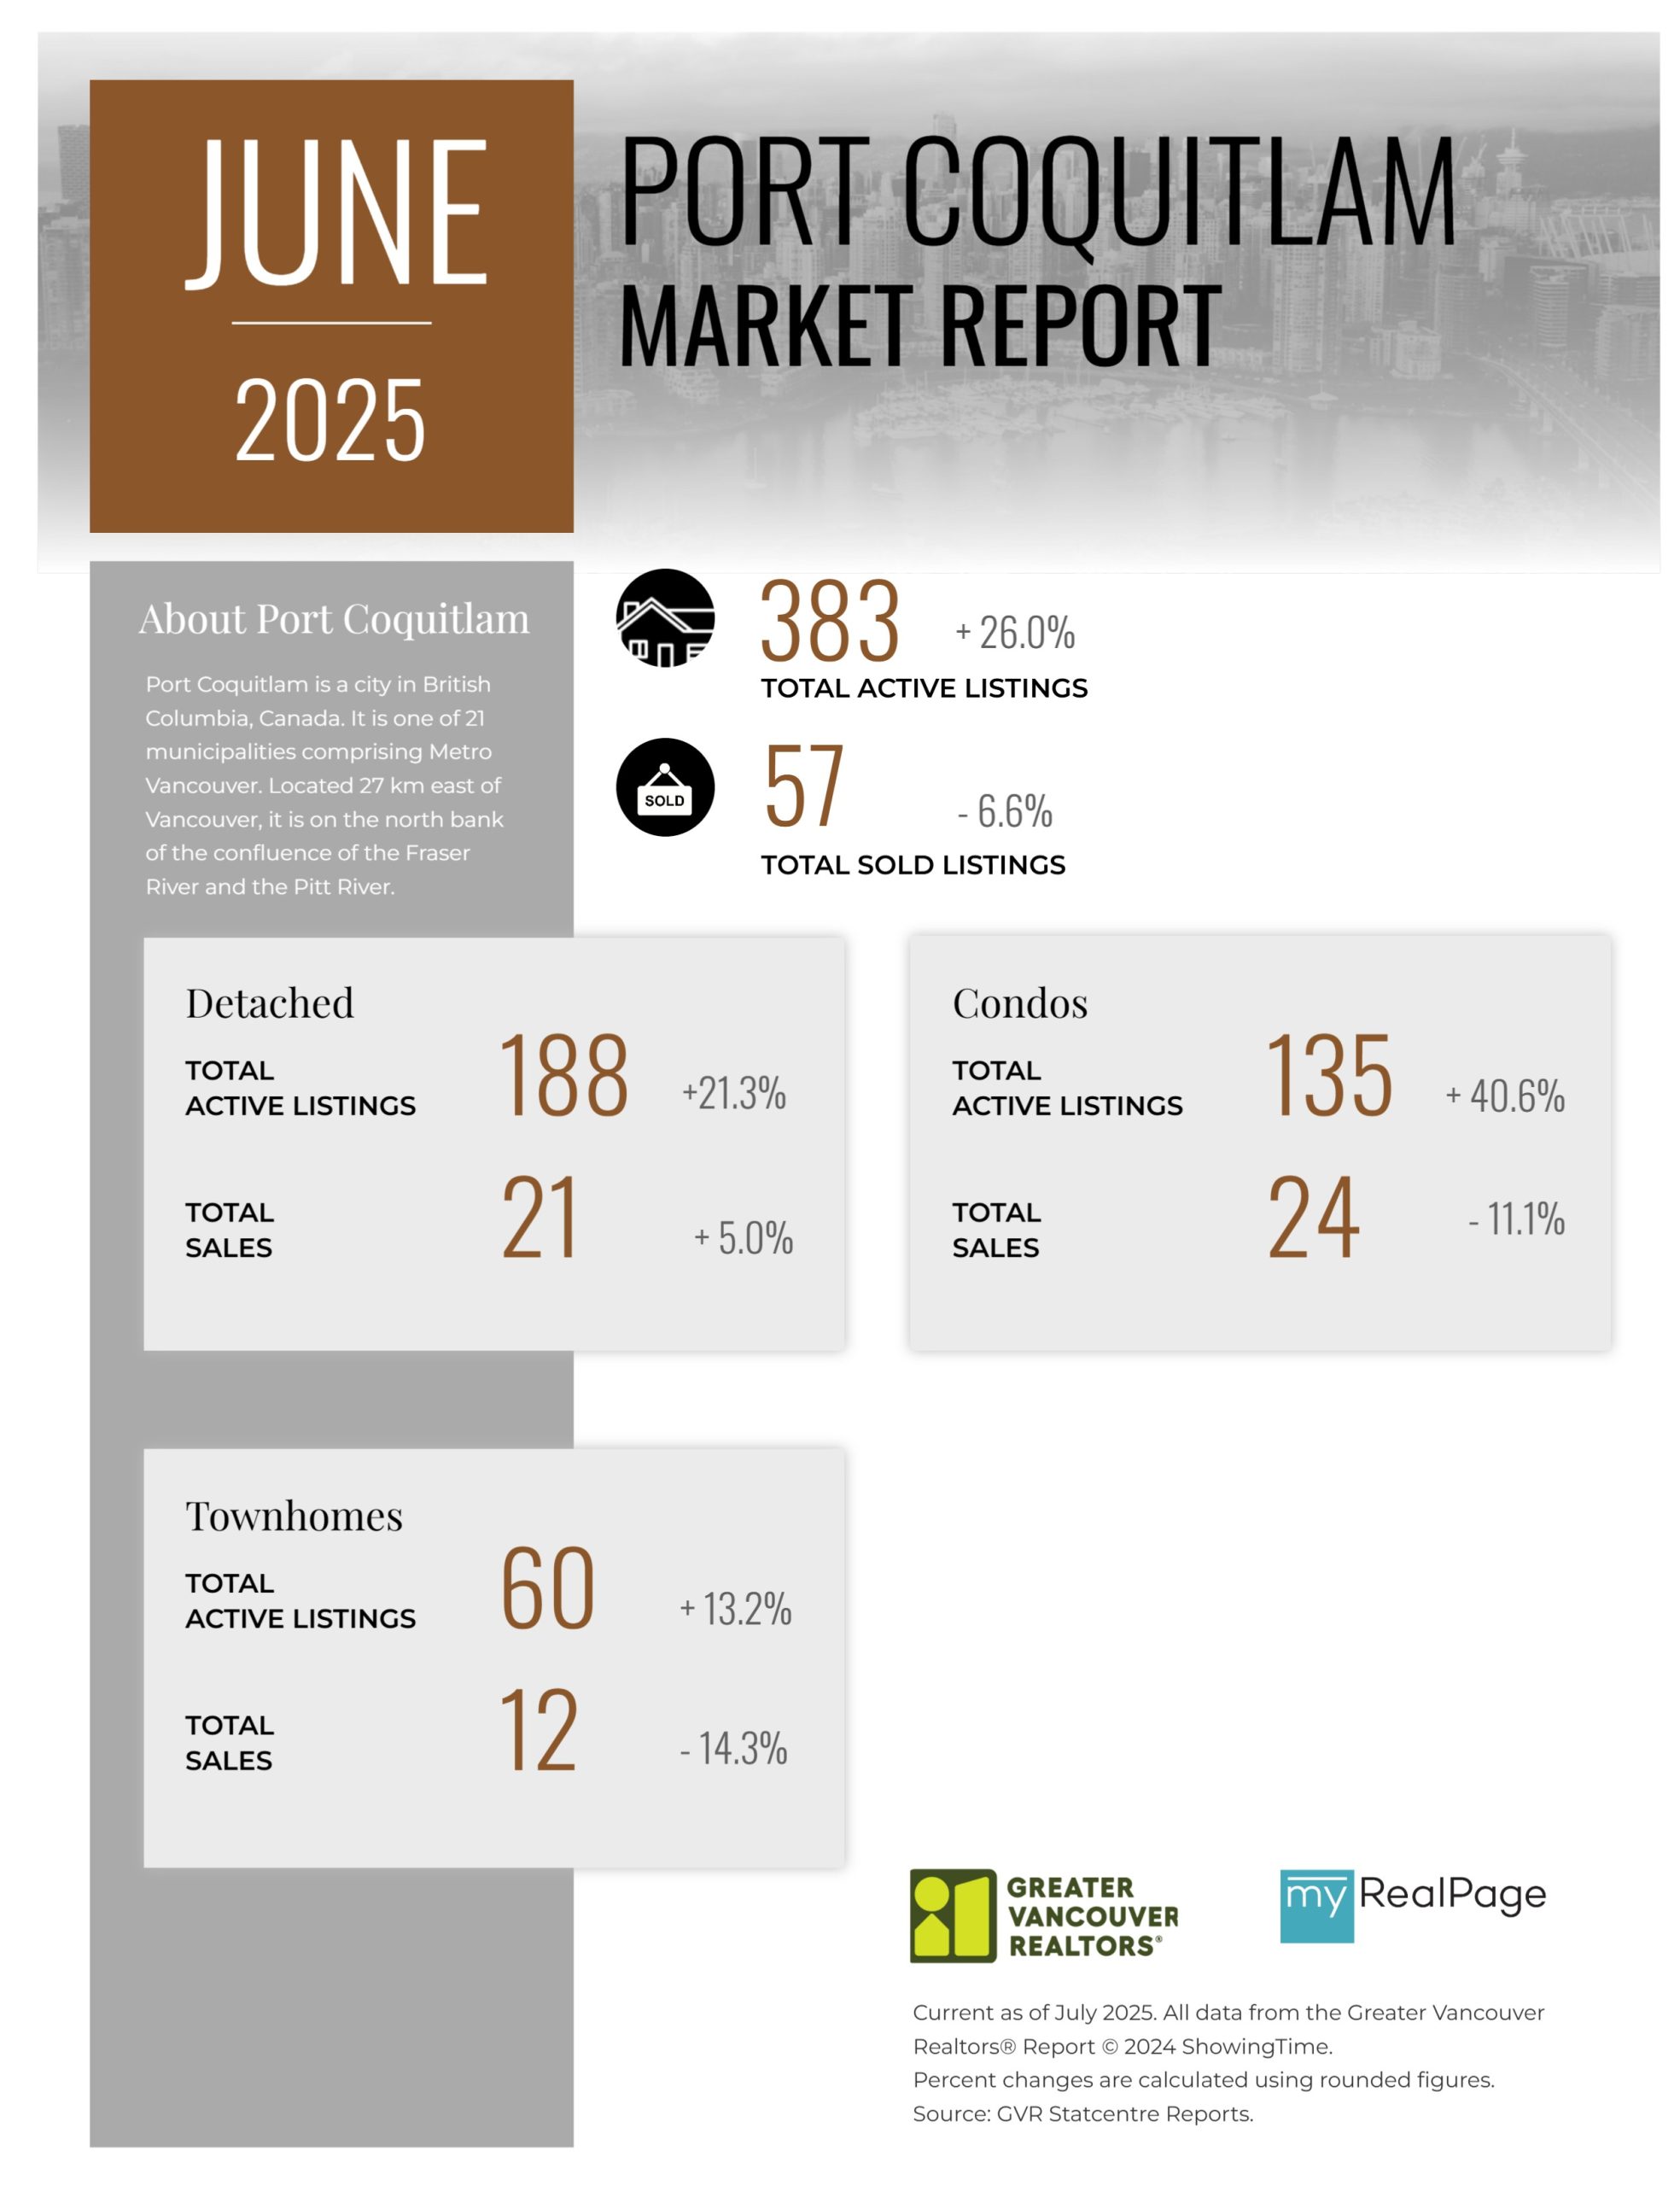
Printable Version – GVR June 2025 Data Infographics Report Port Coquitlam
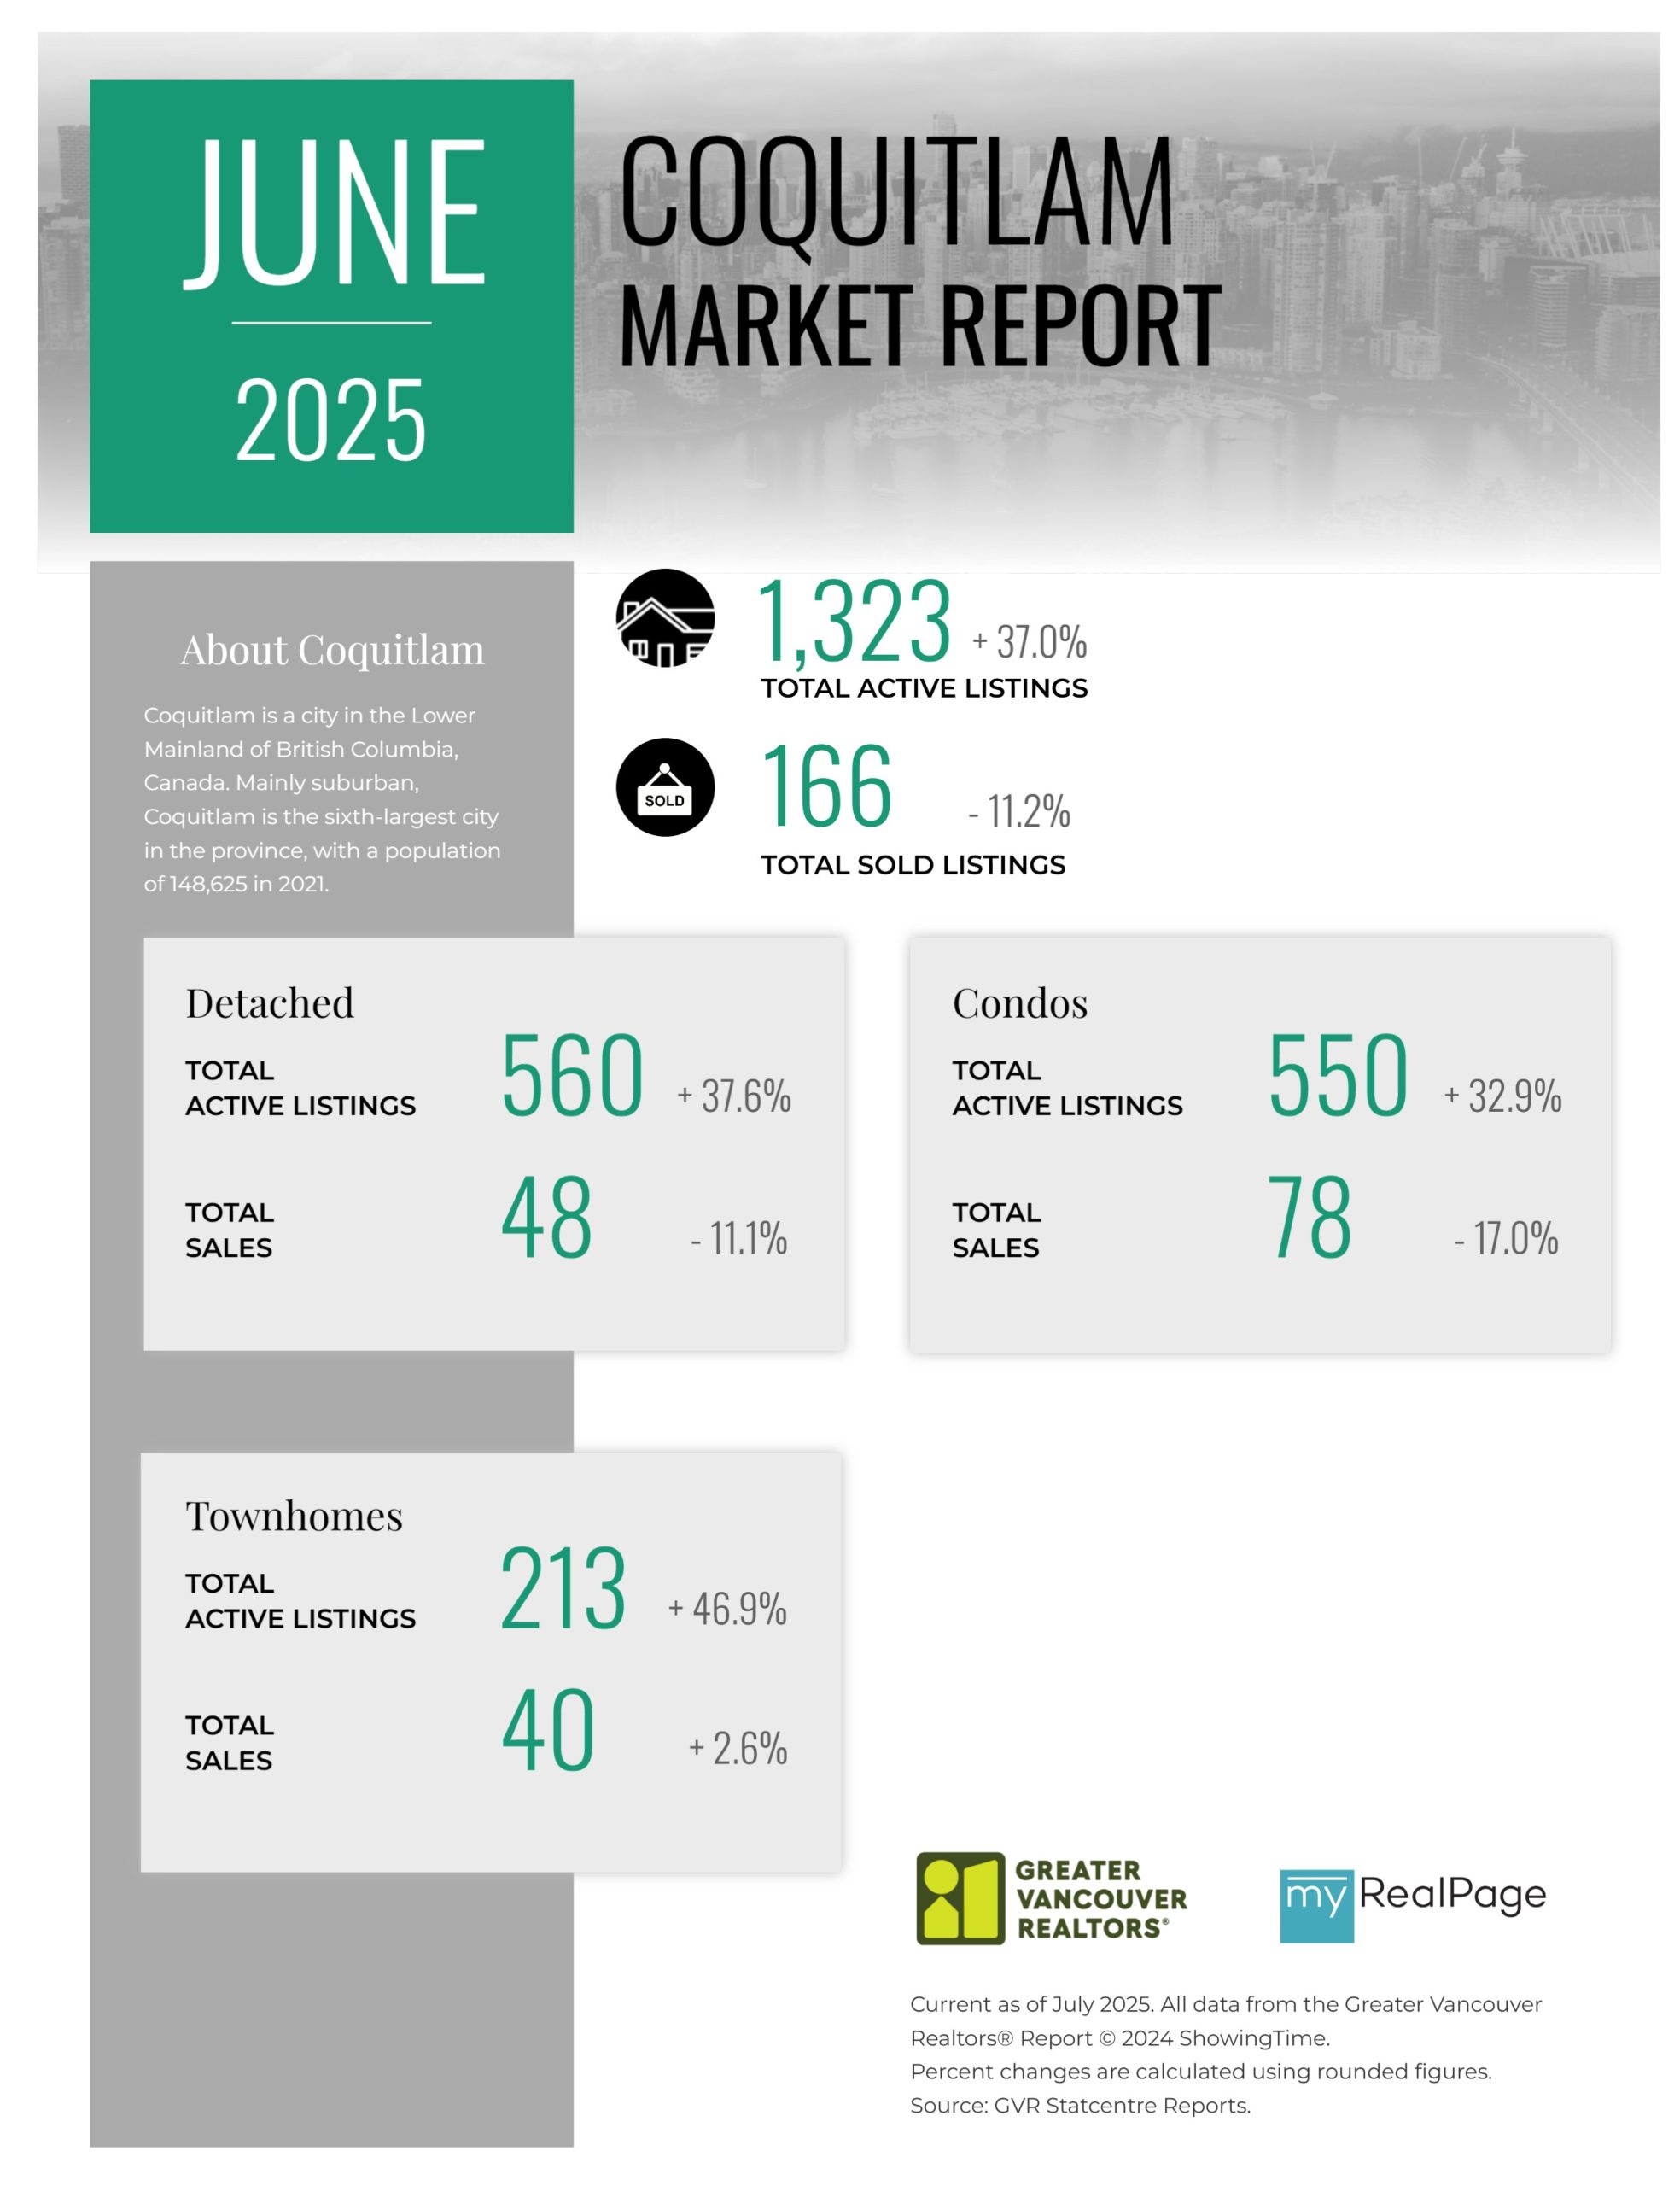
Printable Version – GVR June 2025 Data Infographics Report Coquitlam
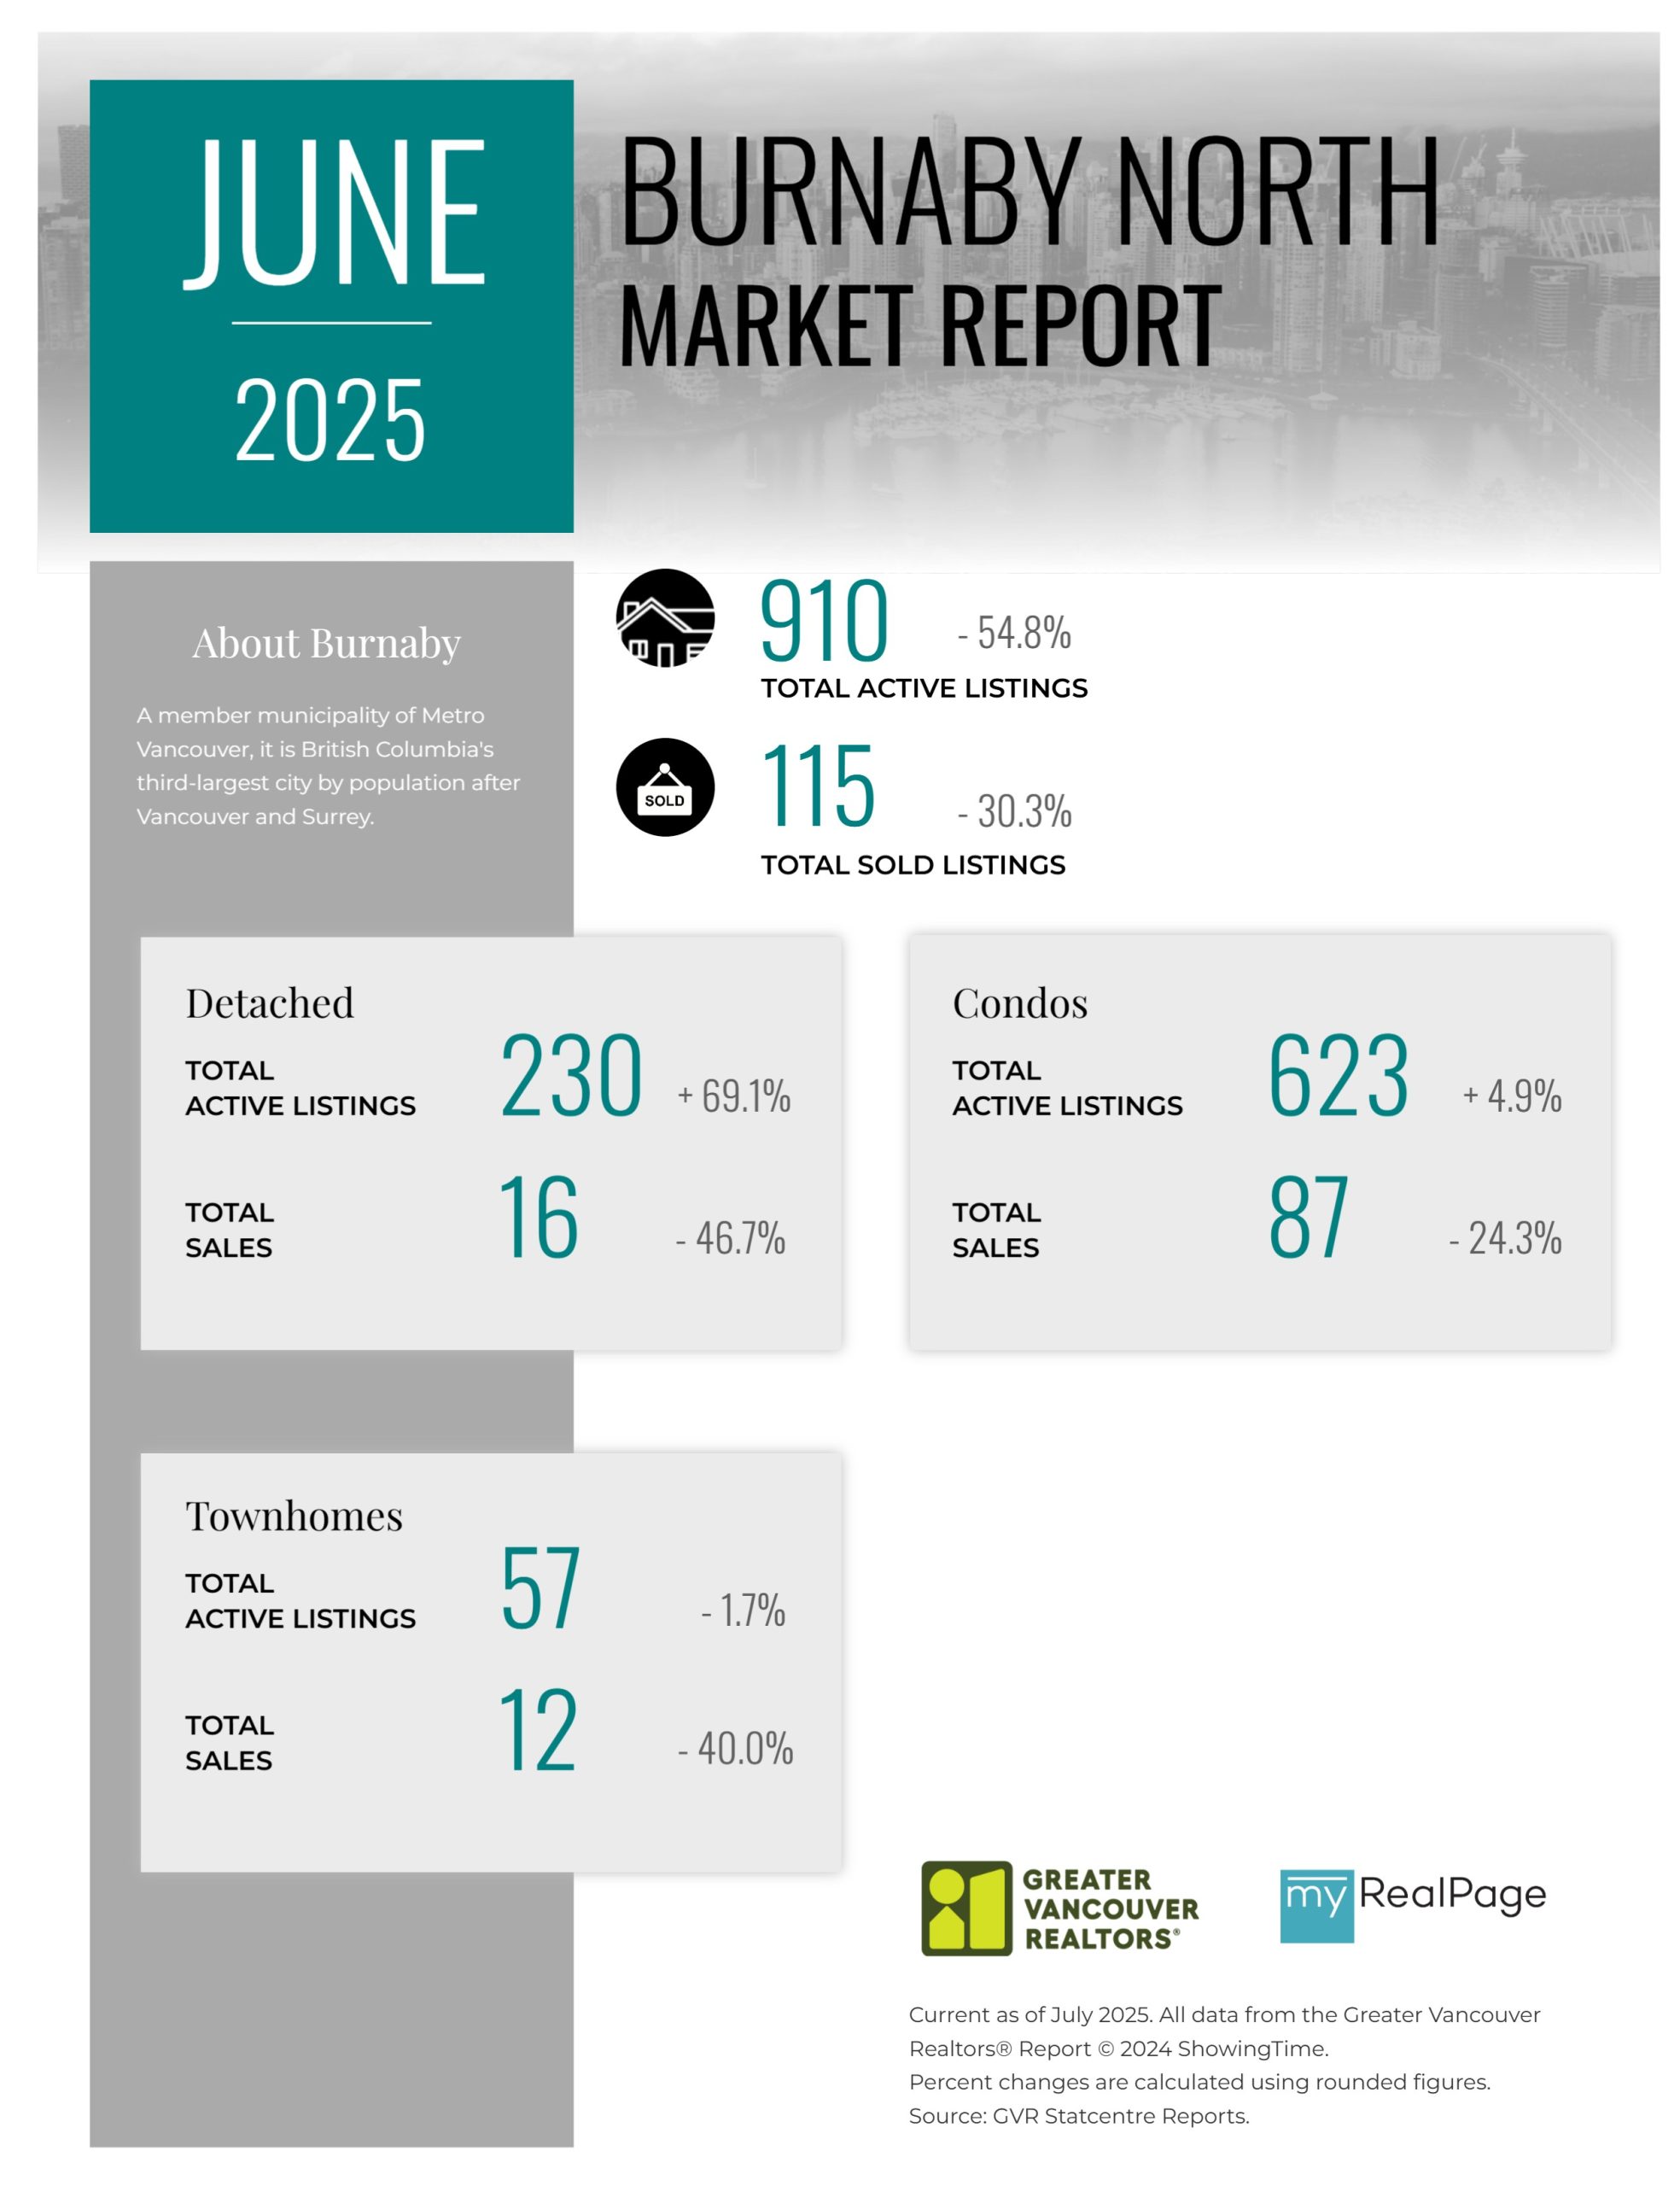
Printable Version – GVR June 2025 Data Infographic Report Burnaby North
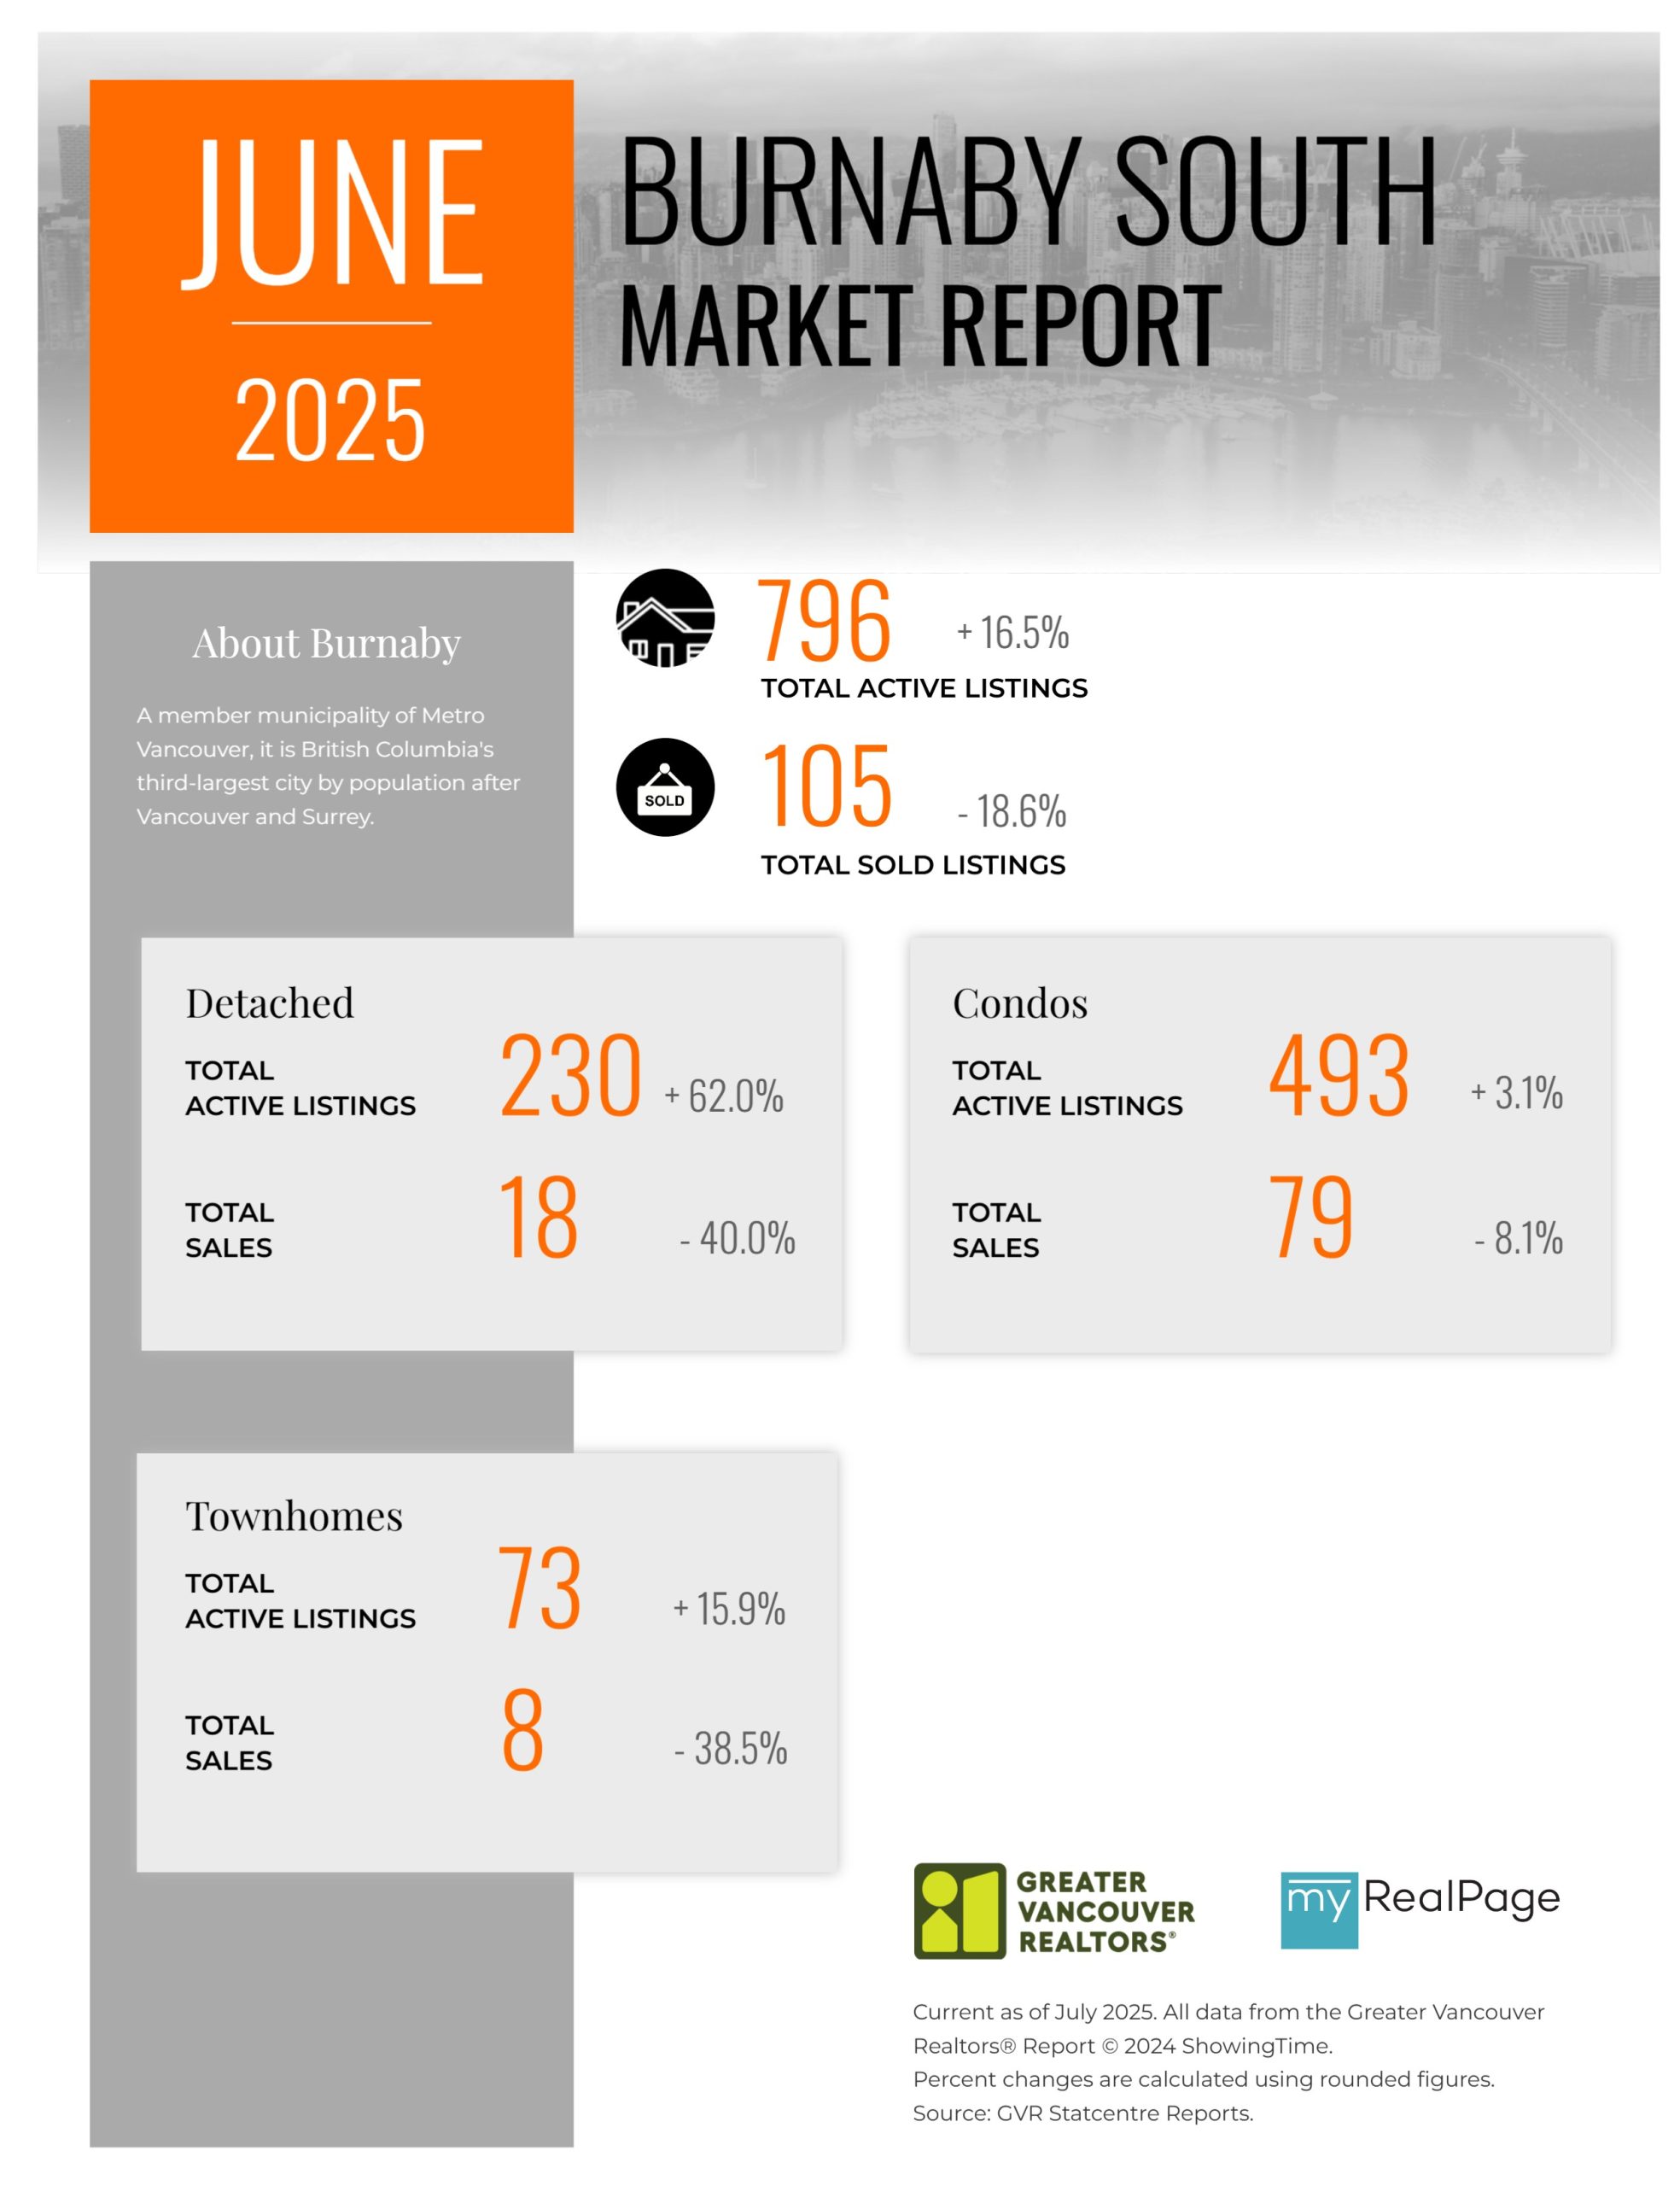
Printable Version – GVR June 2025 Data Infographics Report Burnaby South
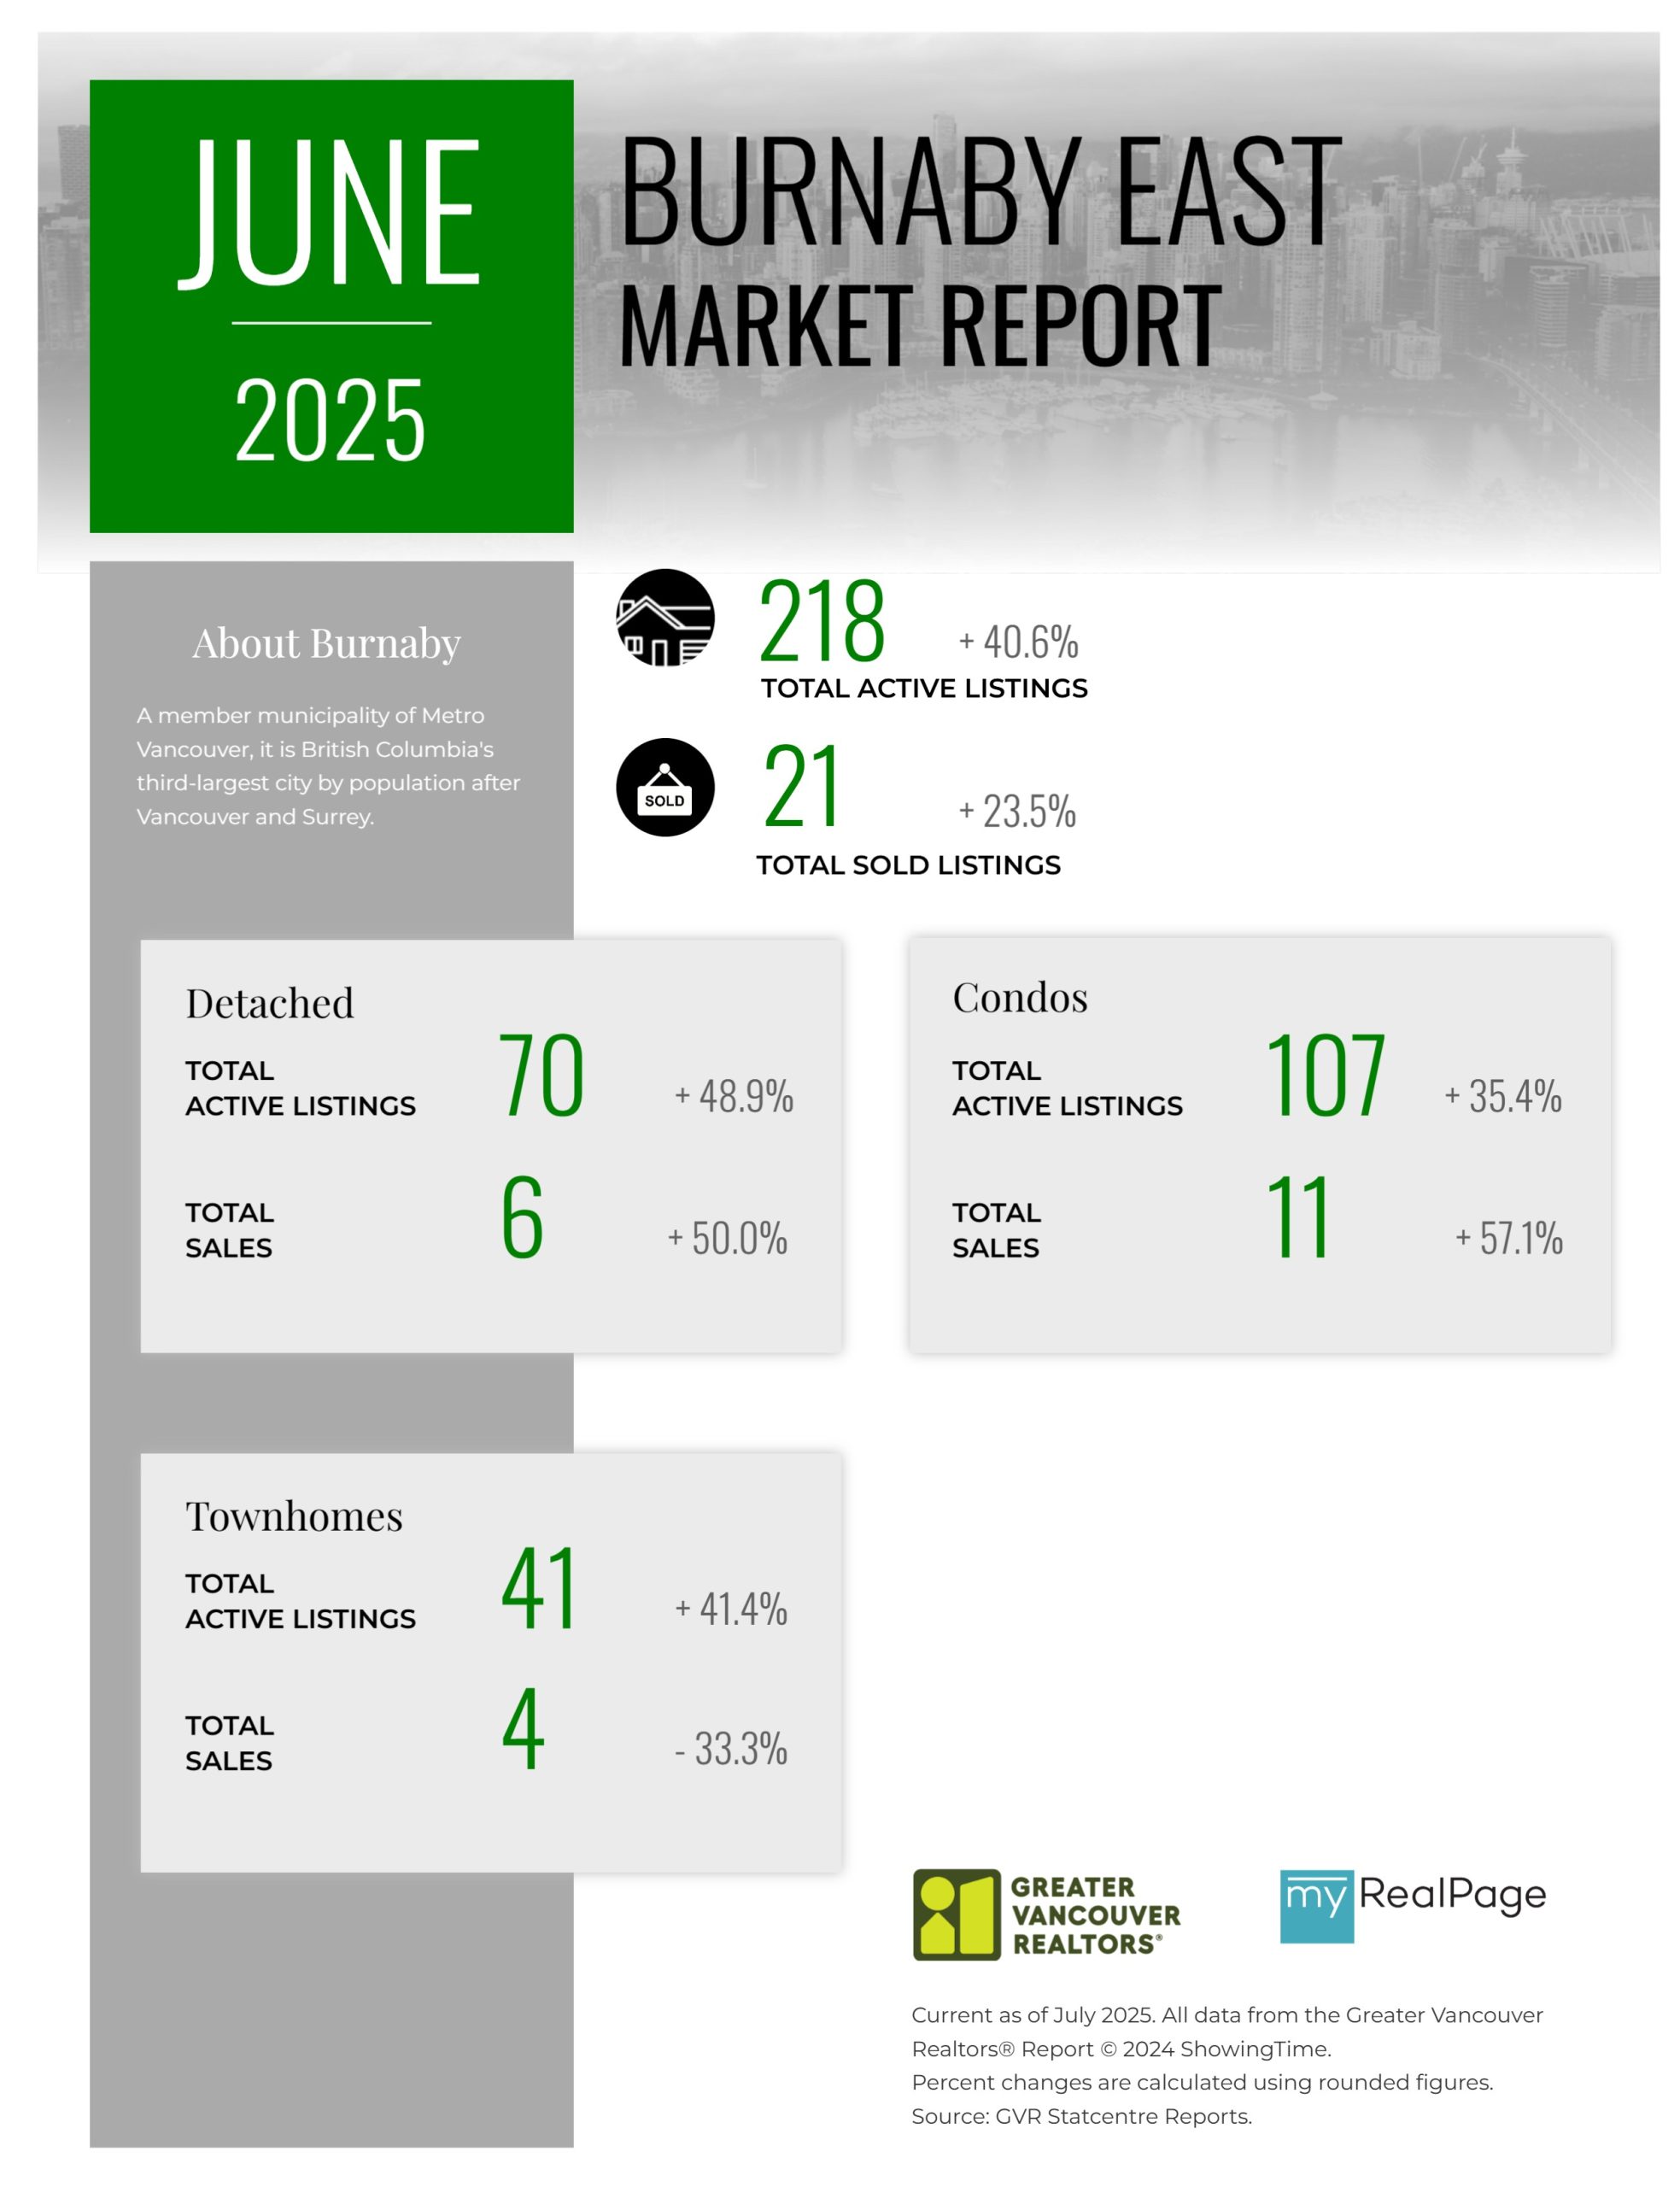
Printable Version – GVR June 2025 Data Infographics Report Burnaby East
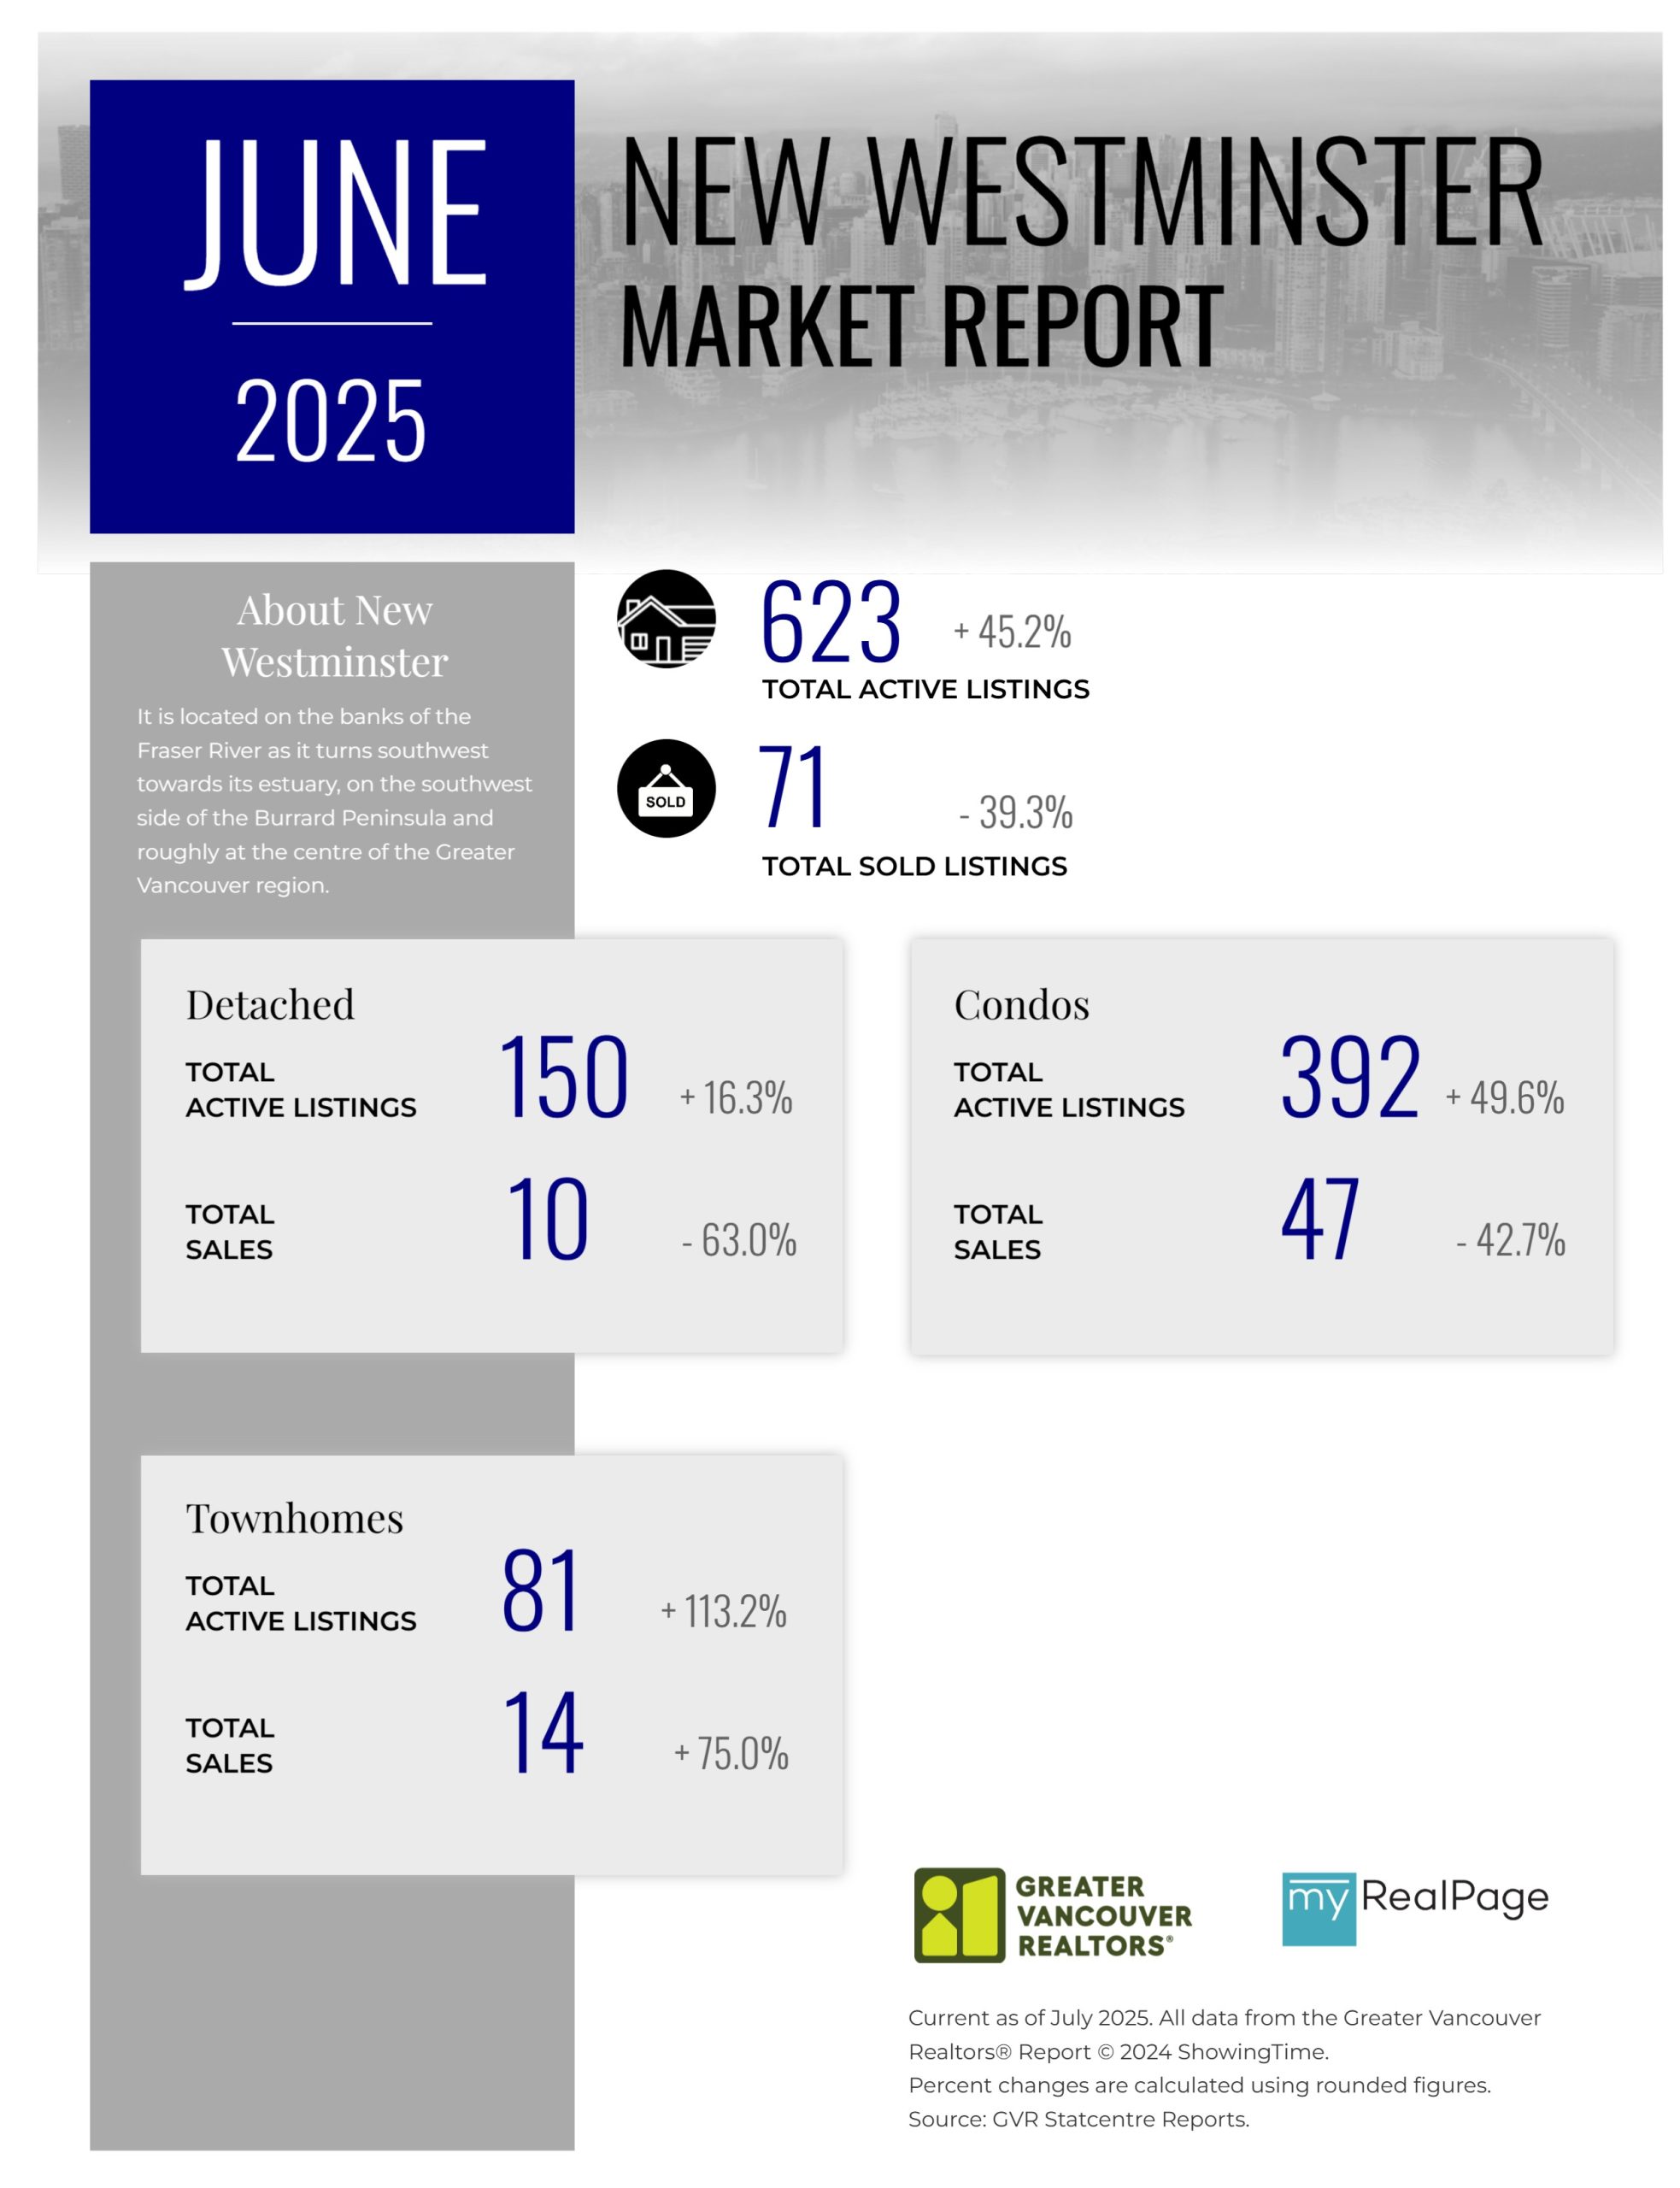
Printable Version – GVR June 2025 Data Infographics Report New Westminster
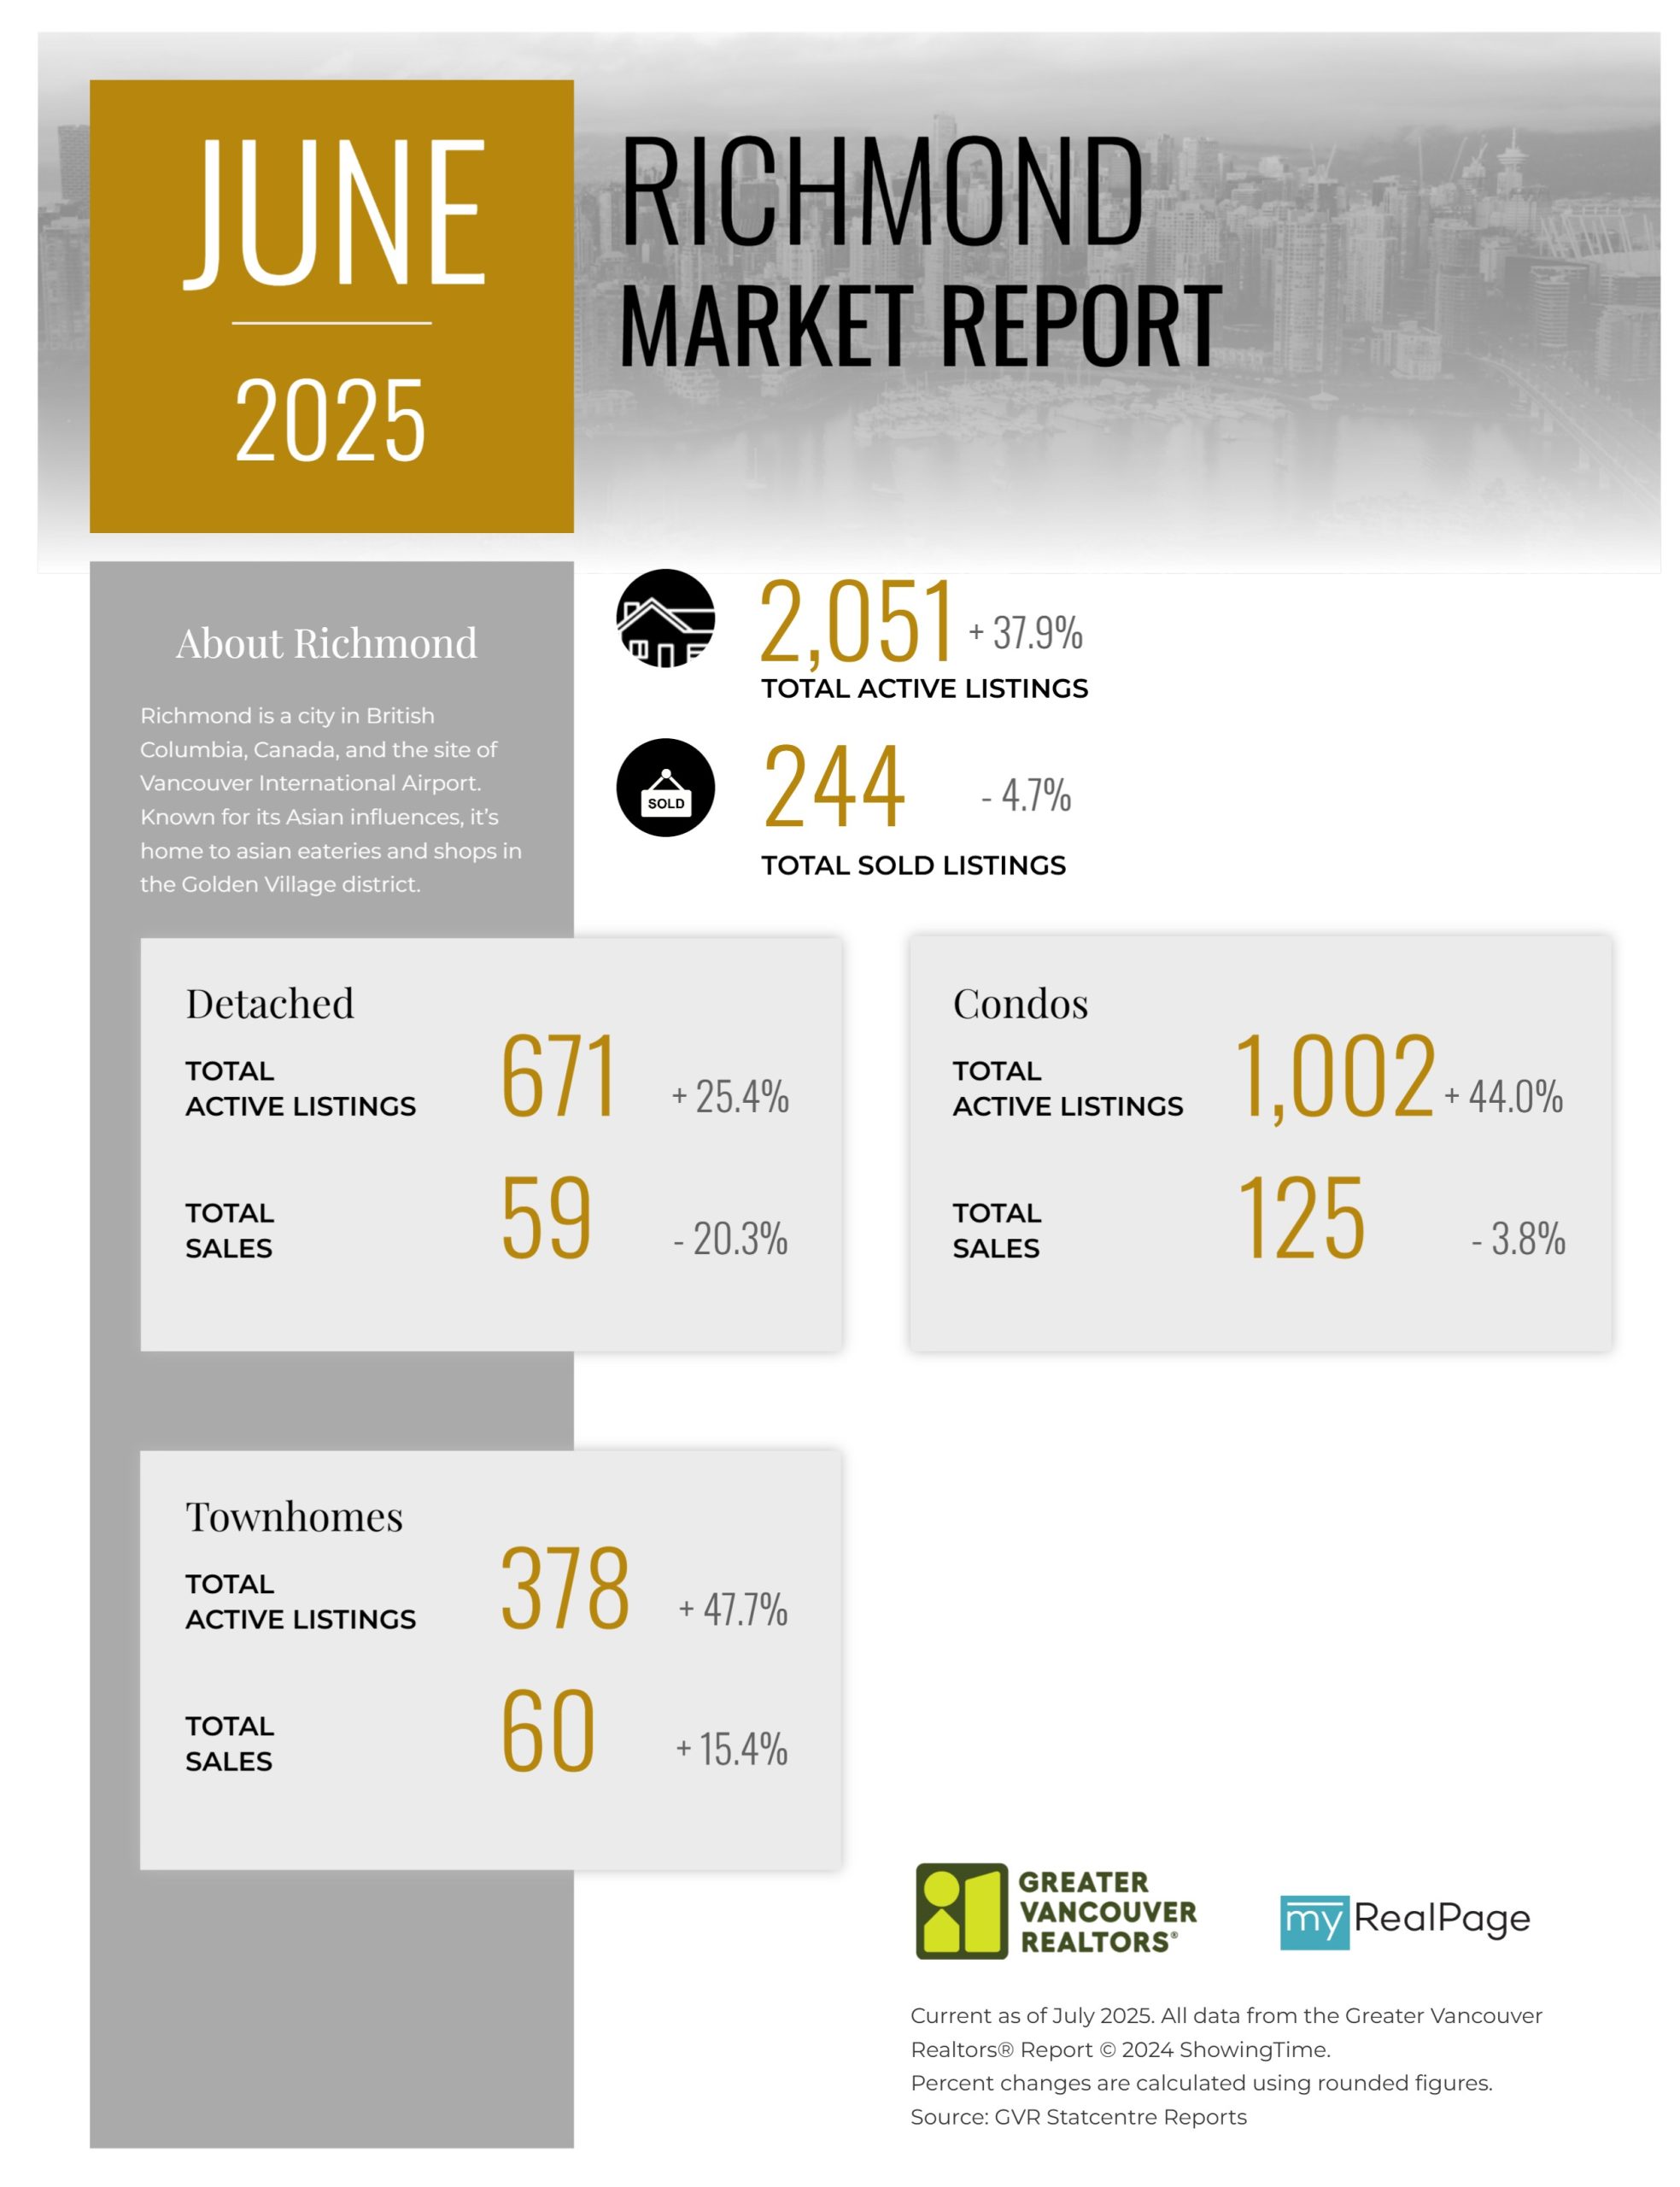
Printable Version – GVR June 2025 Data Infographics Report Richmond
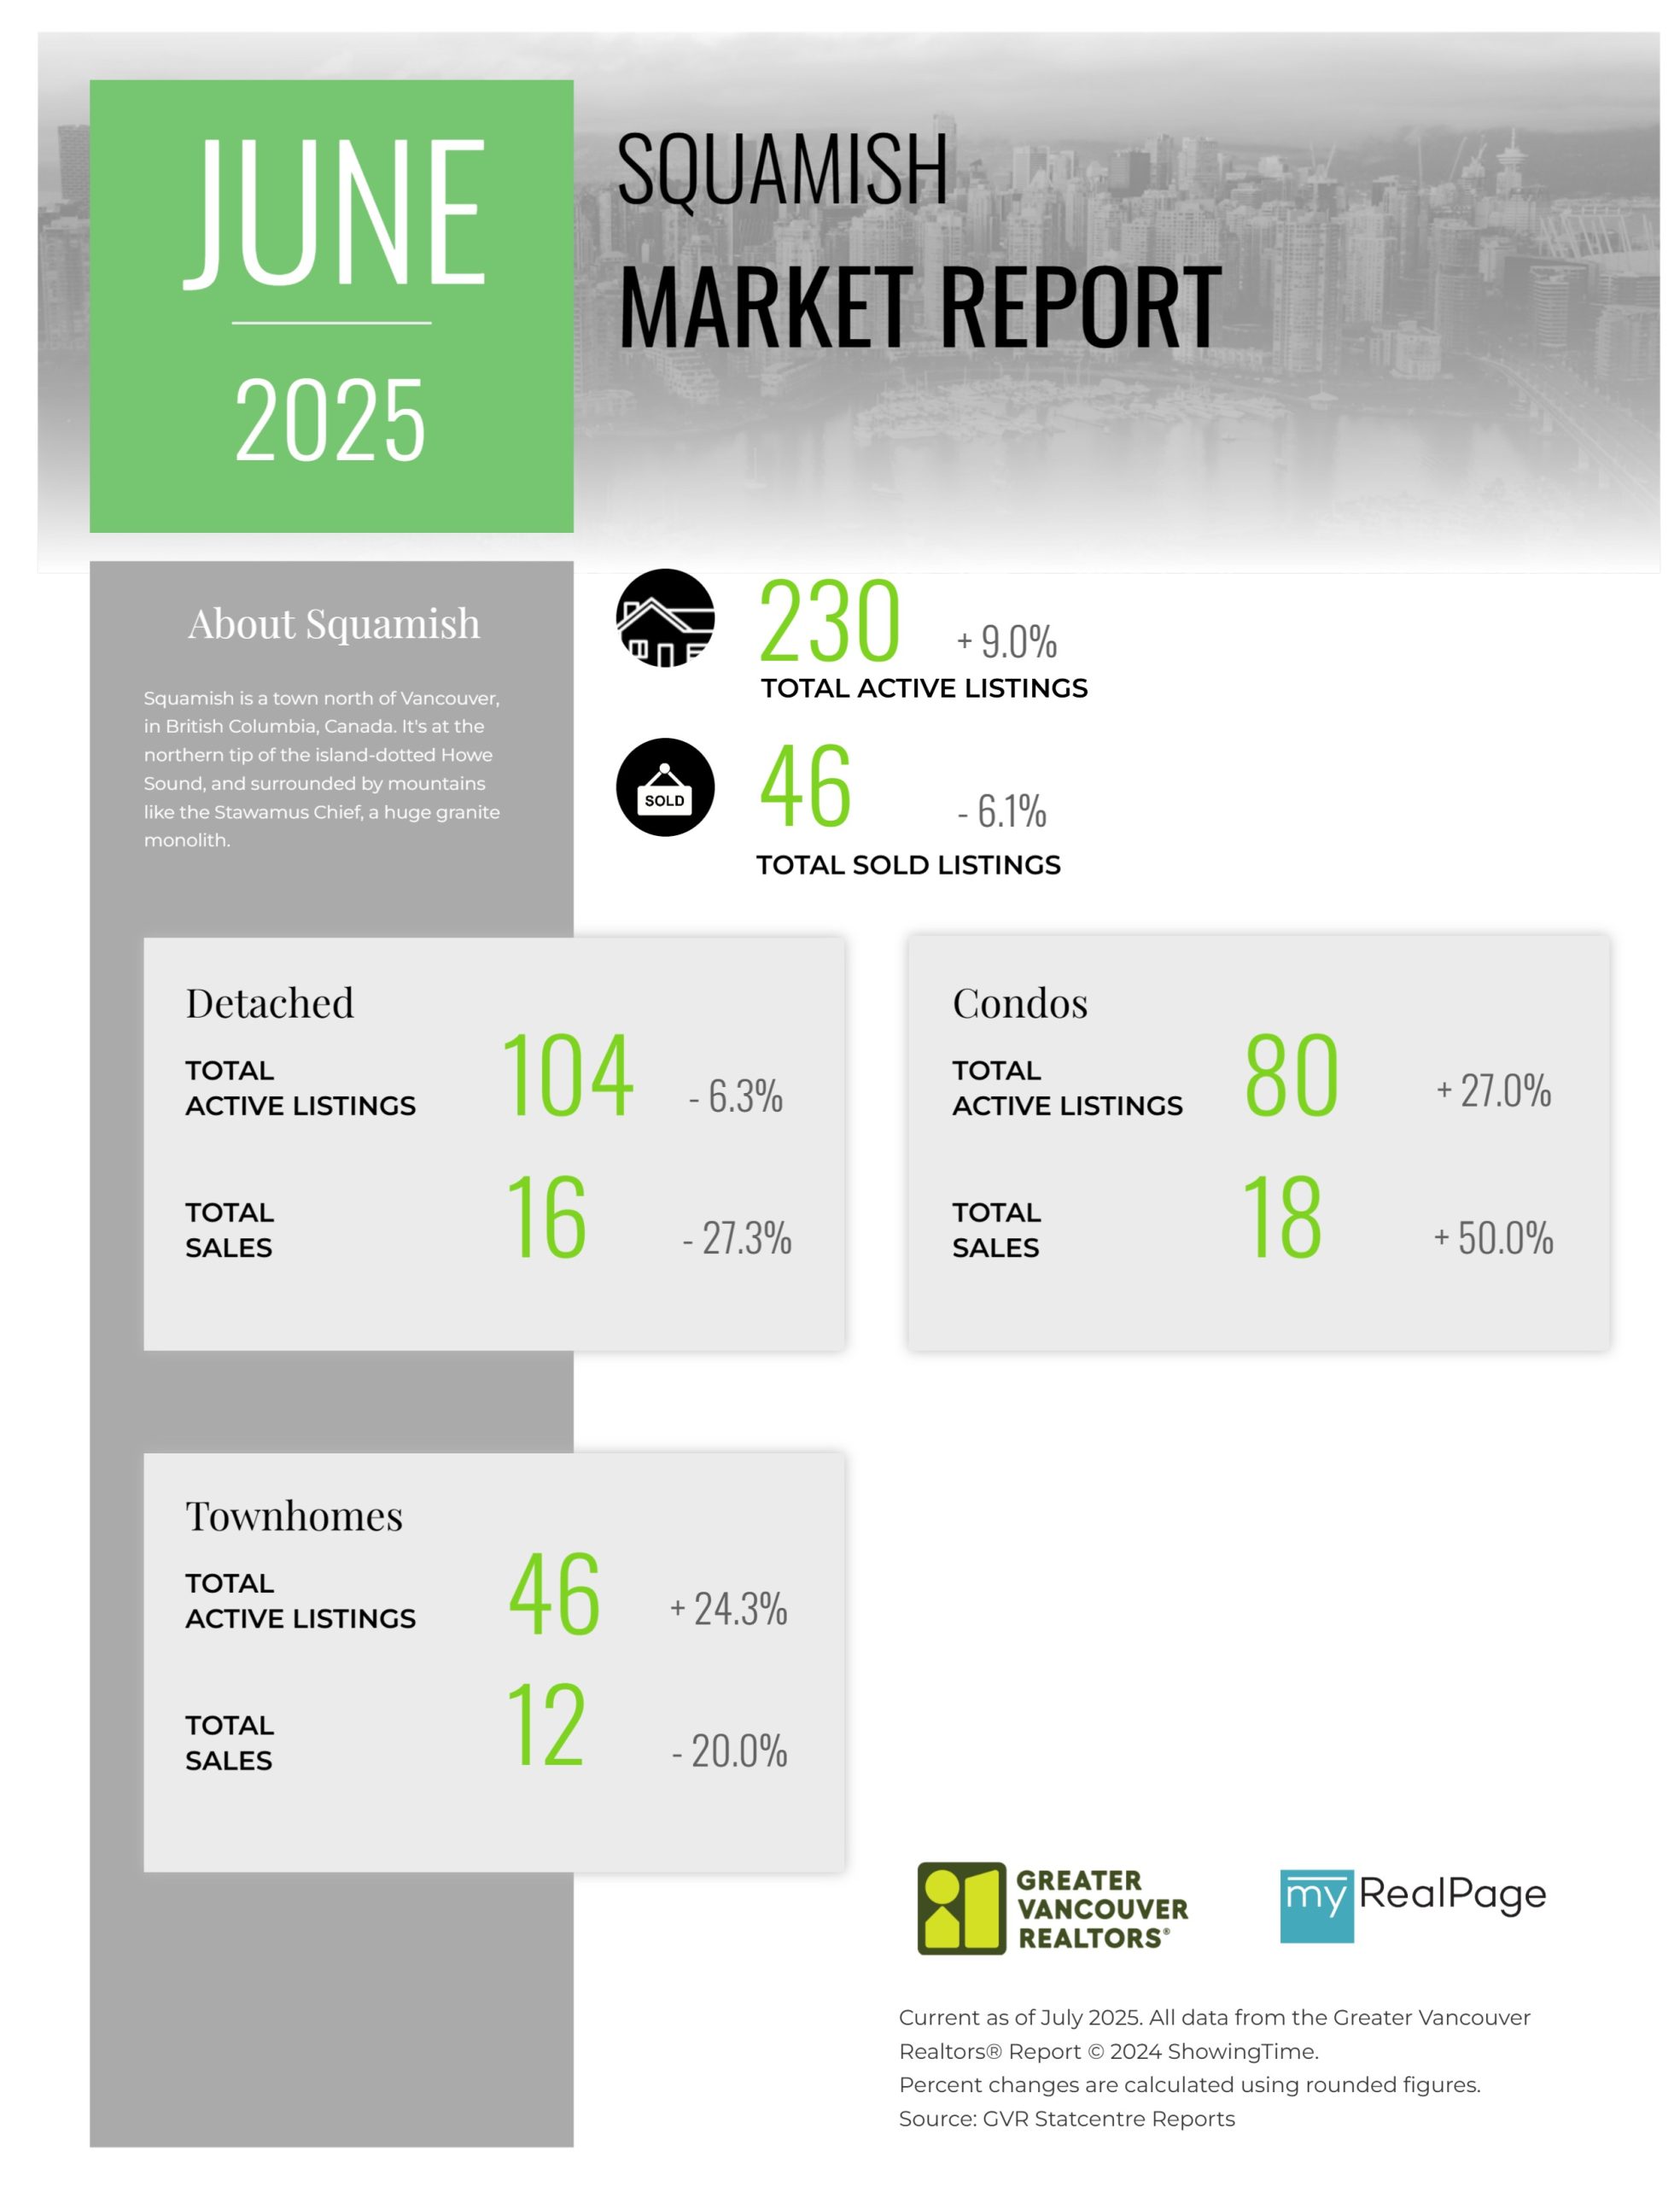
Printable Version – GVR June 2025 Data Infographics Report Squamish
Last Updated on July 8, 2025 by myRealPage
