INFOGRAPHICS: August 2025 GVR Greater Vancouver Market Reports

Easing home prices help lift sales in August
Easing prices brought more Metro Vancouver* homebuyers off the sidelines in August, with home sales on the MLS® up nearly three per cent from August last year.
The Greater Vancouver REALTORS® (GVR) reports that residential sales in the region totalled 1,959 in August 2025, a 2.9 per cent increase from the 1,904 sales recorded in August 2024. This was 19.2 per cent below the 10-year seasonal average (2,424).
“The August sales figures add further confirmation that sales activity across Metro Vancouver appears to be recovering, albeit somewhat slowly, from the challenging first half of the year. Sales in the detached and attached segments are up over ten per cent from last August, which suggests buyers shopping in more expensive price points are re-entering the market in a meaningful way.” said Andrew Lis, GVR director of economics and data analytics
Read the full report on the REBGV website!
The following data is a comparison between August 2025 and August 2024 numbers, and is current as of September of 2025. For last month’s update, you can check out our previous post!
Or follow this link for all our GVR Infographics!
These infographics cover current trends in several areas within the Greater Vancouver region. Click on the images for a larger view!
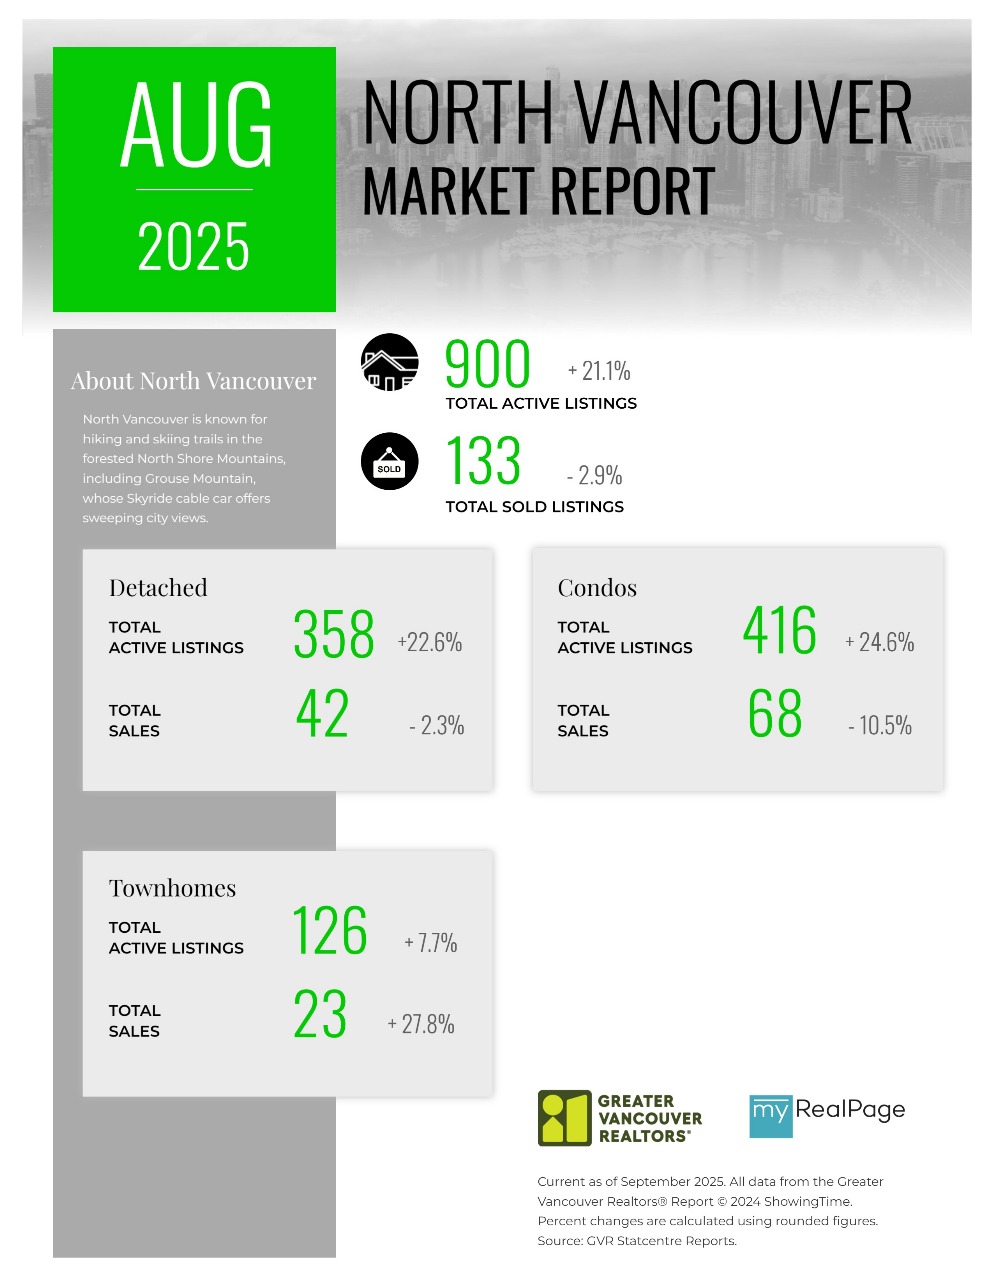
Printable Version – GVR August 2025 Data Infographic Report North Vancouver
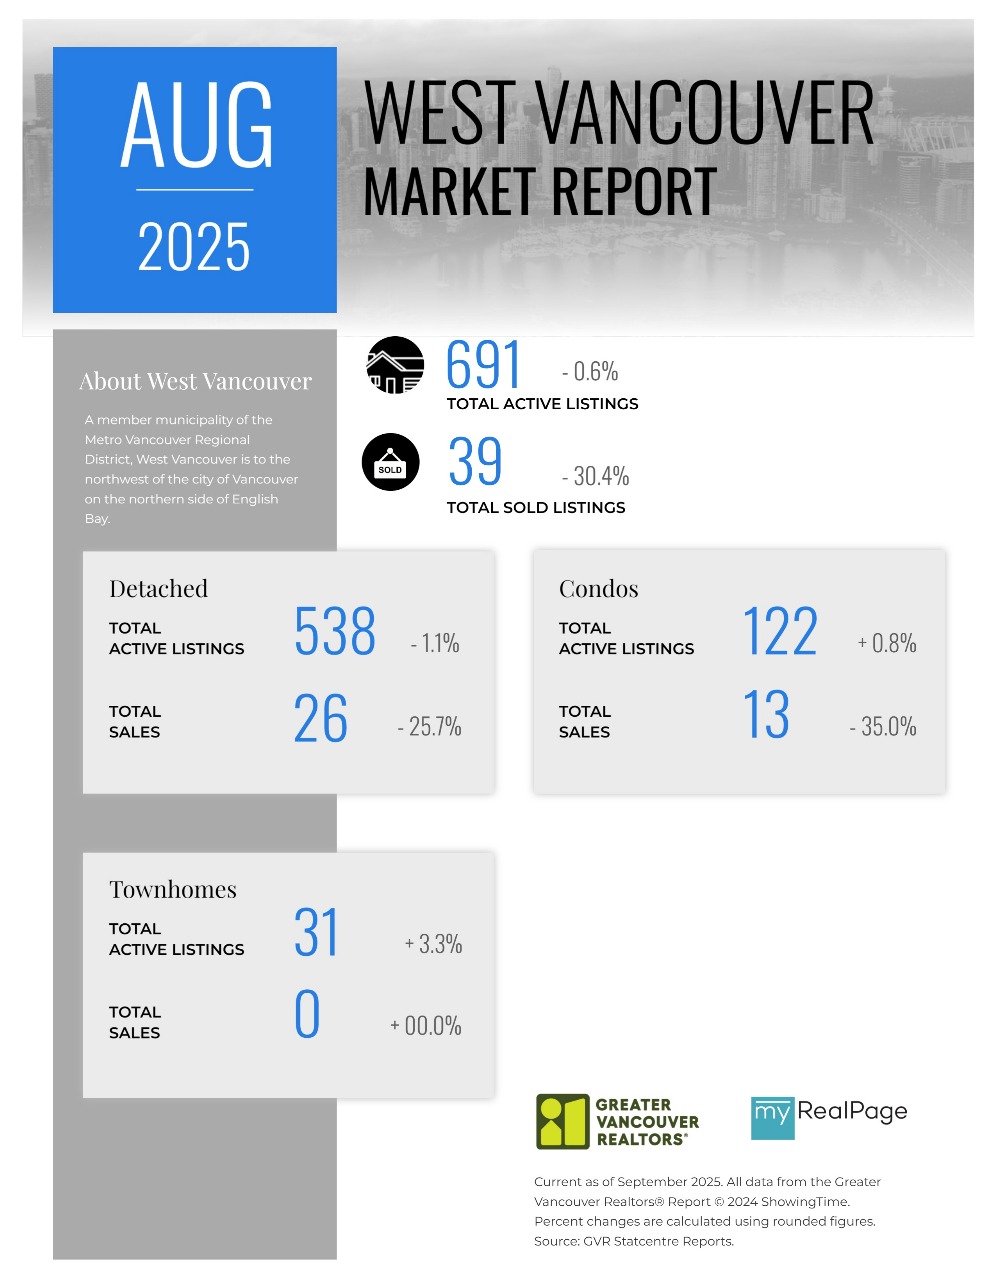
Printable Version – GVR August 2025 Data Infographics Report West Vancouver
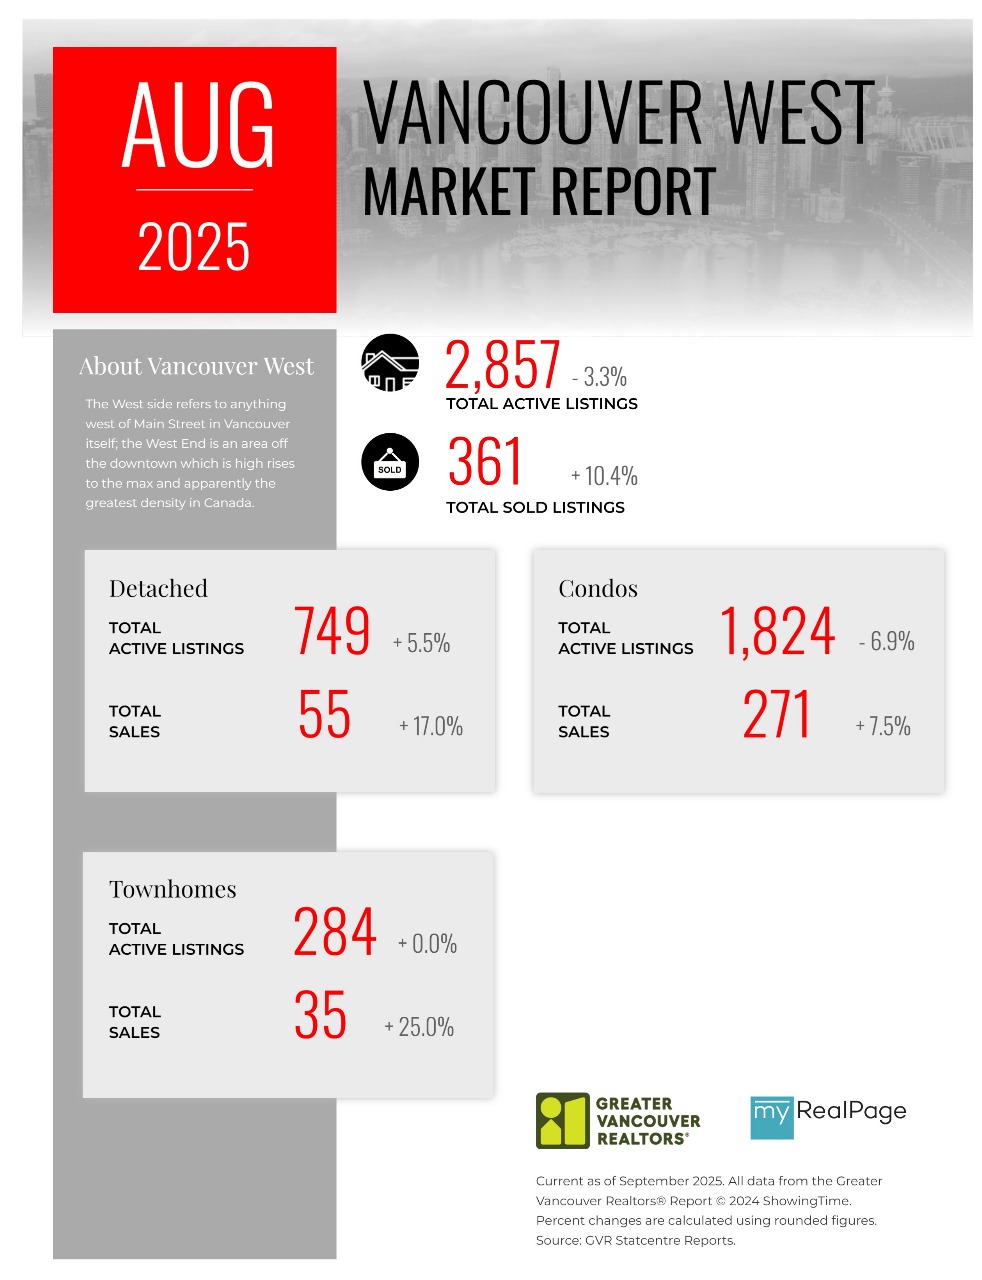
Printable Version – GVR August 2025 Data Infographics Report Vancouver West
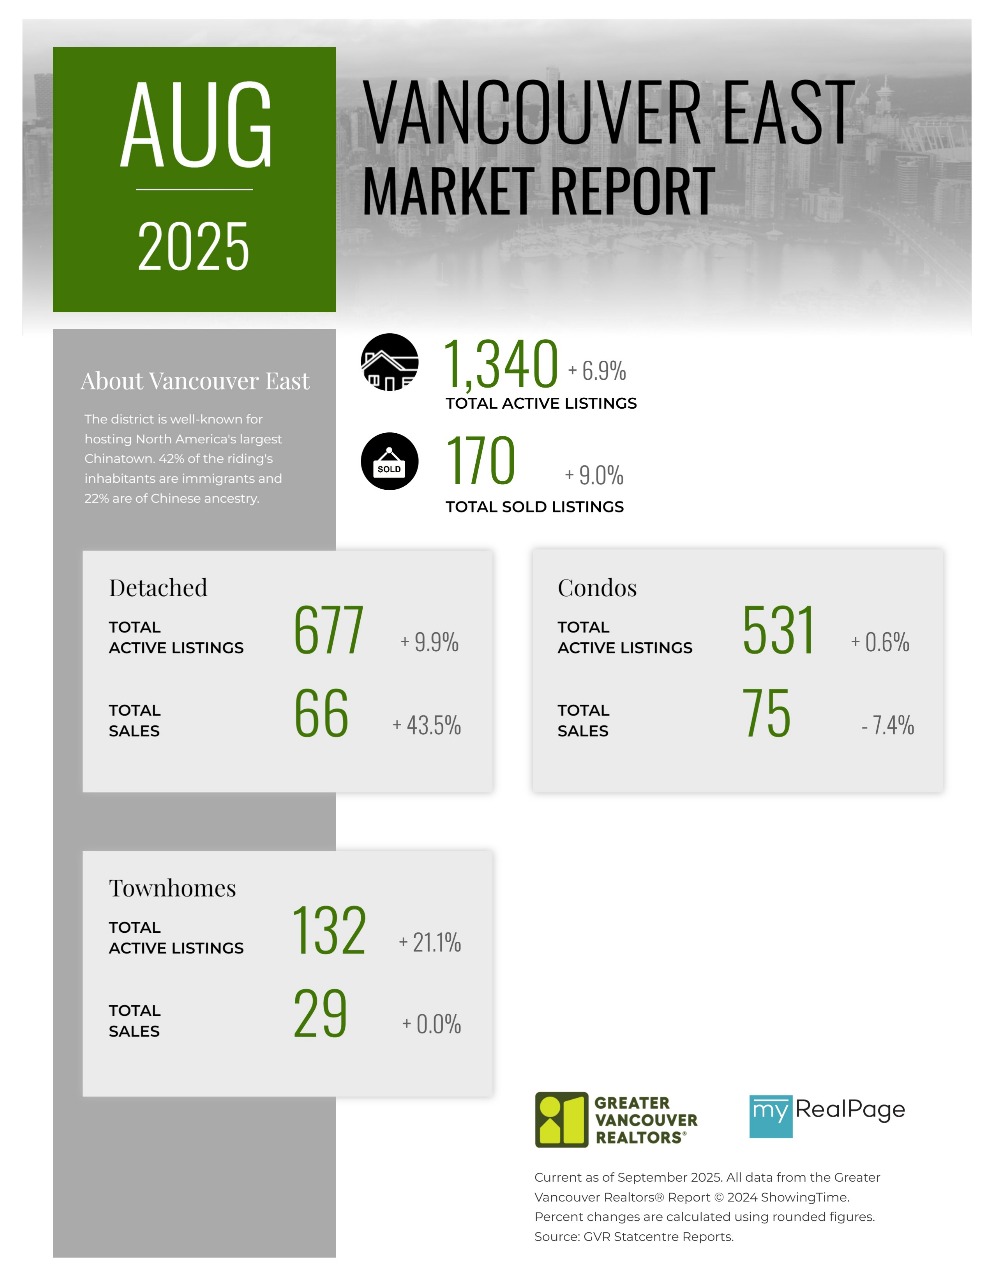
Printable Version – GVR August 2025 Data Infographics Report Vancouver East
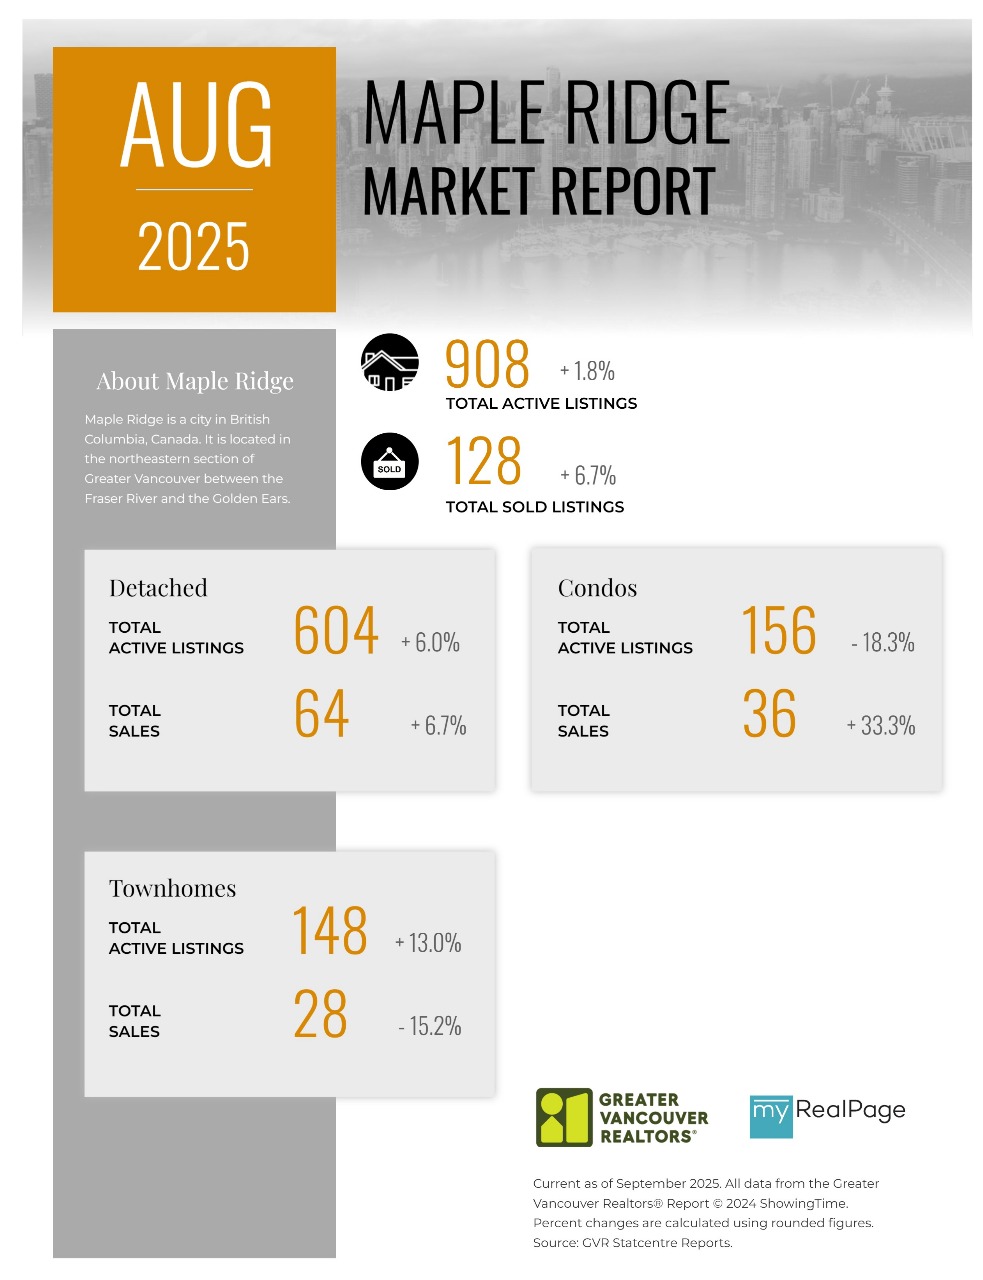
Printable Version – GVR August 2025 Data Infographic Report Maple Ridge
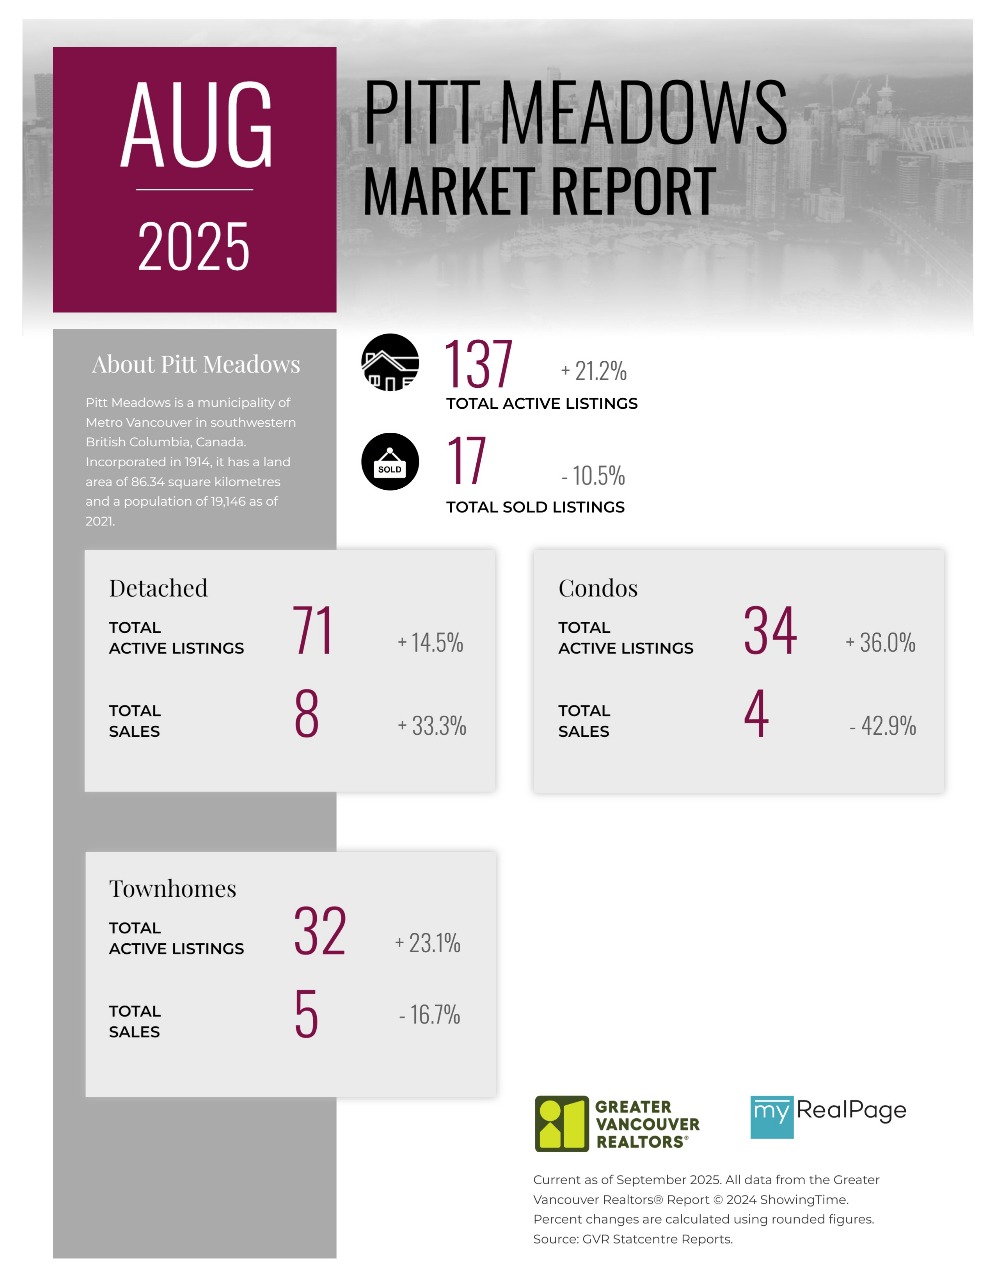
Printable Version – GVR August 2025 Data Infographics Report Pitt Meadows
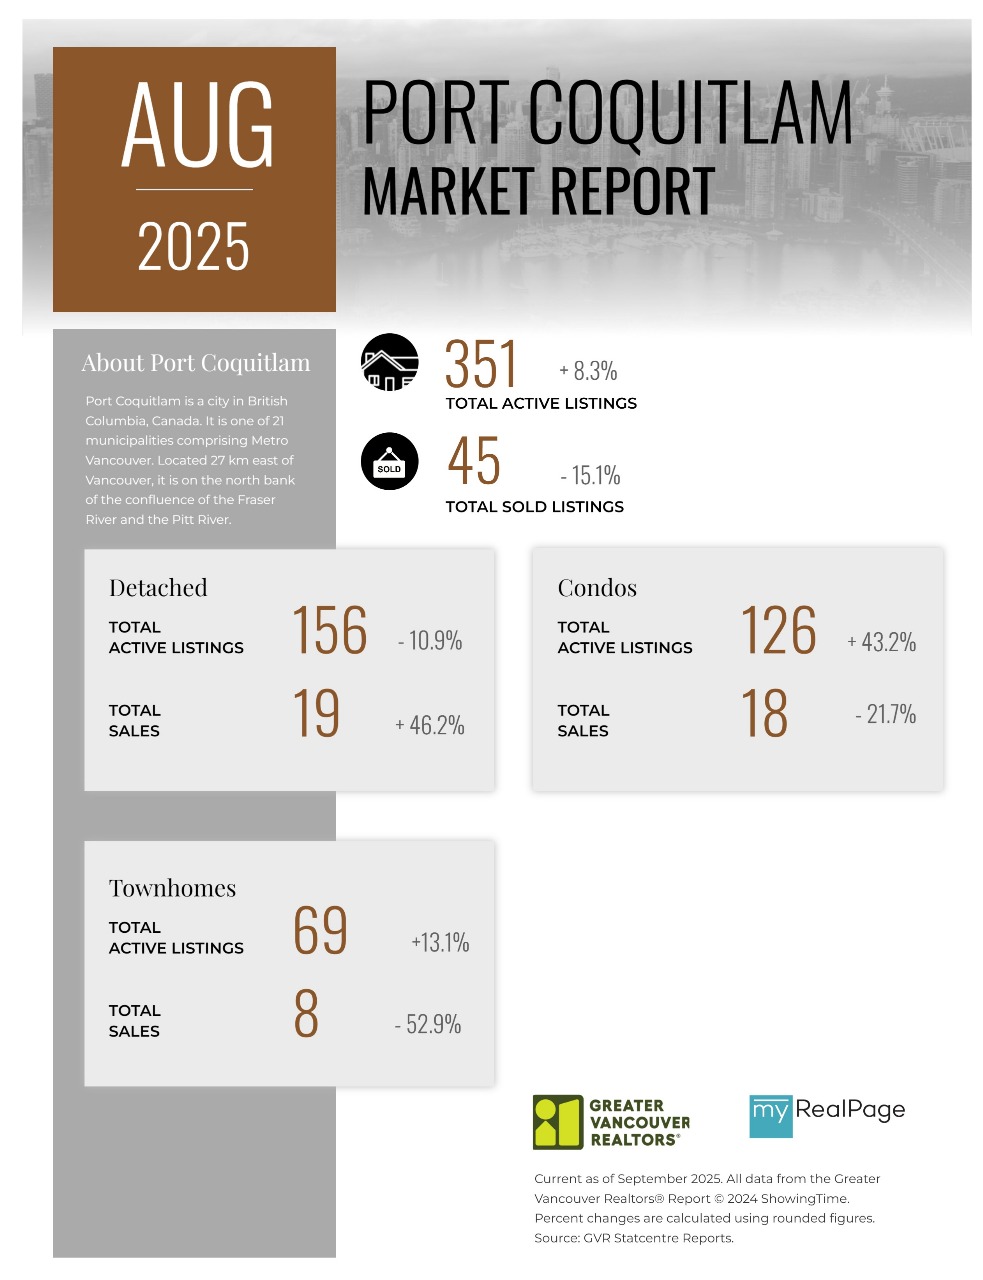
Printable Version – GVR August 2025 Data Infographics Report Port Coquitlam
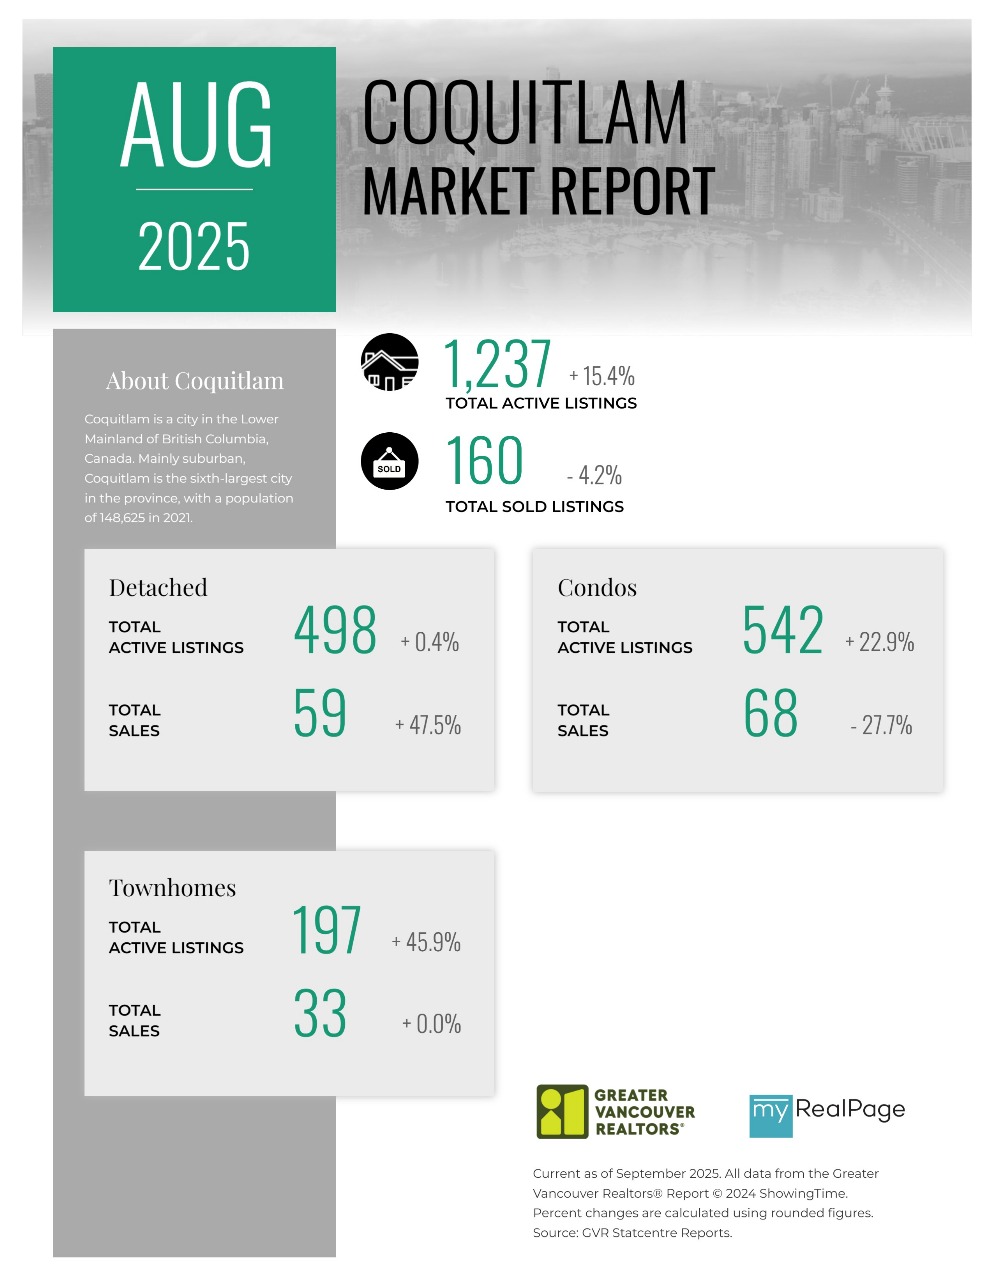
Printable Version – GVR August 2025 Data Infographics Report Coquitlam
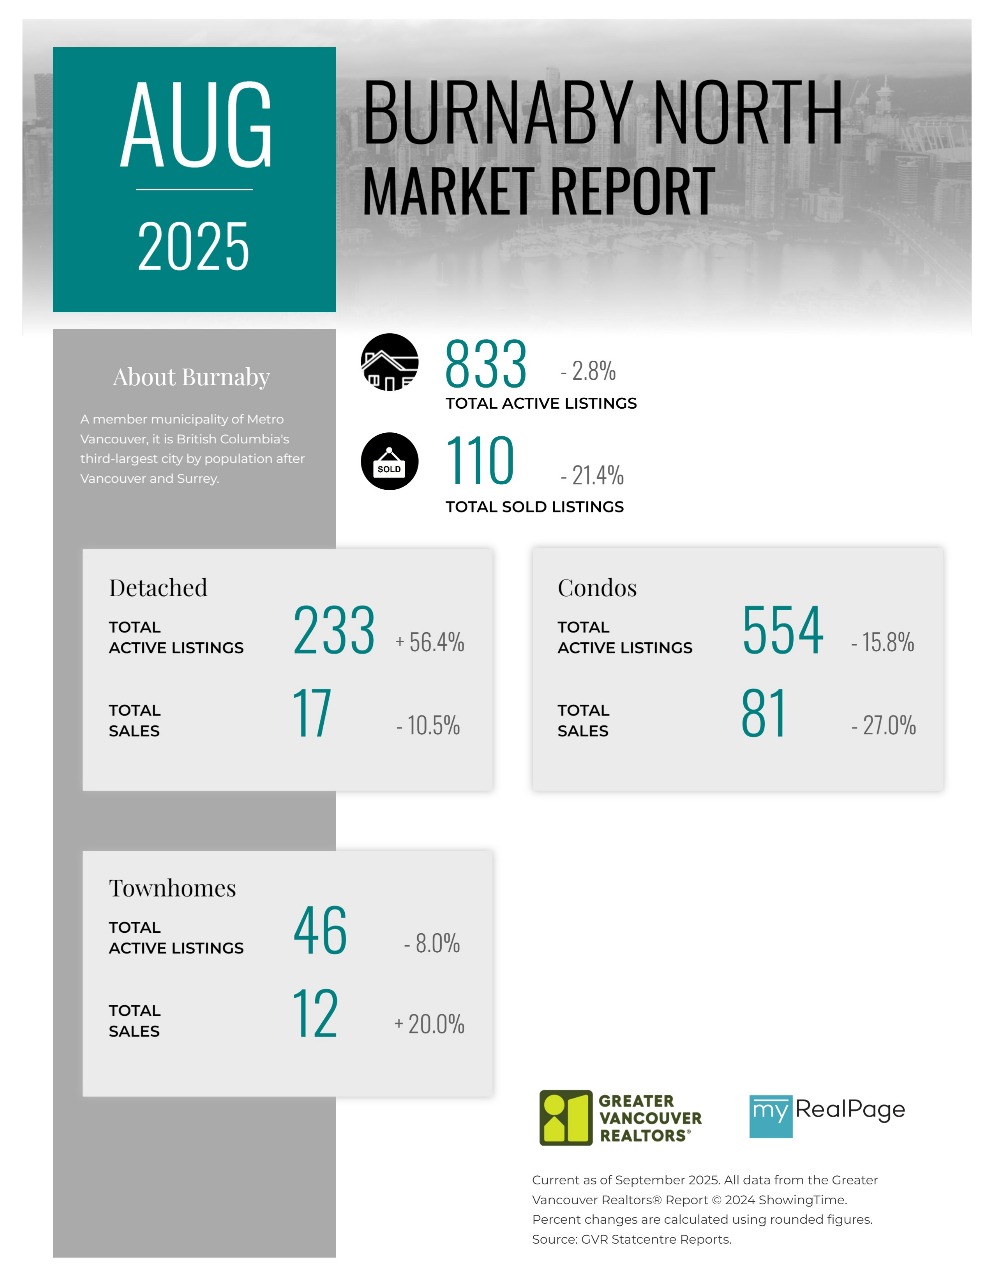
Printable Version – GVR August 2025 Data Infographic Report Burnaby North
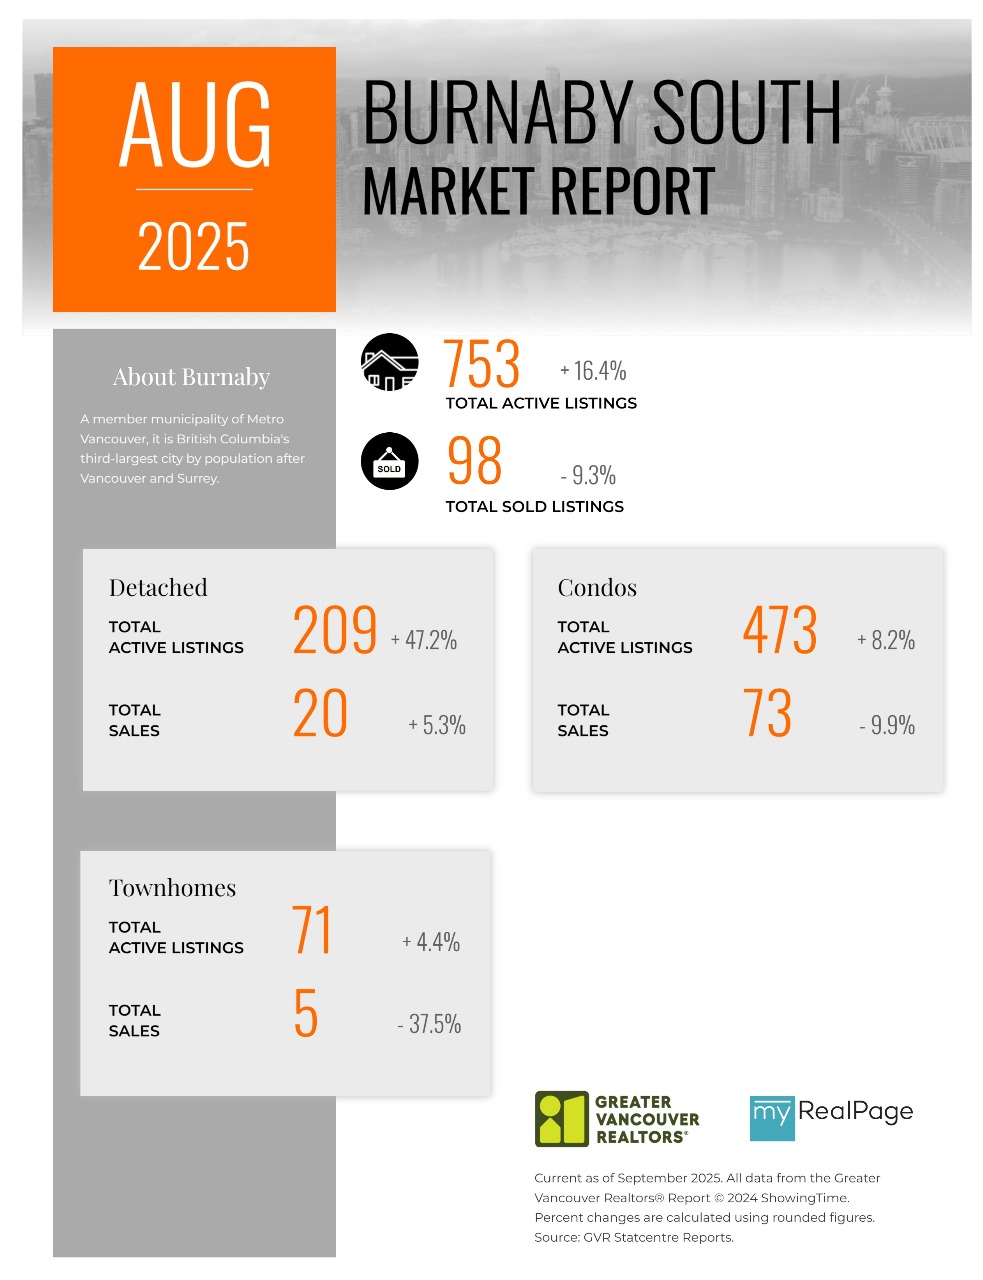
Printable Version – GVR August 2025 Data Infographics Report Burnaby South
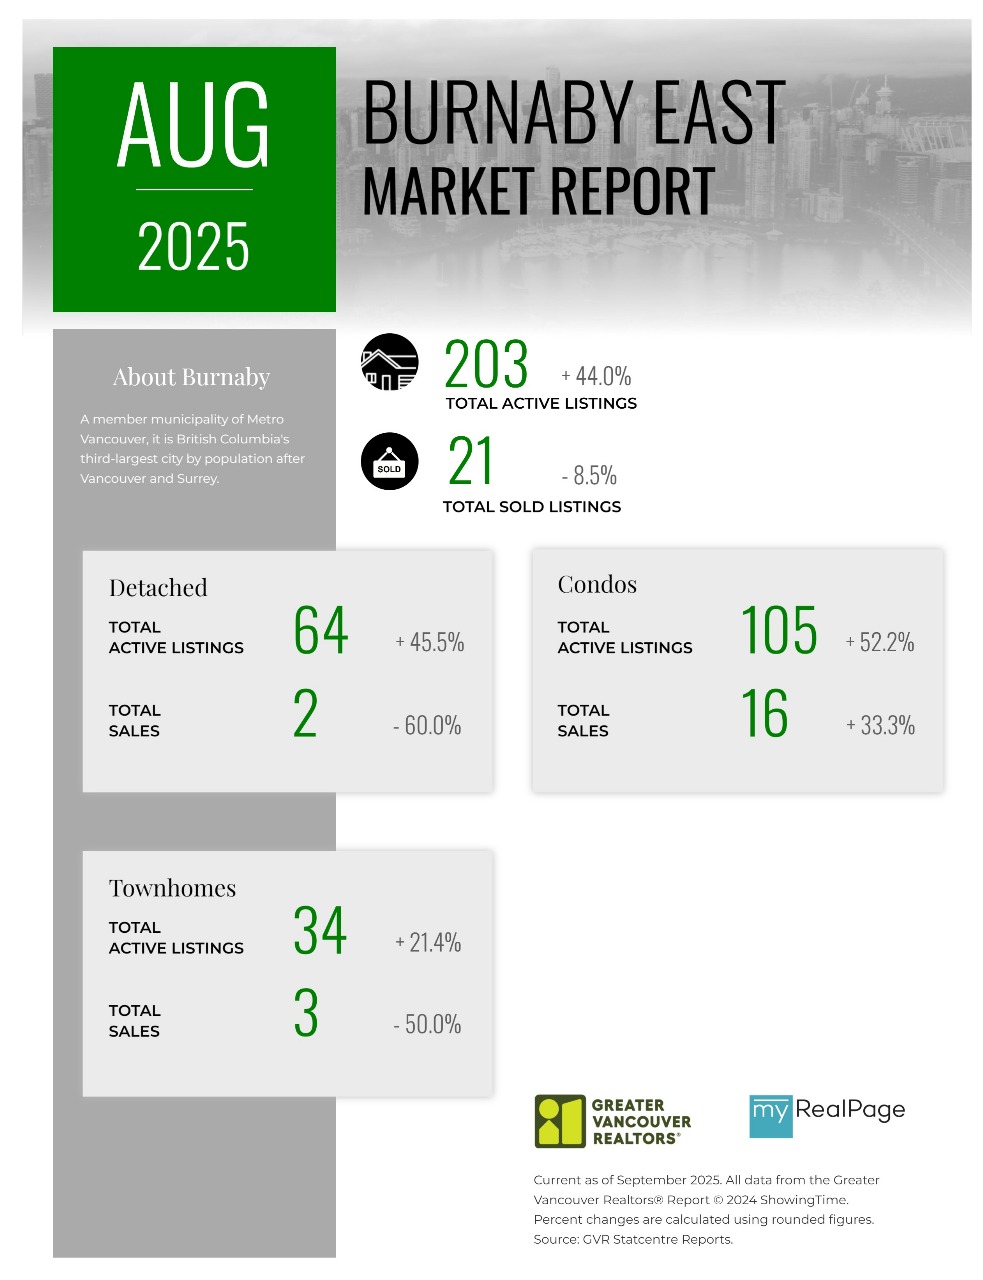
Printable Version – GVR August 2025 Data Infographics Report Burnaby East
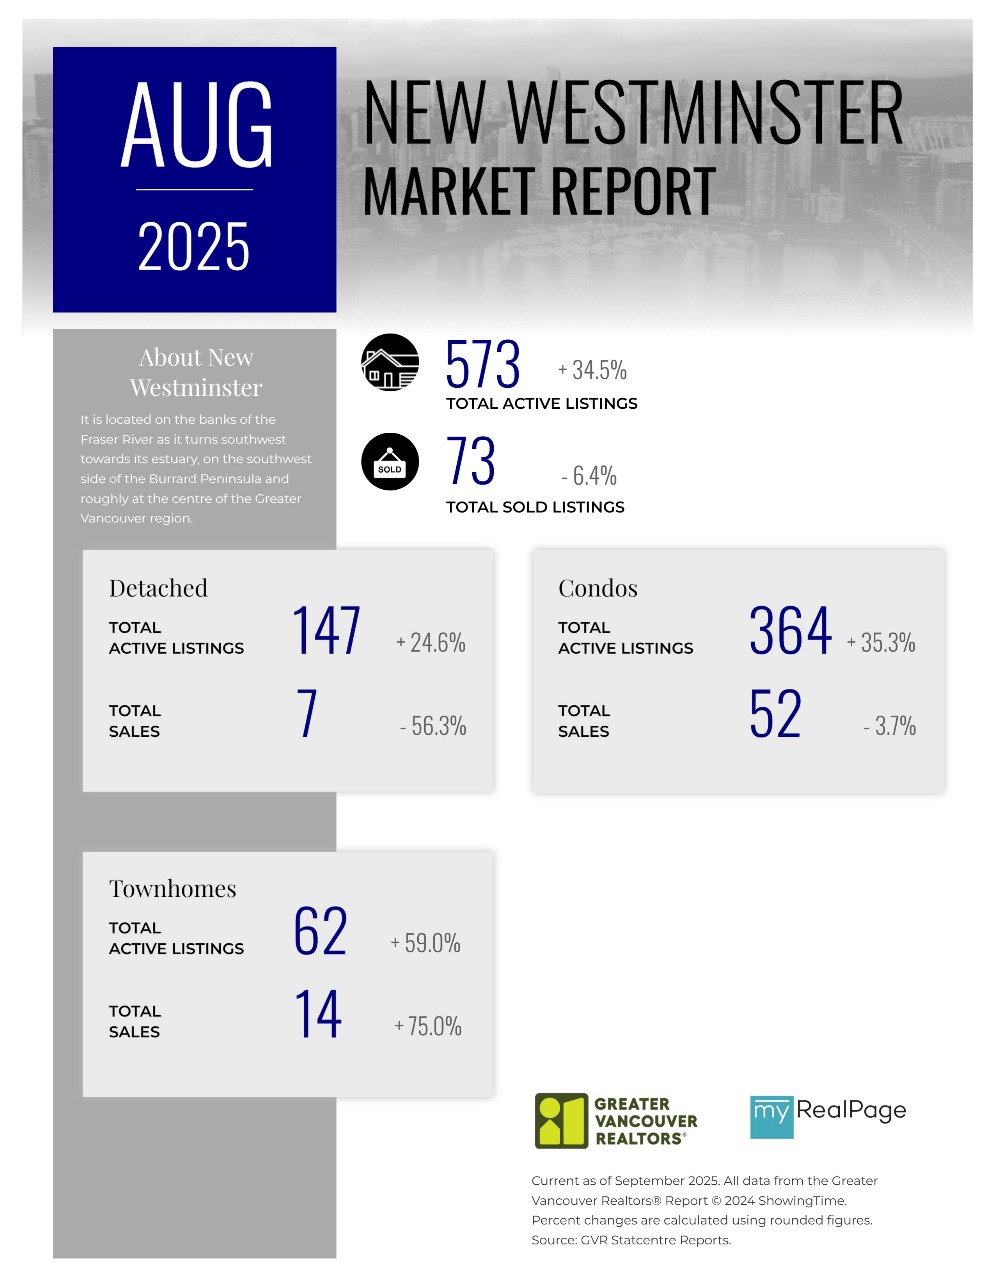
Printable Version – GVR August 2025 Data Infographics Report New Westminster
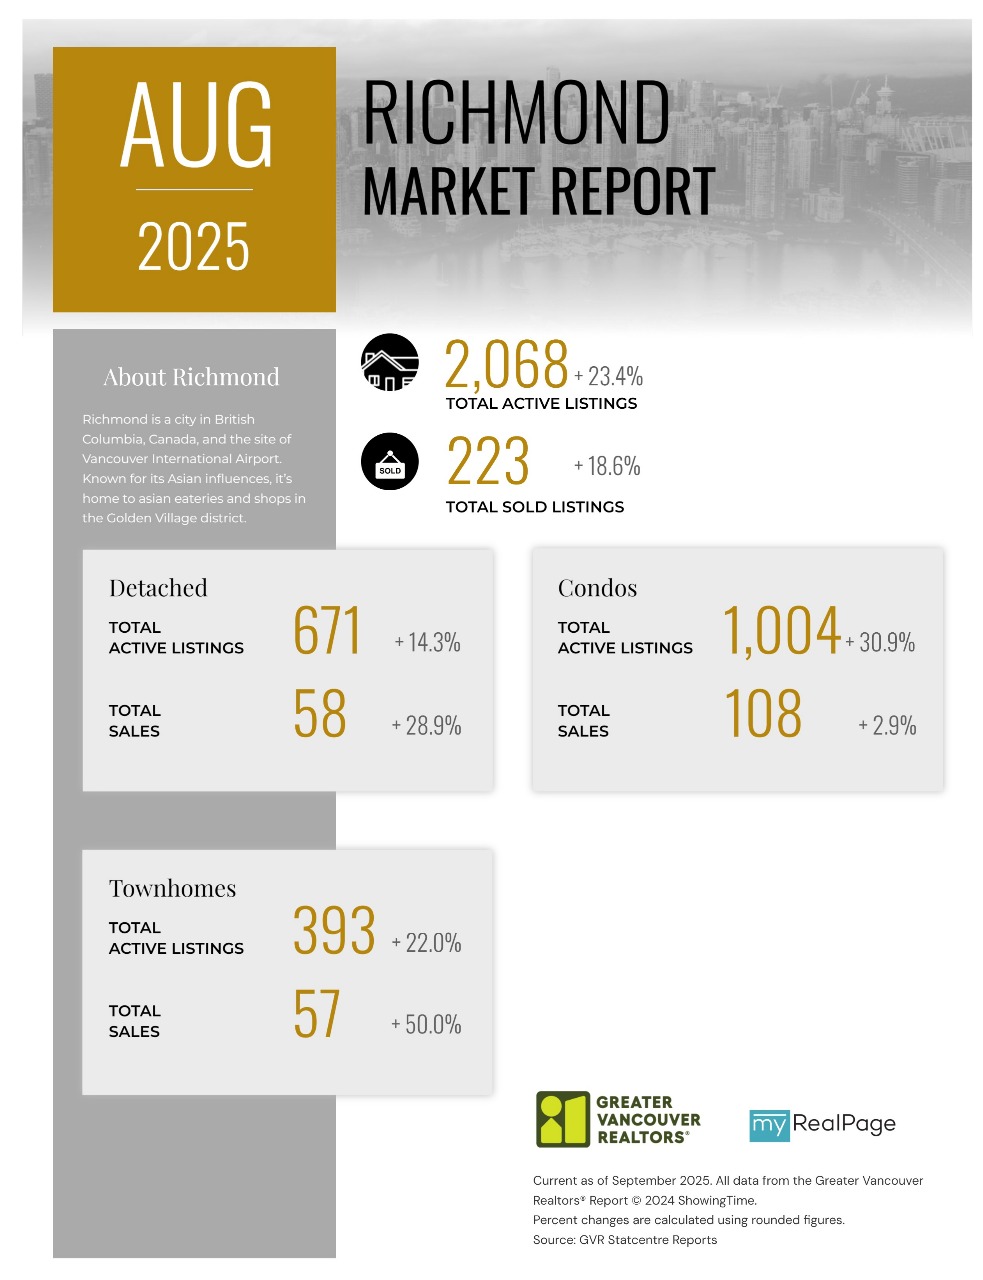
Printable Version – GVR August 2025 Data Infographics Report Richmond
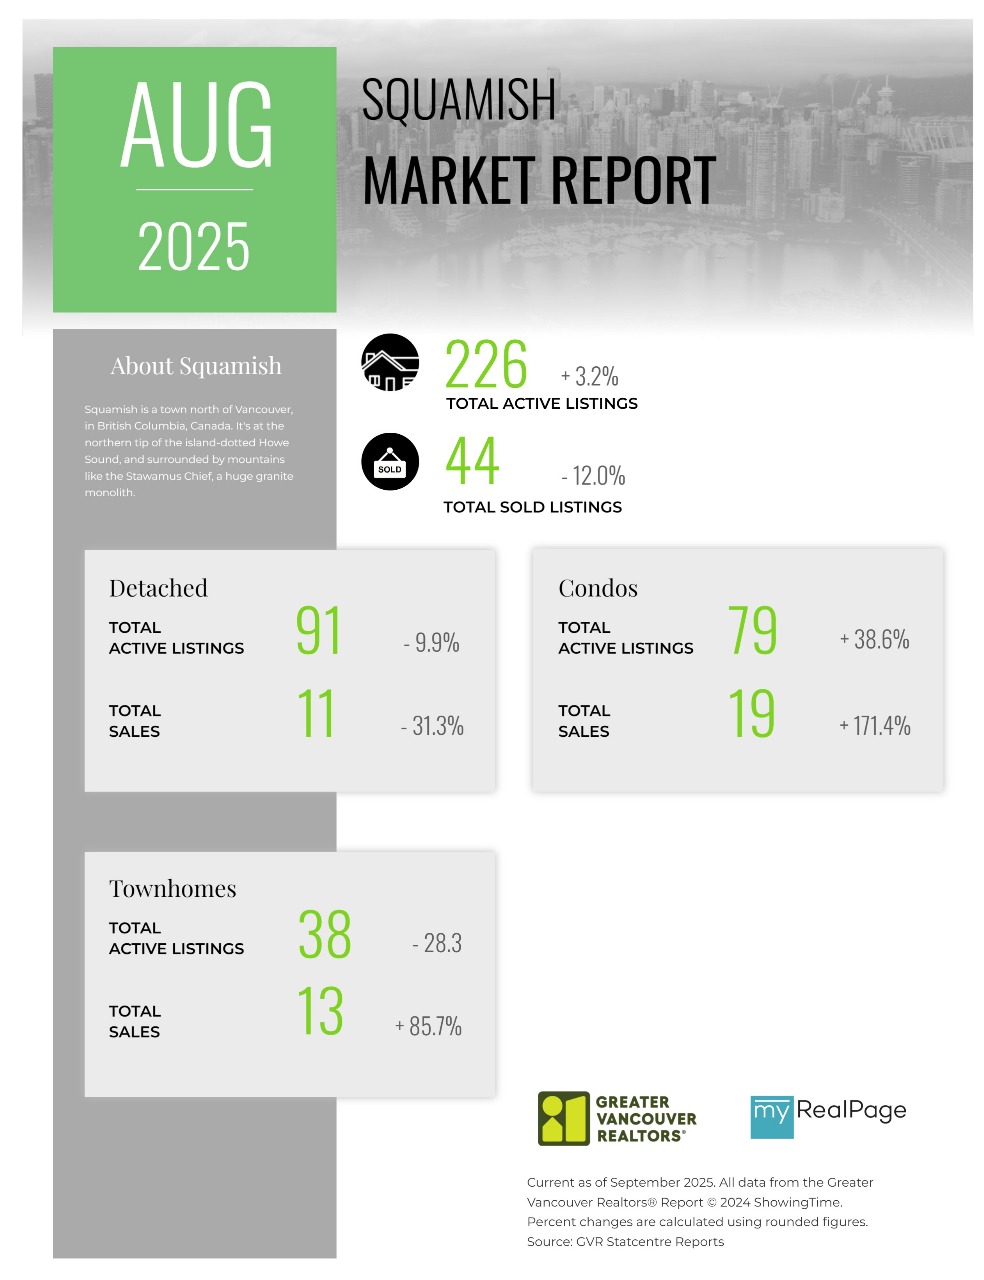
Printable Version – GVR August 2025 Data Infographics Report Squamish
Last Updated on September 8, 2025 by myRealPage
