INFOGRAPHICS: September 2025 GVR Greater Vancouver Market Reports

Fall market favours buyers
Another Bank of Canada rate cut and easing prices helped home sales registered on the MLS® in Metro Vancouver edge higher relative to September last year.
The Greater Vancouver REALTORS® (GVR) reports that residential sales in the region totalled 1,875 in September 2025, a 1.2 per cent increase from the 1,852 sales recorded in September 2024. This was 20.1 per cent below the 10-year seasonal average (2,348).
“With another cut to Bank of Canada’s policy rate behind us, and markets pricing in at least one more cut by the end of the year, Metro Vancouver homebuyers have reason to be optimistic about the fall market. Easing prices, near-record high inventory levels, and increasingly favourable borrowing costs are offering those looking to purchase a home this fall with plenty of opportunity.” said Andrew Lis, GVR director of economics and data analytics
Read the full report on the REBGV website!
The following data is a comparison between September 2025 and September 2024 numbers, and is current as of October of 2025. For last month’s update, you can check out our previous post!
Or follow this link for all our GVR Infographics!
These infographics cover current trends in several areas within the Greater Vancouver region. Click on the images for a larger view!
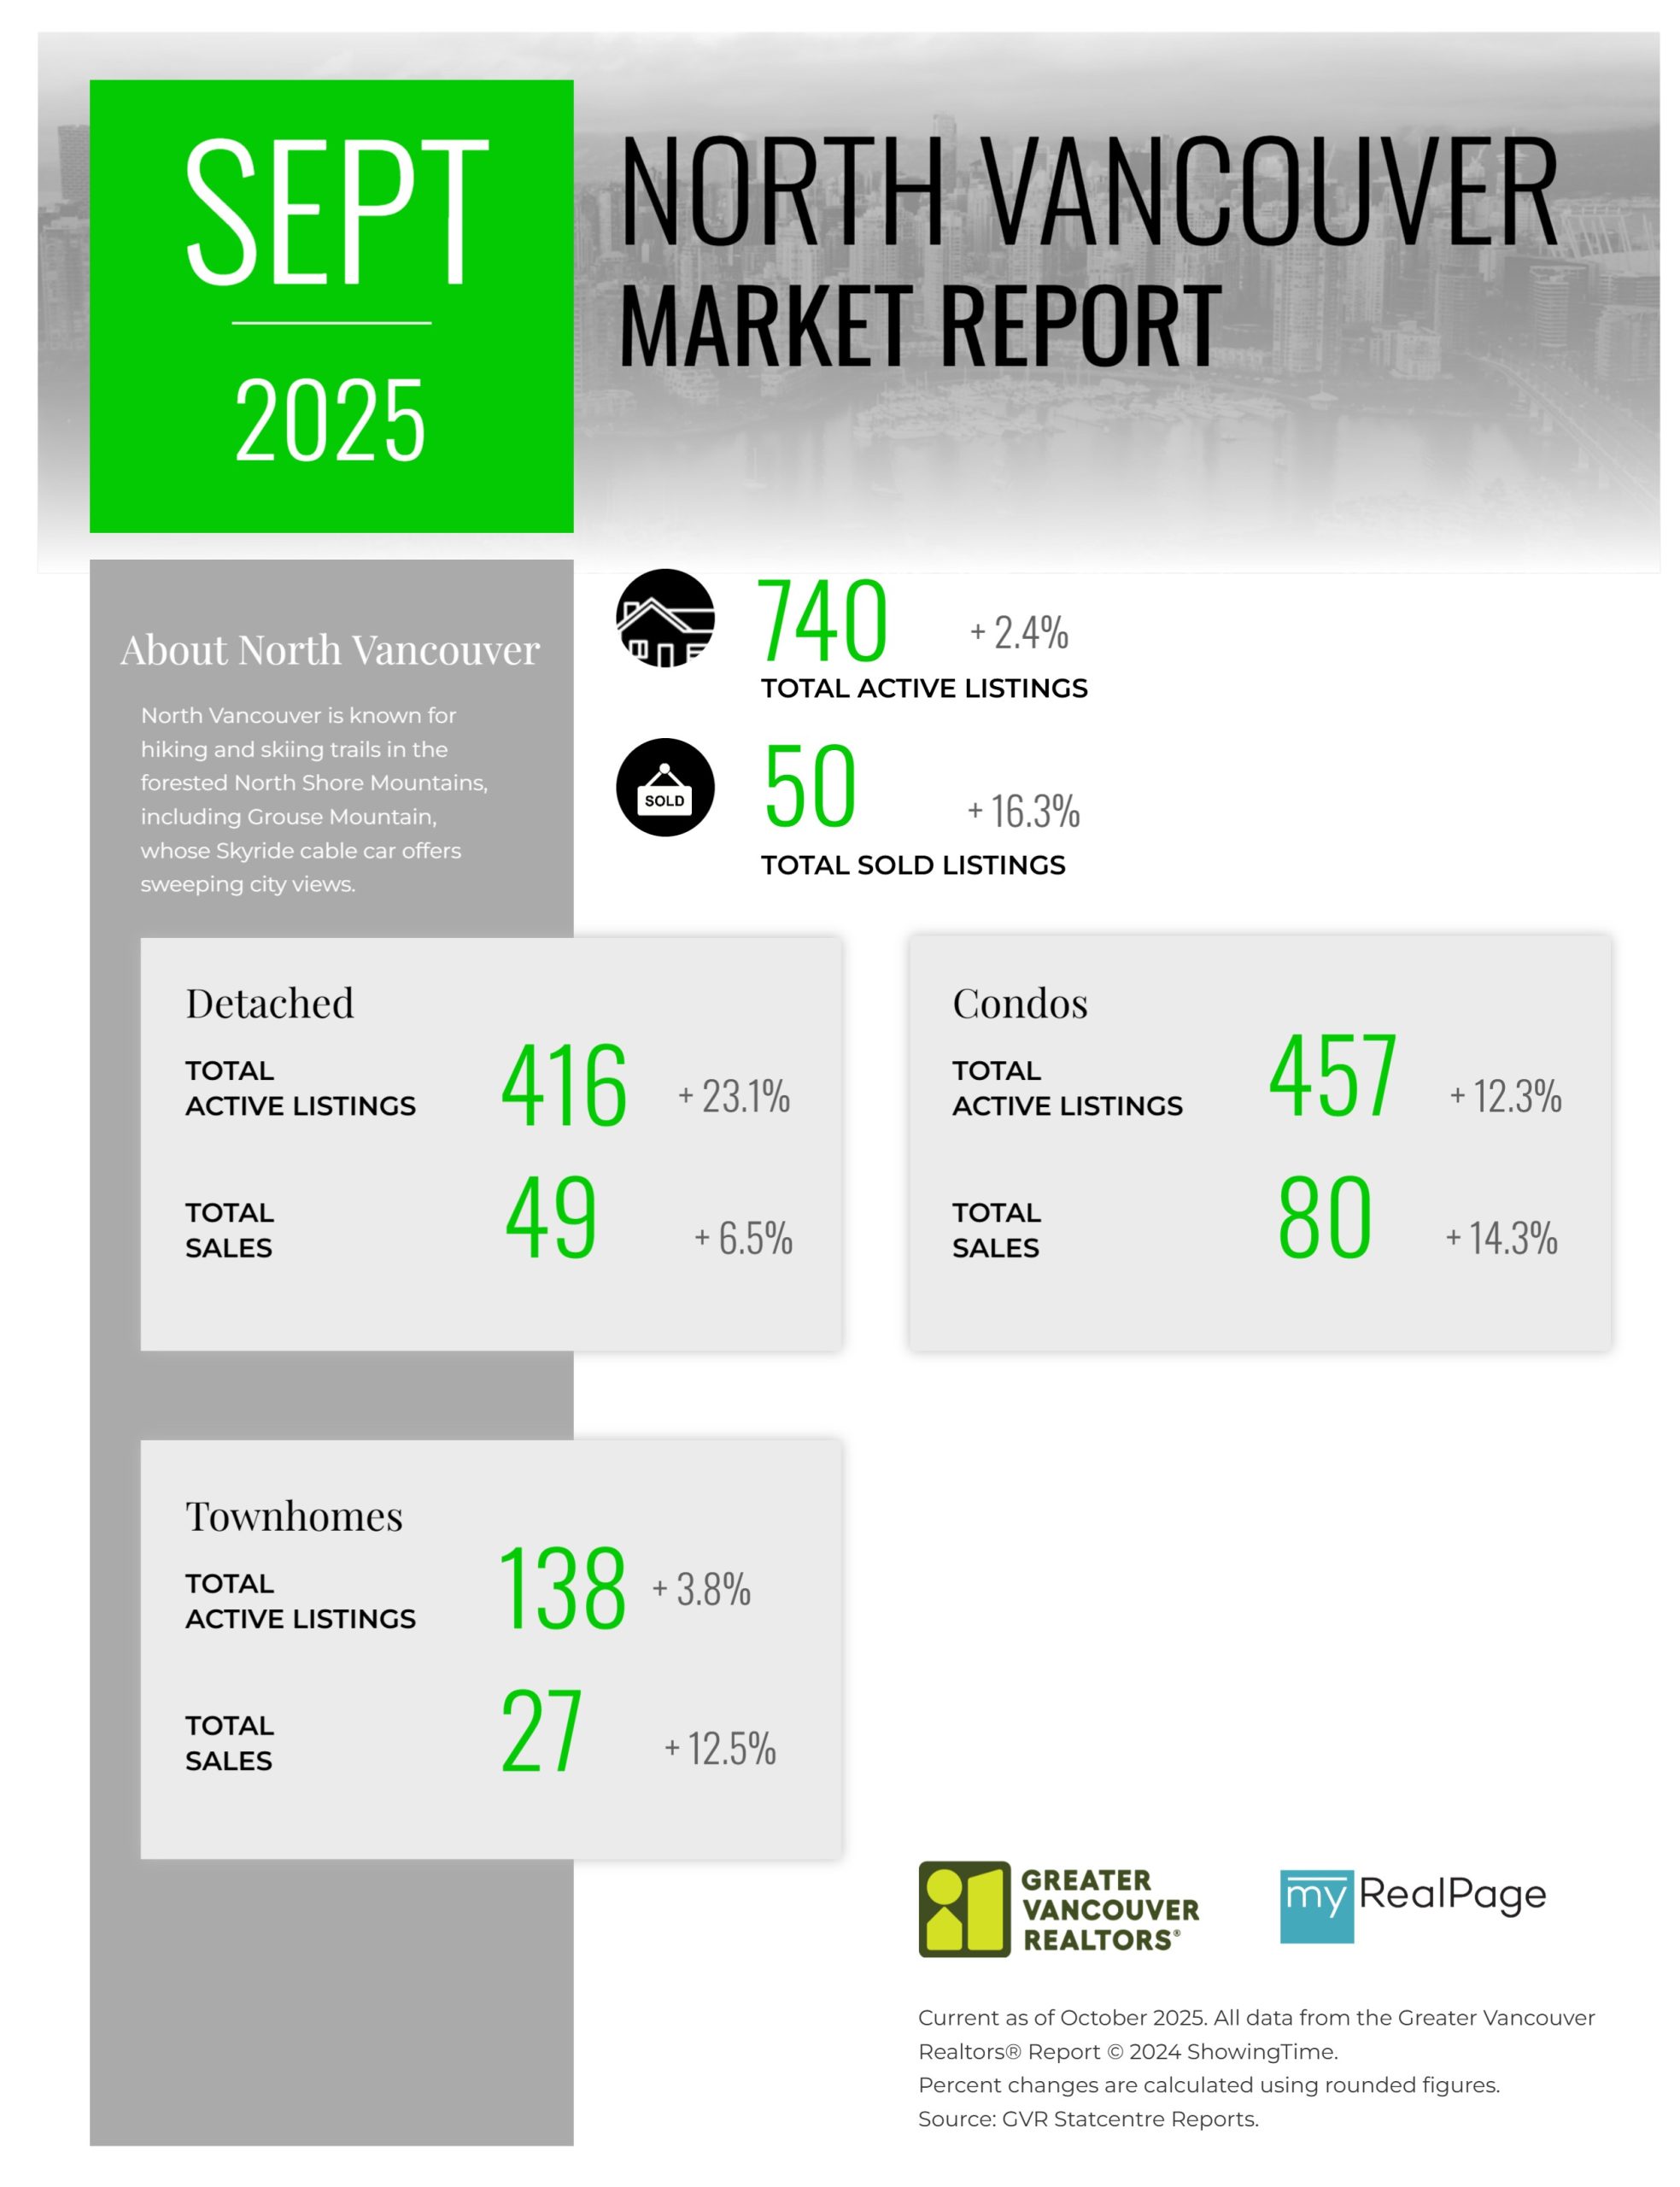
Printable Version – GVR September 2025 Data Infographic Report North Vancouver
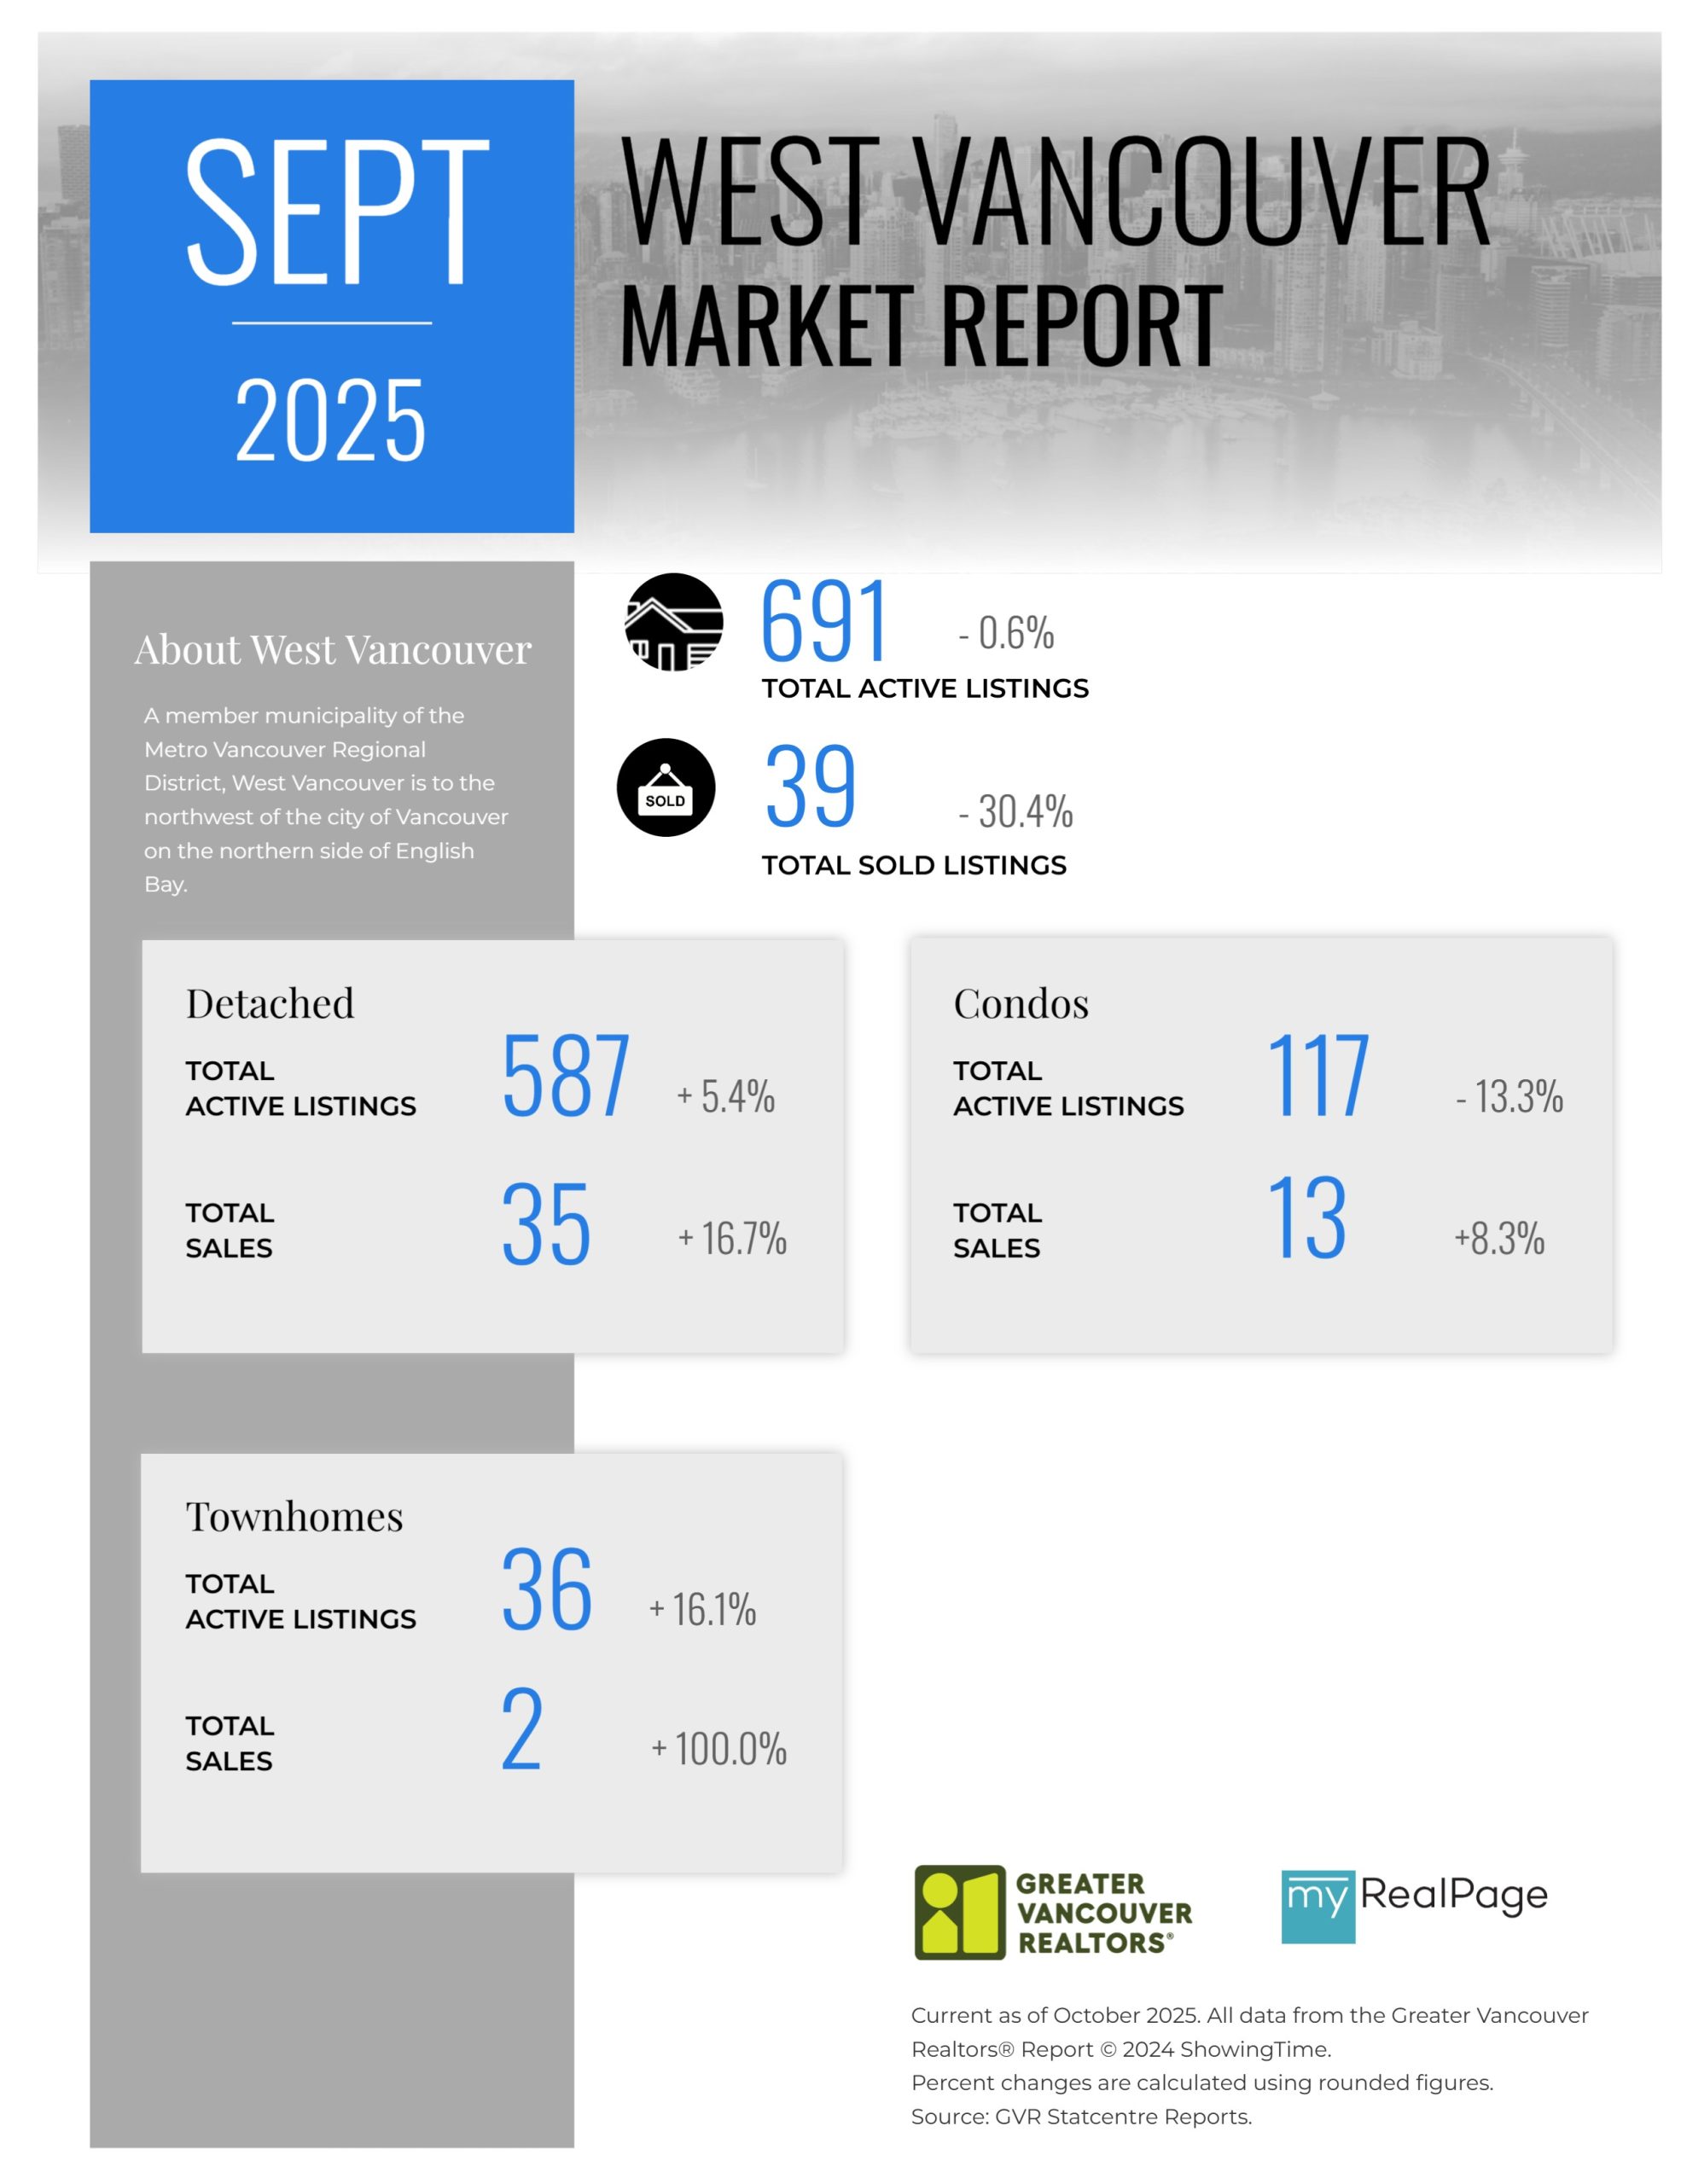
Printable Version – GVR September 2025 Data Infographics Report West Vancouver
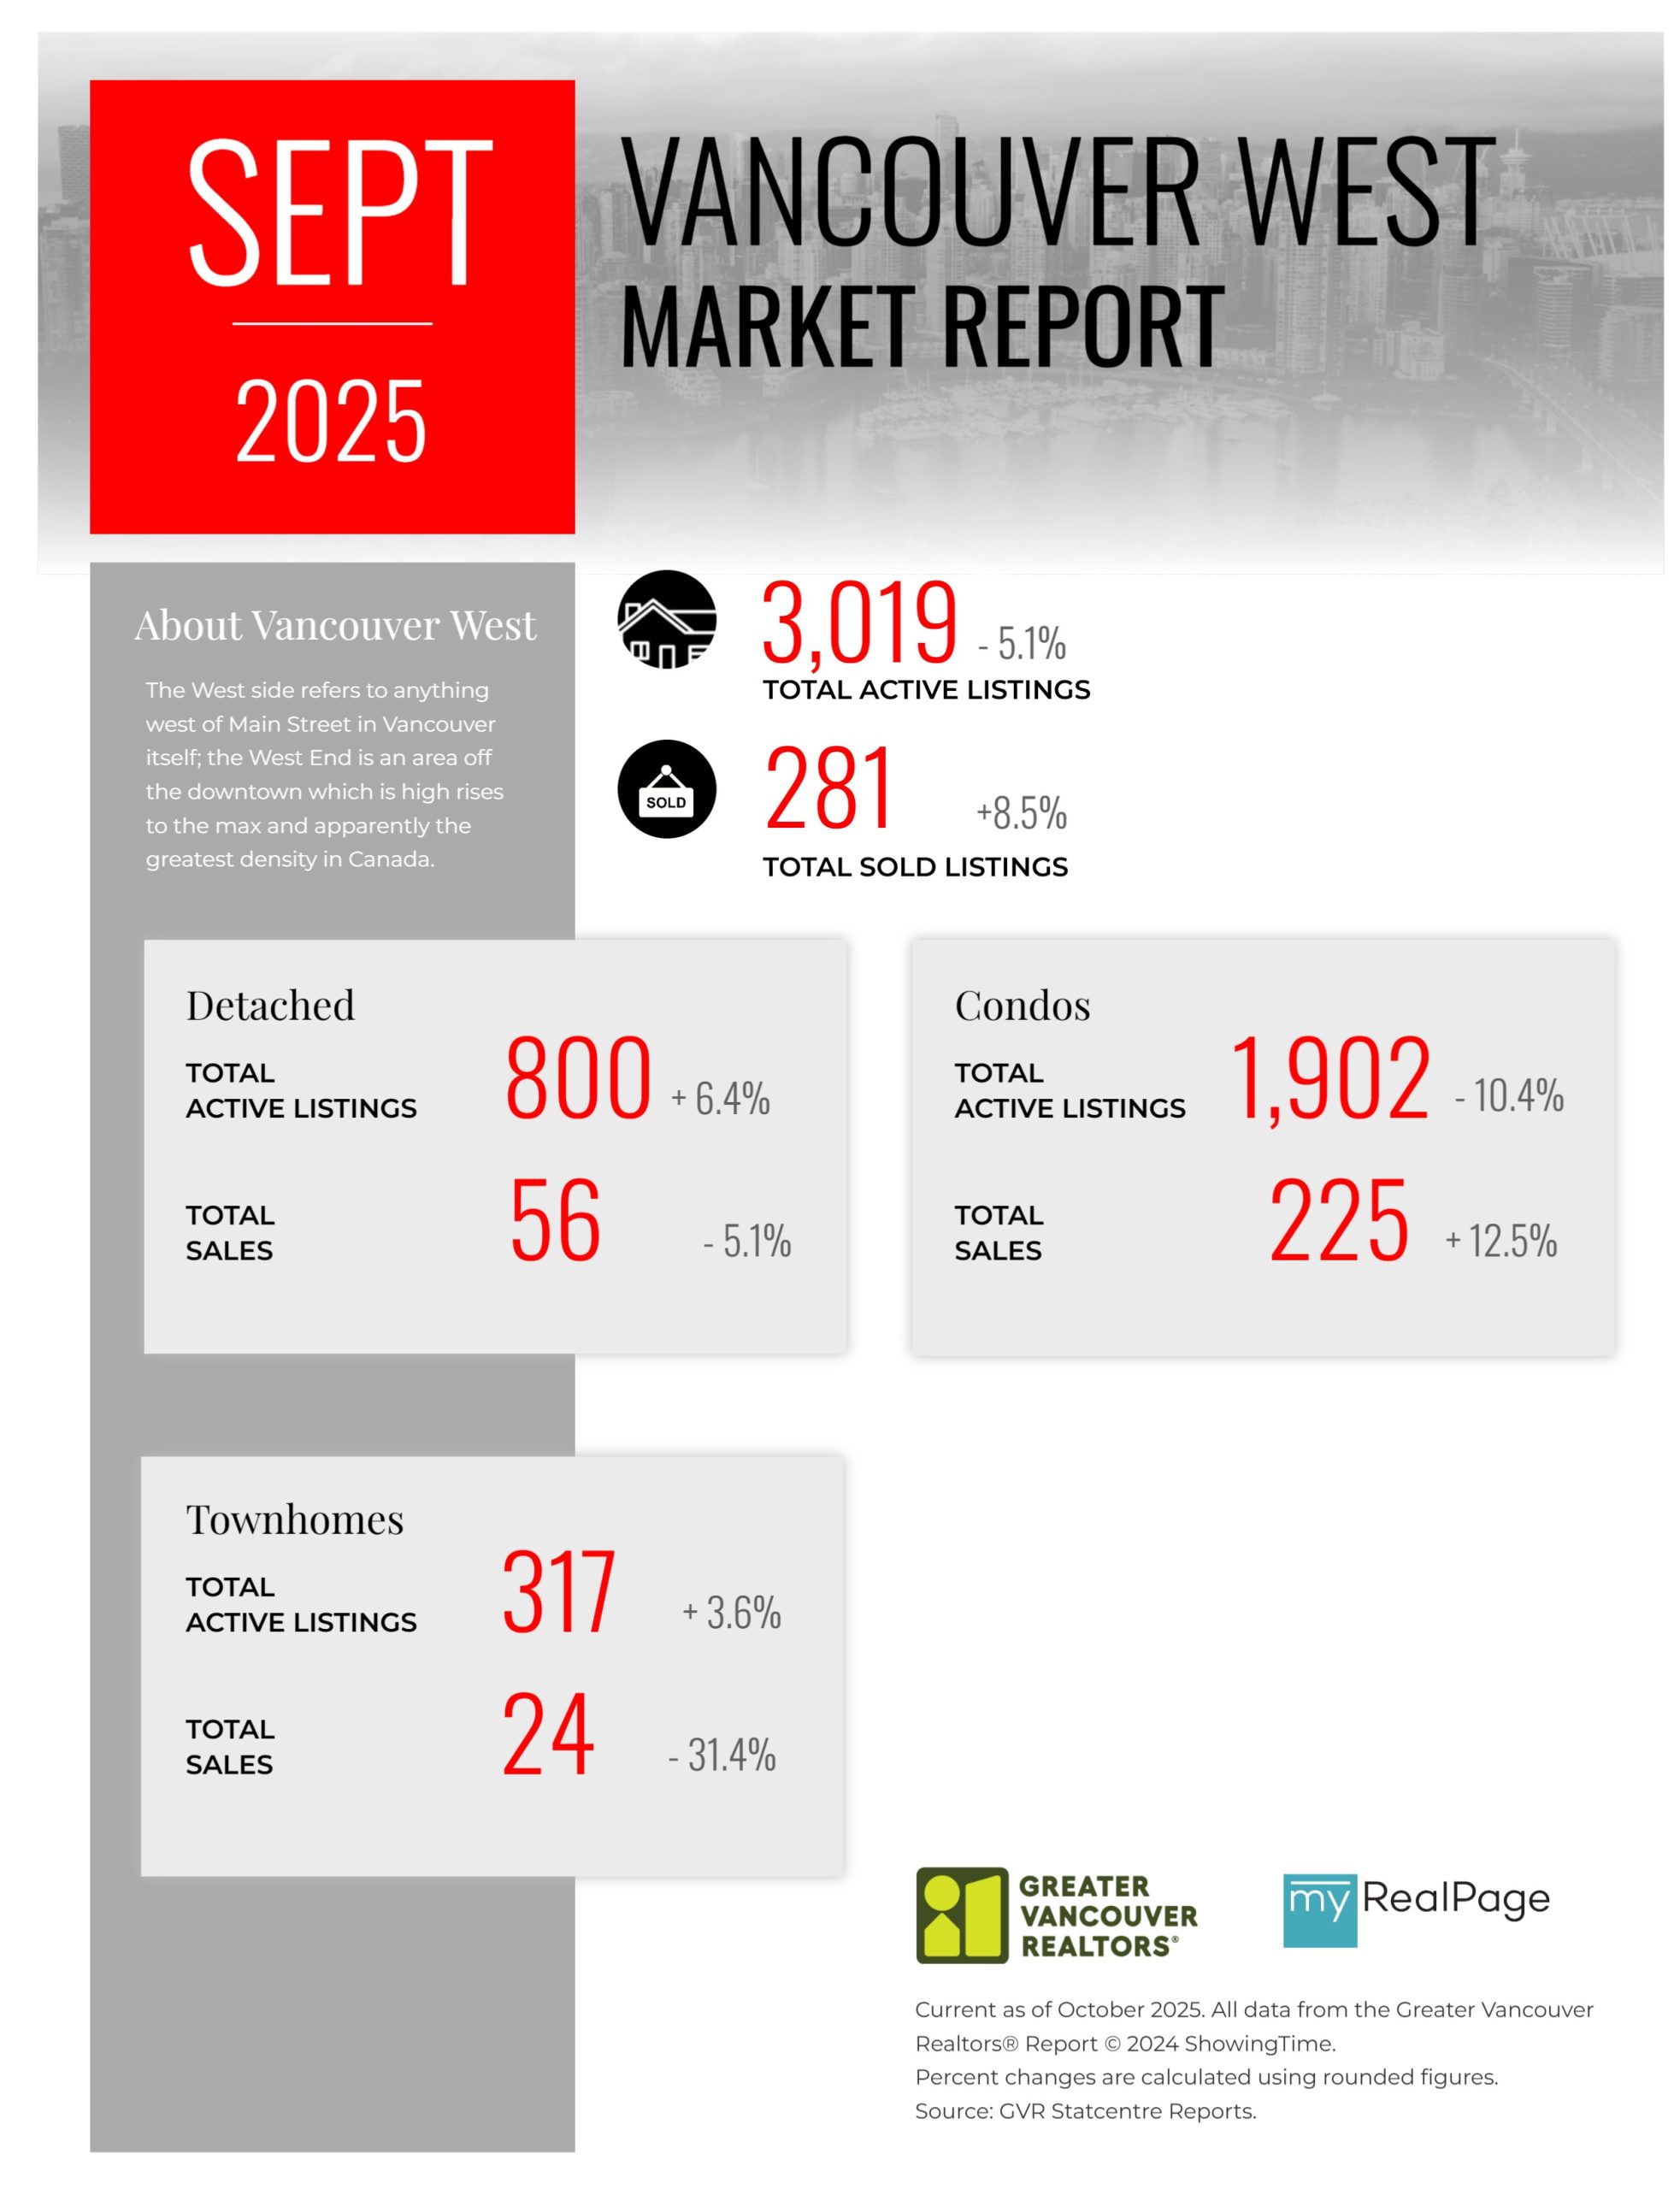
Printable Version – GVR September 2025 Data Infographics Report Vancouver West
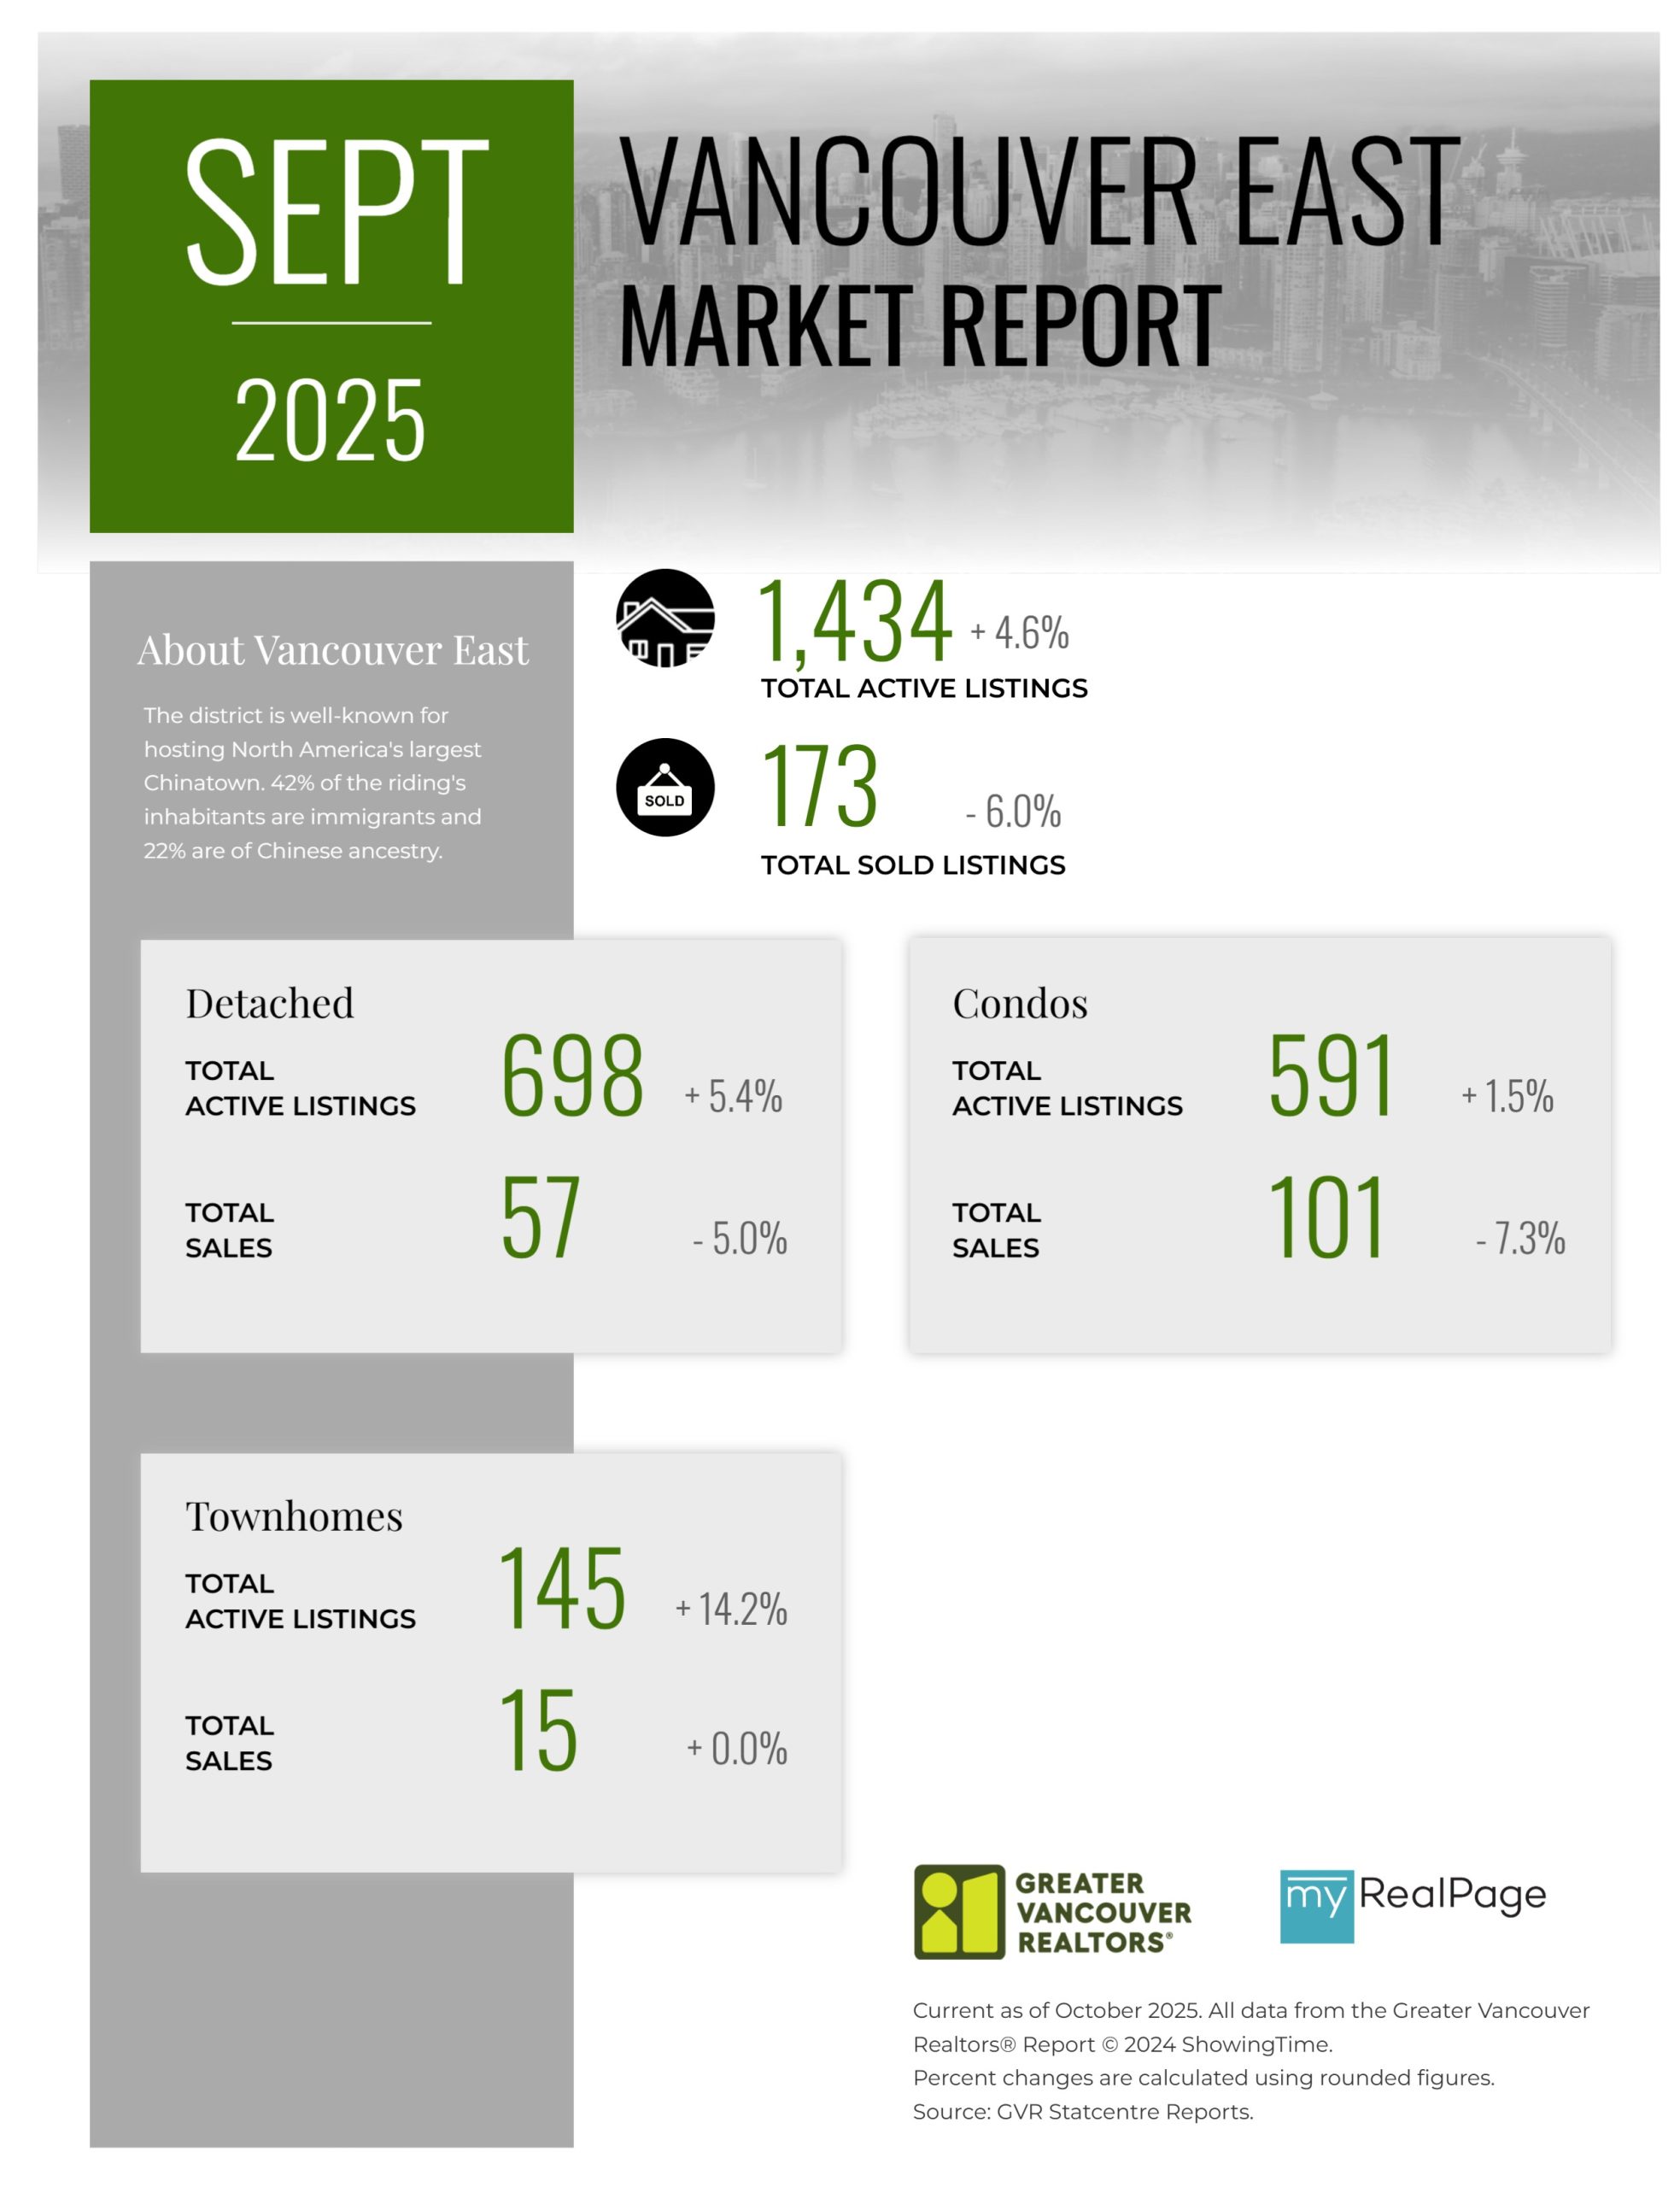
Printable Version – GVR September 2025 Data Infographics Report Vancouver East
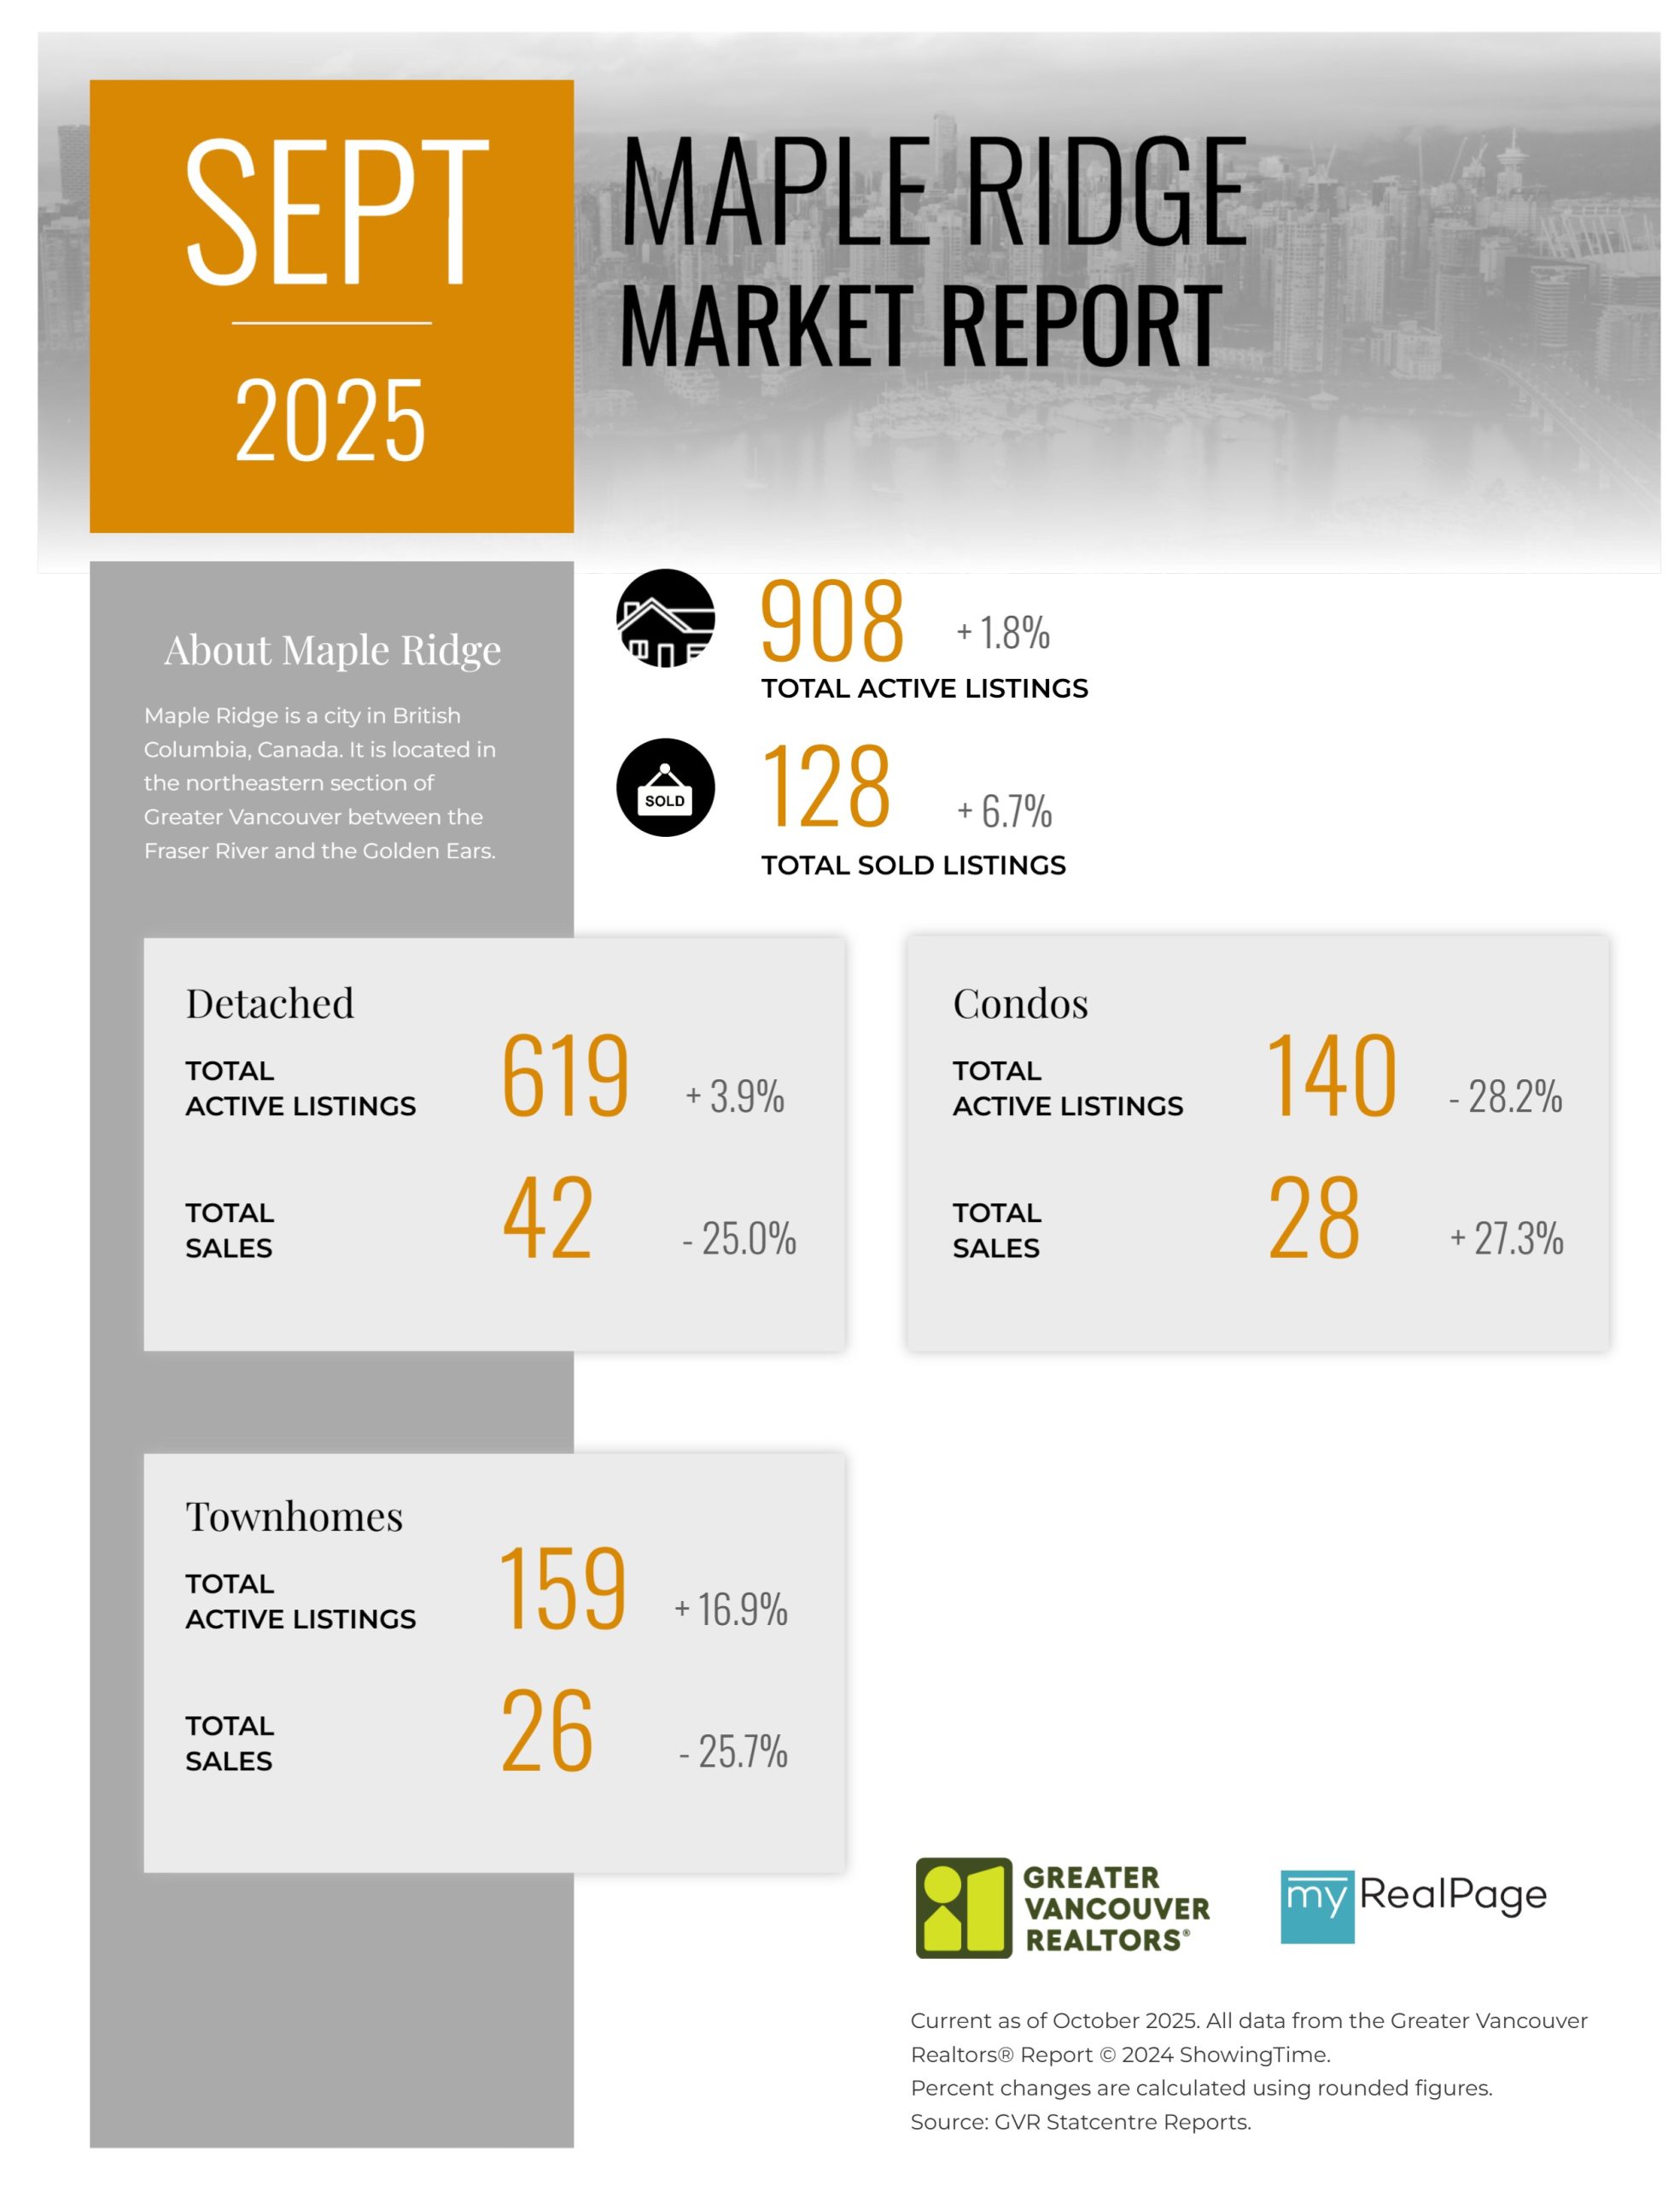
Printable Version – GVR September 2025 Data Infographic Report Maple Ridge
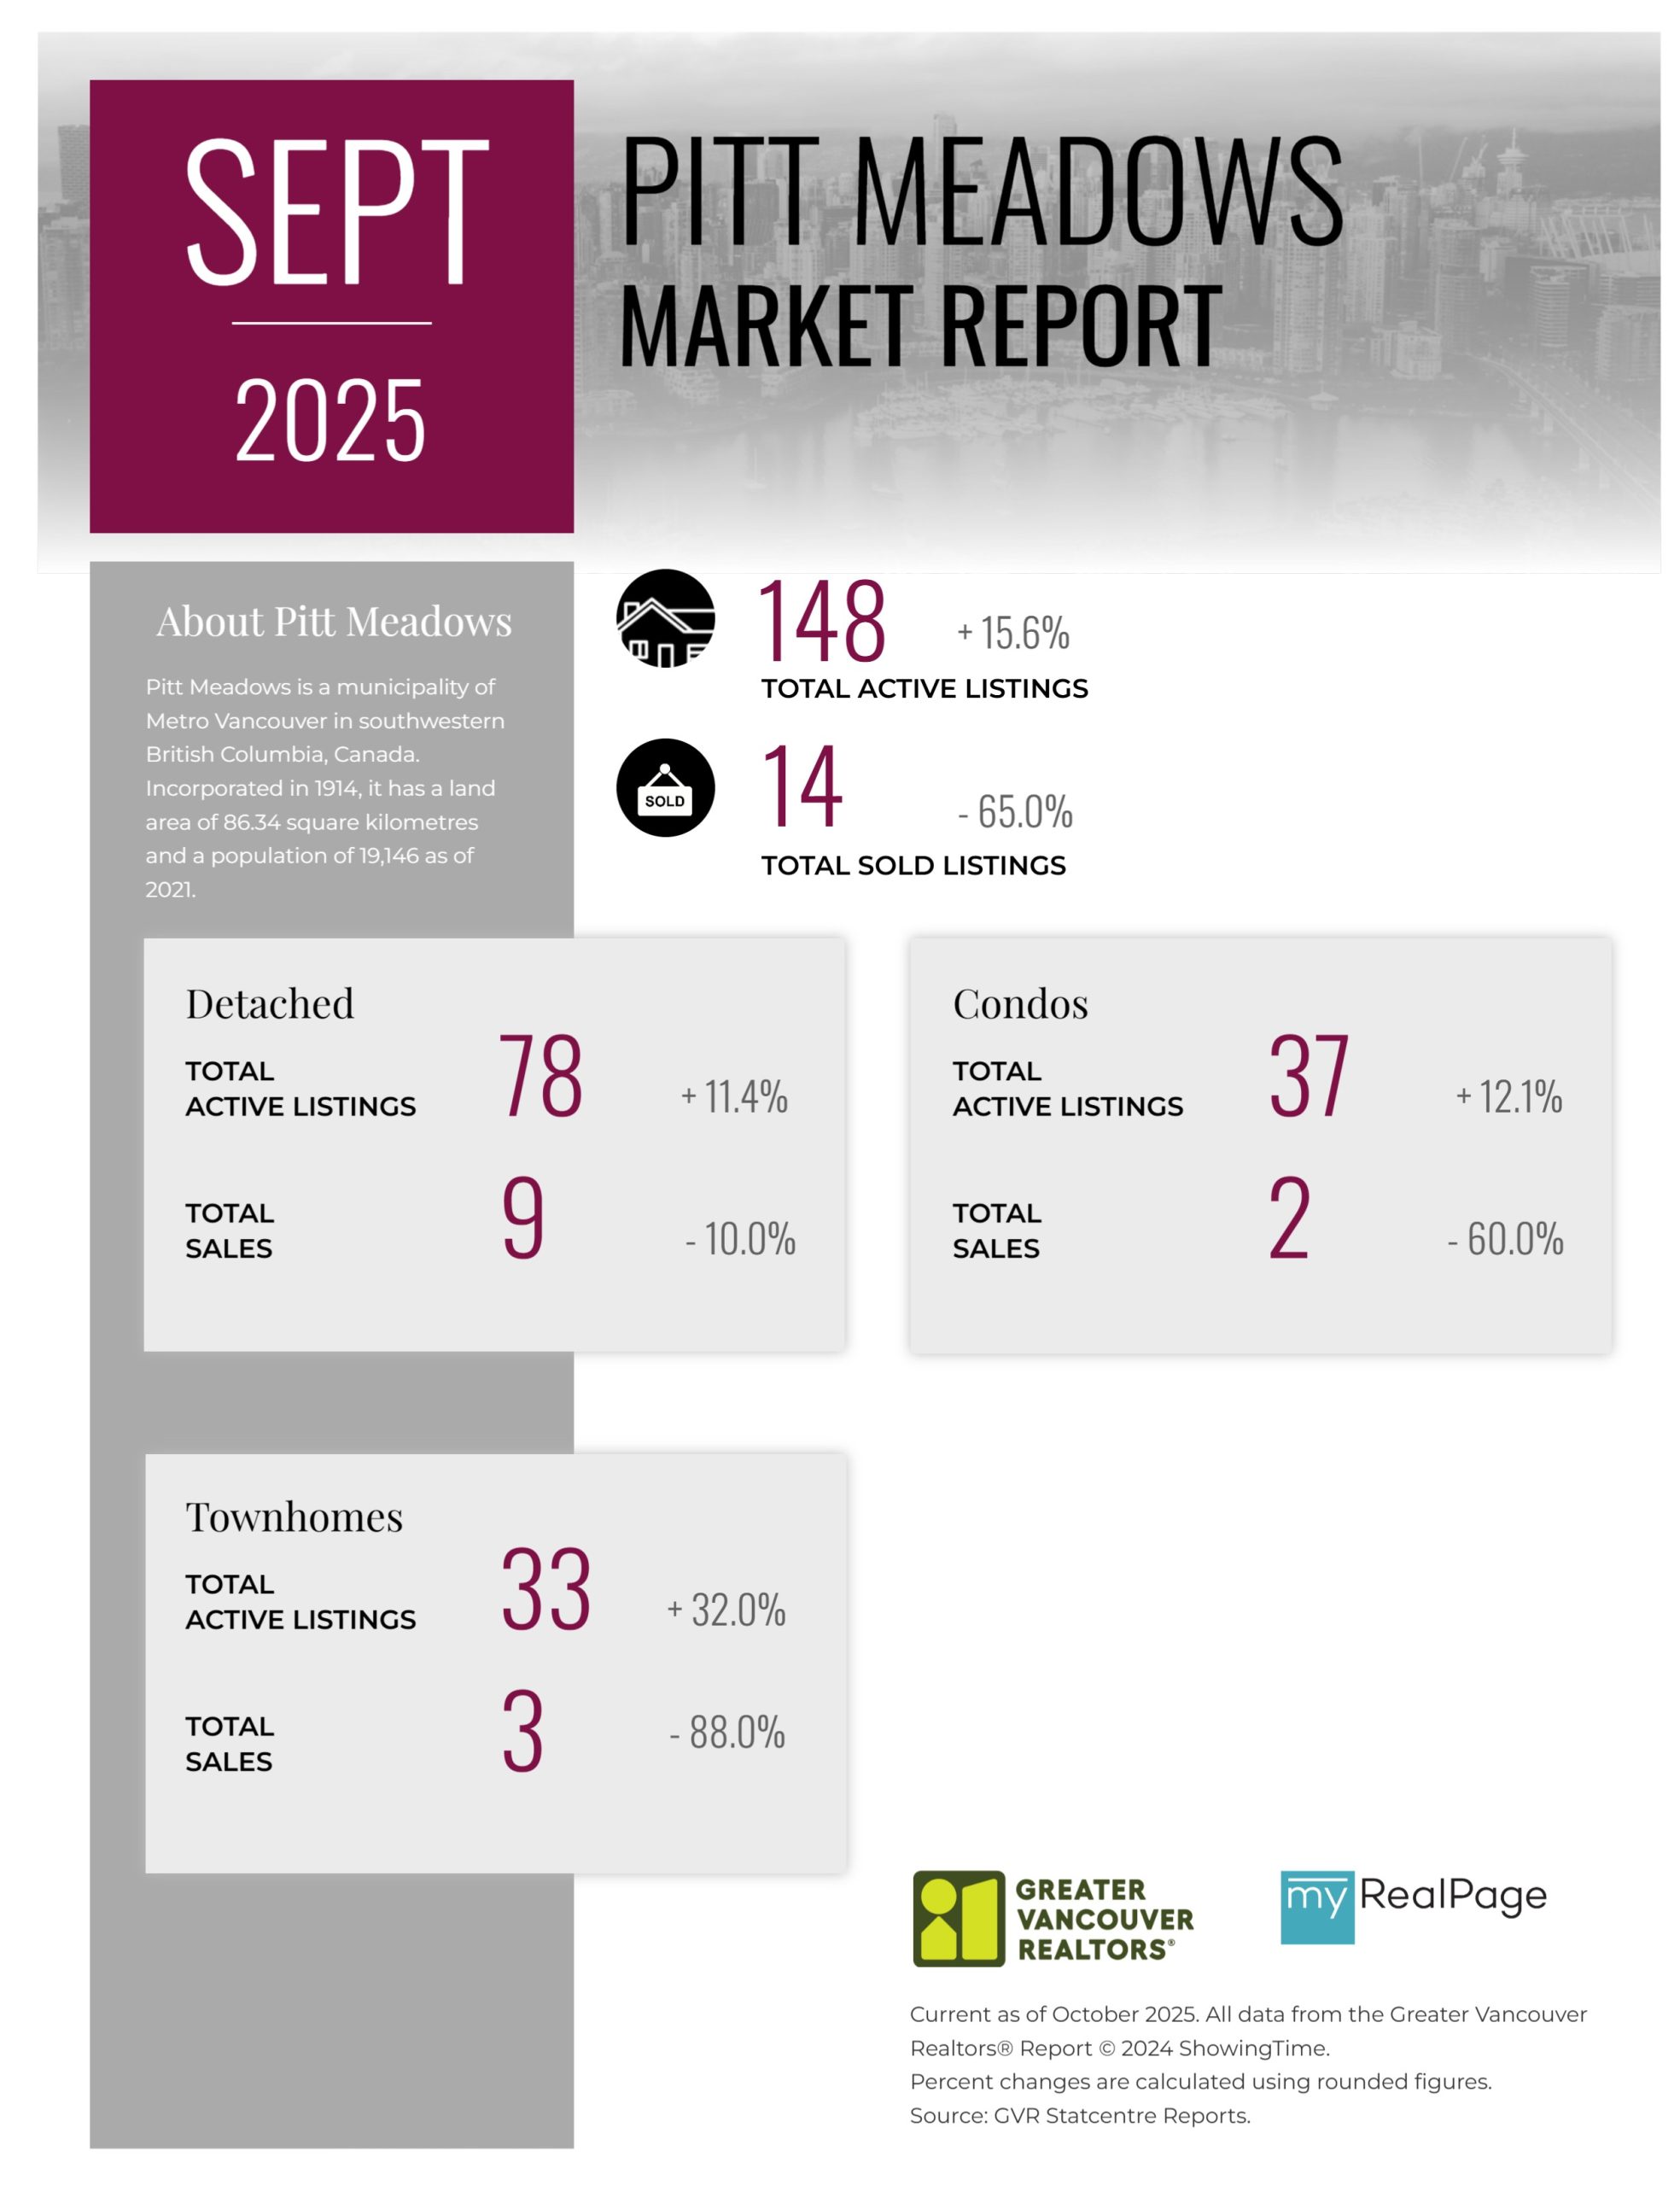
Printable Version – GVR September 2025 Data Infographics Report Pitt Meadows
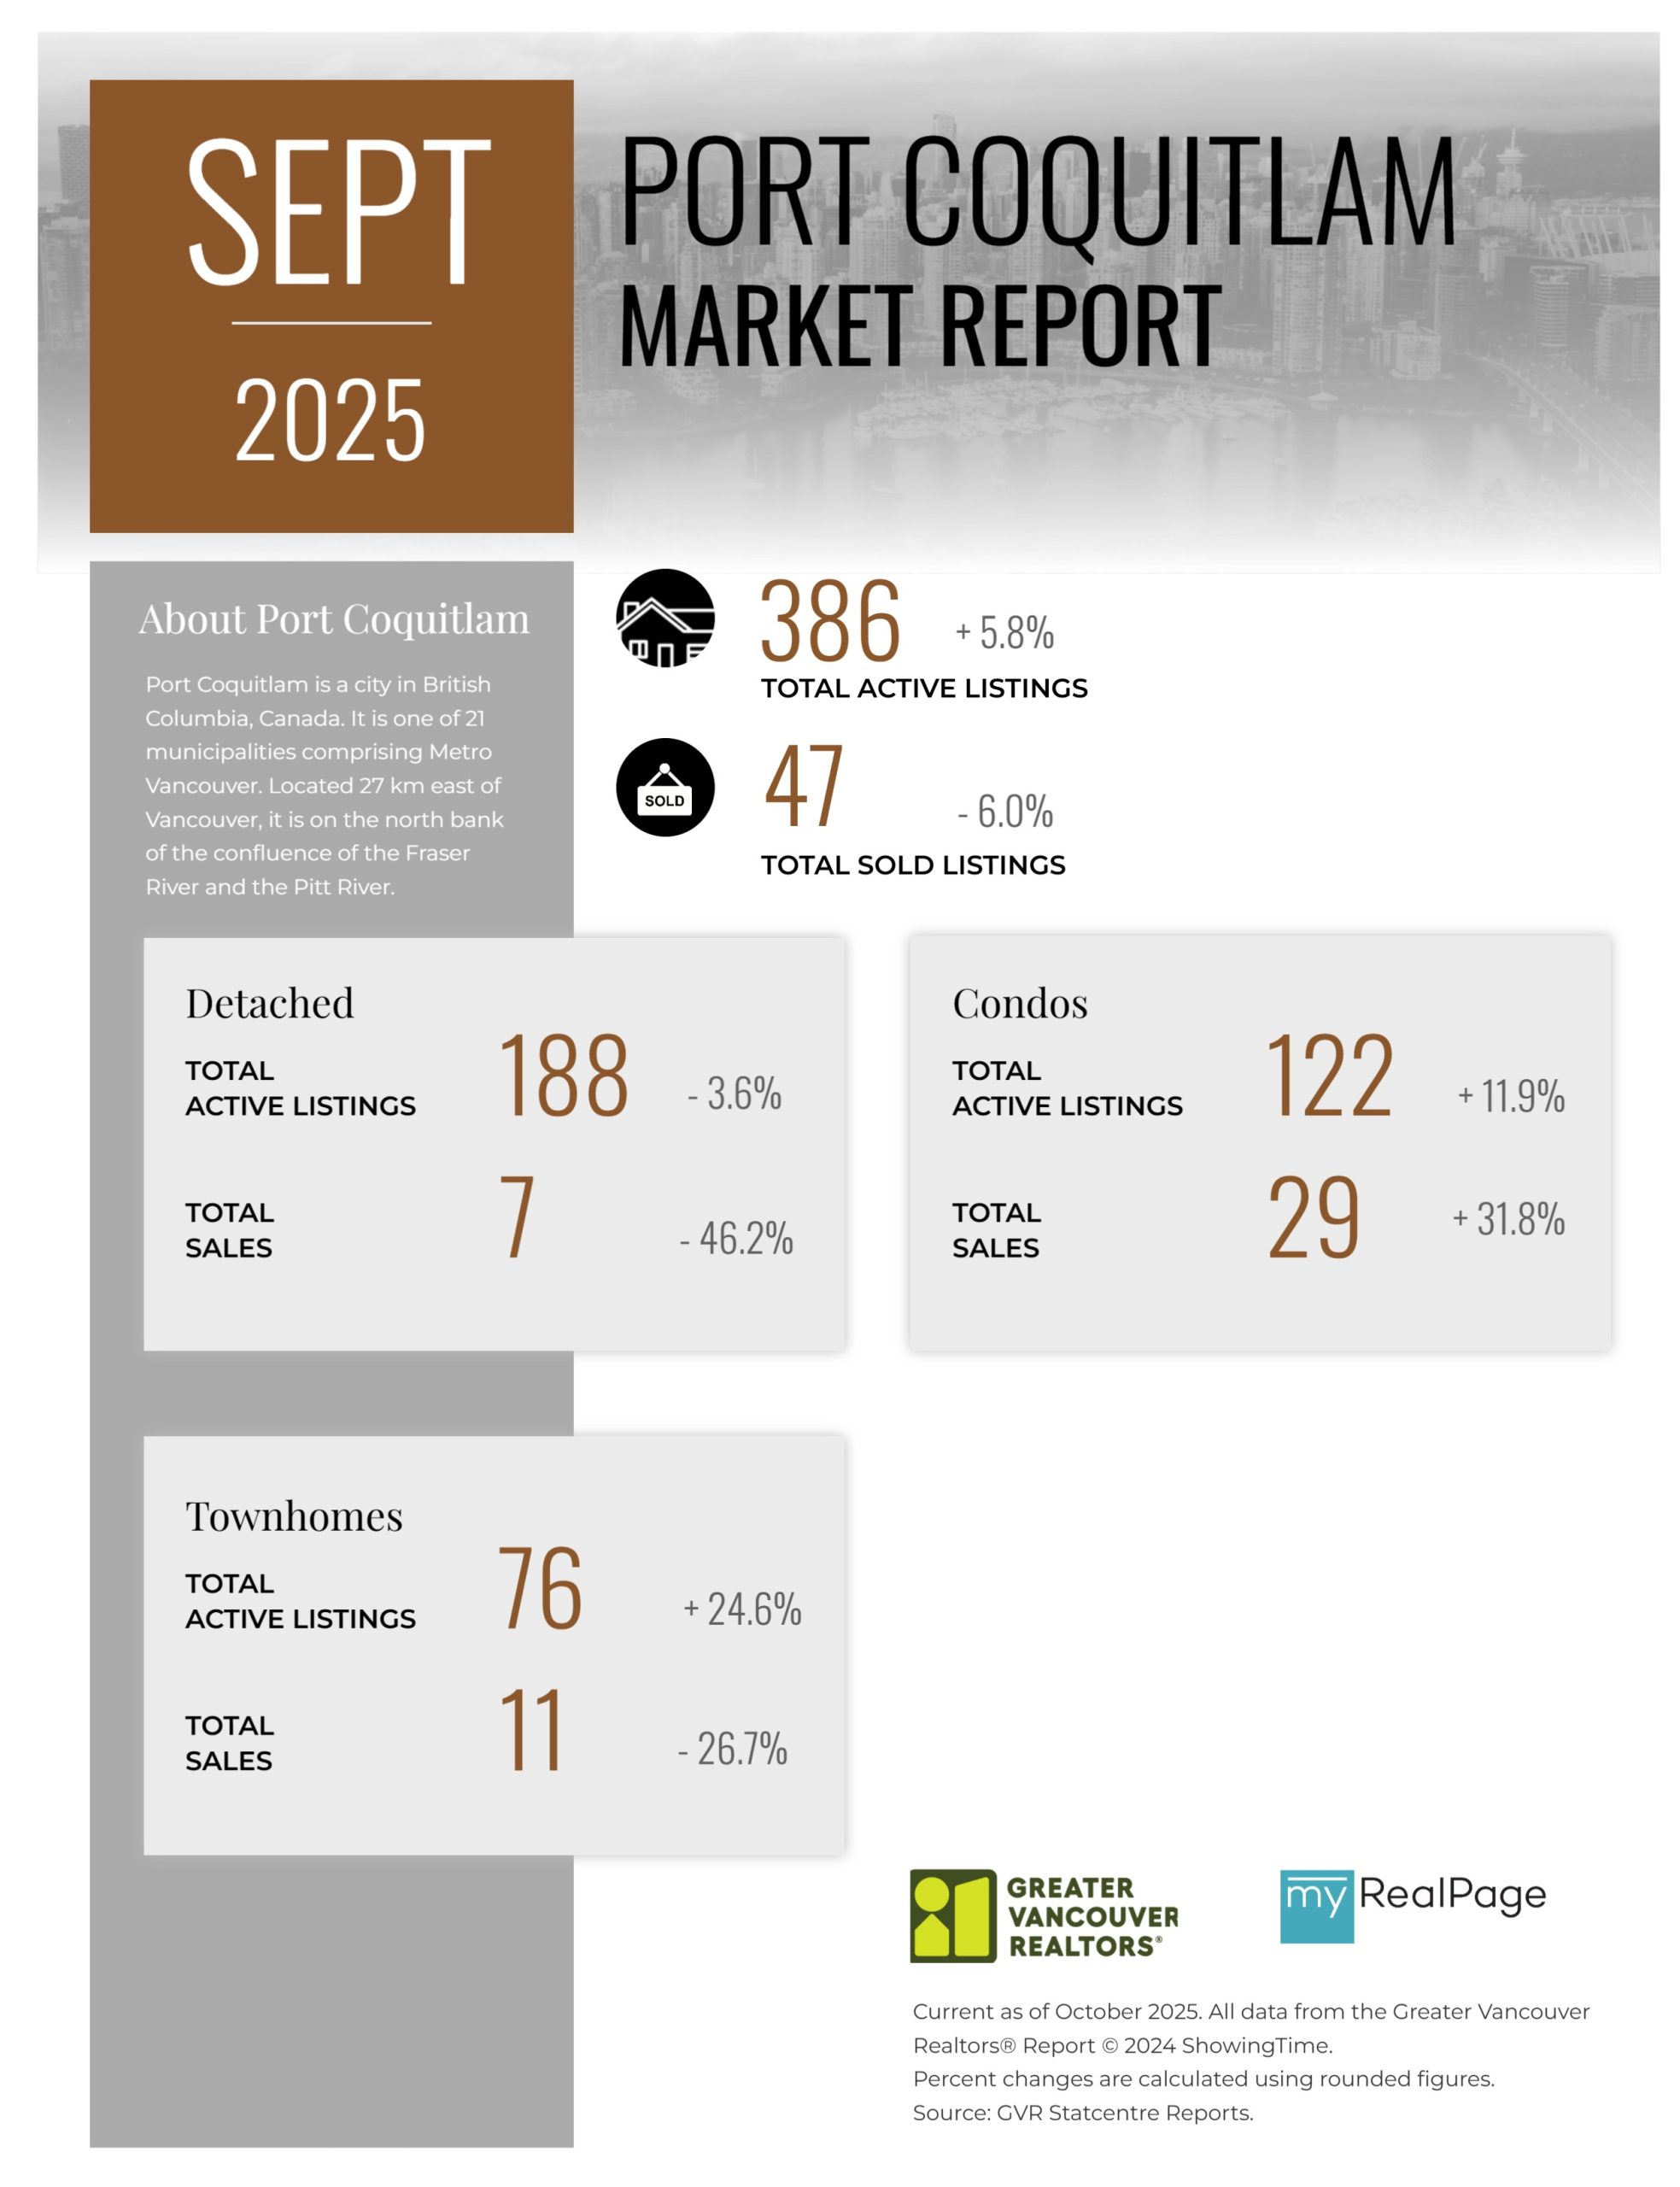
Printable Version – GVR September 2025 Data Infographics Report Port Coquitlam
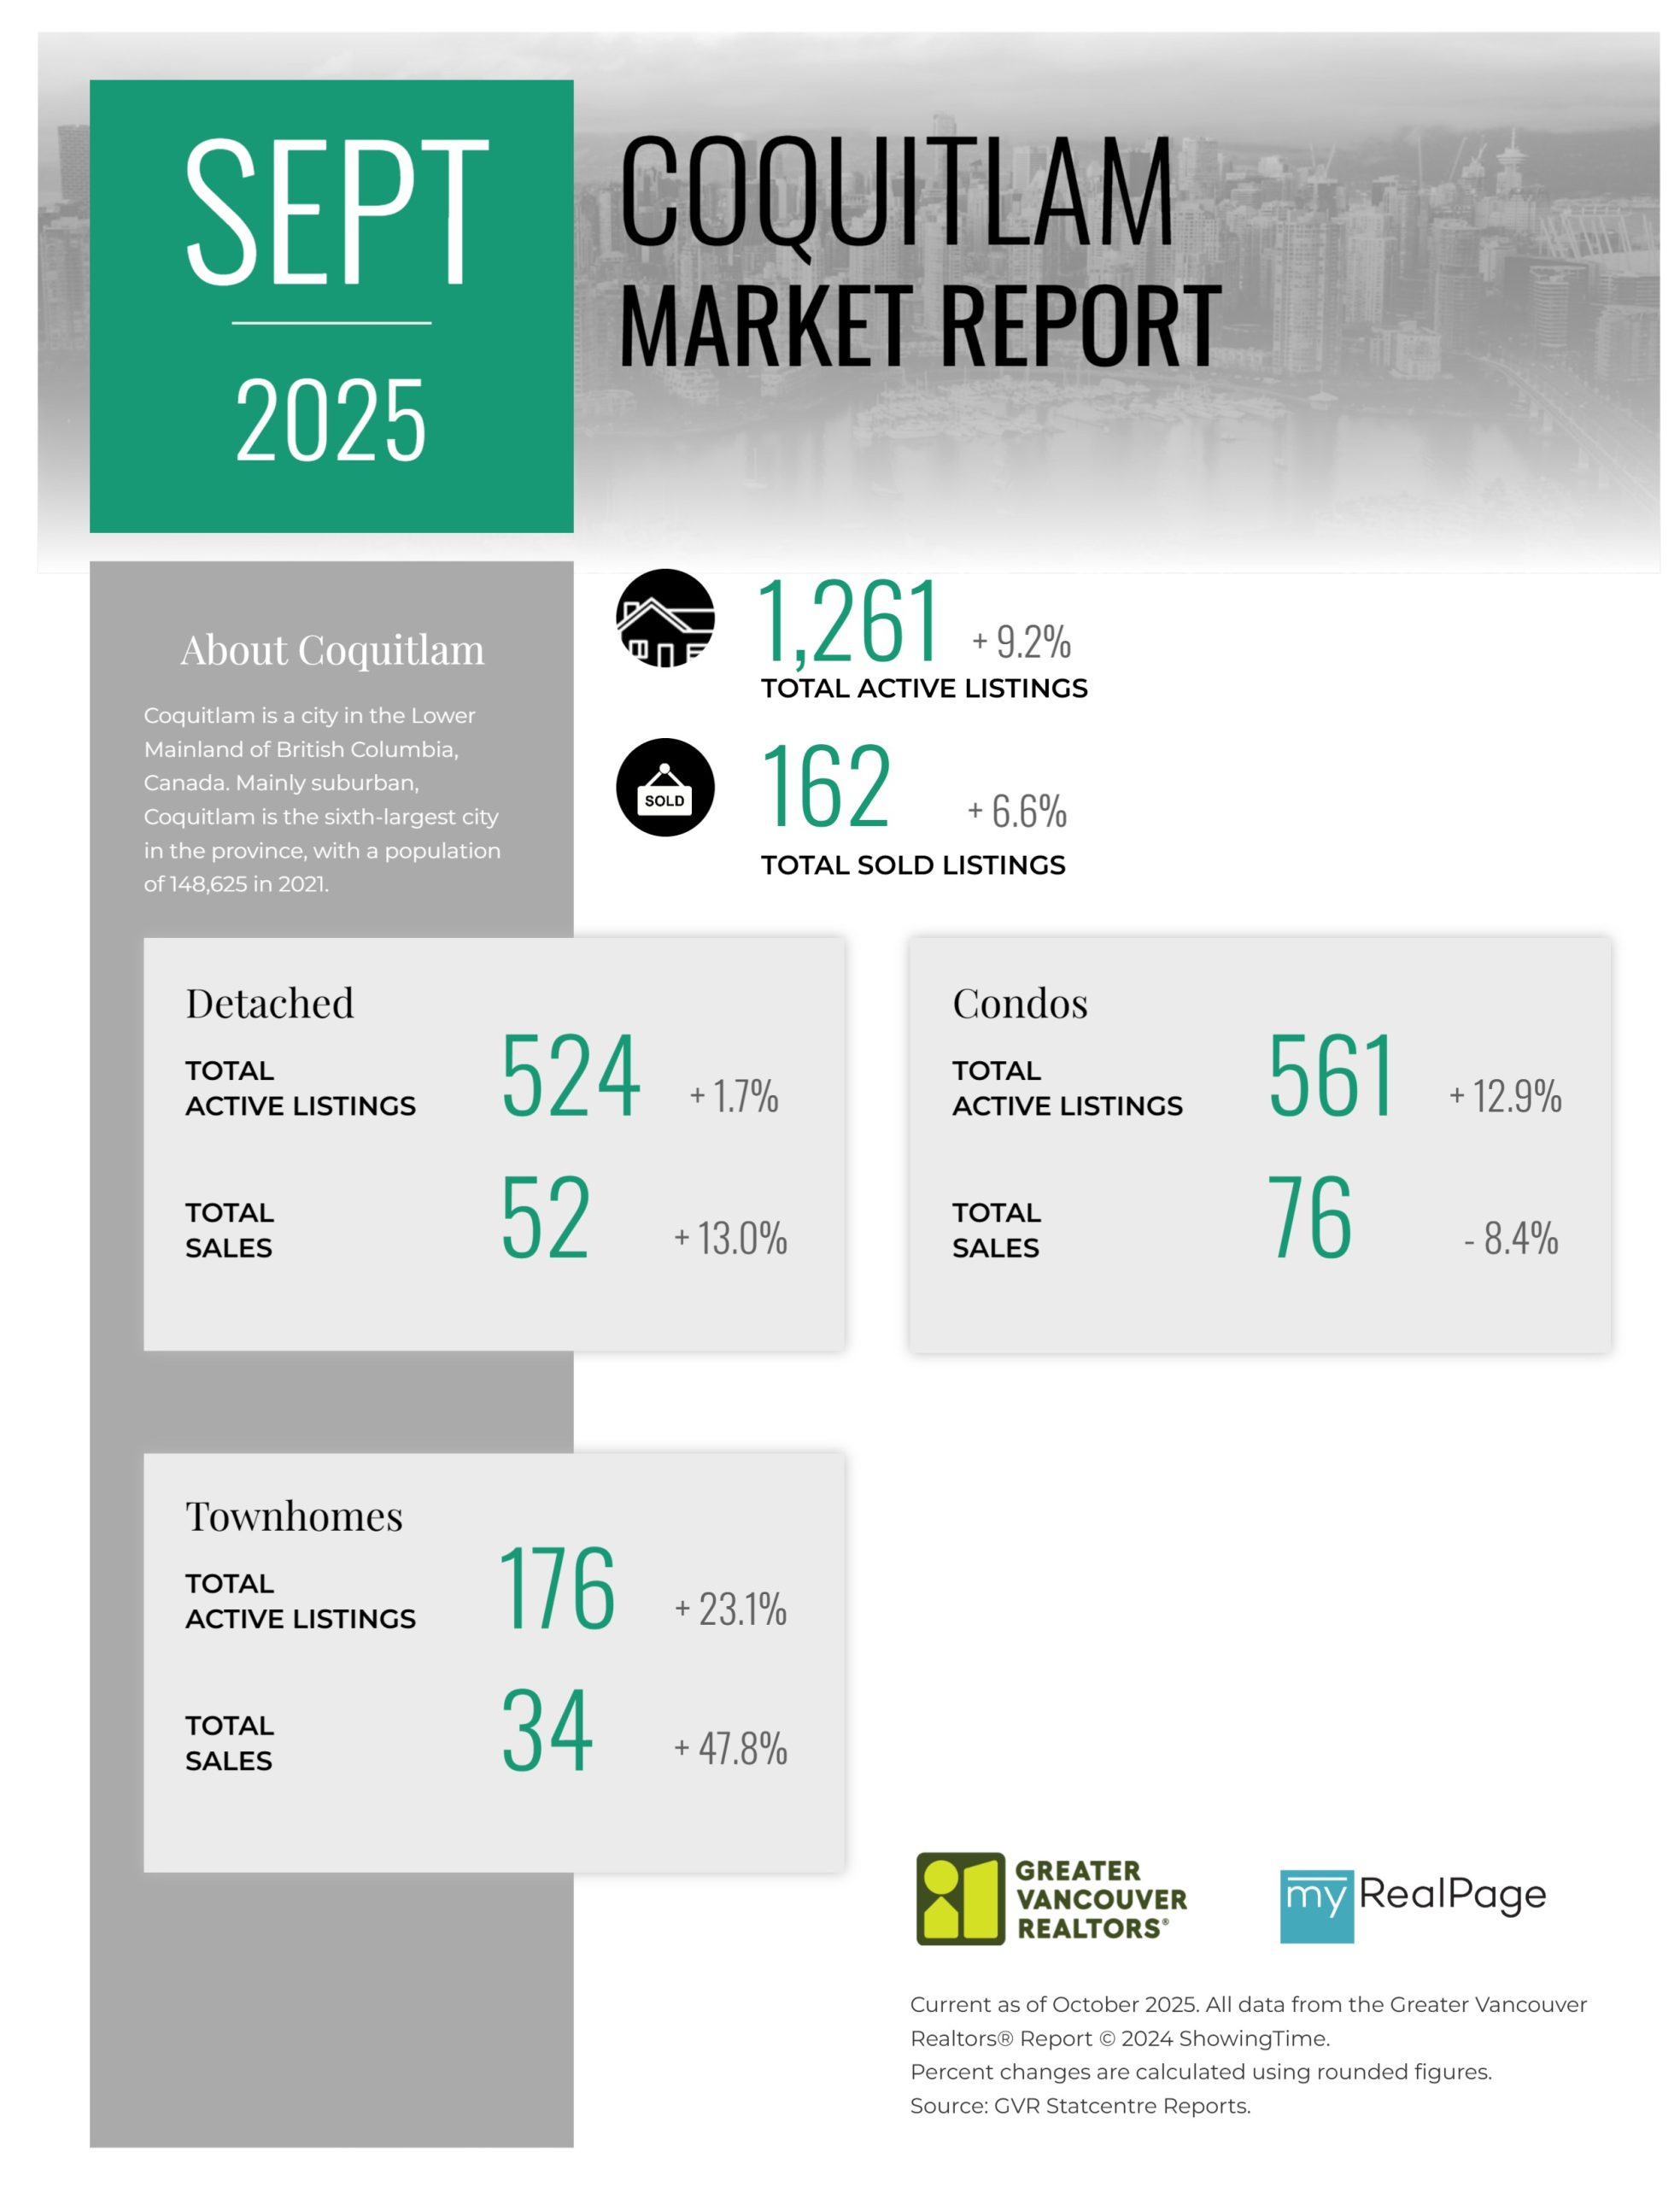
Printable Version – GVR September 2025 Data Infographics Report Coquitlam
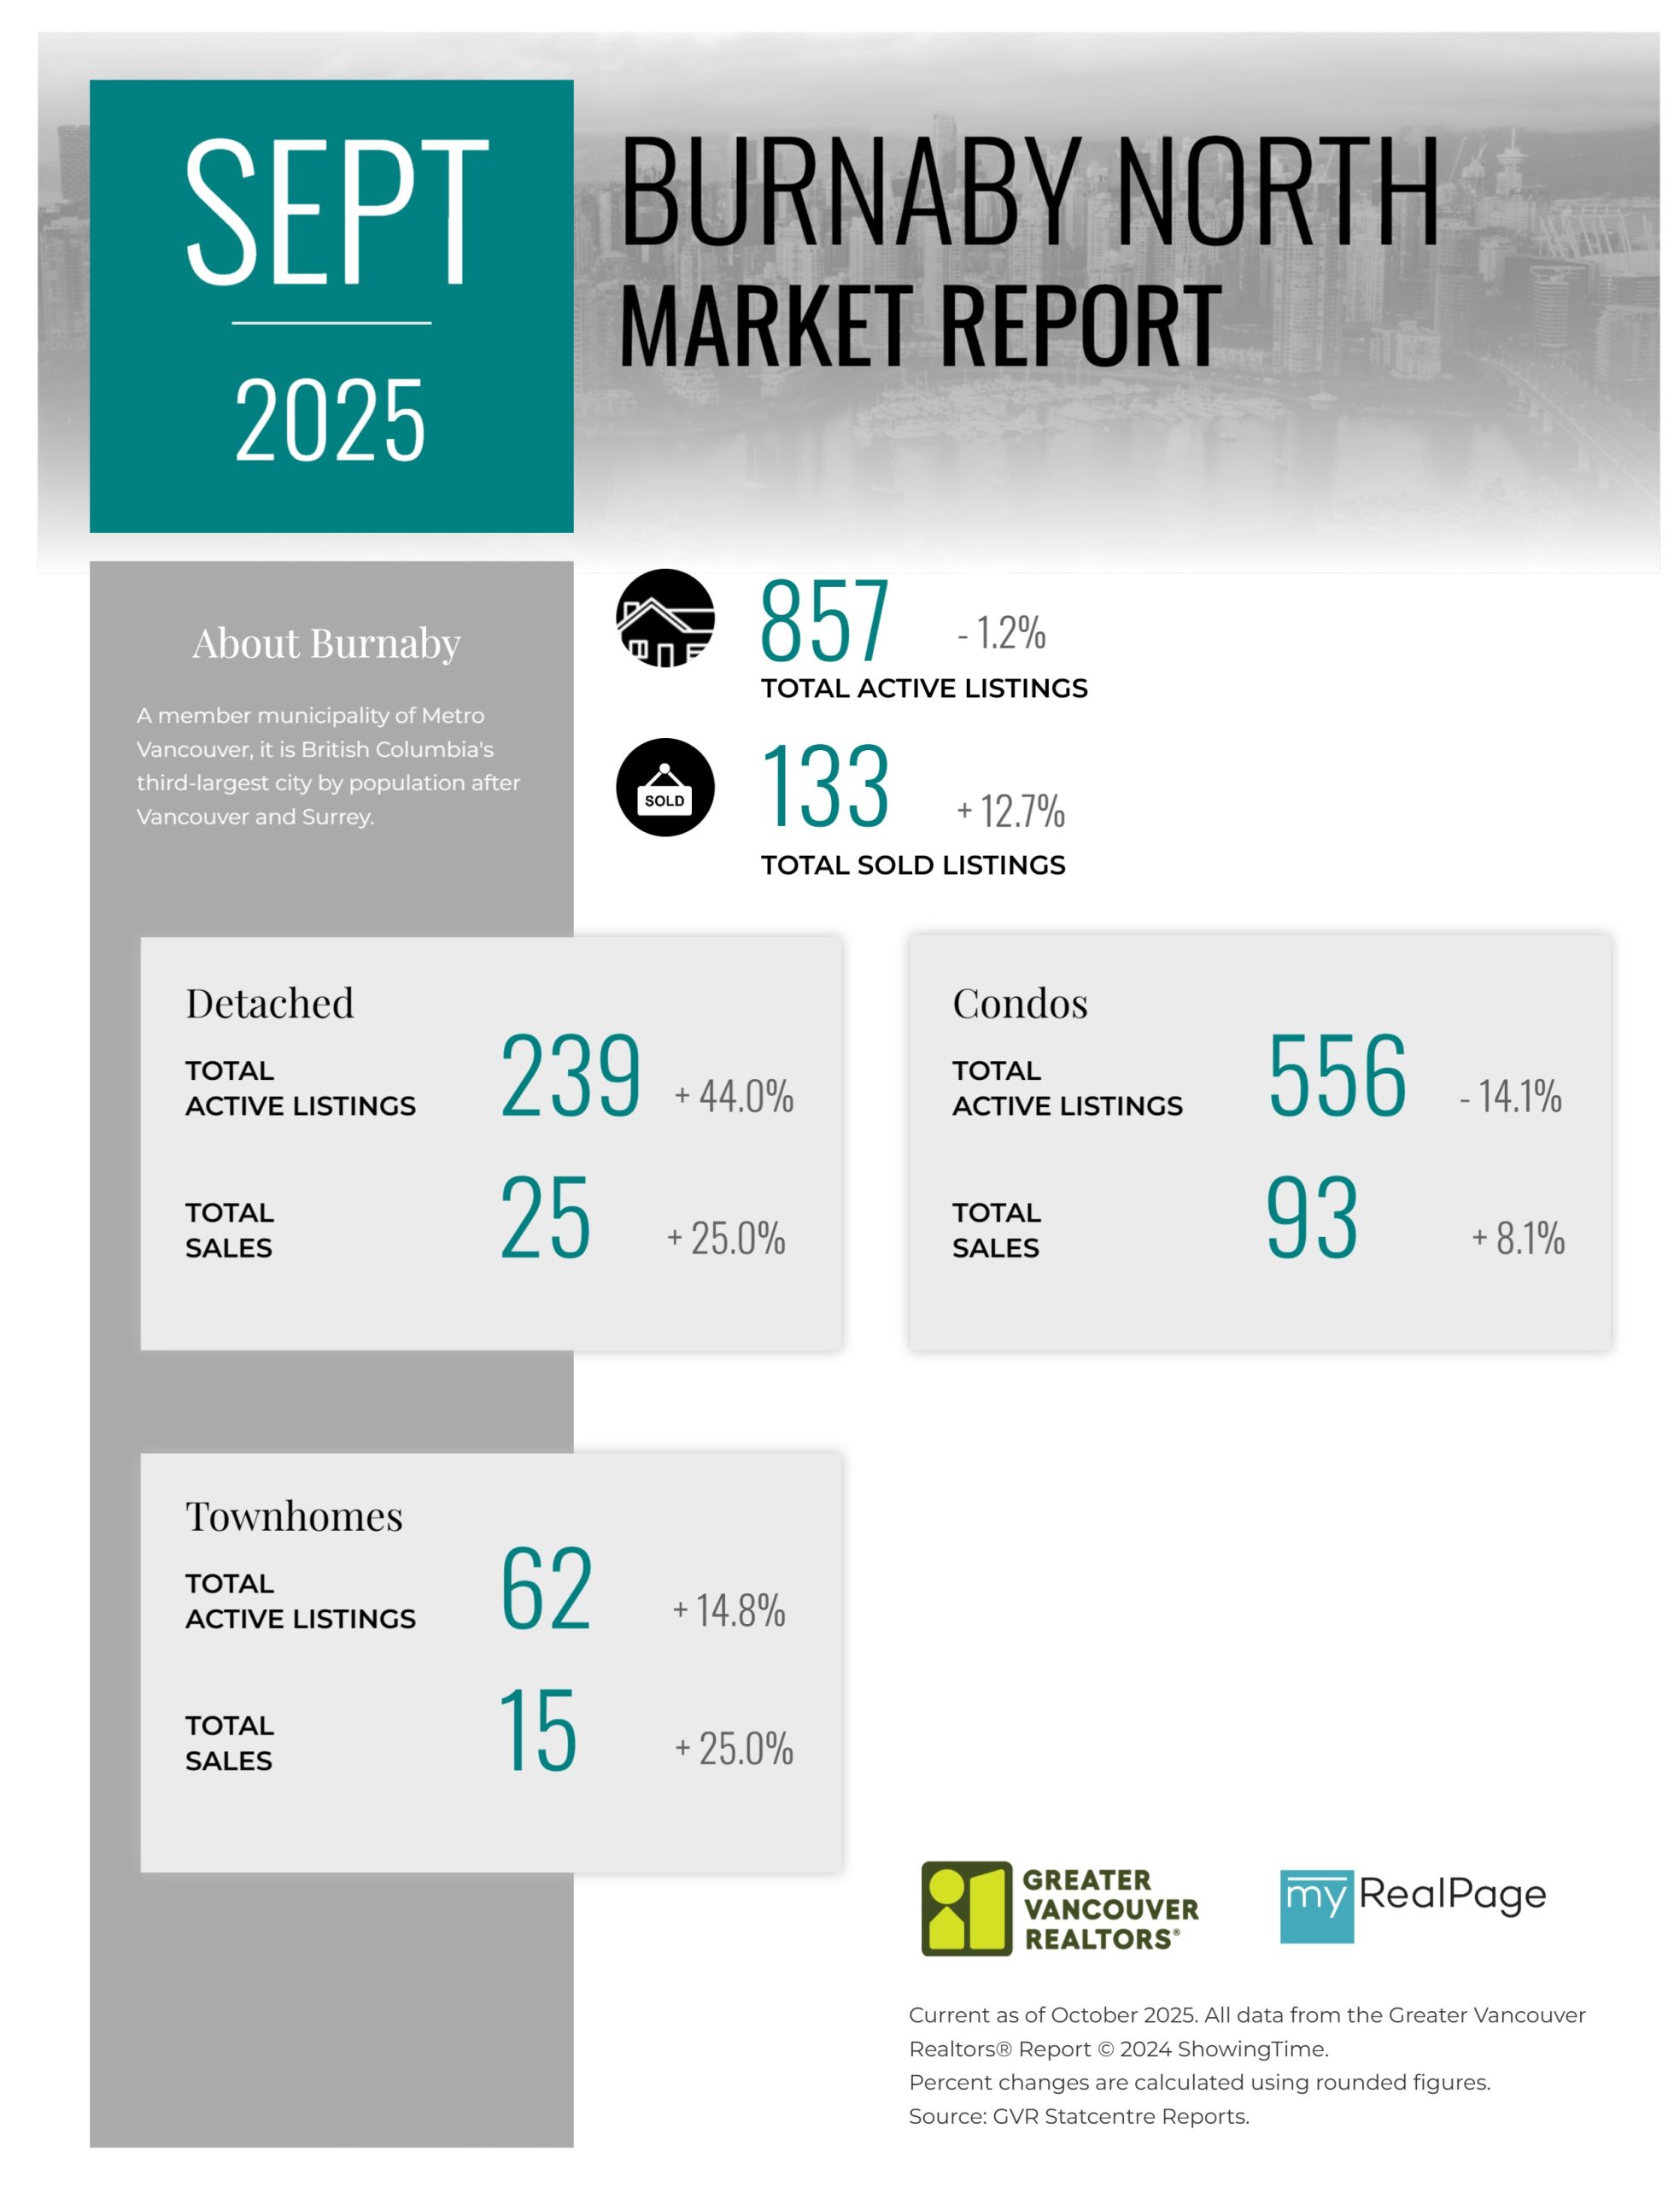
Printable Version – GVR September 2025 Data Infographic Report Burnaby North
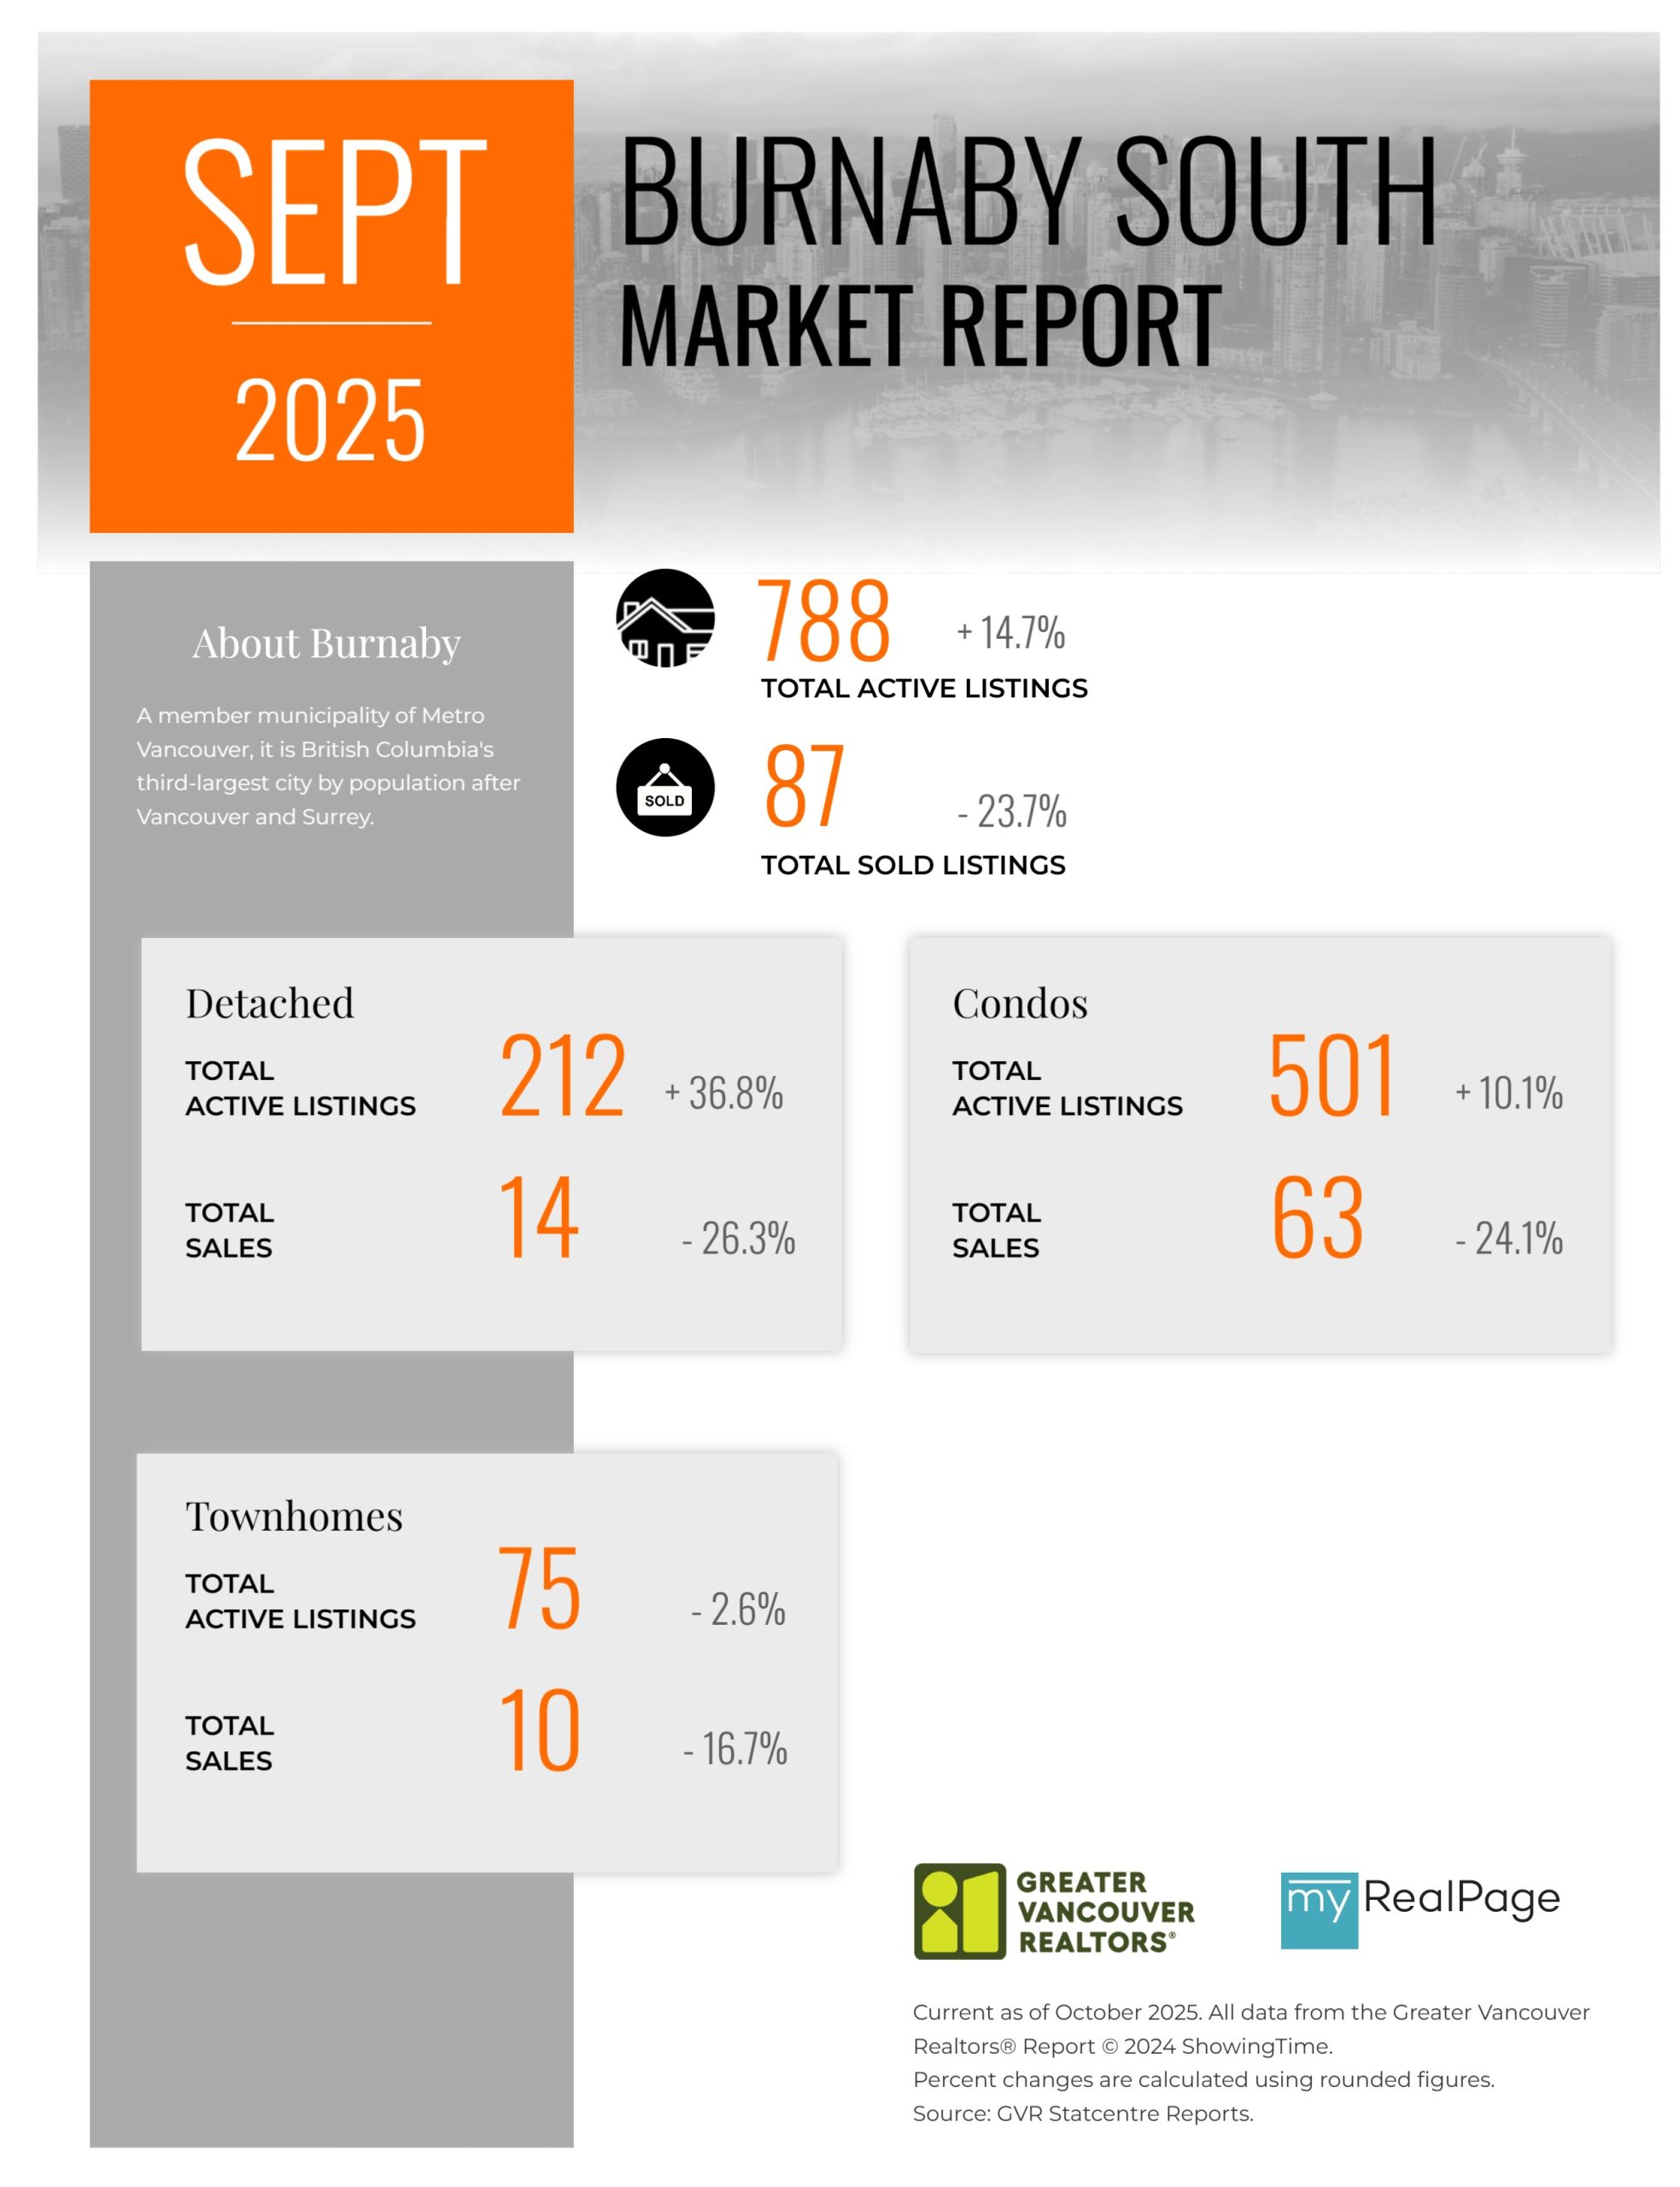
Printable Version – GVR September 2025 Data Infographics Report Burnaby South
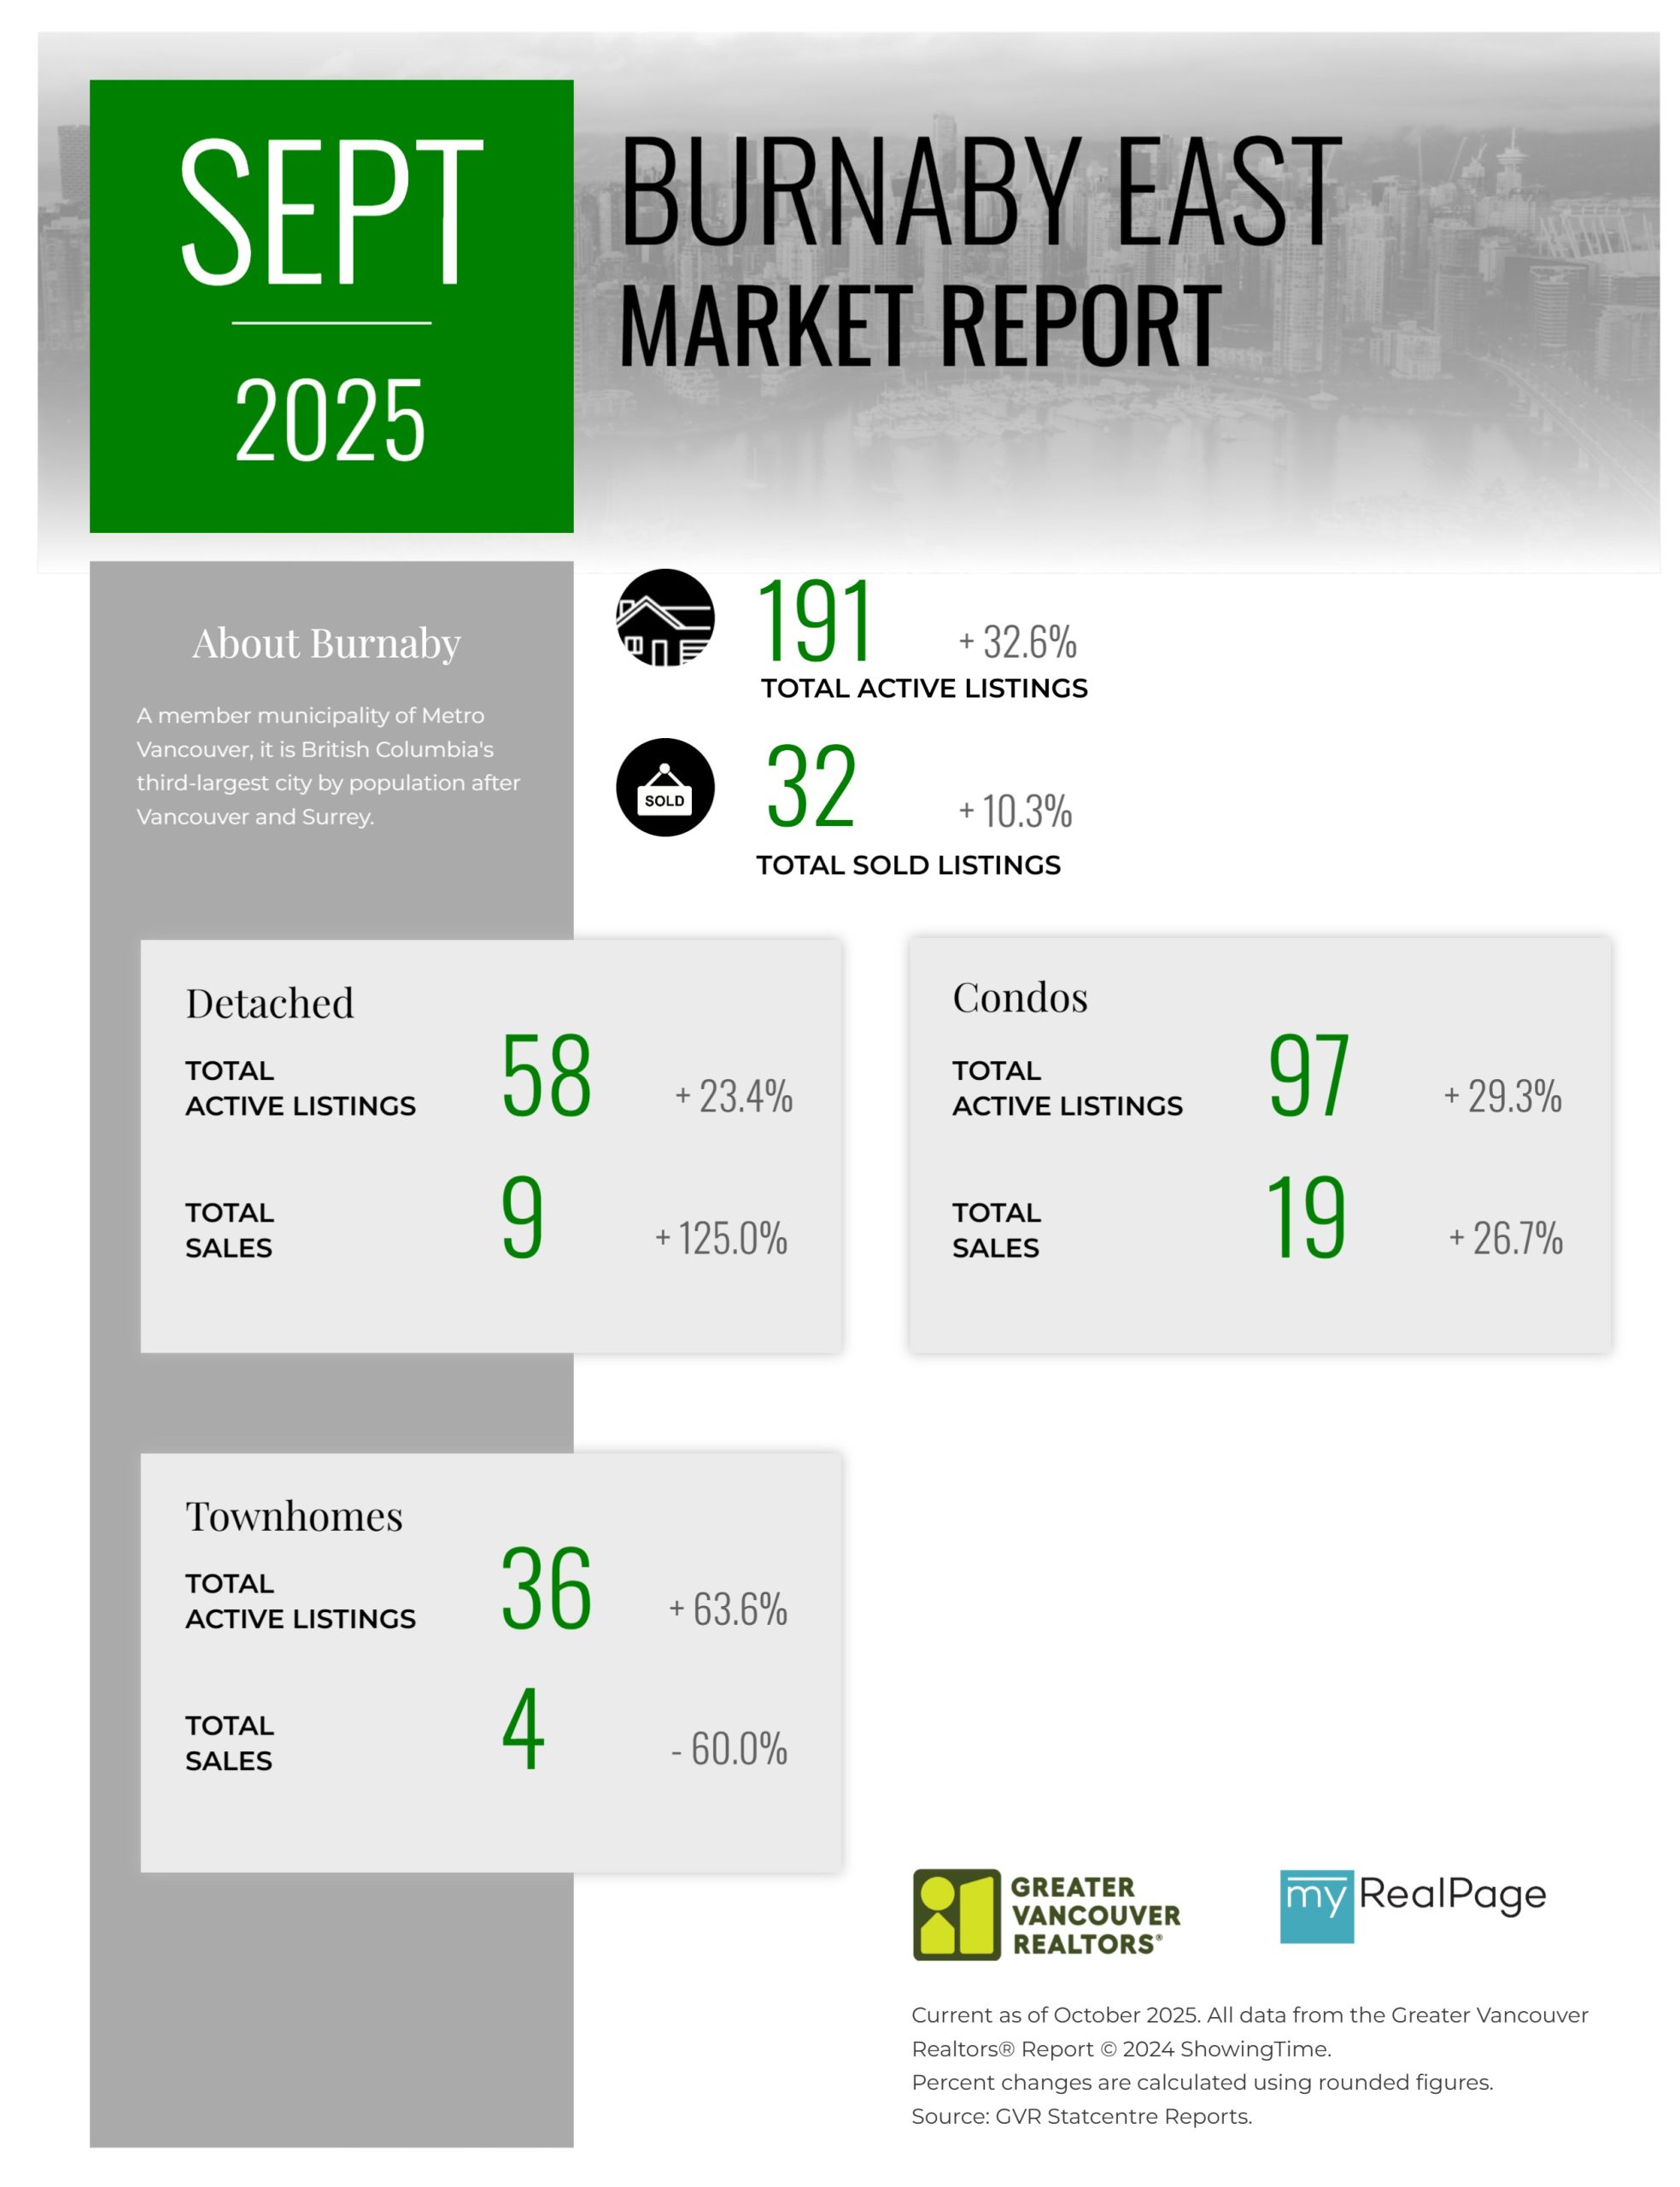
Printable Version – GVR September 2025 Data Infographics Report Burnaby East
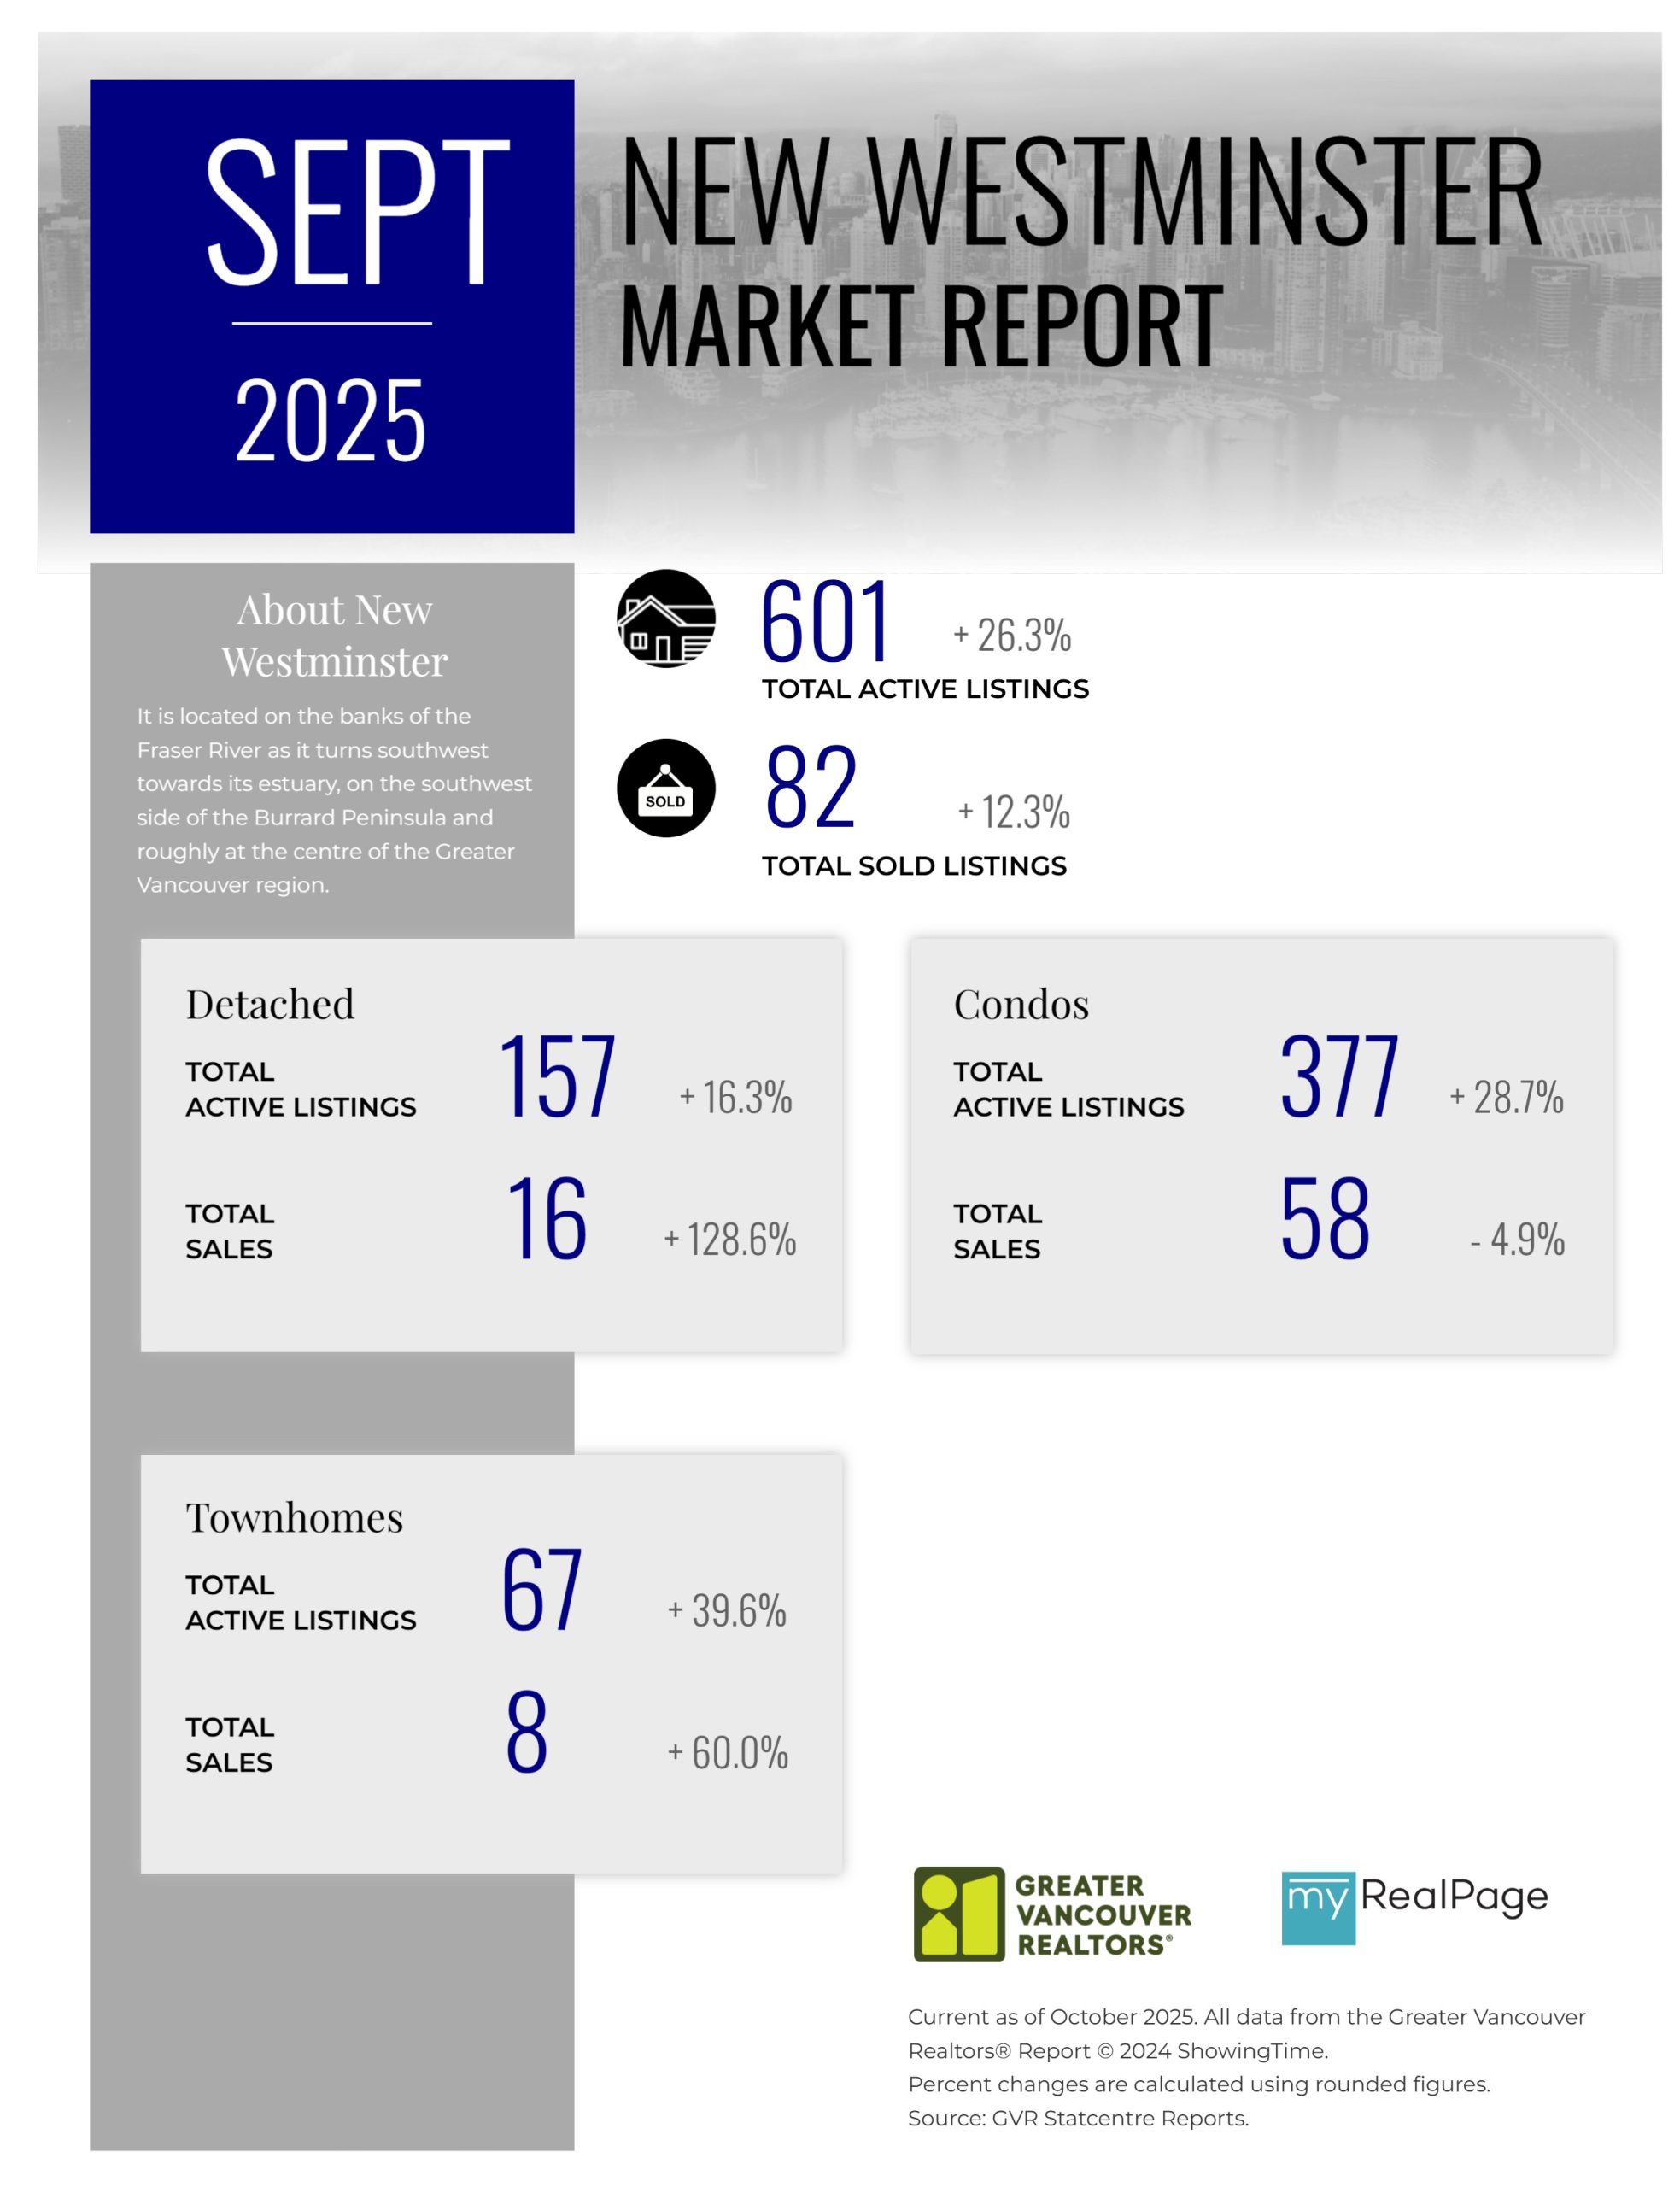
Printable Version – GVR September 2025 Data Infographics Report New Westminster
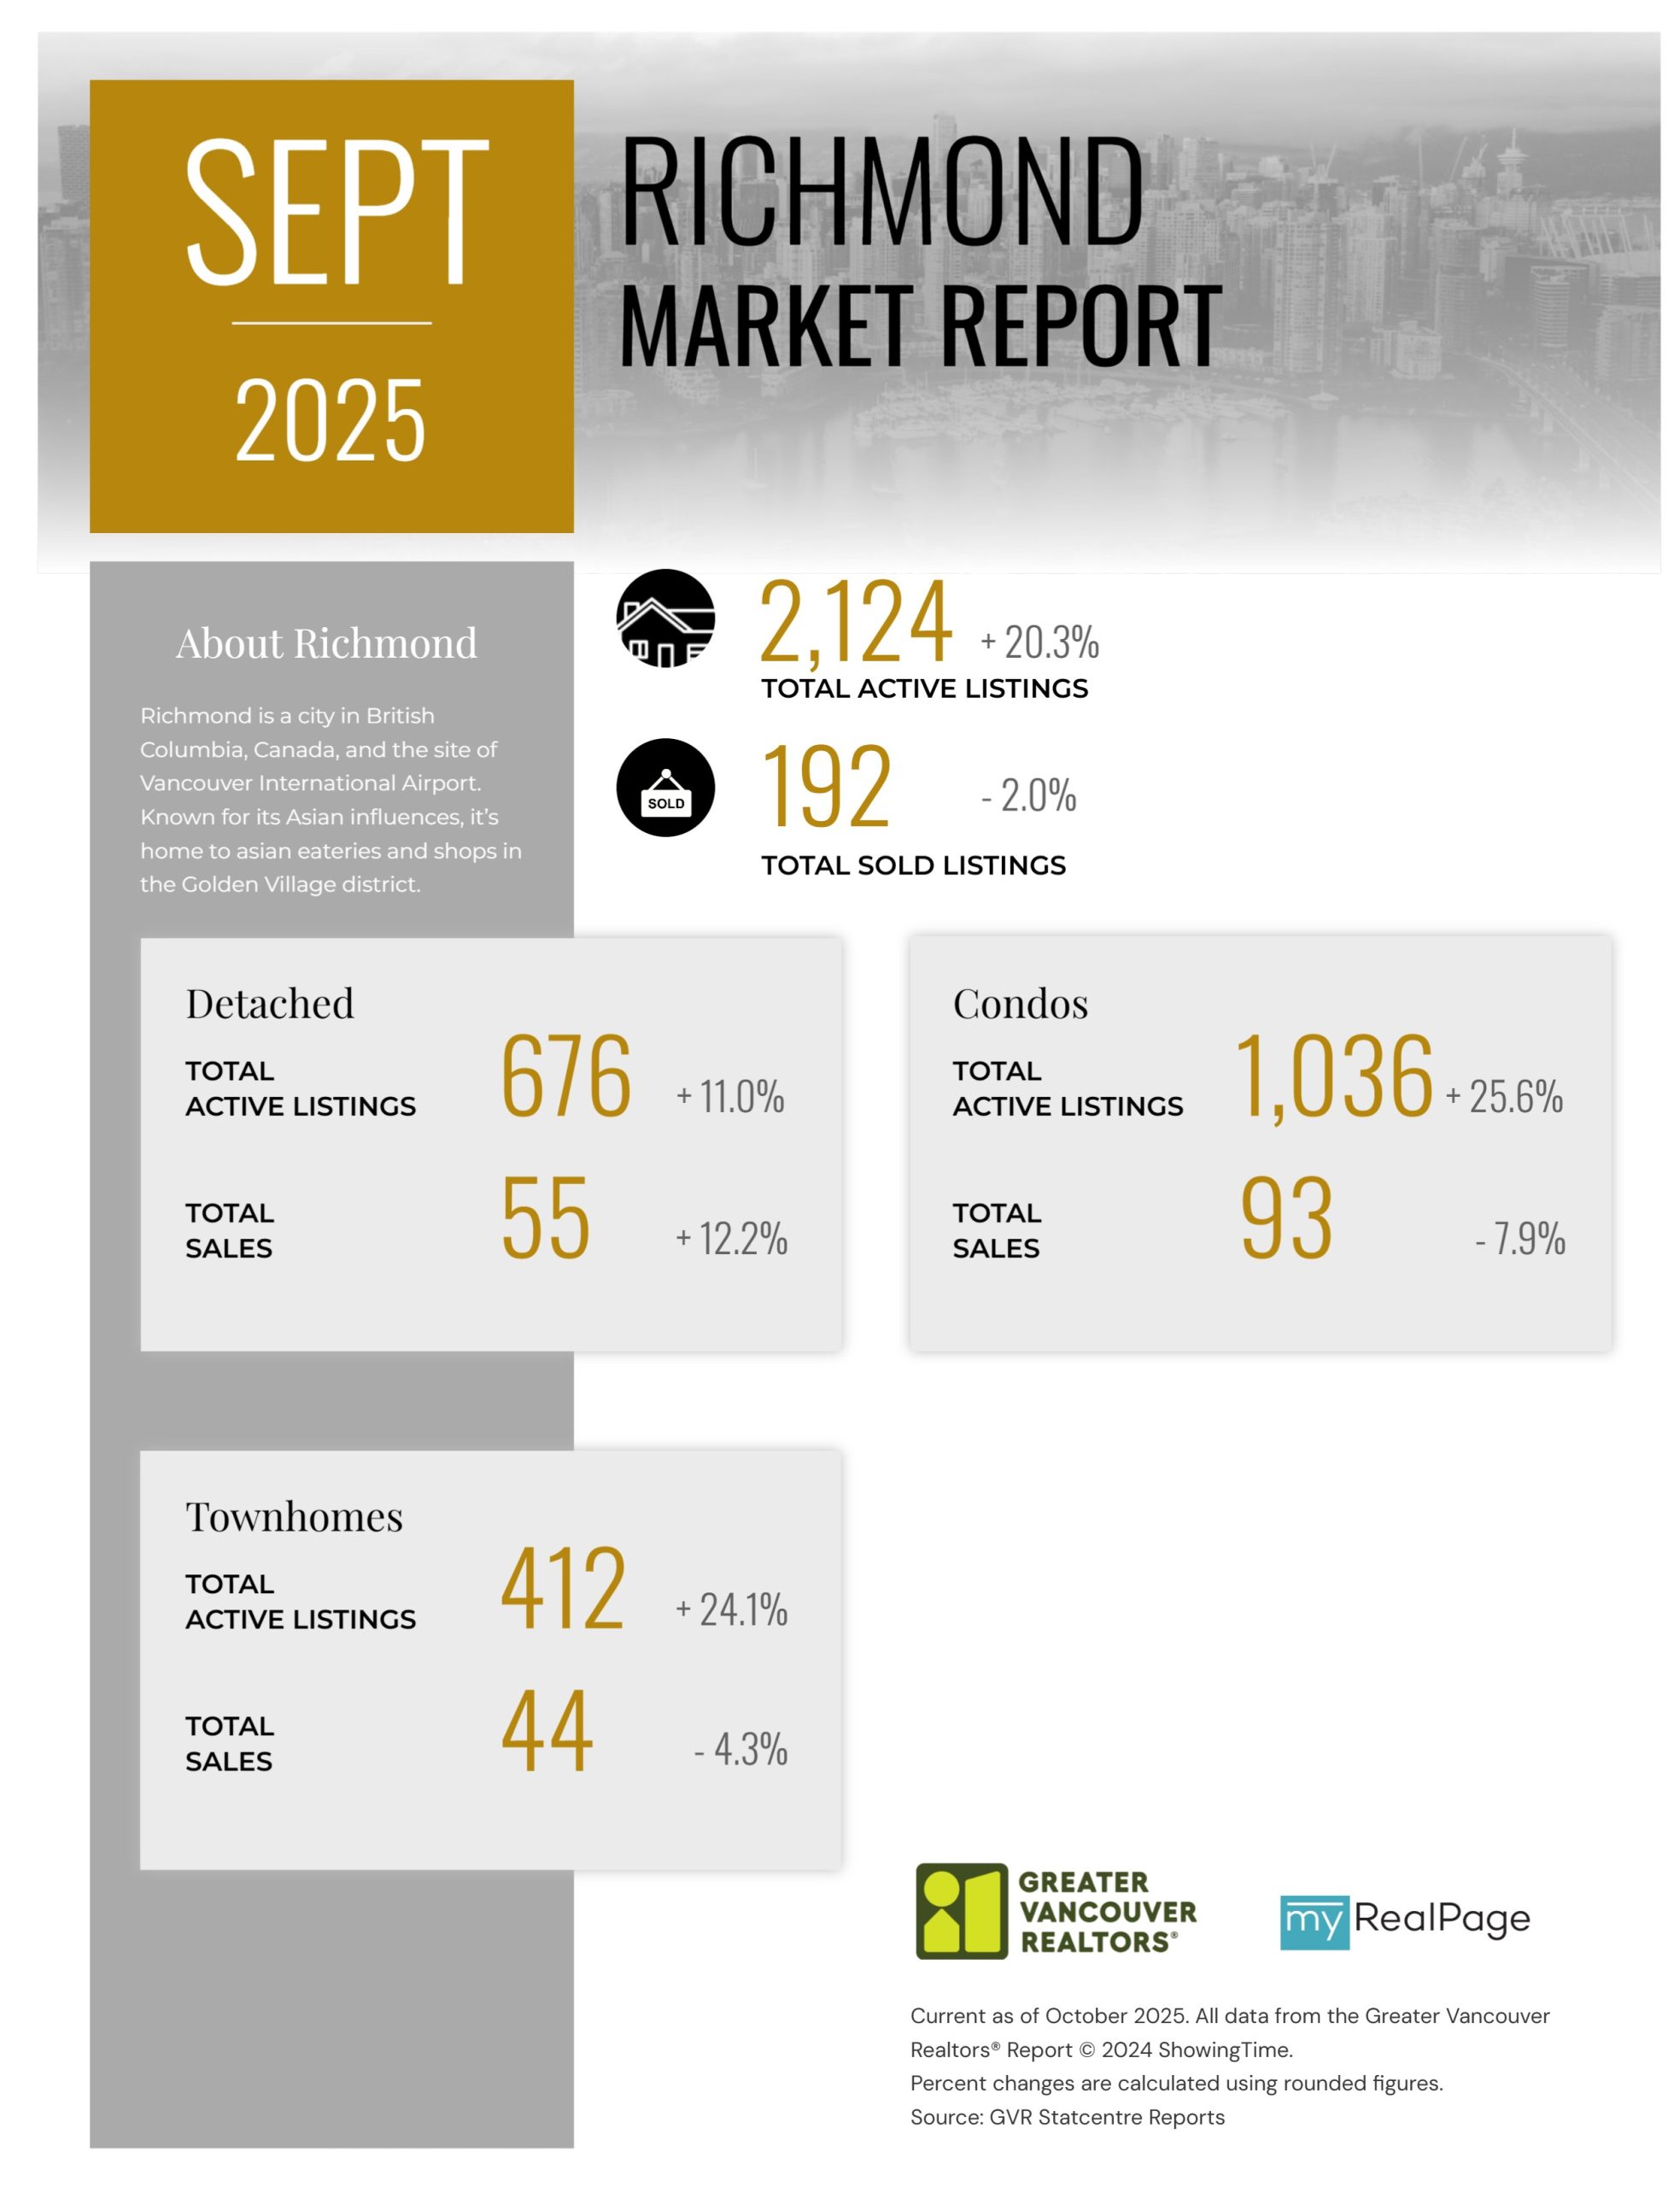
Printable Version – GVR September 2025 Data Infographics Report Richmond
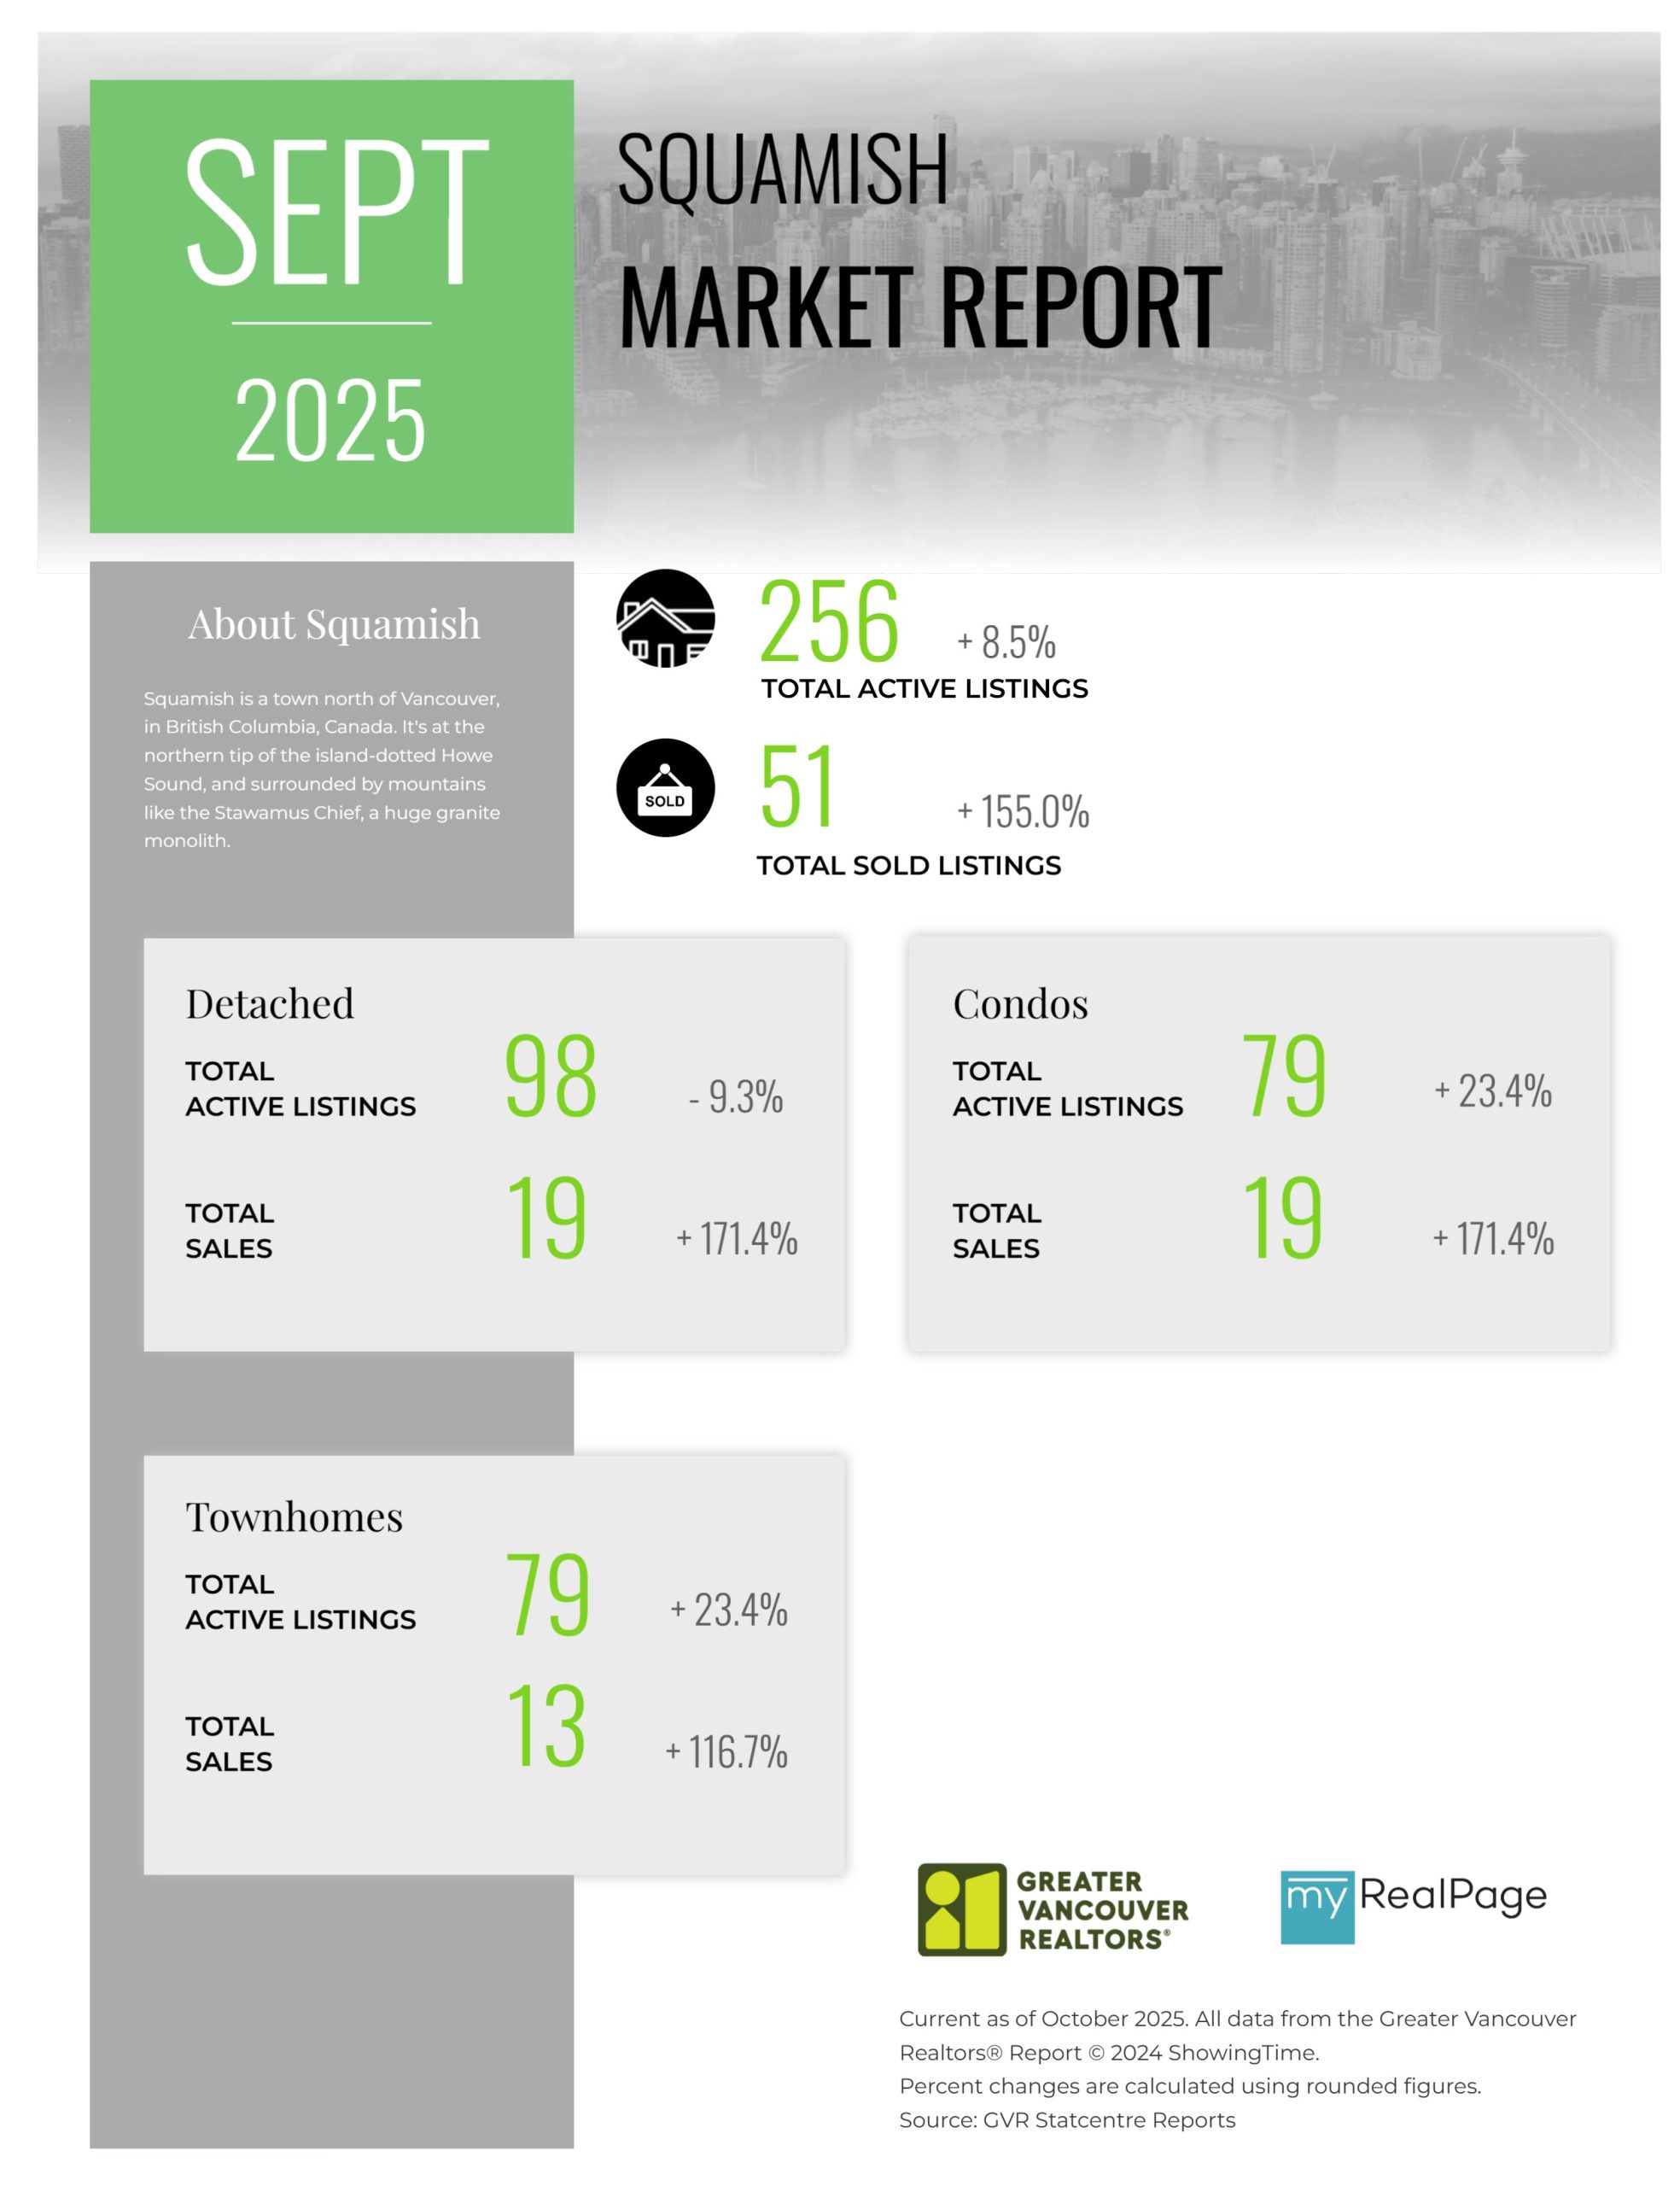
Printable Version – GVR September 2025 Data Infographics Report Squamish
Last Updated on October 10, 2025 by myRealPage
