INFOGRAPHICS: July 2025 GVR Greater Vancouver Market Reports

Sales recovery continues in July
Home sales registered on the MLS® across Metro Vancouver* in July extended the early signs of recovery that emerged in June, now down just two per cent from July of last year.
The Greater Vancouver REALTORS® (GVR) reports that residential sales in the region totalled 2,286 in July 2025, a two per cent decrease from the 2,333 sales recorded in July 2024. This was 13.9 per cent below the 10-year seasonal average (2,656).
“The June data showed early signs of sales activity in the region turning a corner, and these latest figures for July are confirming this emerging trend. Although the Bank of Canada held the policy rate steady in July, this decision could help bolster sales activity by providing more certainty surrounding borrowing costs at a time where economic uncertainty lingers due to ongoing trade negotiations with the US.” said Andrew Lis, GVR director of economics and data analytics
Read the full report on the REBGV website!
The following data is a comparison between July 2025 and July 2024 numbers, and is current as of August of 2025. For last month’s update, you can check out our previous post!
Or follow this link for all our GVR Infographics!
These infographics cover current trends in several areas within the Greater Vancouver region. Click on the images for a larger view!
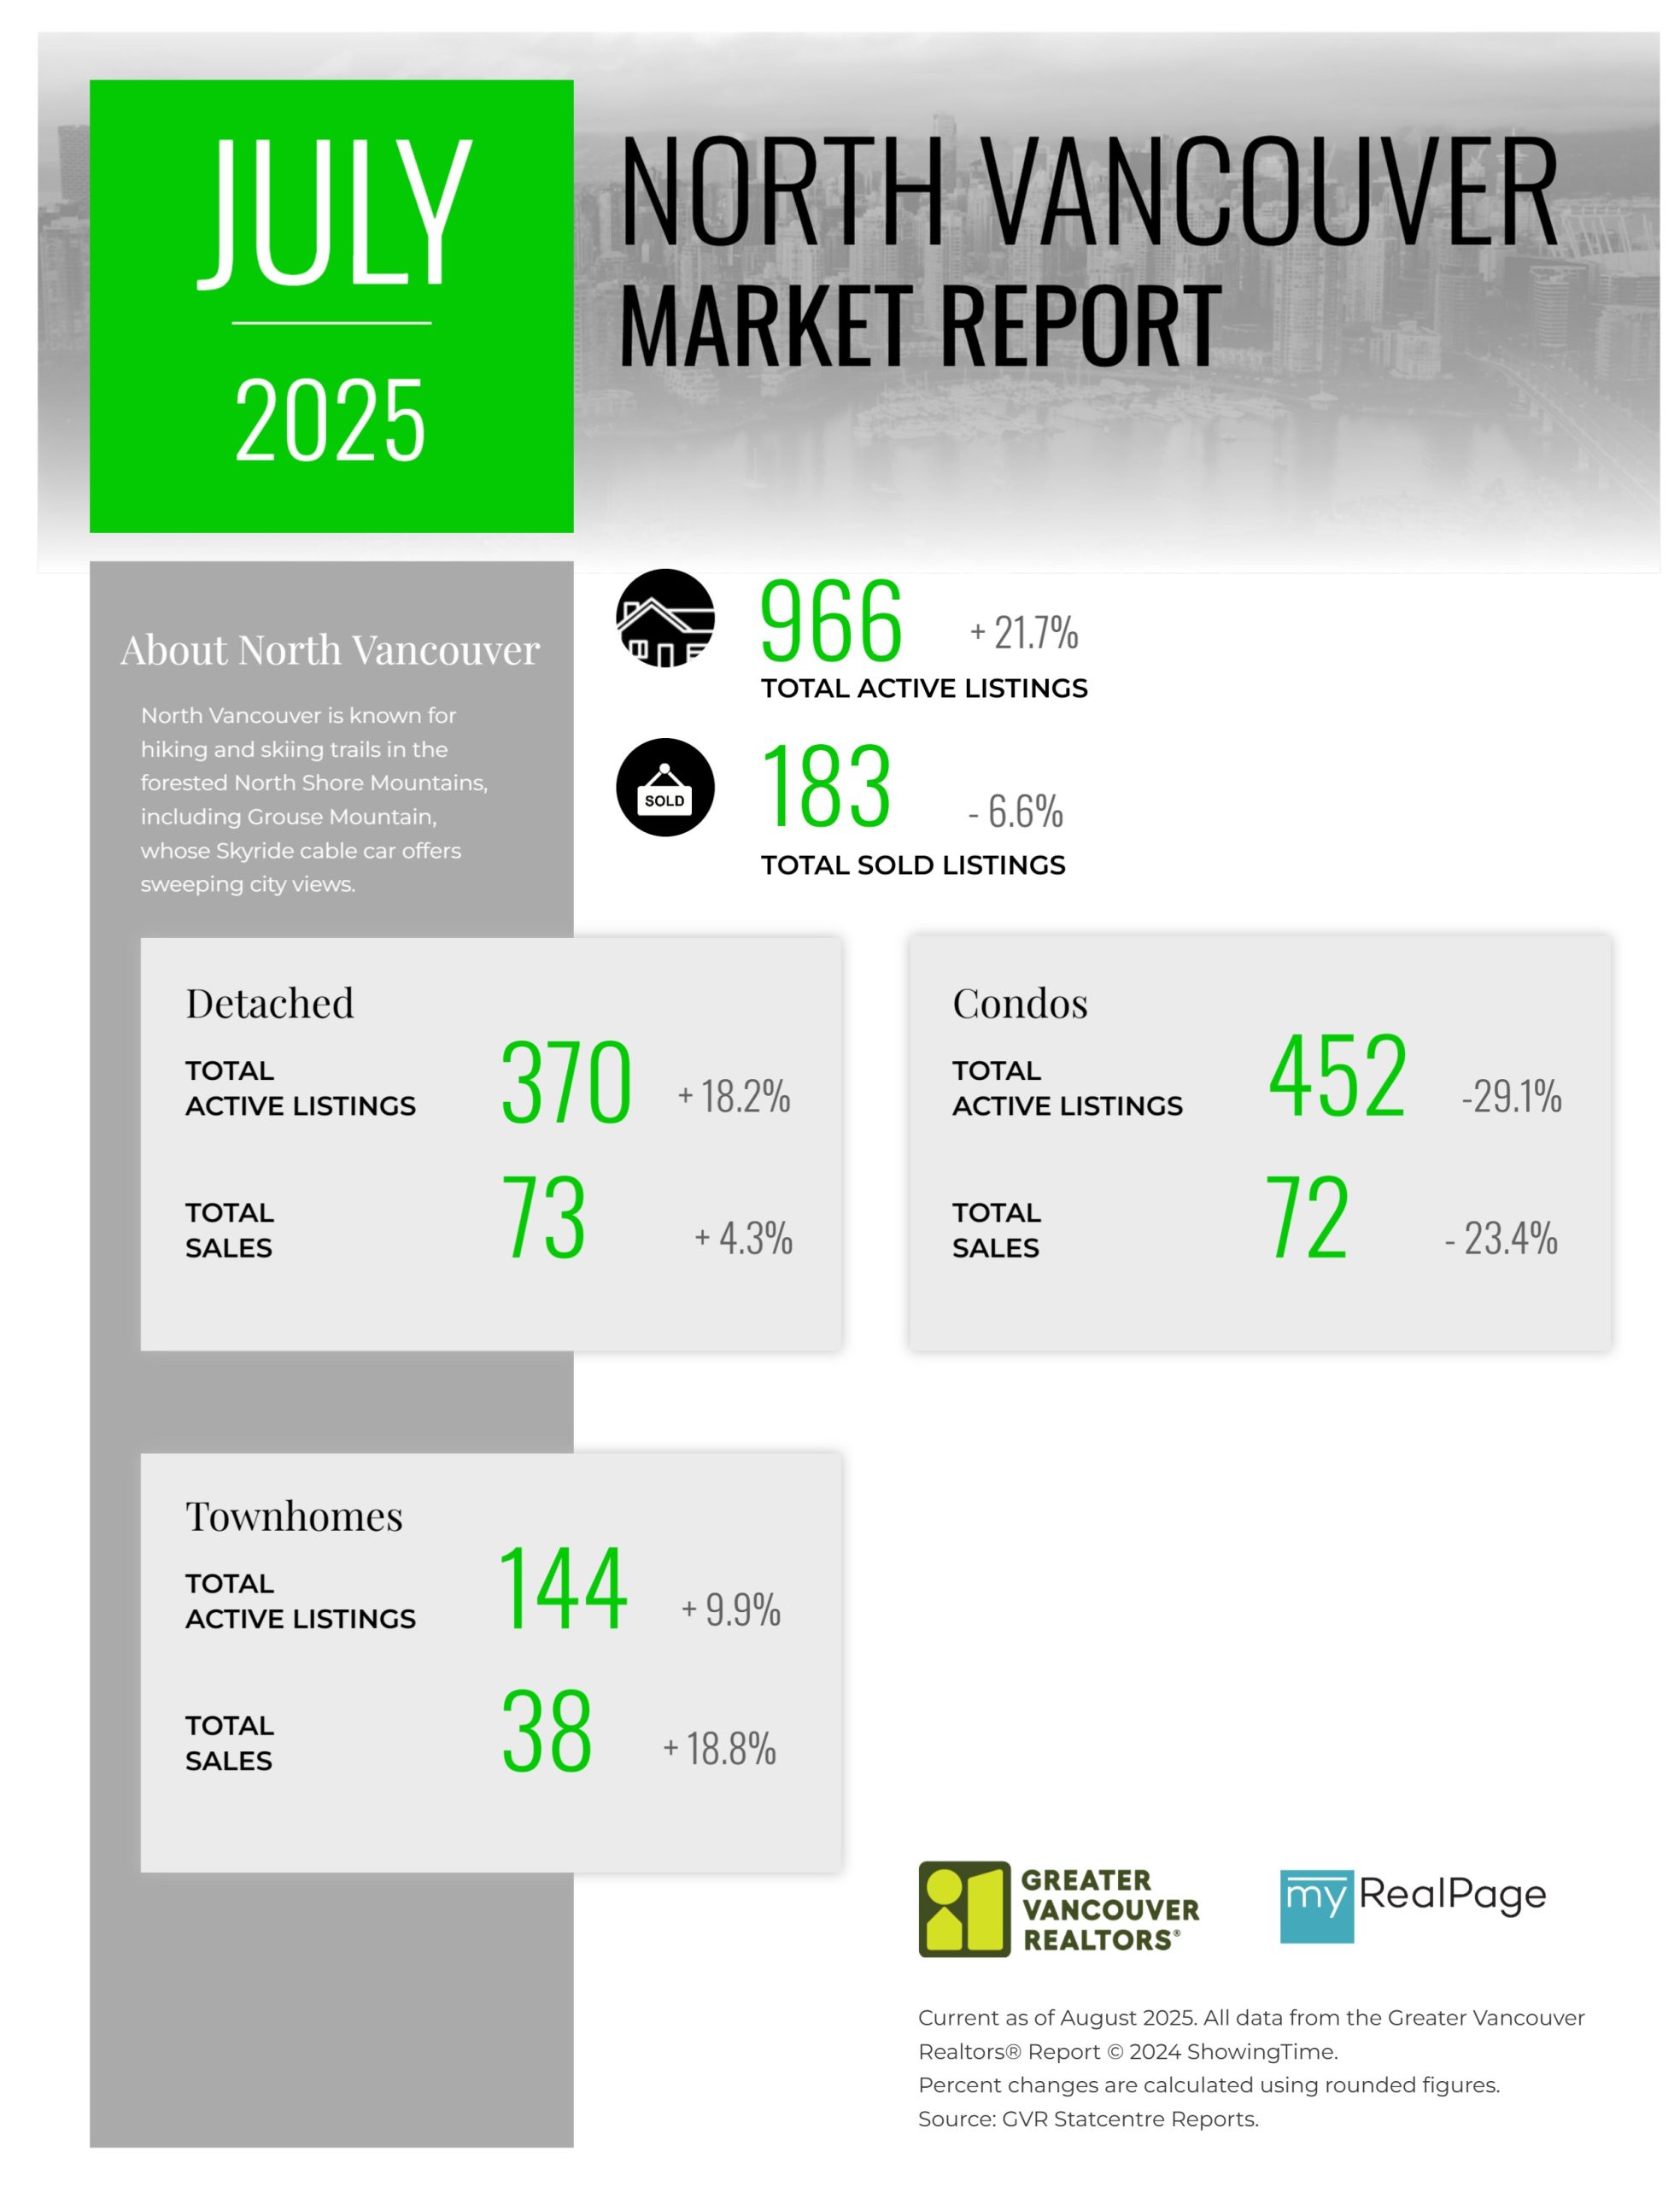
Printable Version – GVR July 2025 Data Infographic Report North Vancouver
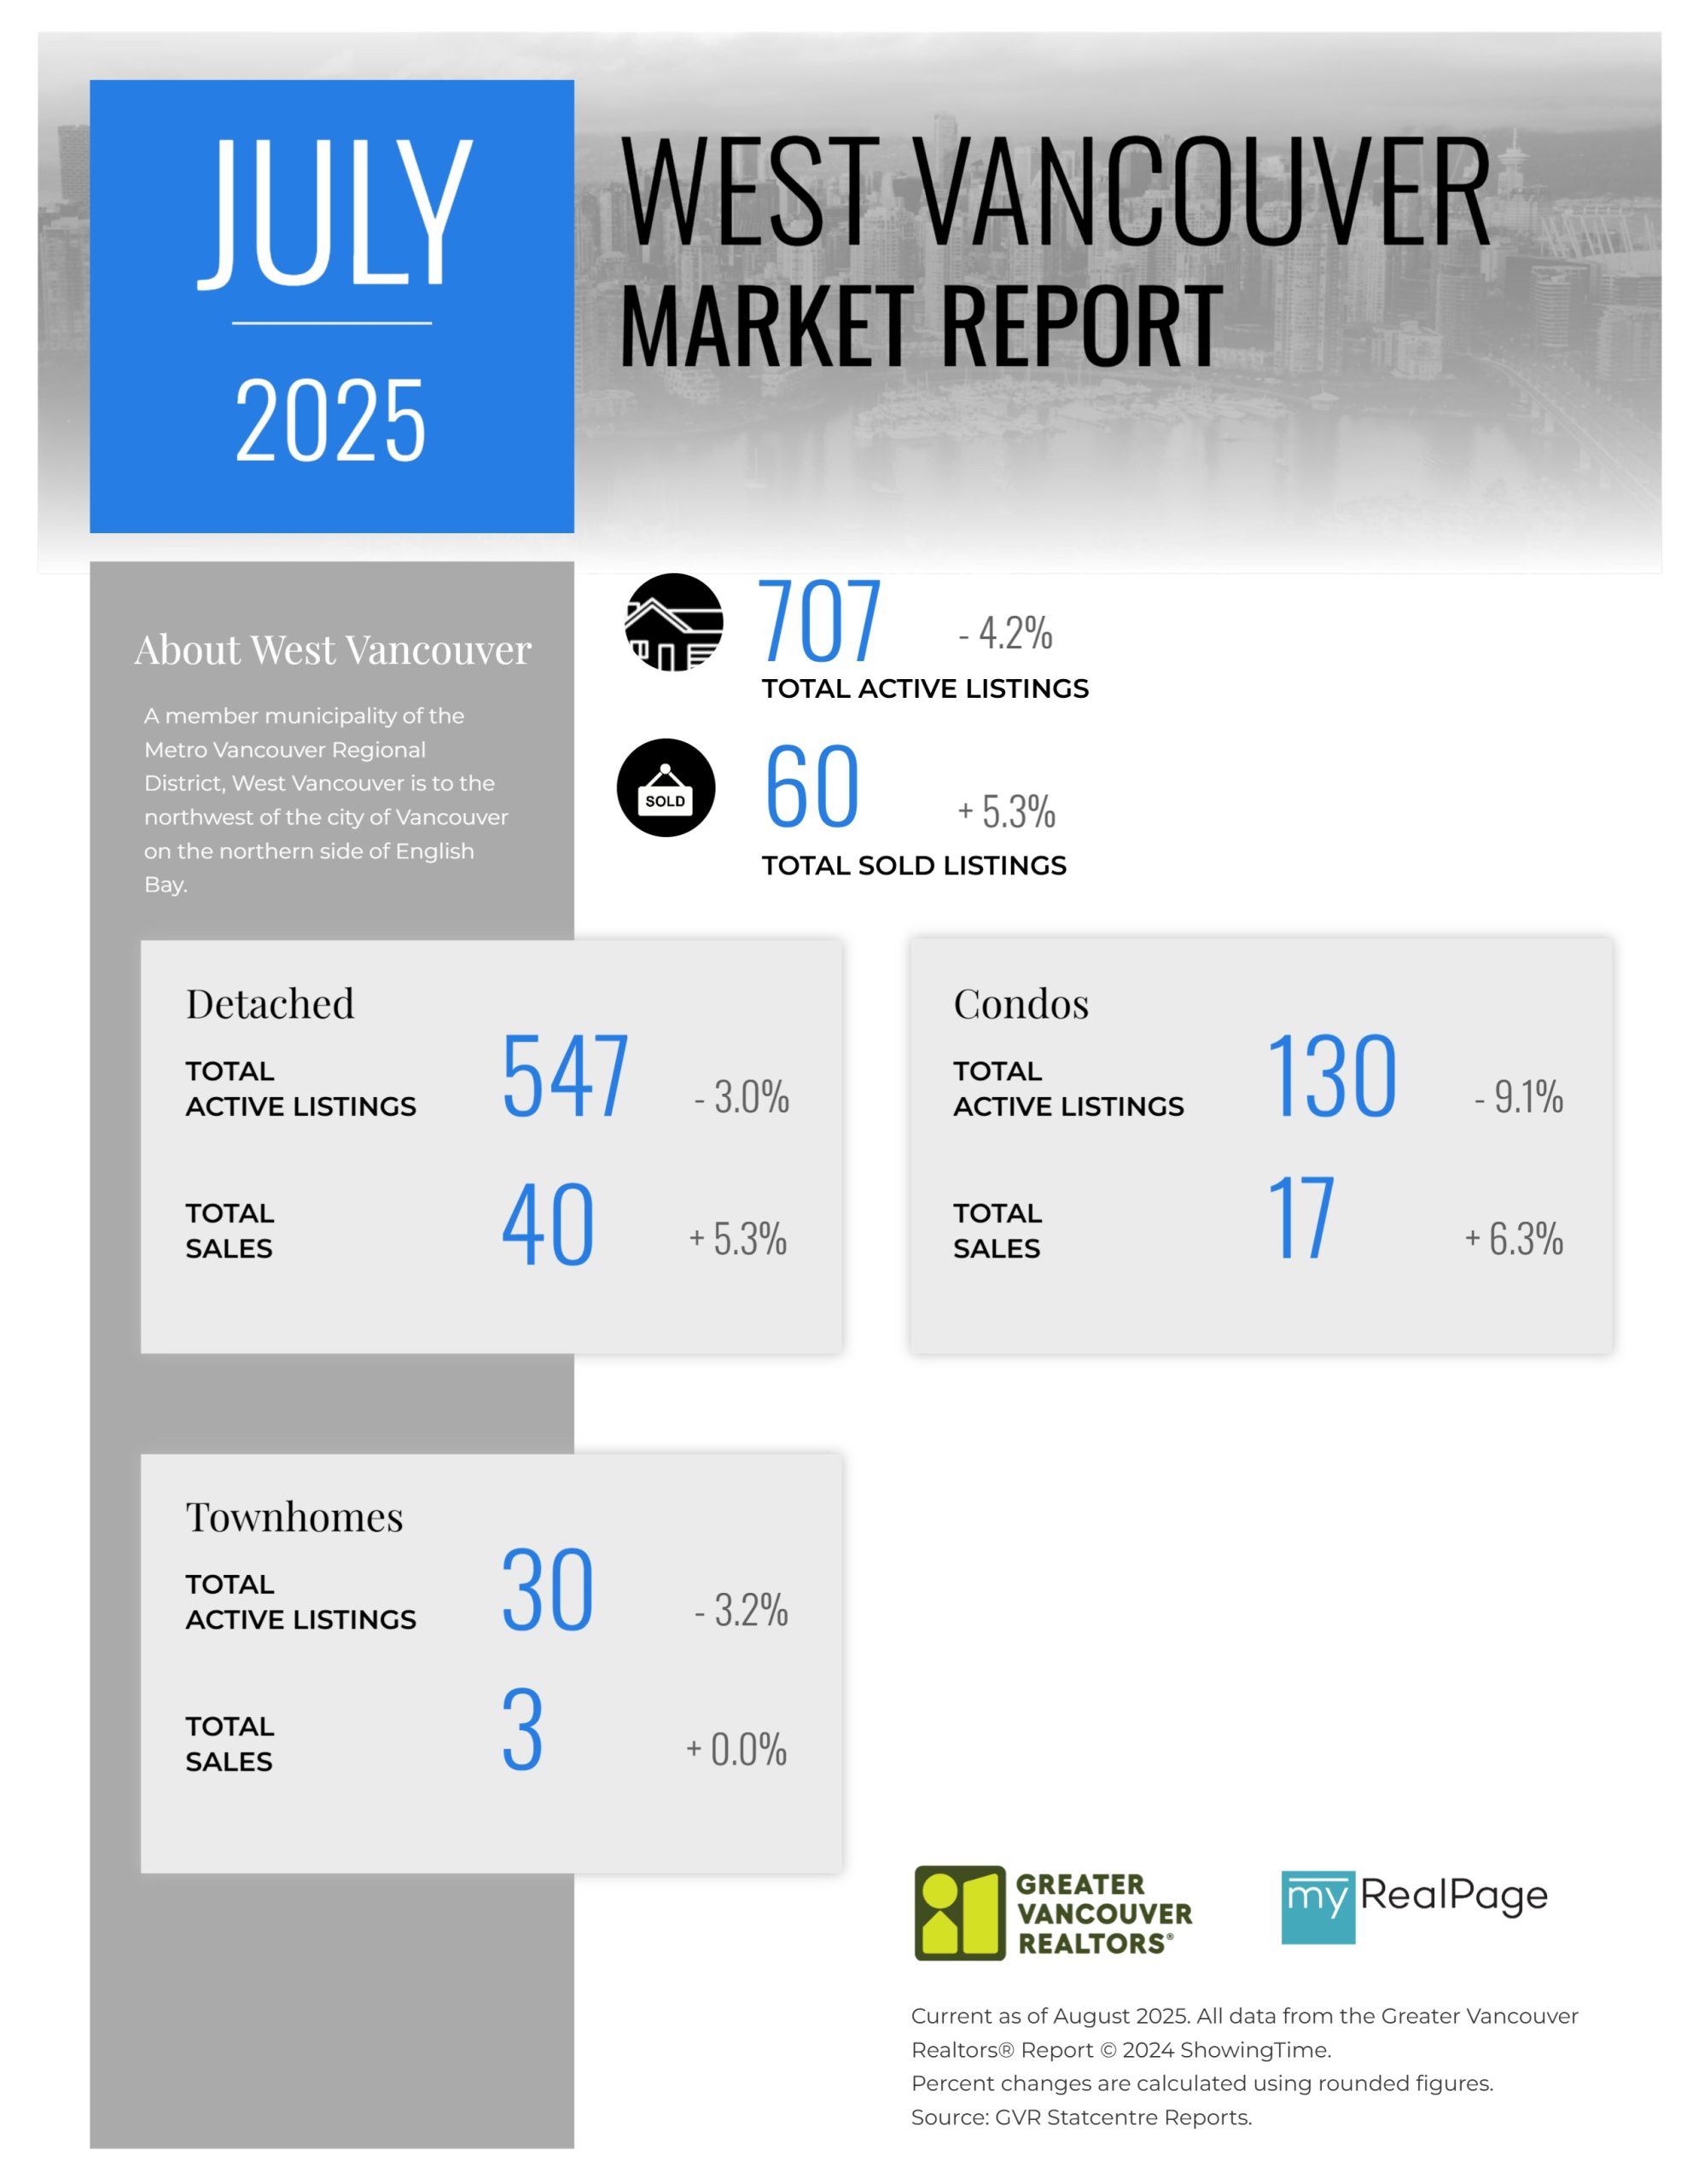
Printable Version – GVR July 2025 Data Infographics Report West Vancouver
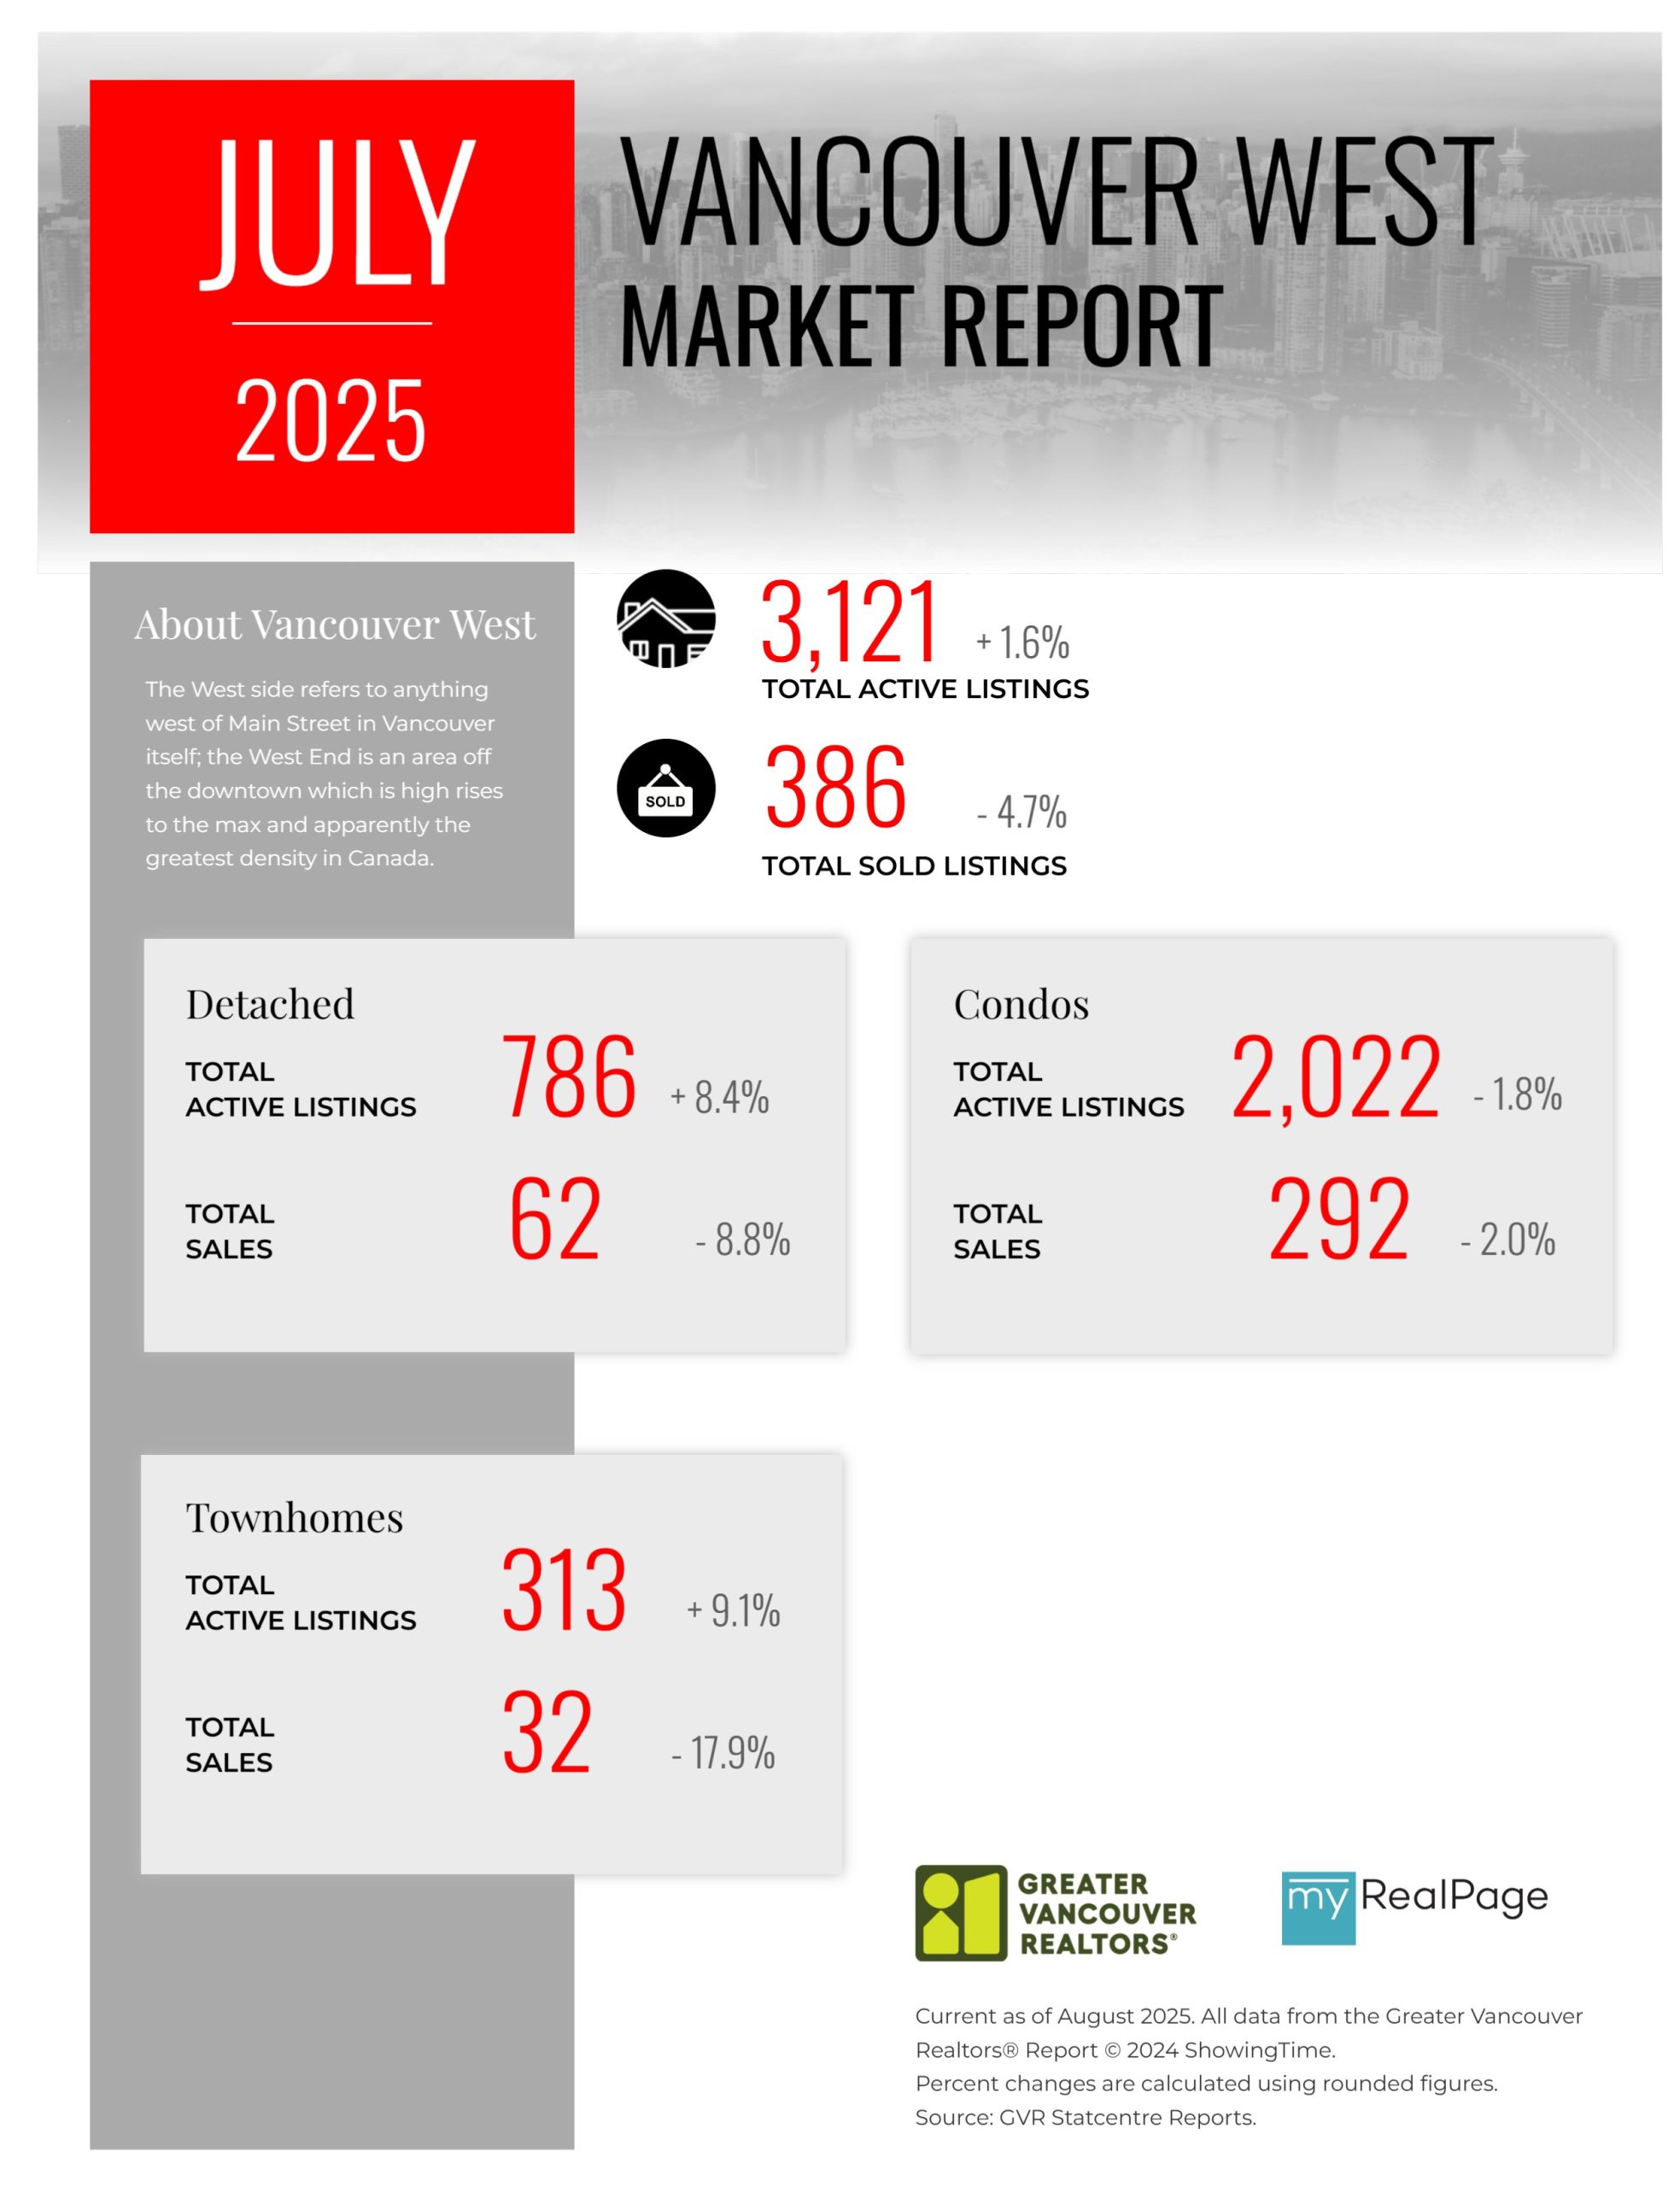
Printable Version – GVR July 2025 Data Infographics Report Vancouver West
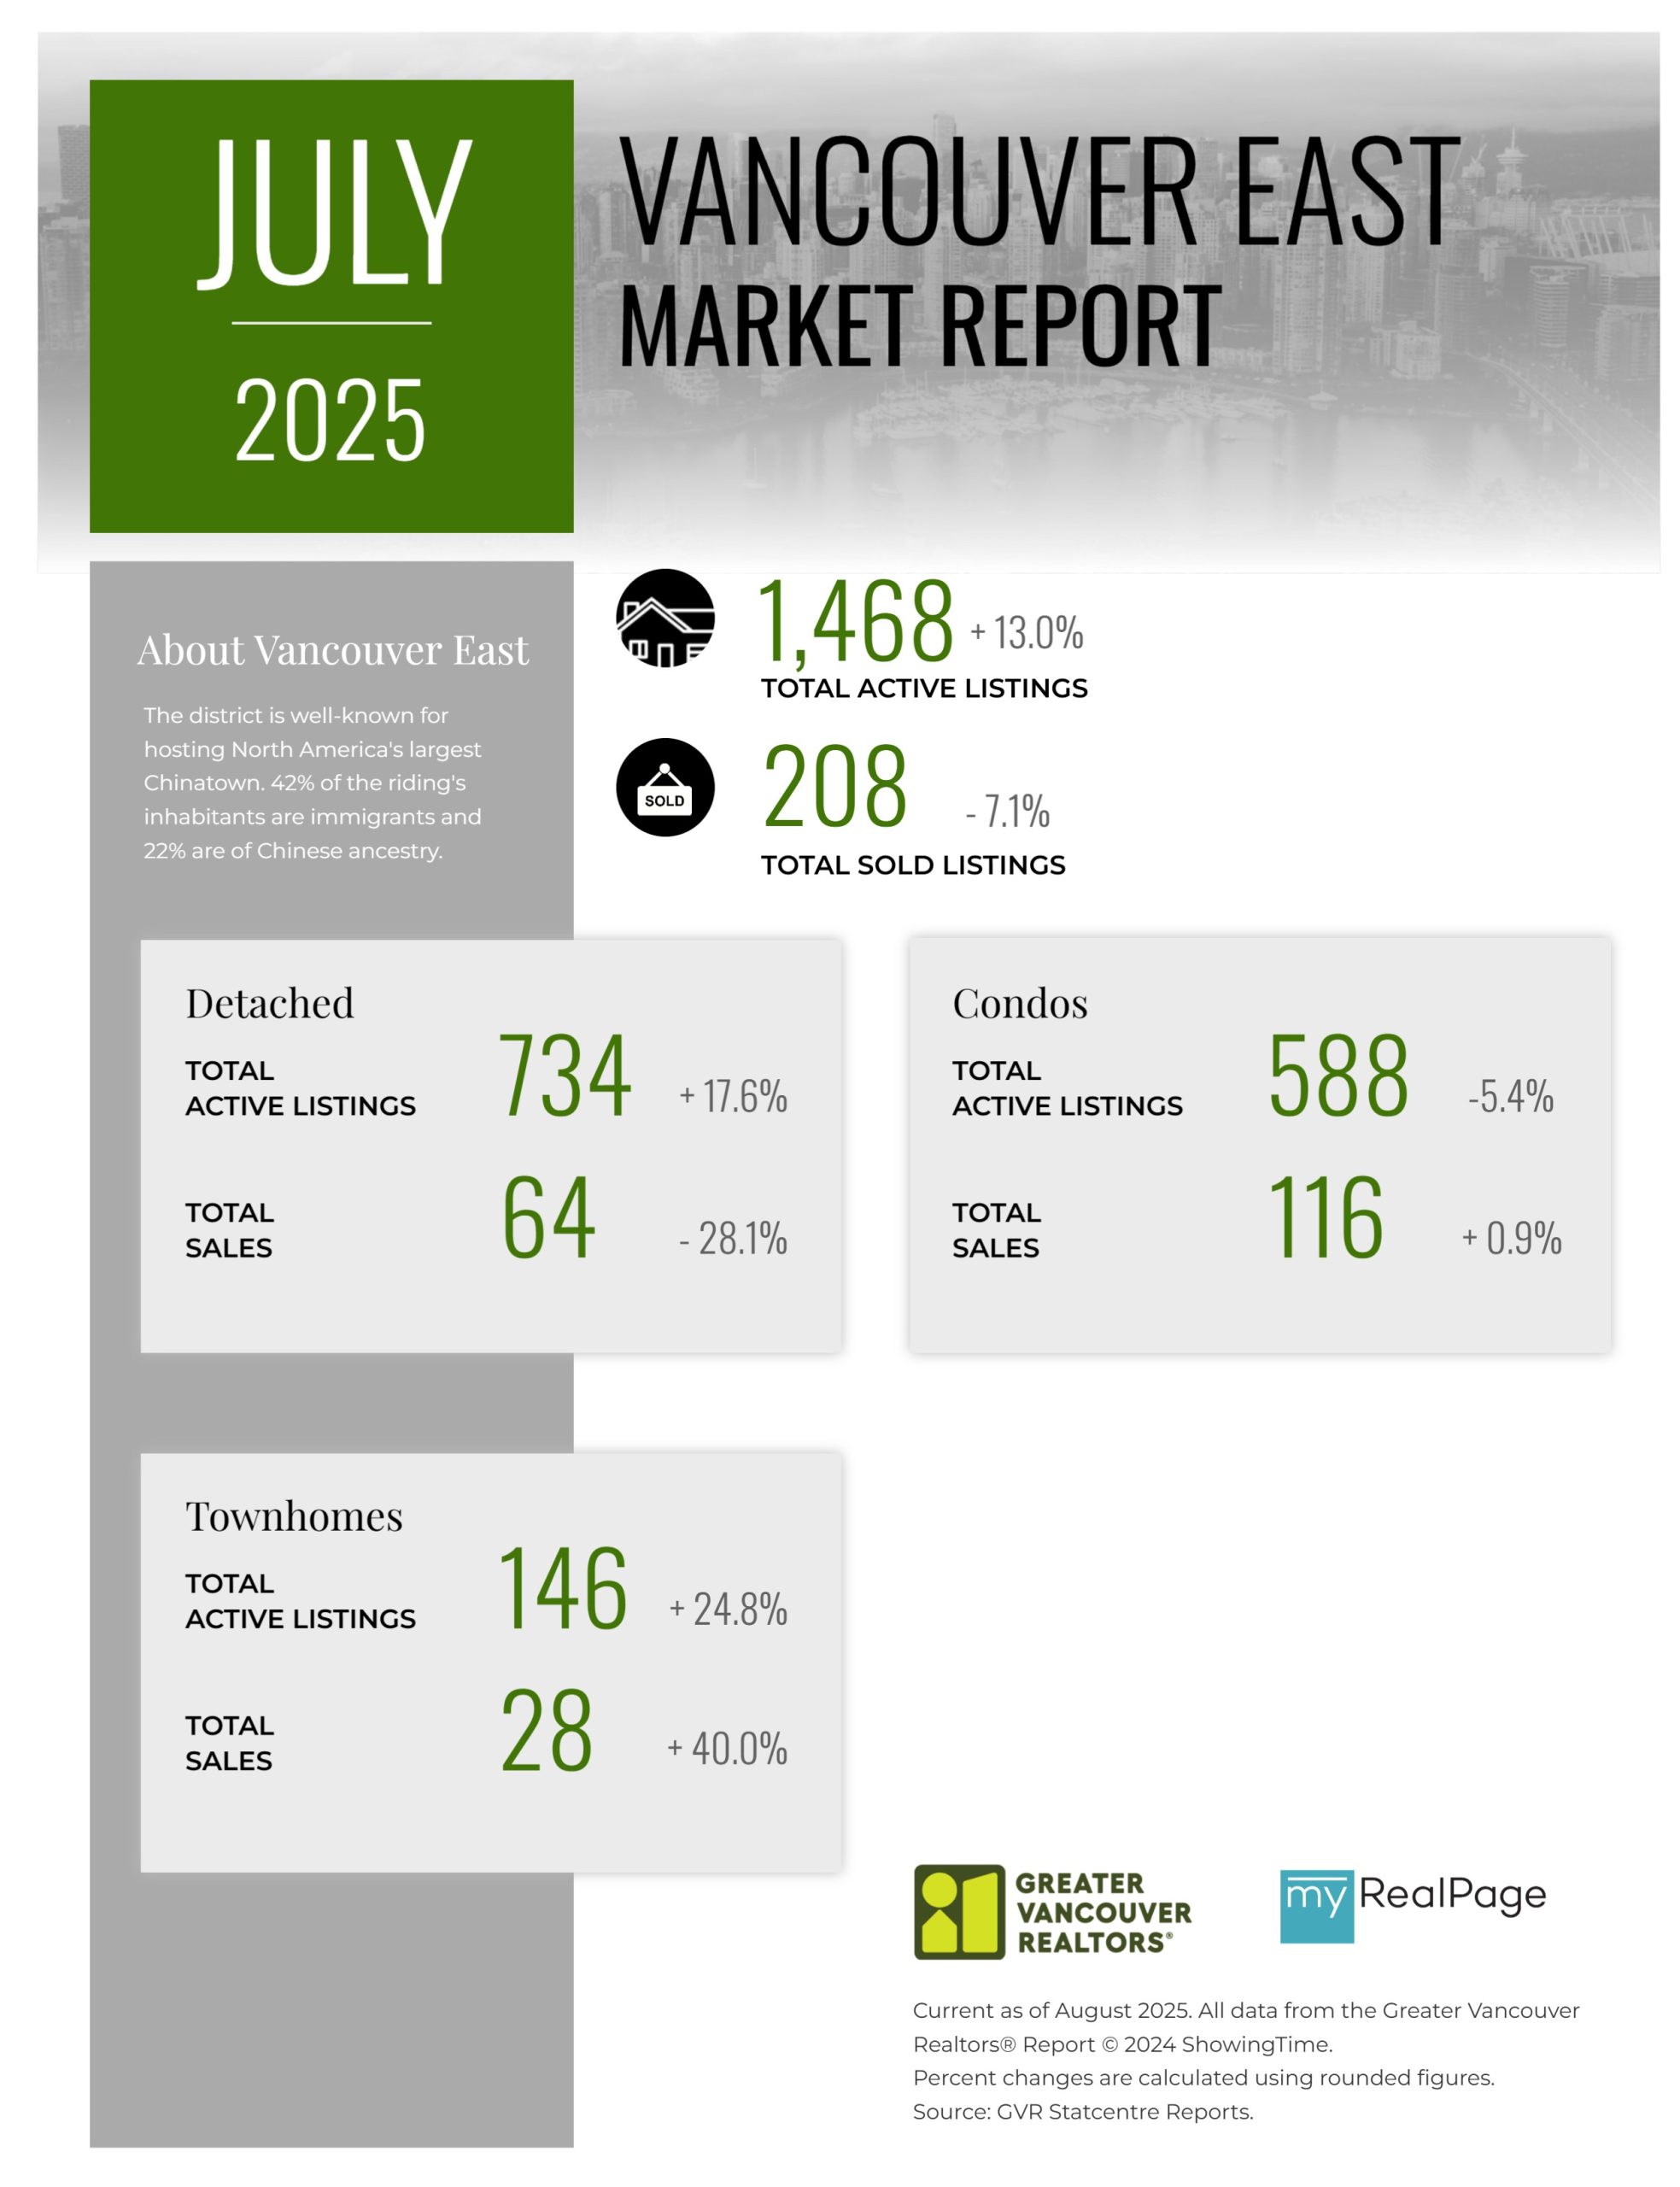
Printable Version – GVR July 2025 Data Infographics Report Vancouver East
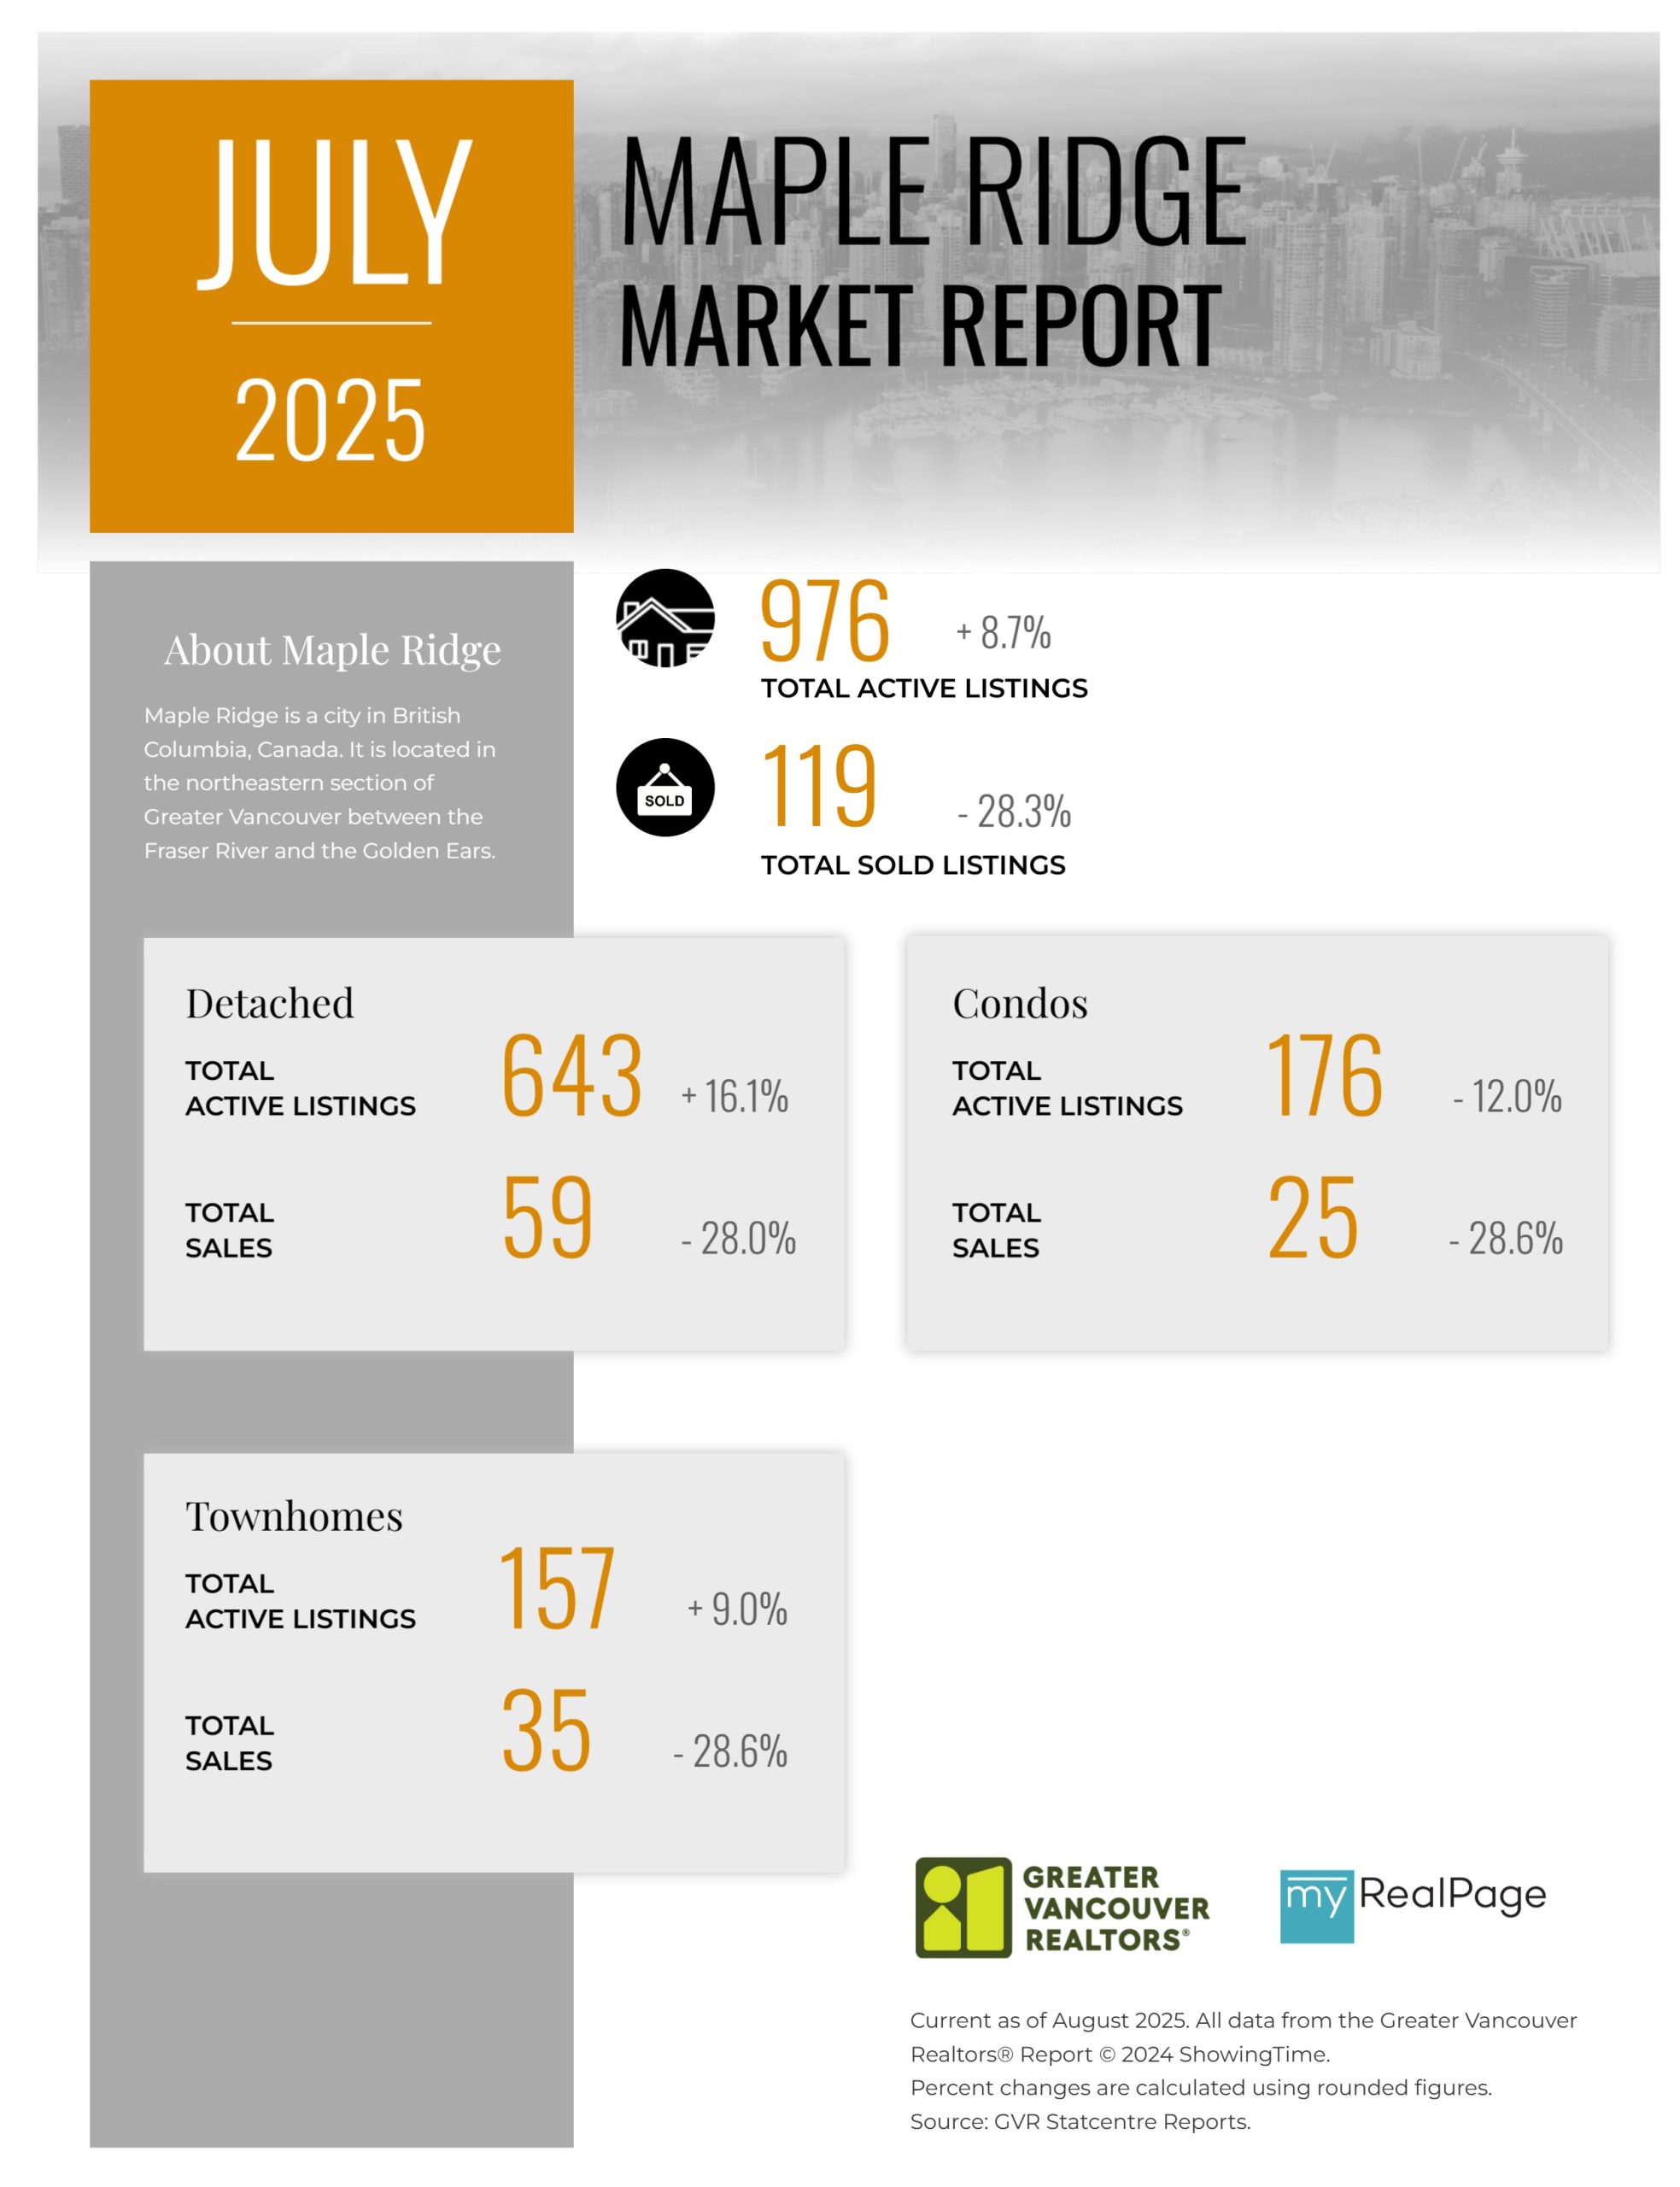
Printable Version – GVR July 2025 Data Infographic Report Maple Ridge
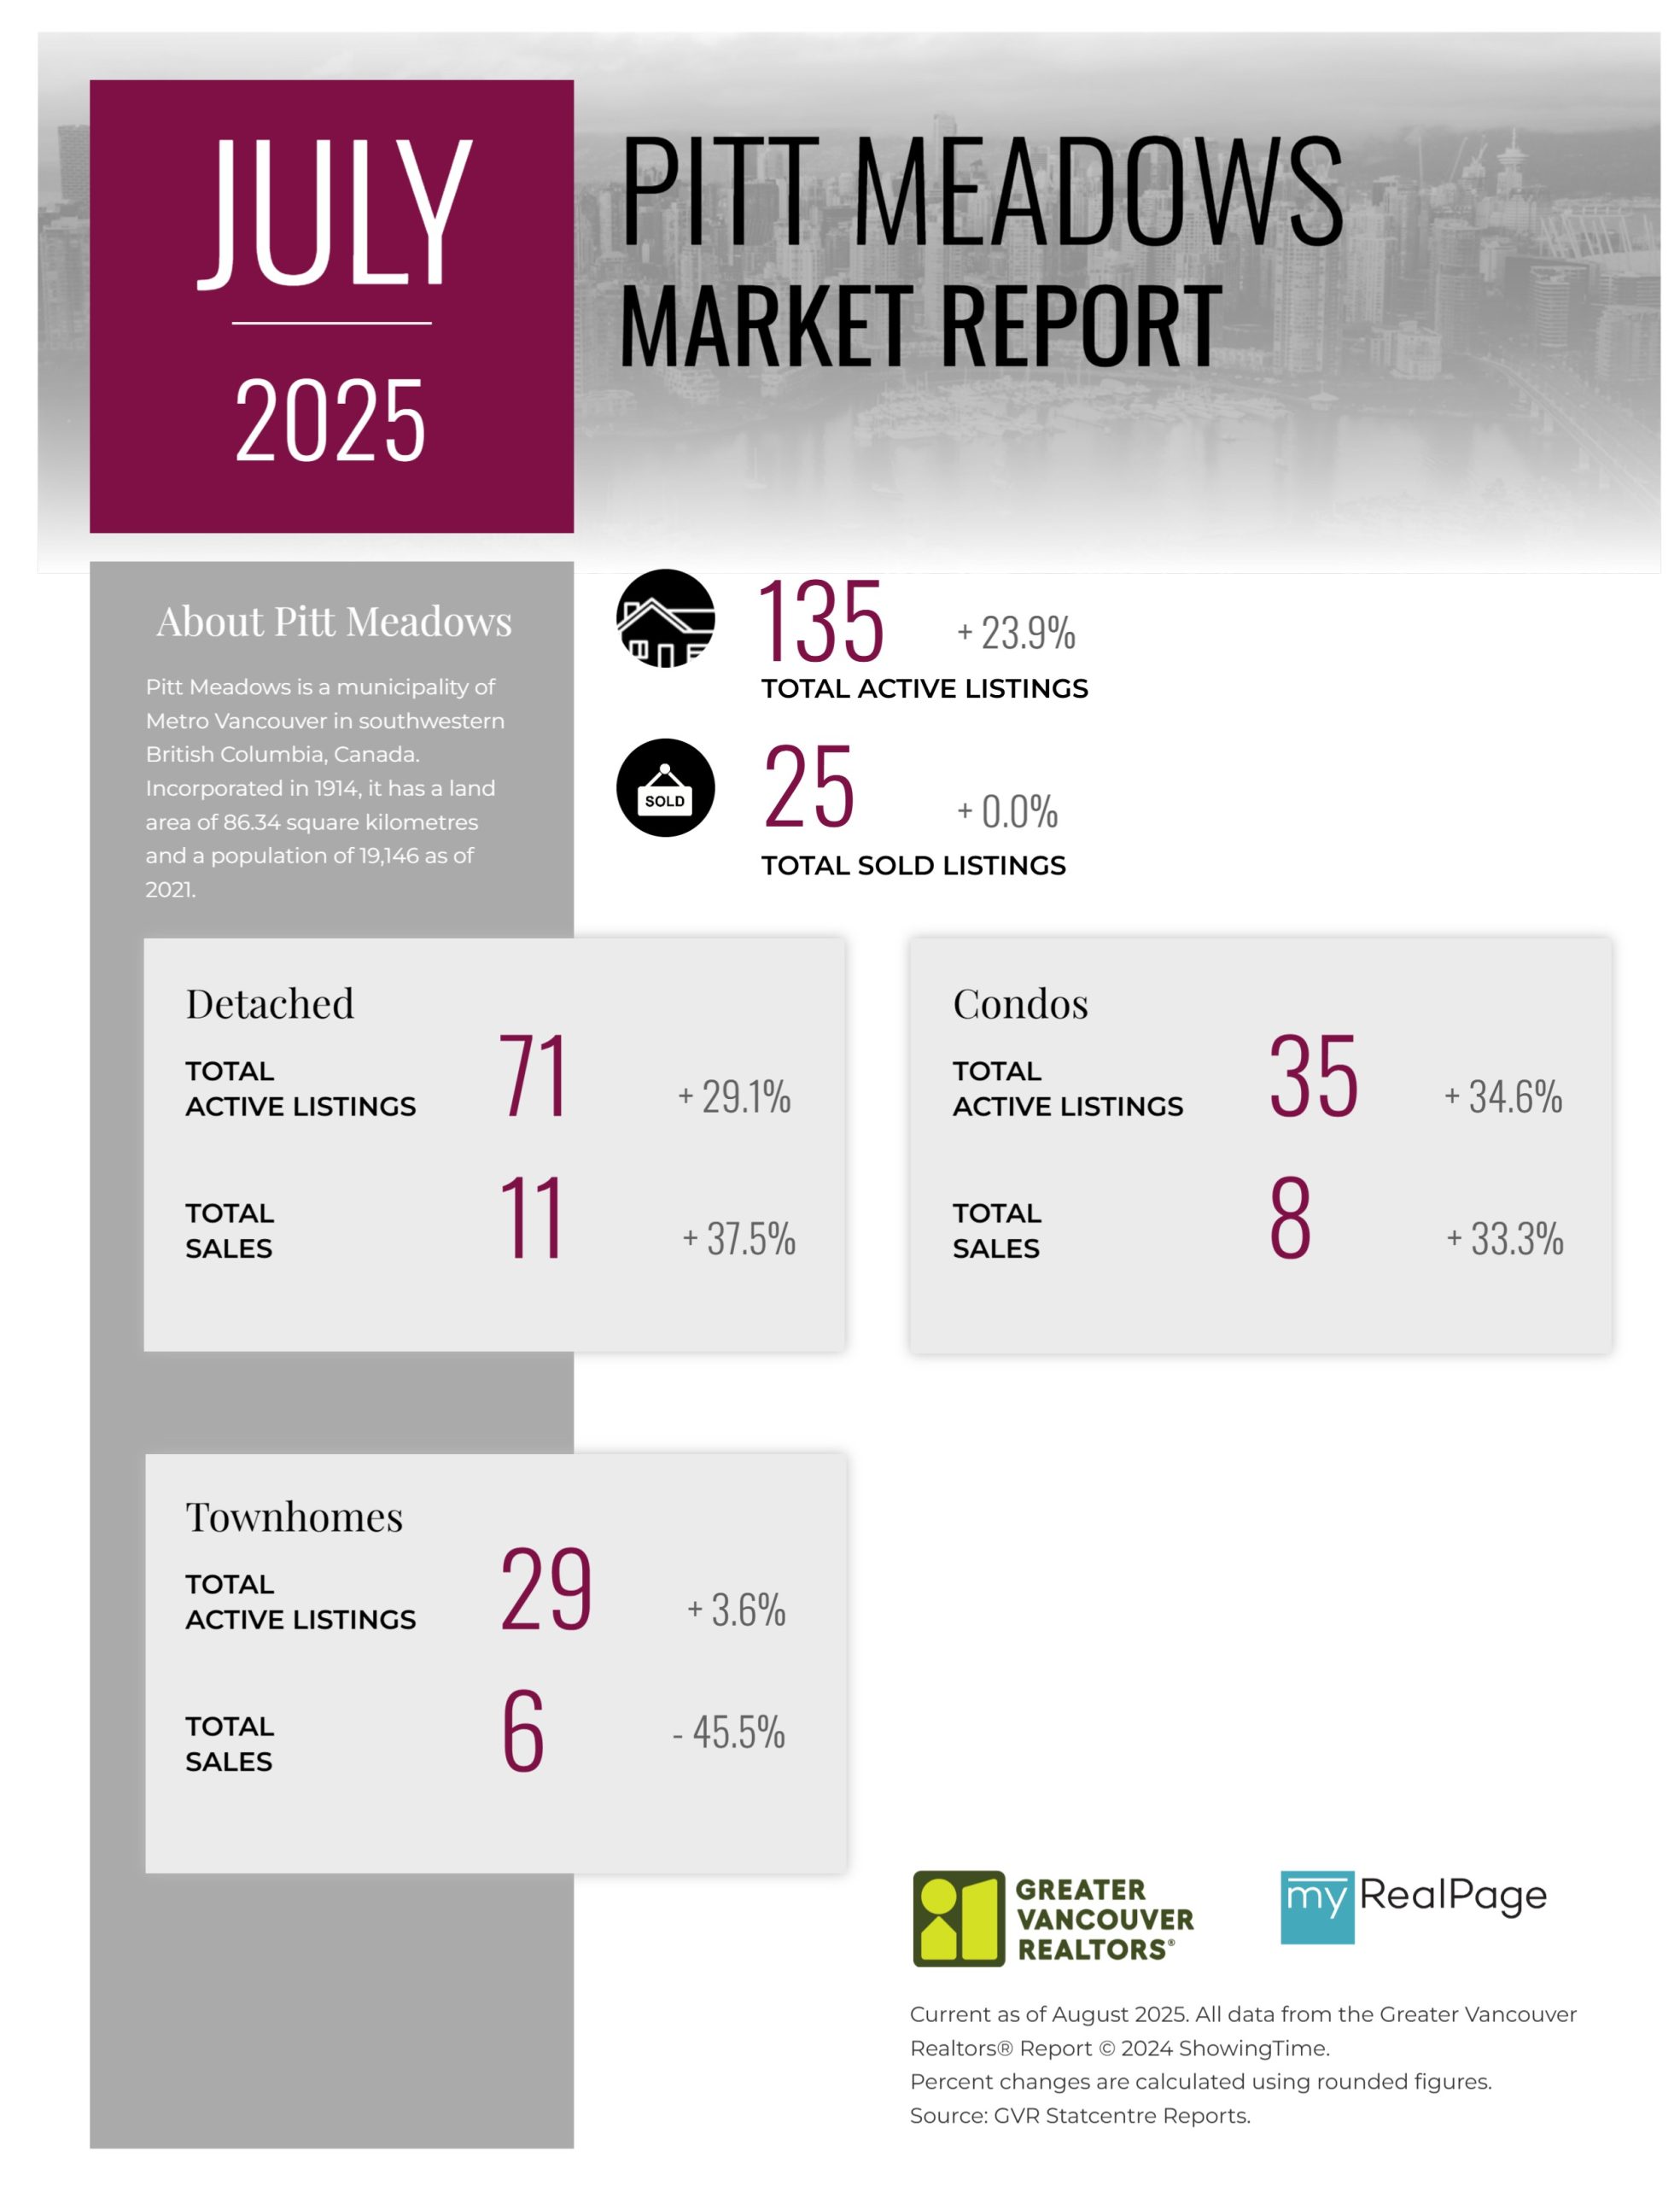
Printable Version – GVR July 2025 Data Infographics Report Pitt Meadows
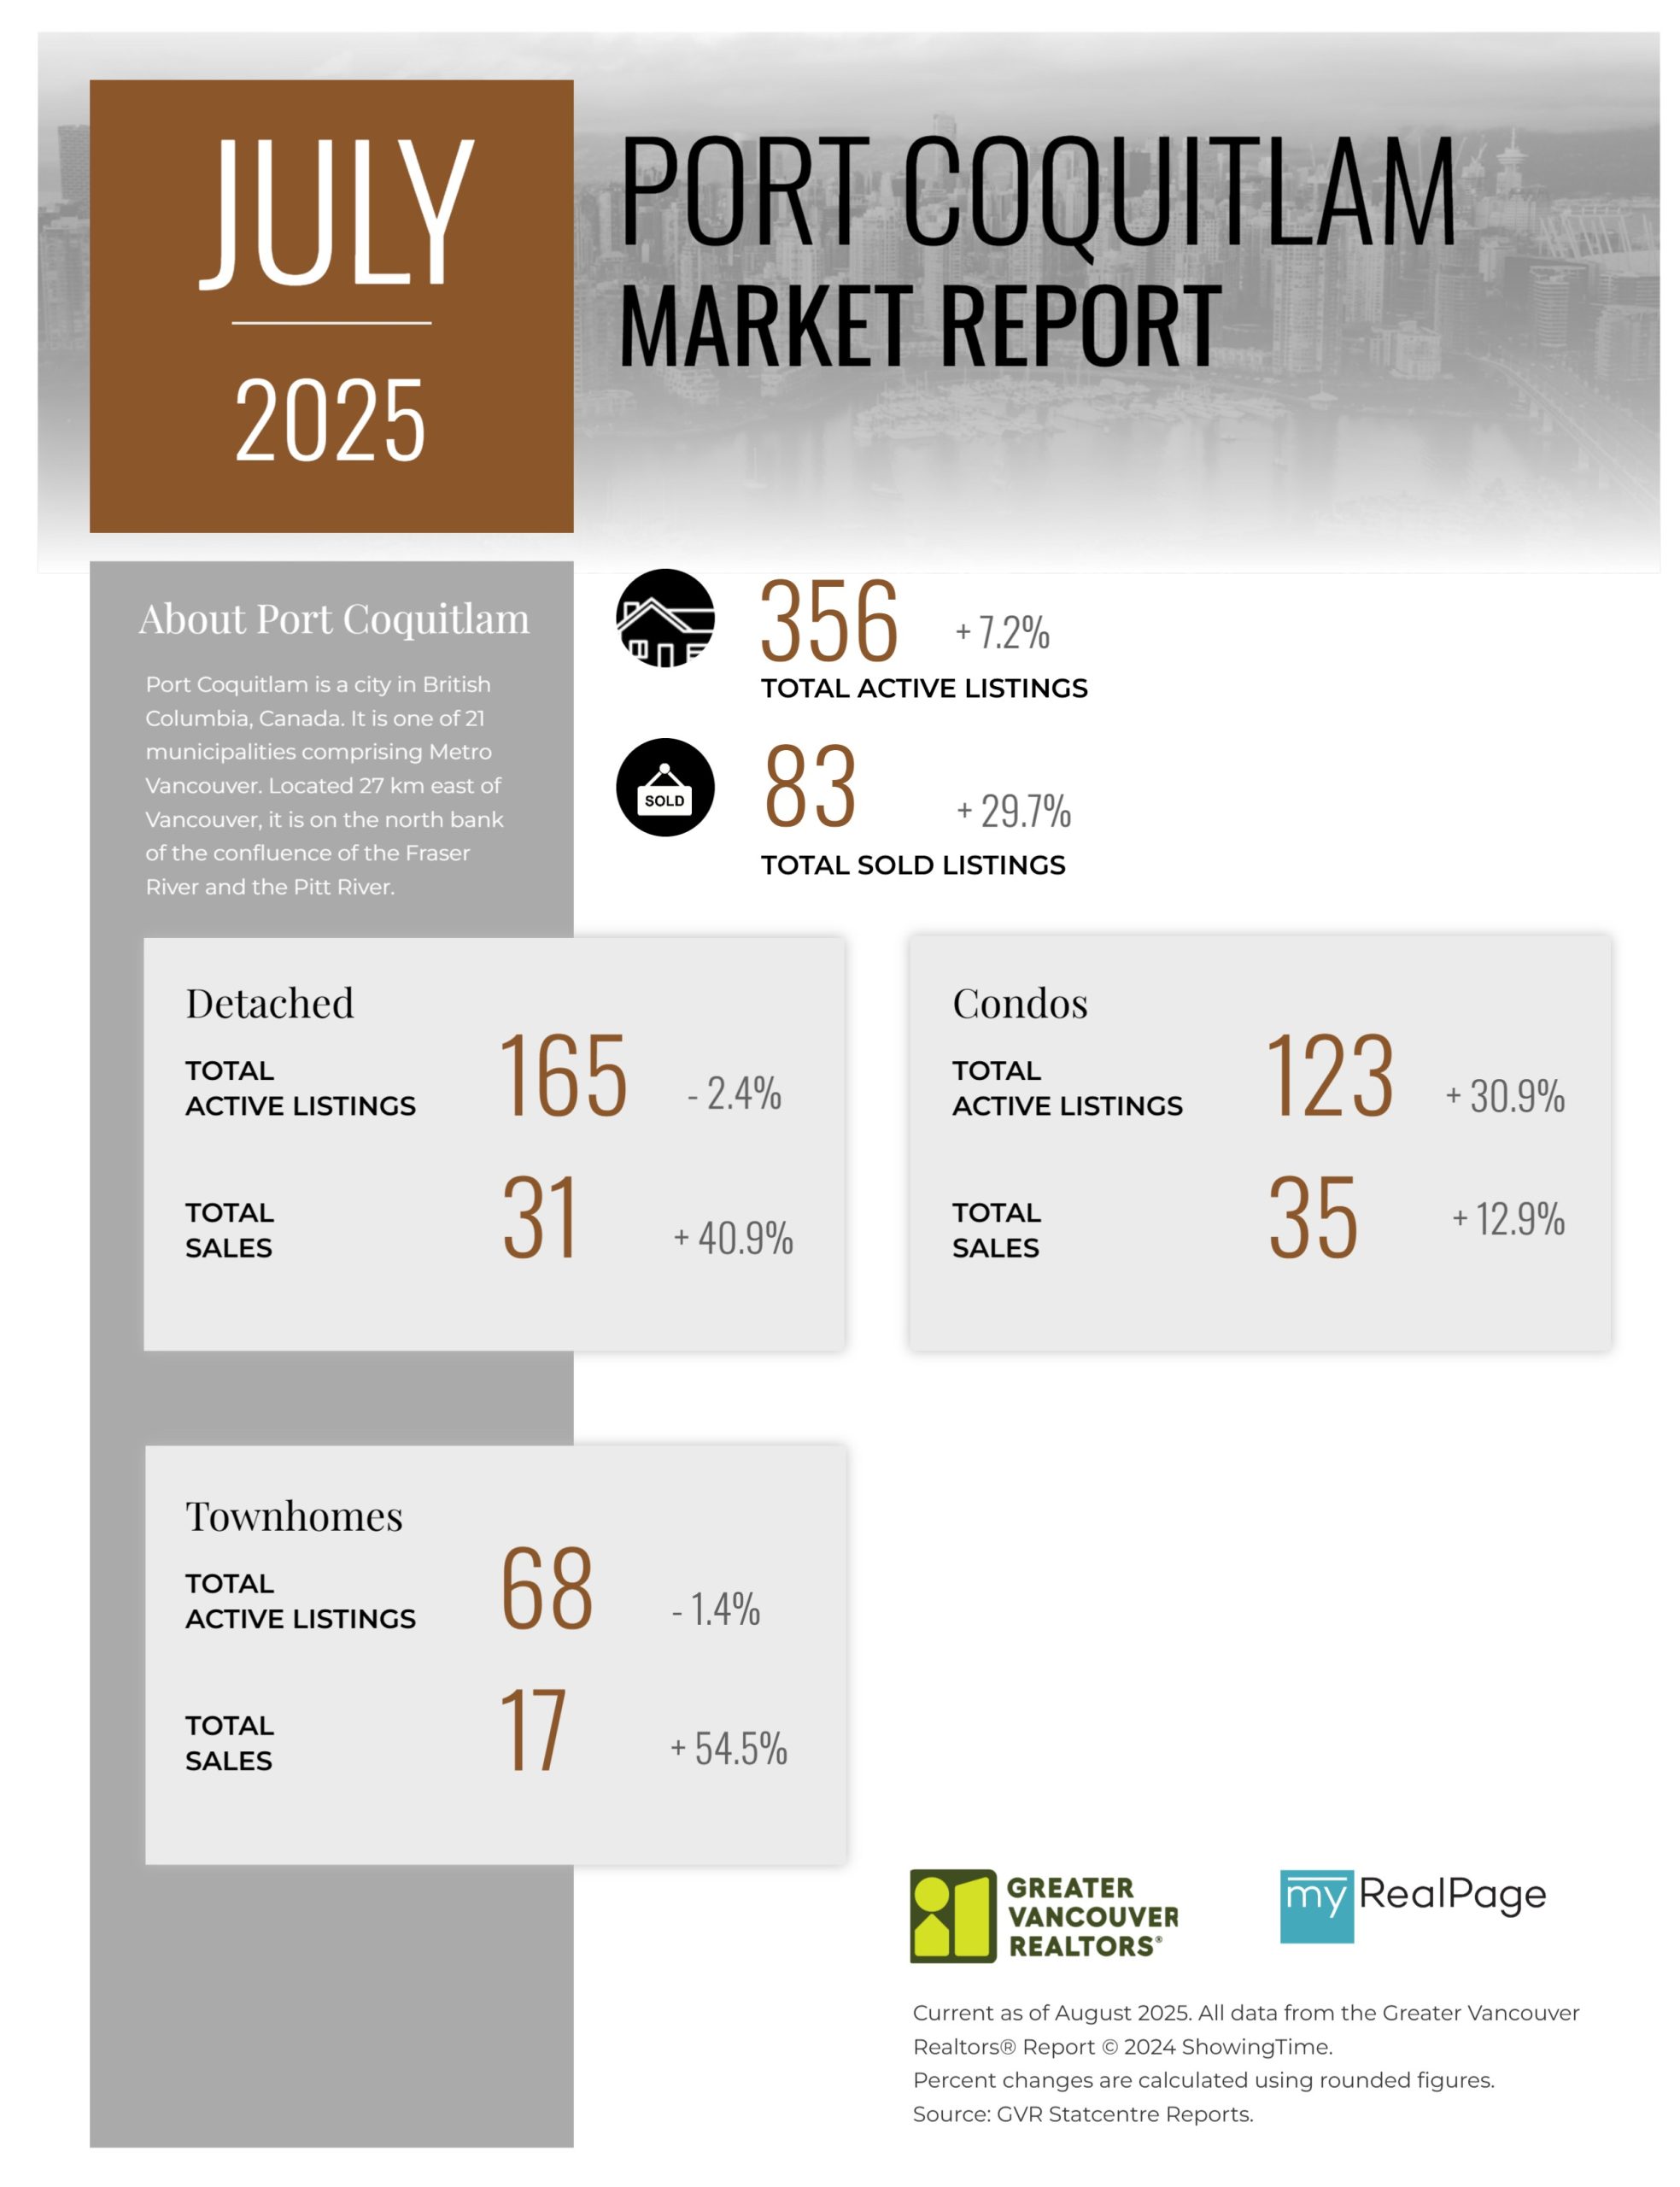
Printable Version – GVR July 2025 Data Infographics Report Port Coquitlam
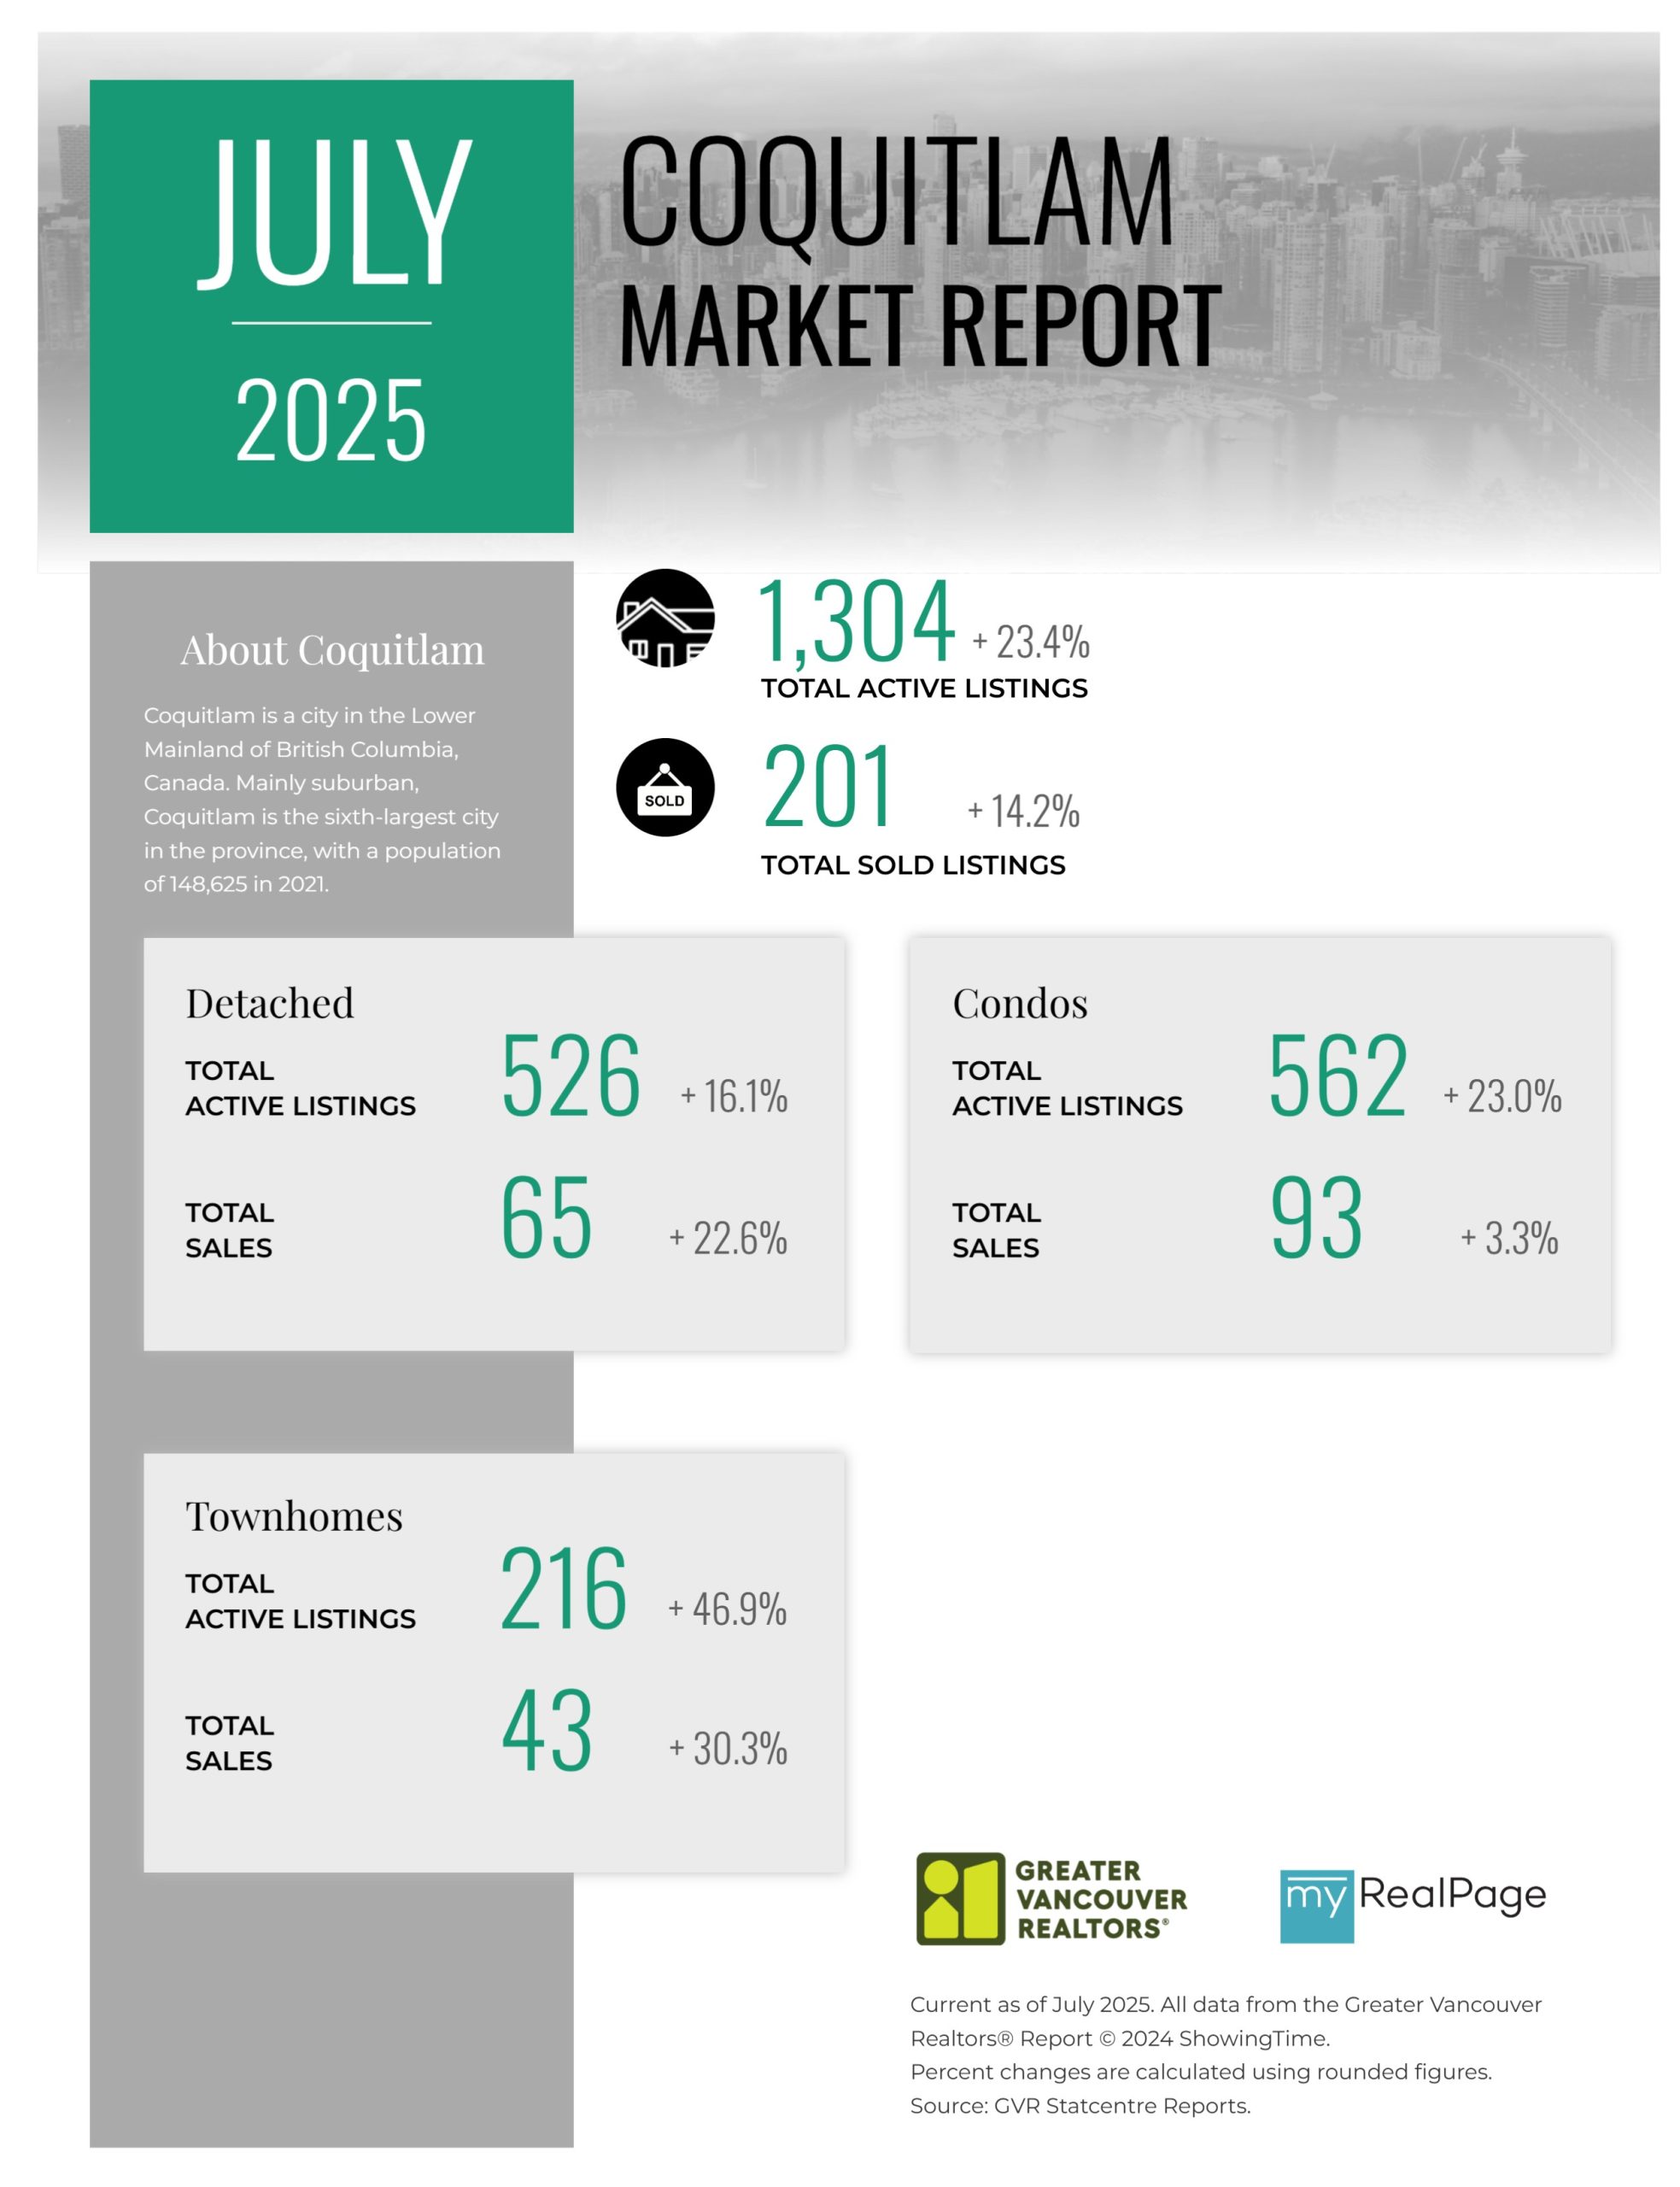
Printable Version – GVR July 2025 Data Infographics Report Coquitlam
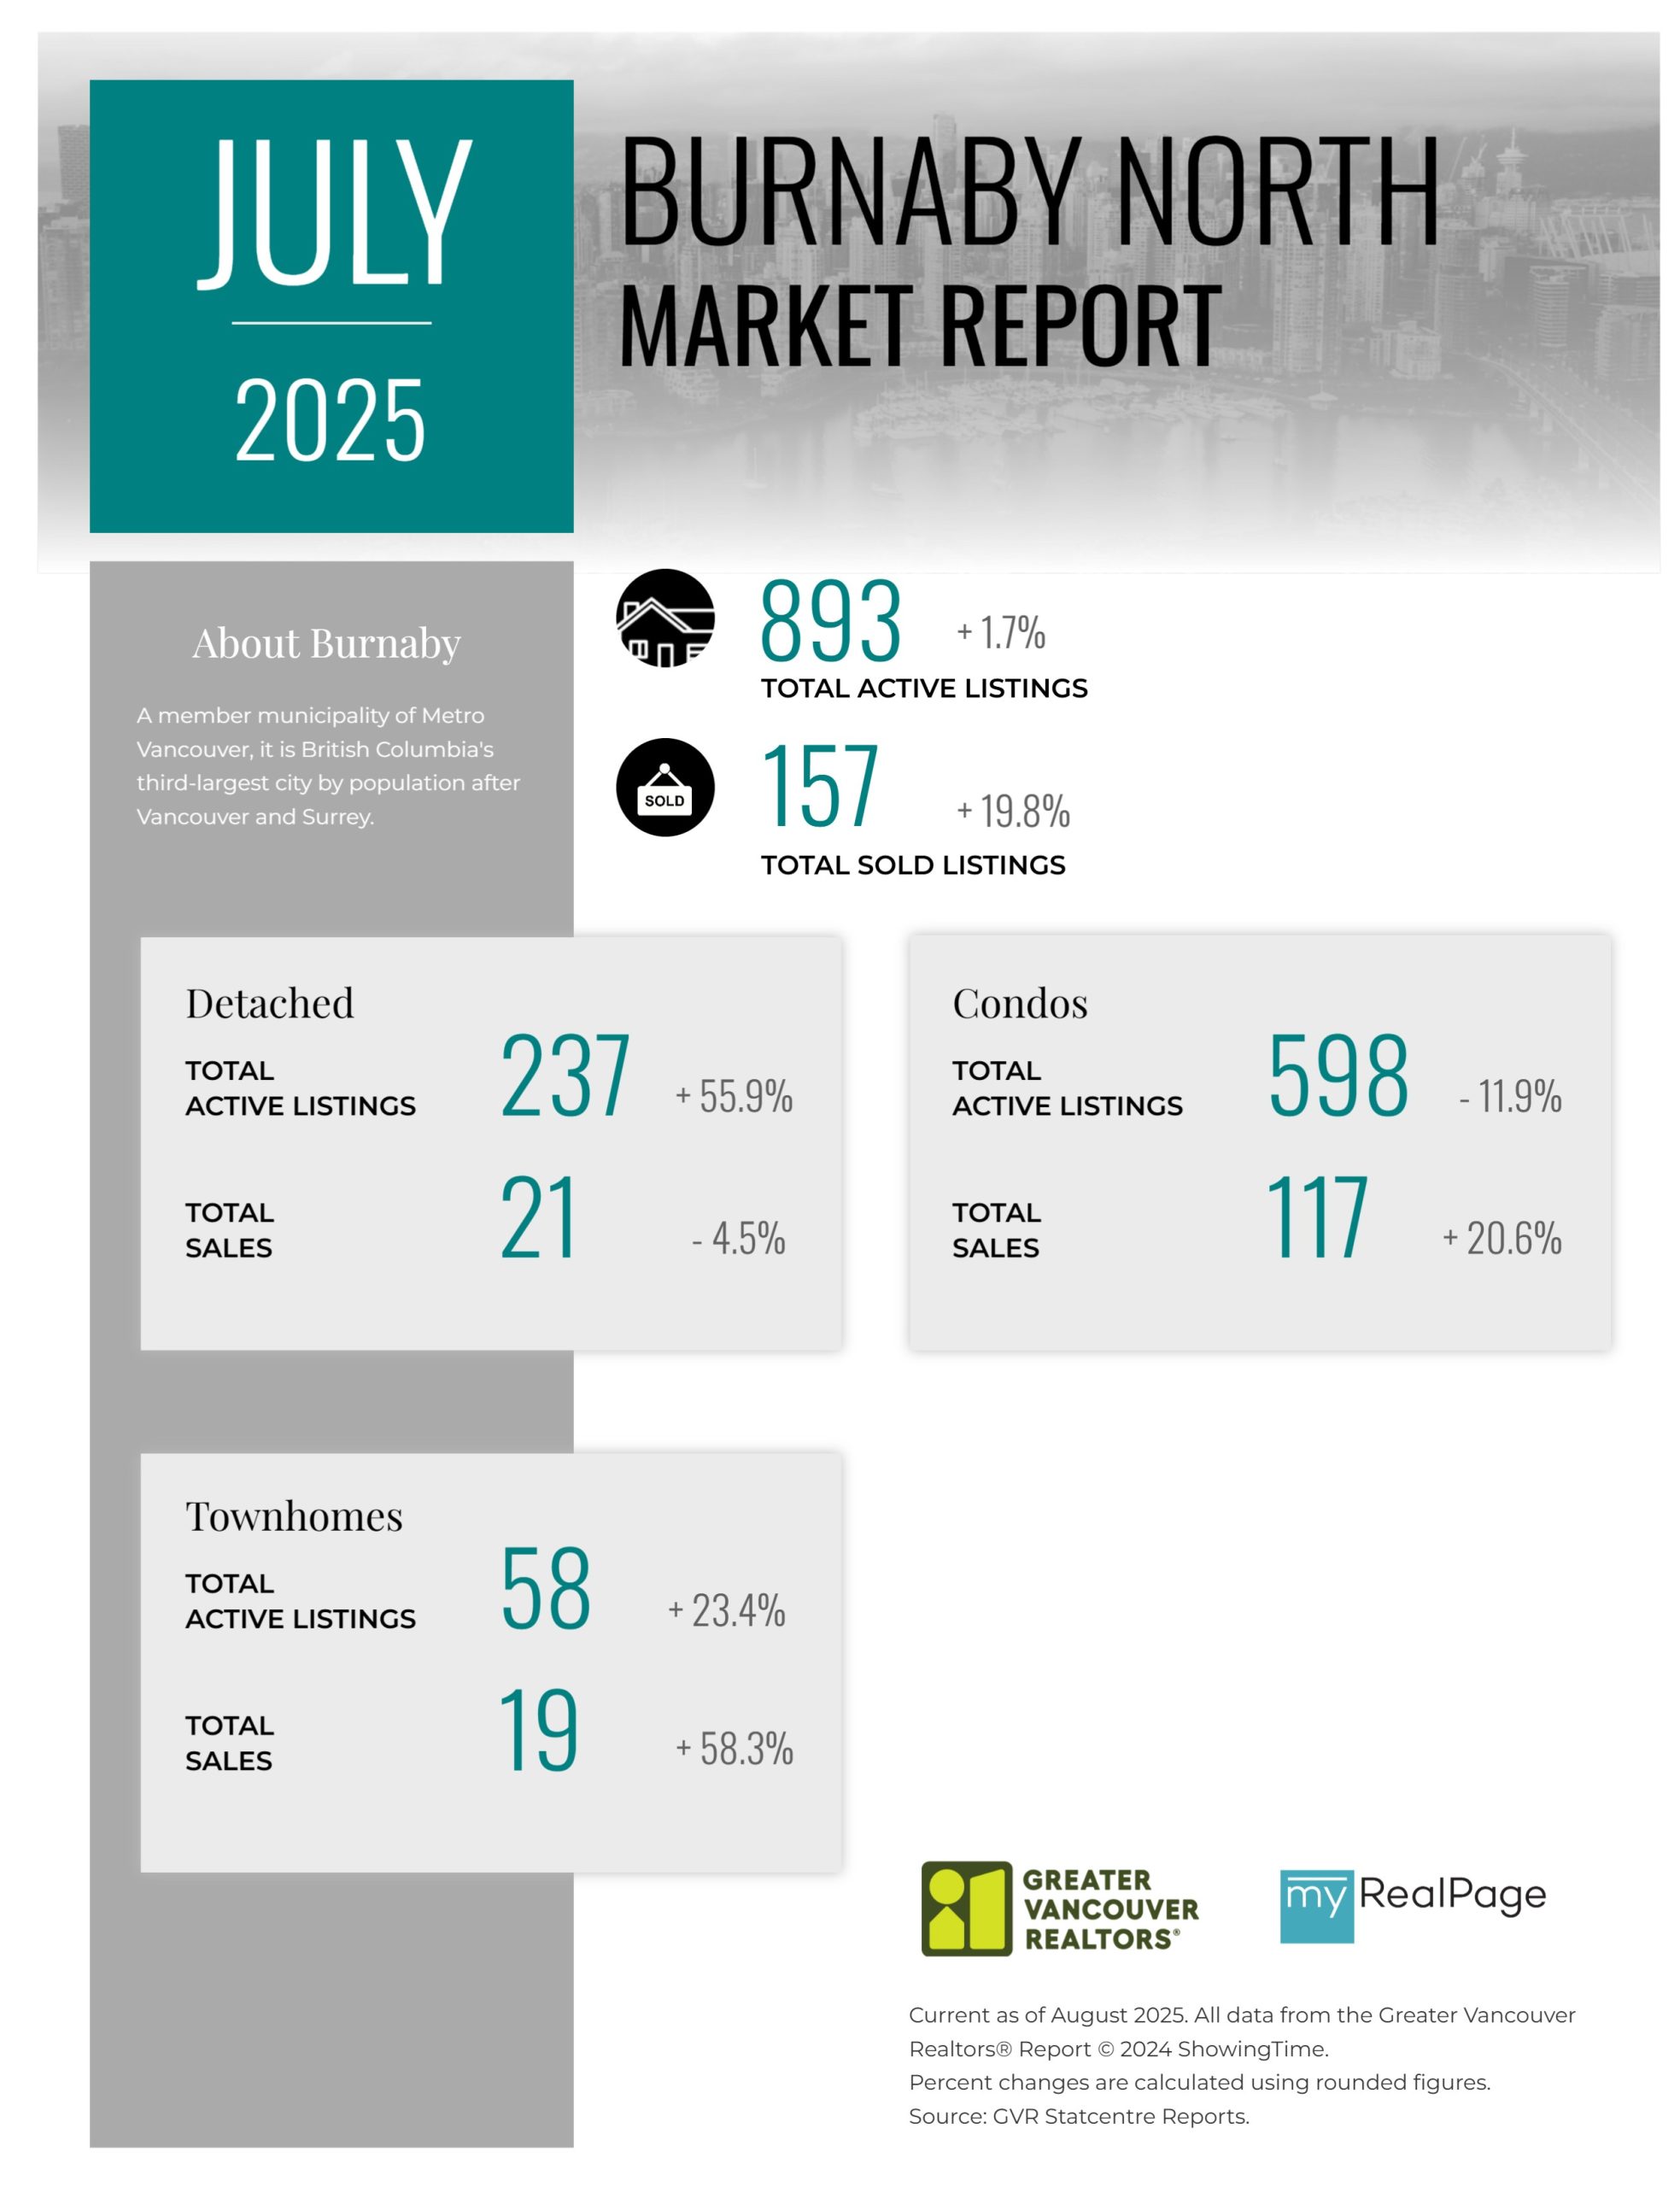
Printable Version – GVR July 2025 Data Infographic Report Burnaby North
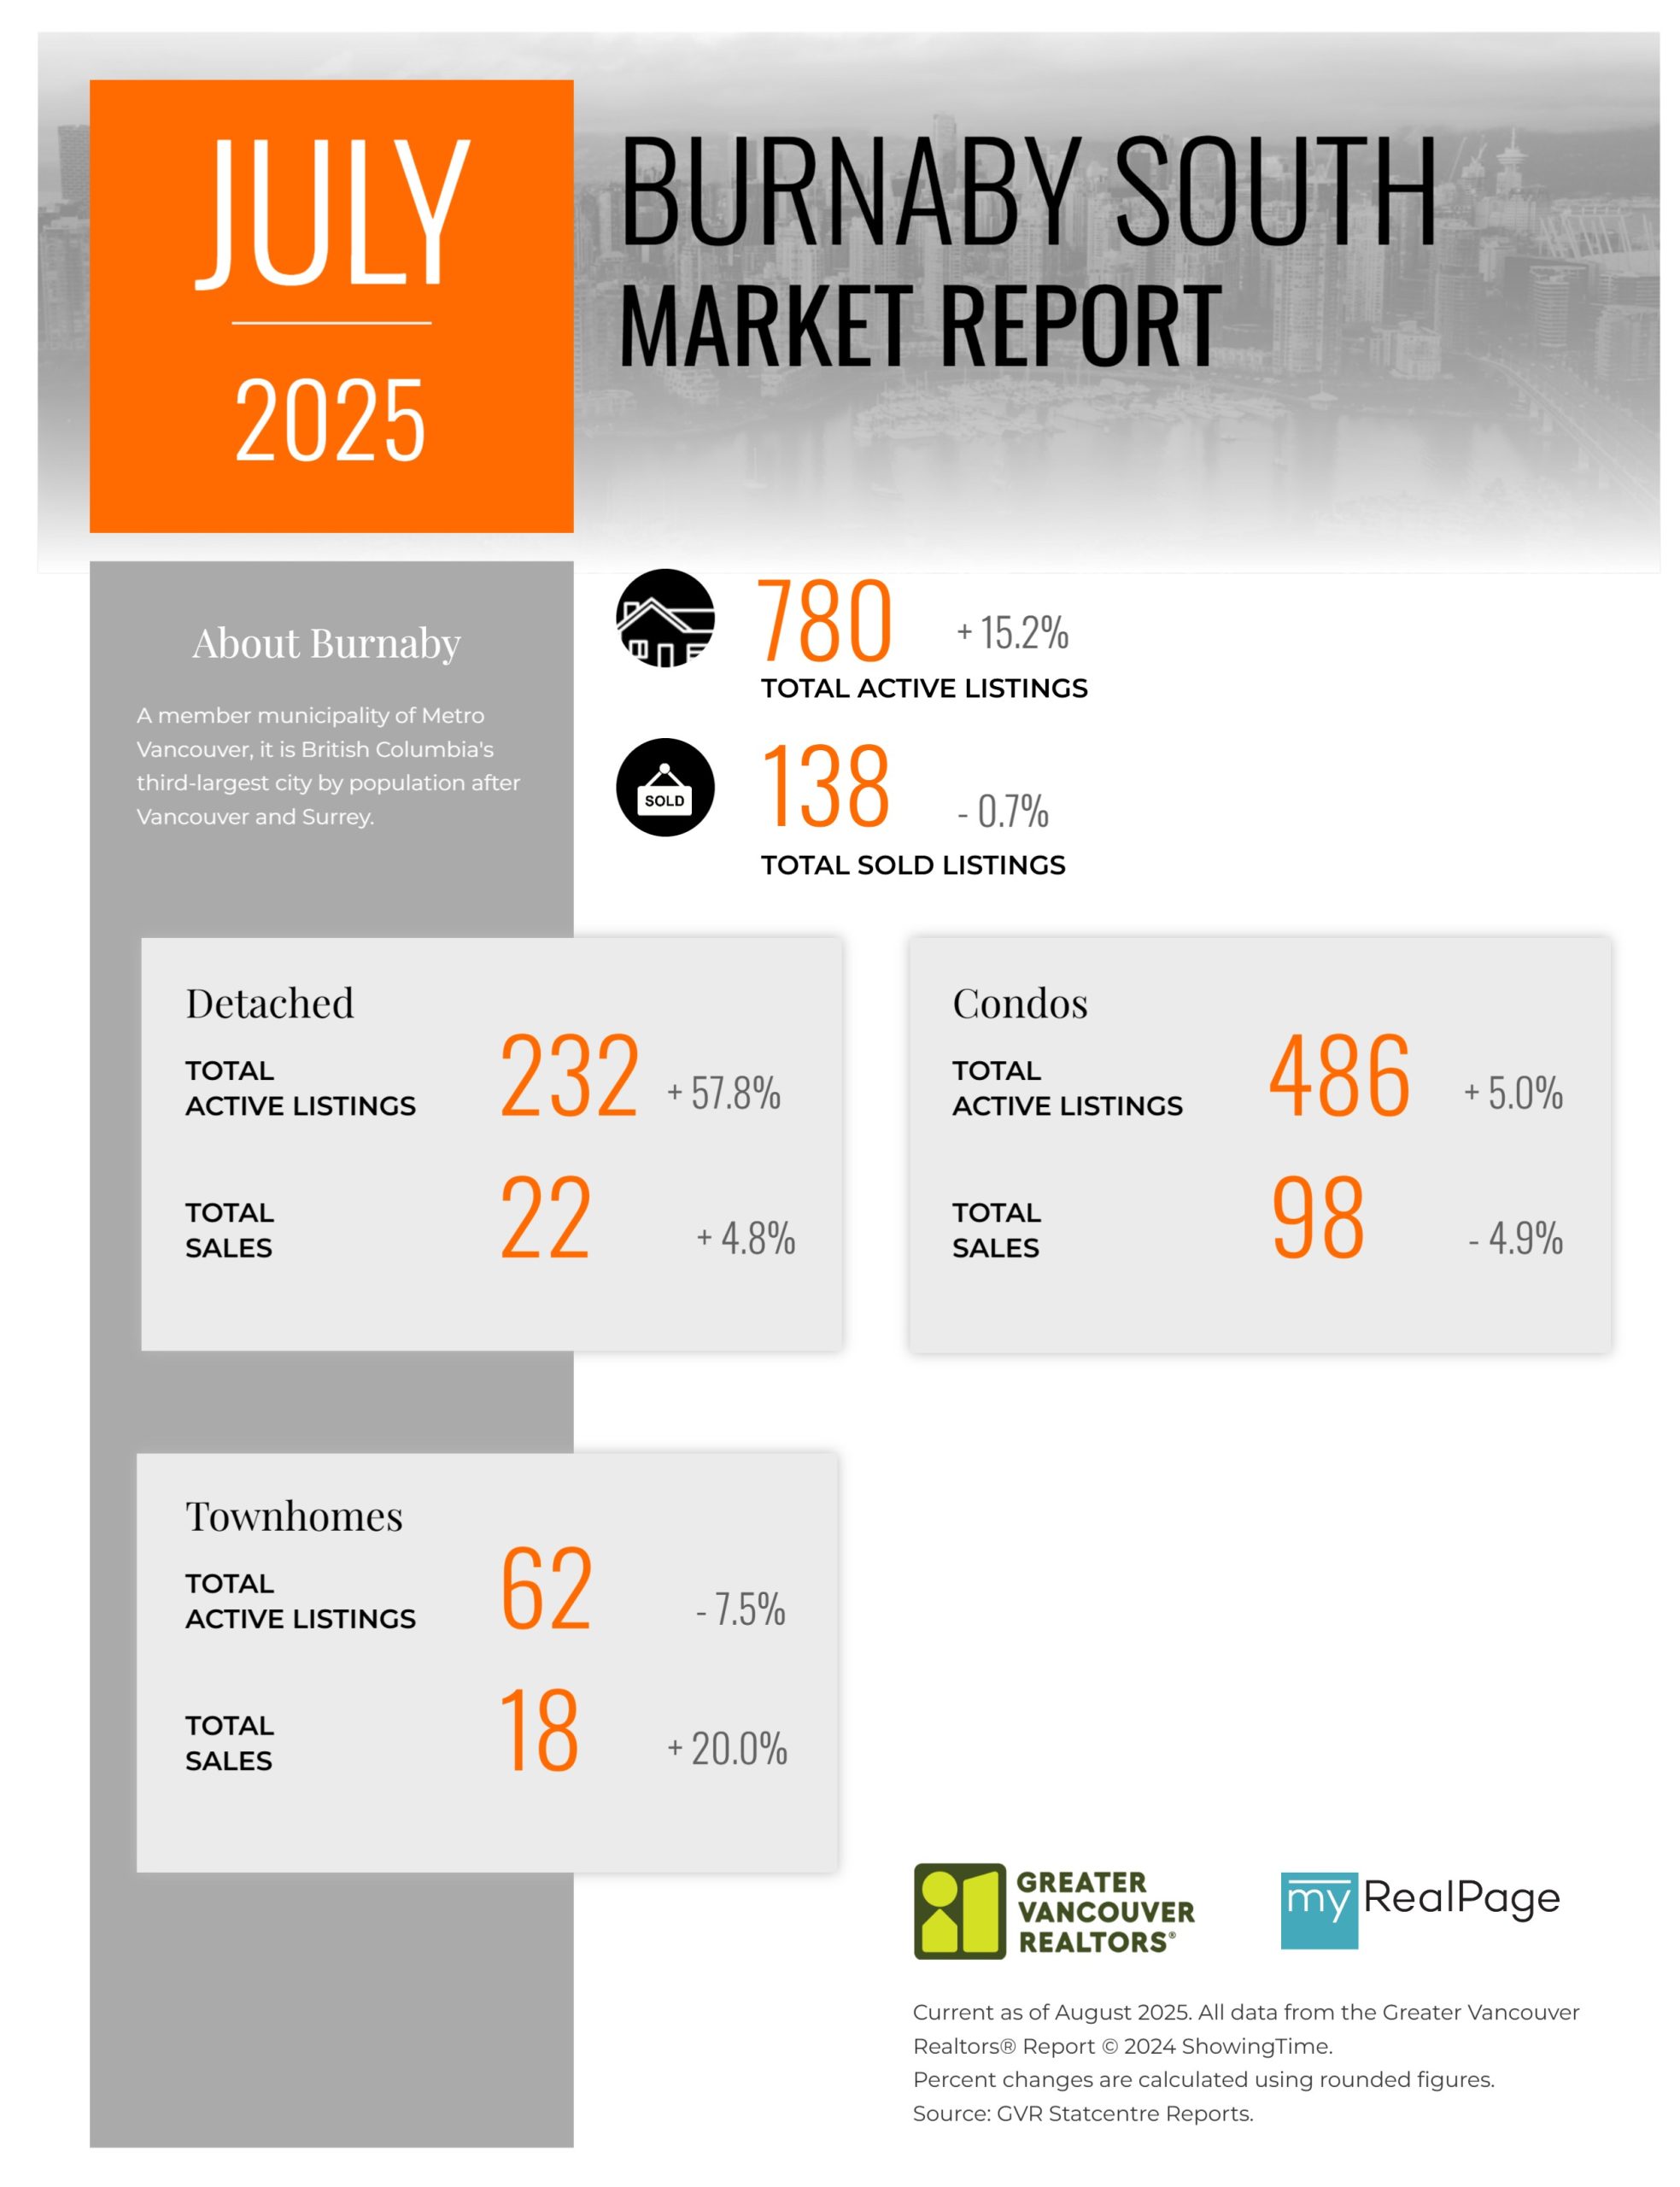
Printable Version – GVR July 2025 Data Infographics Report Burnaby South
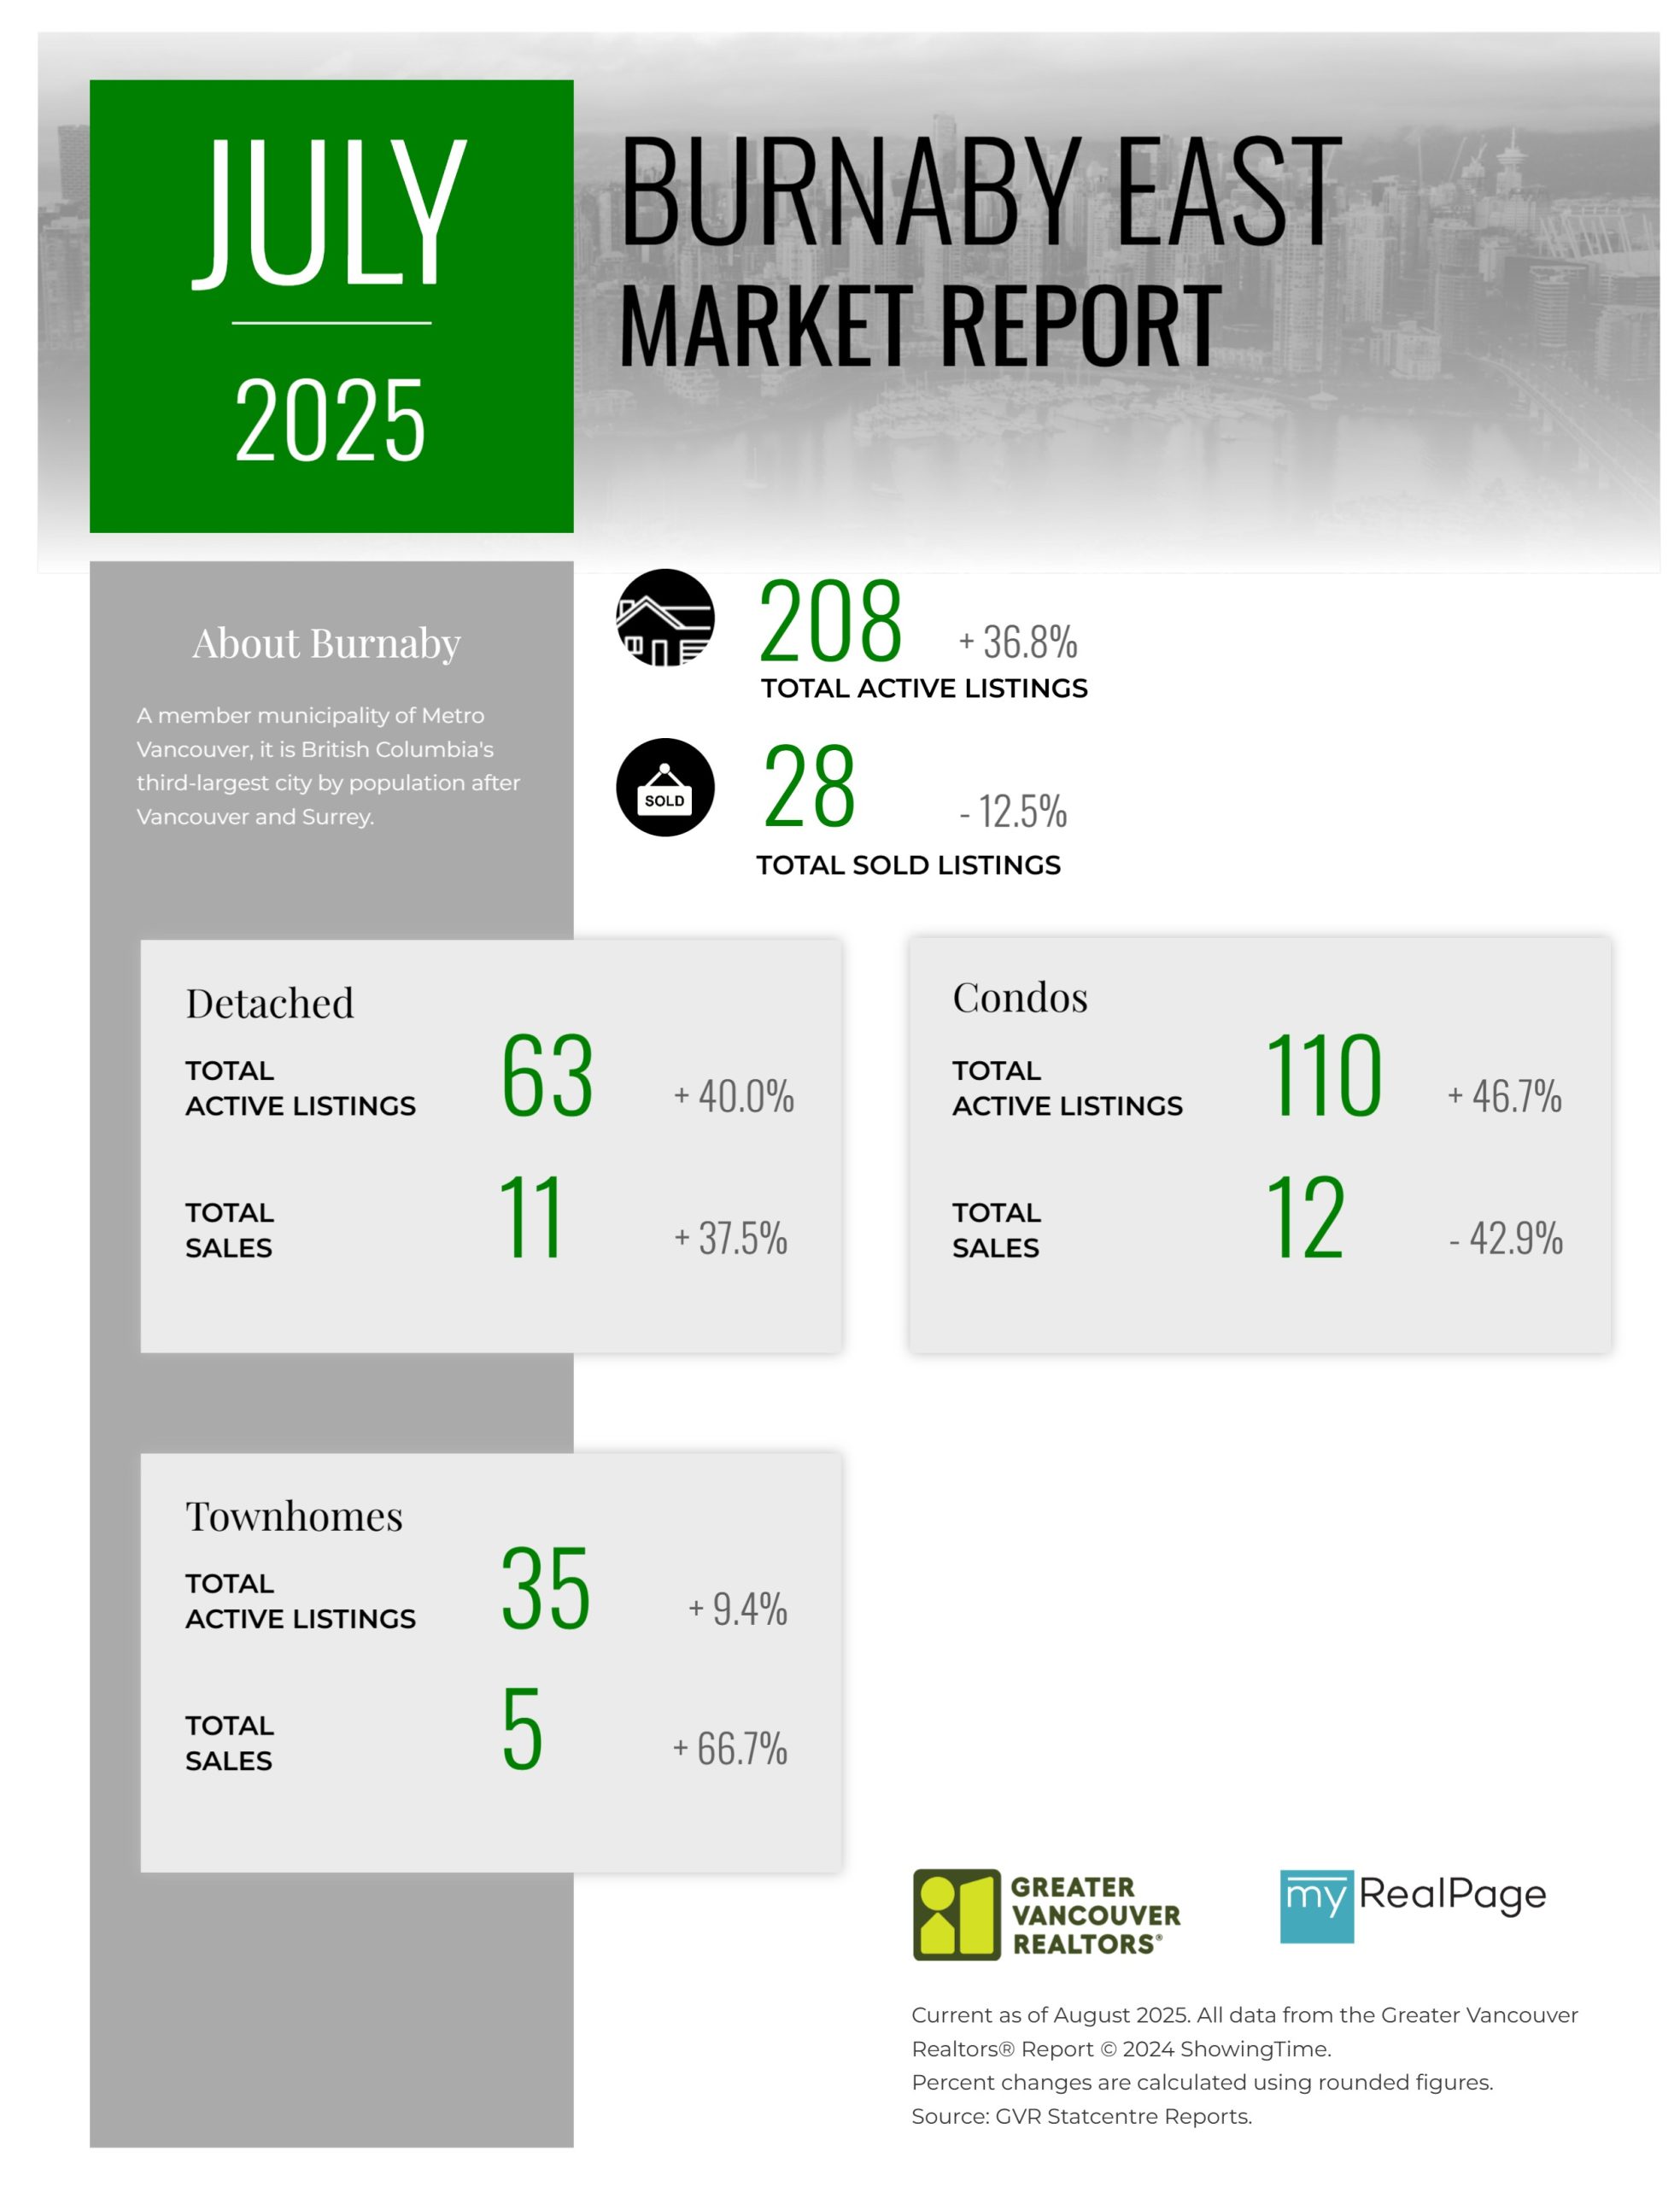
Printable Version – GVR July 2025 Data Infographics Report Burnaby East
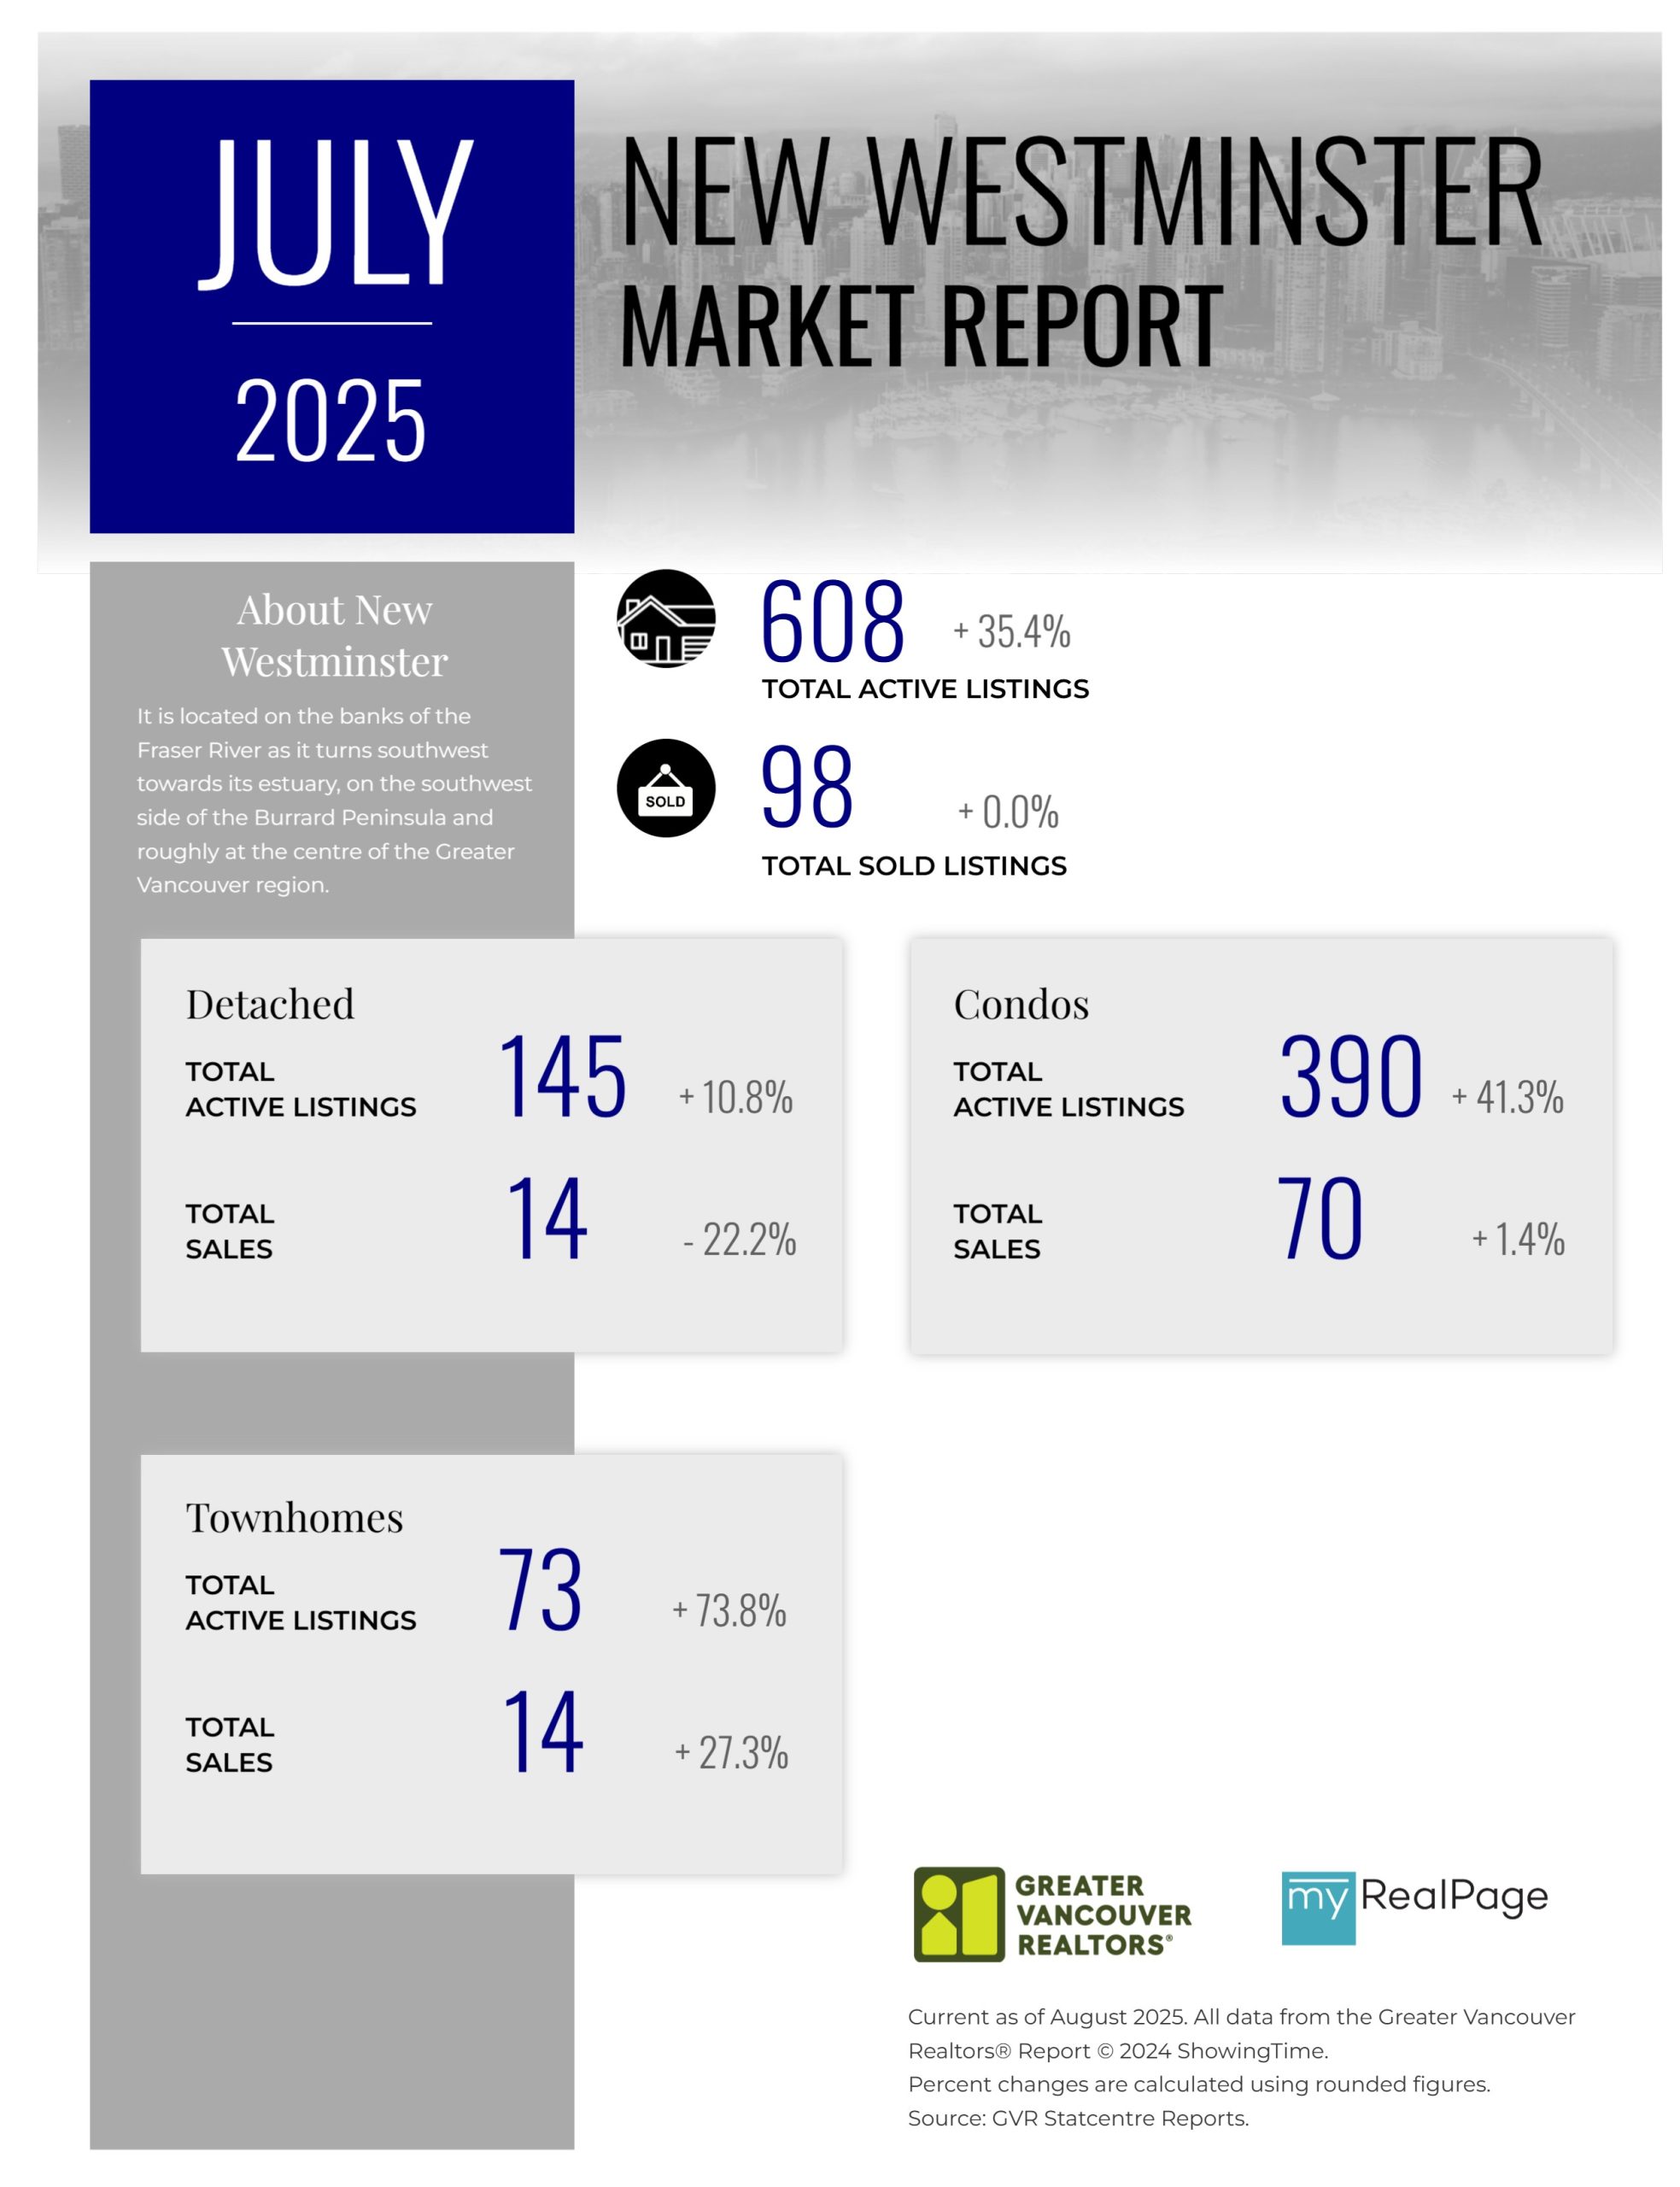
Printable Version – GVR July 2025 Data Infographics Report New Westminster
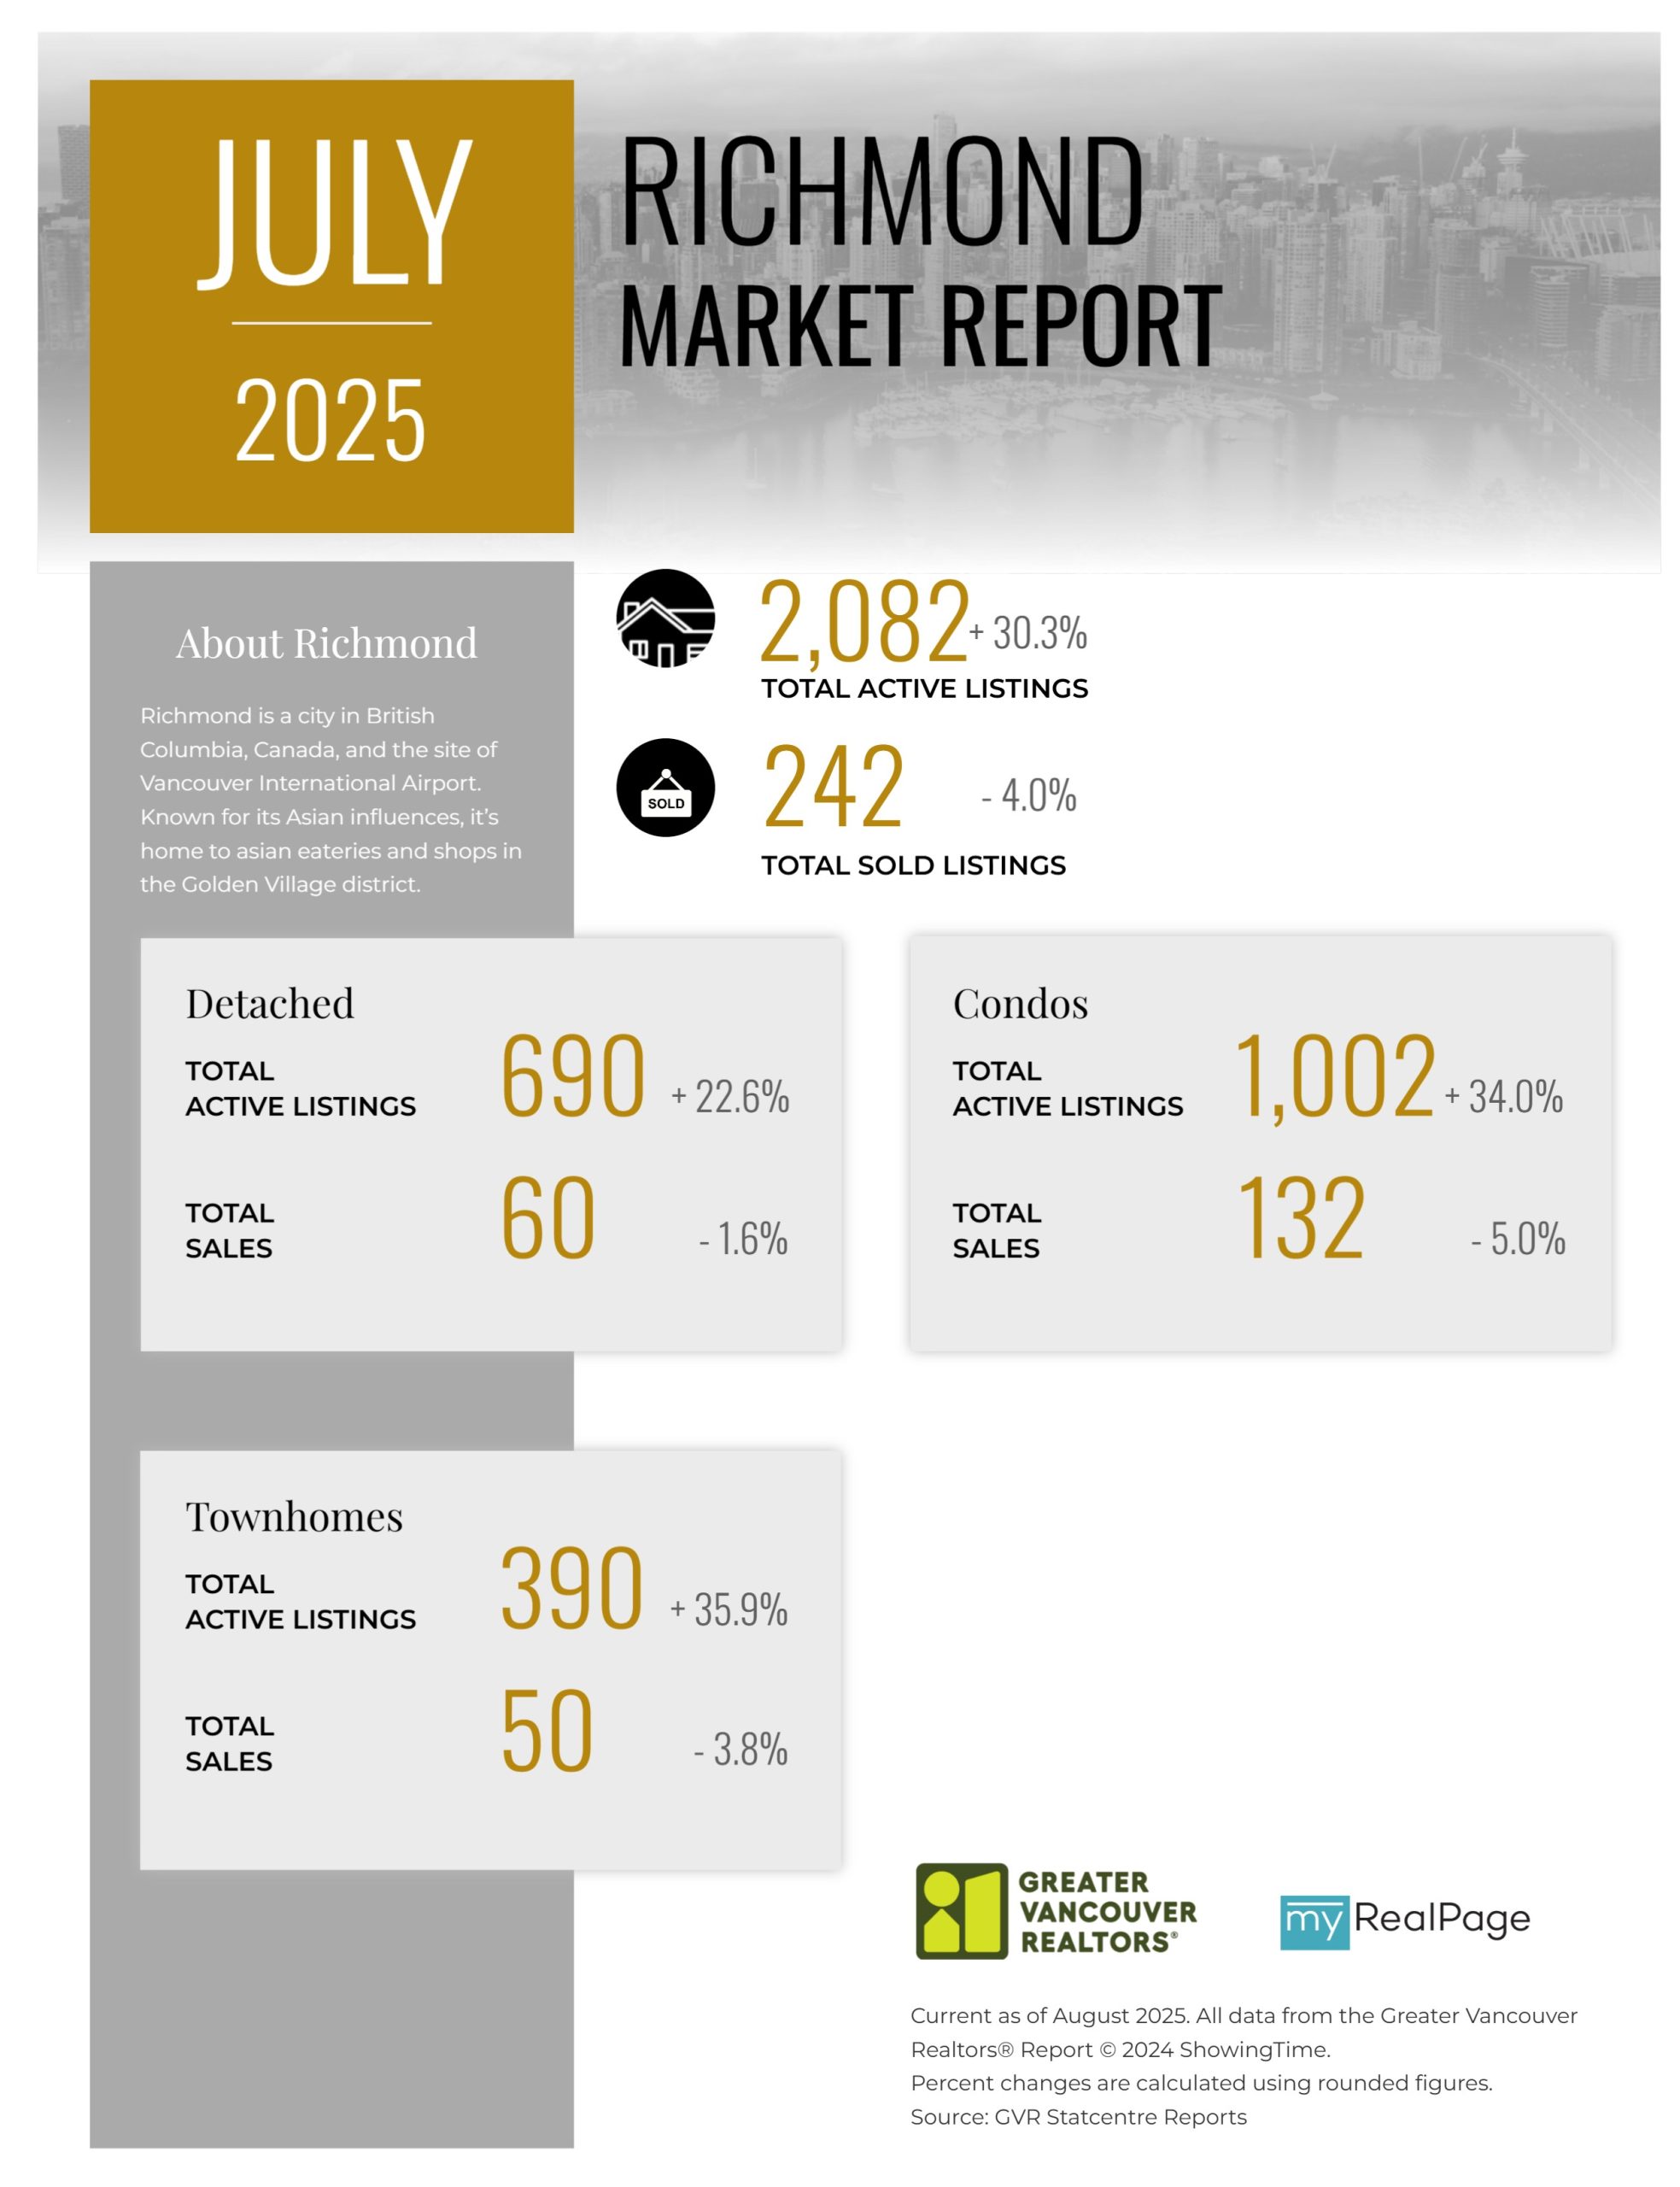
Printable Version – GVR July 2025 Data Infographics Report Richmond
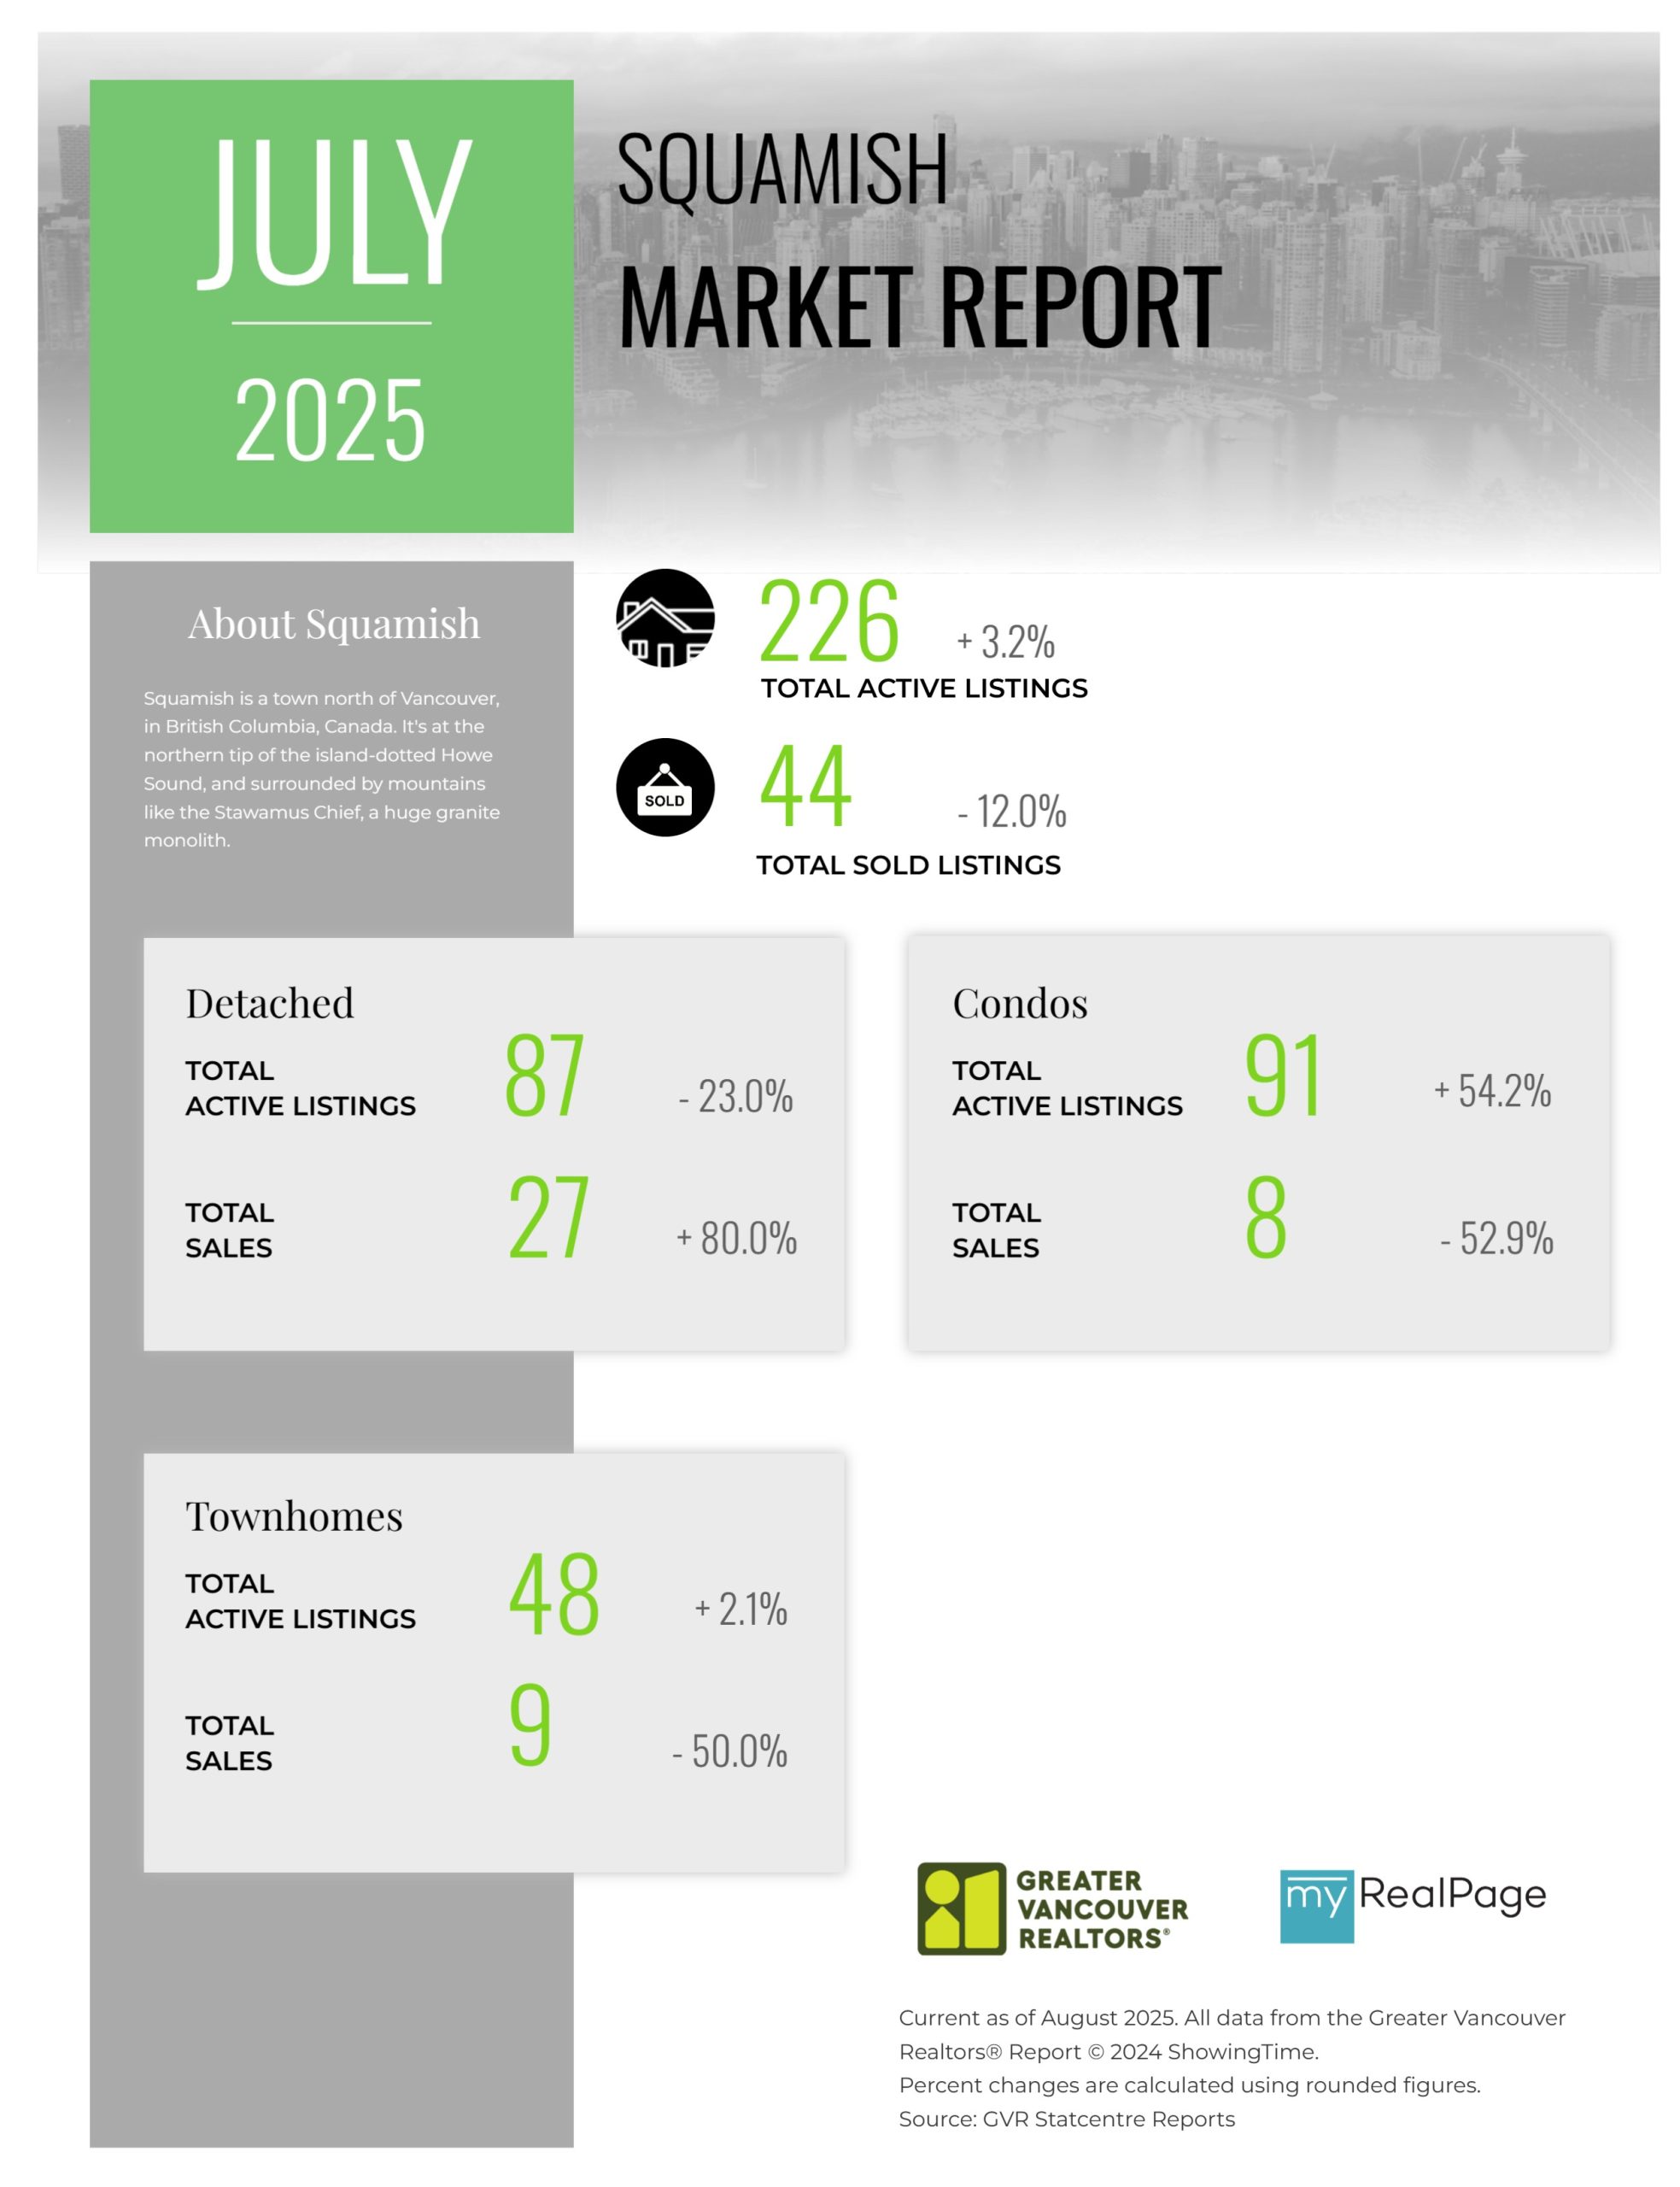
Printable Version – GVR July 2025 Data Infographics Report Squamish
Last Updated on September 8, 2025 by myRealPage
